Embed Size (px)
Citation preview
beverages
Article
Drivers of Acceptance of a New Beverage in Europe
Ana Patricia Silva 1,2,*, Maria Isabel Franco 1, Cissé Mady 3, Dominique Pallet 4, Keith Tomlins 5,Ben Bennett 5, Manuela Pintado 1 and Miguel Sottomayor 6
1 Laboratório Associado, Escola Superior de Biotecnologia, CBQF—Centro de Biotecnologia e Química Fina,Universidade Católica Portuguesa, Rua Arquiteto Lobão Vital, 4202-401 Porto, Portugal;[email protected] (M.I.F.); [email protected] (M.P.)
2 Division of Human Nutrition, Wageningen University, Bomenweg 2, 6703 HD Wageningen,The Netherlands (current affiliation)
3 Laboratoire de Formation, Continue en Industries Agroalimentaires, Département Genie Cimique etBiologie Appliquée, Université Cheikh Anta Diop (UCAD) de Dakar, BP 5085 Dakar-Fann, Senegal;[email protected]
4 Centre de Coopération Internationale en Recherche Agronomique pour le Développement, UMR QualiSud,Food Process Engineering Research Unit, 34398 Montpellier CIRAD, France; [email protected]
5 Natural Resources Institute, University of Greenwich, Chatham, Kent ME4 4TB, UK;[email protected] (K.T.); [email protected] (B.B.)
6 Faculdade de Economia e Gestão da Universidade Católica Portuguesa, Rua Diogo Botelho,1327 4169-005 Porto, Portugal; [email protected]
* Correspondence: [email protected]; Tel.: +351-225-580-001
Academic Editor: Miranda MirosaReceived: 22 April 2016; Accepted: 18 May 2016; Published: 25 May 2016
Abstract: One of the challenges of studying food consumption behavior is to identify the driversof choice for a food product. This is particularly important to design and develop new foods forwhich no previous information is available. Hibiscus sabdariffa L. (Bissap) is an herbaceous plantand an important source of vitamins, minerals, and bioactive compounds, which confer a numberof potential health benefits to derived products. The consumption of Bissap in beverage form iswidespread in Africa and Asia, but not yet in Europe. Therefore, this study aimed to identify the maindrivers of consumer acceptance of a traditional African beverage made from Bissap to which theyhad not been previously exposed. First, three focus groups (n = 22) were performed in Portugal tocharacterize the sensory profile of four Bissap beverages, to reveal perceptions and attitudes towardsBissap beverages, and to identify potential choice attributes. Subsequently, a full-profile conjointanalysis (n = 99) was performed, where consumers evaluated 37 Bissap beverage profiles, aiming toestimate choice attribute importance and to identify relevant market segments. Focus group findingsshowed that consumers would choose Bissap because they perceived as a healthy choice, and dueto its novelty. The conjoint study showed an ideal profile for a Bissap beverage costing †0.99/L,<18 kcal/100 mL, packaged in Tetra-pack, light red color, and containing labeling information aboutantioxidants and Bissap. Four clusters of consumers were identified: price sensitive, body concerned,packaging attracted, and demanding, highlighting the most influential choice attributes: price, calories,and packaging. Findings provide useful guidance for new product development of an Africanproduct in the European lifestyle. Results might be useful from a nutraceutical point of view and tothe food/beverages industry.
Keywords: Bissap; Africa; Portugal; consumer behavior; conjoint analysis; focus groups; segmentation
1. Introduction
Hibiscus sabdariffa L. is an herbaceous plant, cultivated largely in tropical and subtropicalareas of the world and it is known by different names such as Roselle or Bissap among others
Beverages 2016, 2, 12; doi:10.3390/beverages2020012 www.mdpi.com/journal/beverages
Beverages 2016, 2, 12 2 of 14
(Mounigan and Badrie, 2006 [1]; Sáyago-Ayerdi et al., 2007 [2]; Hainida et al., 2008 [3]; Cisse, 2009 [4]).It is cultivated mainly for its calyces for the production of concentrates, jams and particularly forbeverages. There are various recipes for beverage preparation, which can be consumed cold or hot(Sáyago-Ayerdi et al., 2007 [2]; Ramirez-Rodrigues et al., 2011 [5]). The consumption ofHibiscus sabdariffa L. (hereafter referred to as Bissap) in beverage form is widespread in Africa and Asiabut not yet in Europe.
Bissap is an important source of vitamins, minerals, and bioactive compounds, such as organic acids,phytosterols, and polyphenols, some of them with antioxidant properties (Sáyago-Ayerdi et al., 2007 [2]).It is well known that these components are highly valued by the food industry because of their potentialhealth benefits. Some pharmacological studies have been carried out with Hibiscus flowers, petals,and seeds, and several health benefits were identified such as cardio protective action, antihypertensive action,effectiveness against low-density lipoprotein oxidation, and hyperlipidaemia (Sáyago-Ayerdi et al.,2007 [2]; Hainida et al., 2008 [3]). Accordingly, the Bissap beverage might be classified as a functionalbeverage in the nutraceutical classification, as an herbal beverage or nutrition enhanced tea (FunctionalFood and Drinks, 2007 [6]). Sensorily, it is characterized by being astringent and strongly fruity(Bechoff et al., 2014 [7]).
How consumers evaluate their choices is affected by a complex set of factors that influence andshape decision process behavior (Blackwell et al., 2006 [8]). It has already been demonstrated that thechemical composition of Bissap beverages was related to sensory evaluation and acceptance of Africanand European consumers; in particular the anthocyanin content and Hibiscus taste. Three types ofconsumer behavior were identified being those who preferred syrup, those who preferred infusions,and those who preferred both. Each of these different groups of consumers the chemicals associatedwith acceptance differed; for example, acceptance of syrup likers was positively correlated to sweettaste, reducing sugar content and inversely correlated to acidic taste and titratable acidity while forinfusion likers it was positively correlated to the taste of Hibiscus beverage and anthocyanin content(Bechoff et al., 2014 [7]).
Research on functional foods showed that health benefits and price are important drivers forpurchase (Sparke and Menrad, 2009 [9]). Nevertheless, specifically for functional beverages, it has beenshown that taste is the main motivating factor for consumption and not the health benefits (Sabbe et al.,2009 [10], Vidigal et al., 2011 [11]), although the perceived importance of food for health has increasedsignificantly (Verbeke, 2006 [12]). According to a report on Functional Food and Drinks (FFD, 2007 [6])the functional food market is characterized by three segments of consumers: (i) consumers for whomtaste and convenience are fundamental, and health and nutritional benefits of secondary concern;(ii) health generalist consumers, who are regular purchasers of functional foods; (iii) medically drivenpurchasers, mostly comprising a population aged between 45 and 65 years. More recently, Grunert(2011) [13] reported four major dimensions of food quality for consumer acceptance of functionalfoods: taste and other sensory characteristics, healthiness, convenience and naturalness.
Along the same lines, it seems important to determine the drivers of acceptability of the Bissapbeverage, a functional beverage according to its composition, in a European context, specifically inPortugal. Bissap is still an unfamiliar flavor in the European context, so, every effort needs to be madeto support Bissap product development. Results on the identification of the major acceptance driversof a Bissap beverage in Europe might be particularly interesting to the food industry, the nutraceuticalindustry and consumers in general. The development of a Bissap industry based on smallholderproduction in countries such as Senegal could be an important source of future income generation.
This study was performed with Portuguese consumers based on two stage methodology. Firstly, aqualitative study using focus groups aimed to: gain knowledge on the sensory general characterizationof different types of Bissap beverage, and to determine the relevant choice attributes, possible occasionsof consumption and usage for this kind of beverage. Secondly, a quantitative study using a conjointanalysis aimed to measure the importance of the salient consumer choice attributes of a Bissap beverage,and to reveal consumer segments with common preference profiles. Conjoint analysis is a powerful
Beverages 2016, 2, 12 3 of 14
tool in modelling human decision making, as it enables the quantification of the weight consumersattach to various attributes when making their choice, predicting which products they will prefer, andenabling identification of distinct groups of consumers (Austin, 2000 [14]).
2. Materials and Methods
2.1. Research Ethics
The study was conducted in accordance with the Declaration of Helsinki, and the protocol wasapproved by project AFTER’s Ethics Committee (project code 245025). Prior to the study, participantswere informed about the aim of the study and procedures for handling personal data. In addition,they signed an informed consent, in which their voluntary participation was explicitly stated and alsothat they could withdraw from the study at any time. All tested samples were produced and preparedaccording to good hygiene and manufacturing practices.
2.2. Qualitative Study–Focus Groups
This first step aimed to collect evidence on consumer perceptions and attitudes towards a Bissapbeverage. Data were collected through three focus group discussions, conducted according to standardprocedures, using a script consistent with the above purpose for this research stage, and was video andtape recorded (Morgan, 1997 [15]). The themes surveyed throughout the focus groups are presented inTable 1.
Table 1. Topics addressed in focus group.
Topics Addressed in the Focus Group
1. Sensory characterisation of Bissap beverage samples2. Attitude to purchase3. Occasions and places for consumption4. Motivations for consumption5. Willingness to pay6. Places for purchase7. Possible applications/usage8. Influence of the African origin expressed on label
A pilot focus group was performed first to test the script which resulted in few adjustments tothe script original version. Three focus groups (90–100 min) were then performed with 22 volunteersrecruited in Catholic University. The recruitment criteria included two mandatory conditions: beingfruit juice consumers and the persons responsible for the household groceries shopping. The participantprofiles are presented in Table 2.
Table 2. Socio-demographic profile of the participants of the focus groups.
Socio-Demographics % of Participants
Male 46%Female 54%Age 18–25 36%Age 26–55 36%Age > 55 27%Single 41%Married 59%Higher education 55%Secondary education 45%Upper middle class * 14%Middle class * 36%
Beverages 2016, 2, 12 4 of 14
Table 2. Cont.
Socio-Demographics % of Participants
Lower middle class * 23%Skilled workers * 23%Unskilled workers * 5%
* According to ESOMAR classification [16].
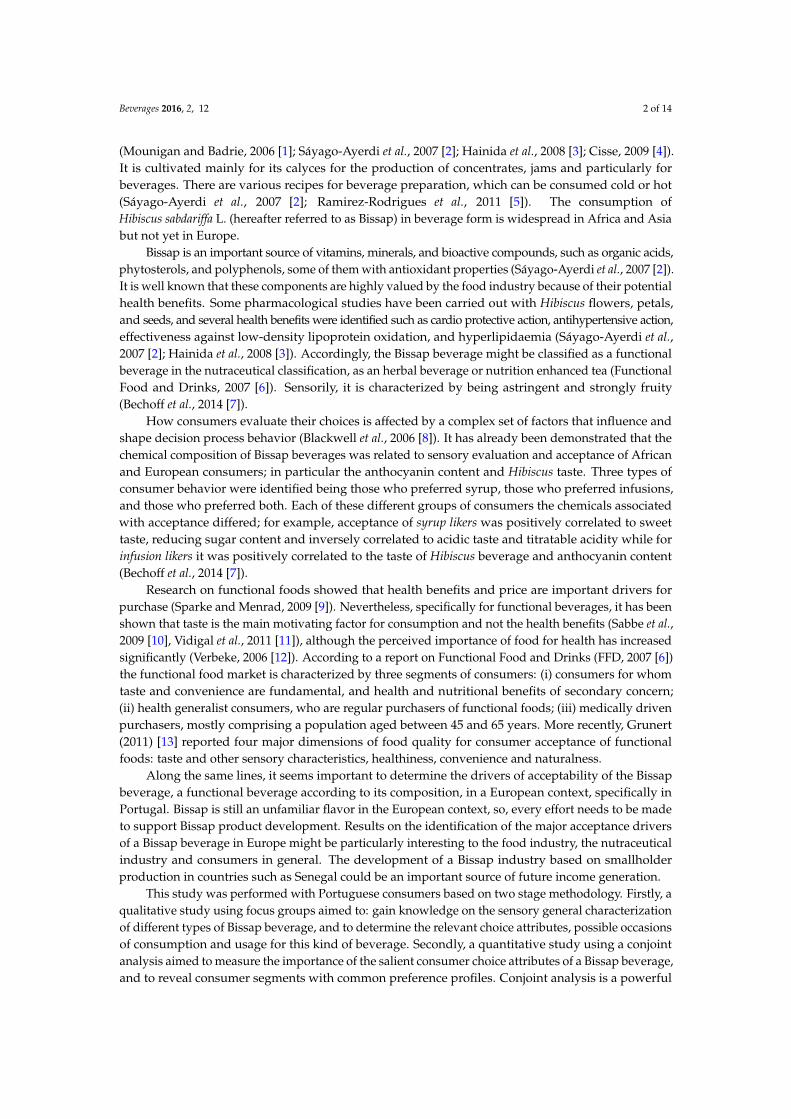
The first task of the focus group participants was to taste and generally evaluate sensory attributesof four blind samples of Bissap beverage. A description of the Bissap beverage samples is presented inTable 3. Samples were presented to participants in coded transparent glasses. Water and crackers werealso made available as a complement to the tasting. During the discussion participants were allowedto drink and taste the beverages as much as they wanted.
Table 3. Identification and preparation of the Bissap samples.
Sample Name Preparation
A Cold extract
Calyces were extracted in water at roomtemperature (2 h) 5% (m/v). Sugar (130 g/L)was added after filtration followed bypasteurization (T = 85 ˝C, 20 min).
Beveragesȱ2016,ȱ2,ȱ12ȱ
4
Middleȱclassȱ*ȱ 36%ȱLowerȱmiddleȱclassȱ*ȱ 23%ȱSkilledȱworkersȱ*ȱ 23%ȱUnskilledȱworkersȱ*ȱ 5%ȱ
*ȱAccordingȱtoȱESOMARȱclassificationȱ[16].ȱ
Theȱ firstȱ taskȱ ofȱ theȱ focusȱ groupȱ participantsȱwasȱ toȱ tasteȱ andȱ generallyȱ evaluateȱ sensoryȱattributesȱofȱfourȱblindȱsamplesȱofȱBissapȱbeverage.ȱAȱdescriptionȱofȱtheȱBissapȱbeverageȱsamplesȱisȱpresentedȱinȱTableȱ3.ȱSamplesȱwereȱpresentedȱtoȱparticipantsȱinȱcodedȱtransparentȱglasses.ȱWaterȱandȱcrackersȱwereȱalsoȱmadeȱavailableȱasȱaȱcomplementȱtoȱtheȱtasting.ȱDuringȱtheȱdiscussionȱparticipantsȱwereȱallowedȱtoȱdrinkȱandȱtasteȱtheȱbeveragesȱasȱmuchȱasȱtheyȱwanted.ȱ ȱ
Tableȱ3.ȱIdentificationȱandȱpreparationȱofȱtheȱBissapȱsamples.ȱ
Sampleȱ Nameȱ Preparation ȱ
AȱColdȱextractȱ
Calycesȱwereȱextractedȱinȱwaterȱatȱroomȱtemperatureȱ (2ȱh)ȱ5%ȱ (m/v).ȱSugarȱ (130ȱg/L)ȱwasȱaddedȱafterȱ filtrationȱ followedȱbyȱpasteurizationȱ(Tȱ=ȱ85ȱ°C,ȱ20ȱmin).ȱ
ȱ
BȱHotȱextractȱ
Calycesȱwereȱextractedȱafterȱboilingȱ(1ȱh)ȱinȱwaterȱ(3.3%ȱm/v).ȱSugarȱ(130ȱg/L)ȱwasȱaddedȱ afterȱ filtrationȱ followedȱ byȱpasteurizationȱ(Tȱ=ȱ85ȱ°C,ȱ20ȱmin).ȱ
Cȱ InstantȱGranulesȱwereȱdissolvedȱ inȱwater,ȱ 10%ȱ(m/v)ȱatȱroomȱtemperatureȱ
ȱ
Dȱ Syrupȱ Dilutedȱ1:4ȱwithȱwaterȱ
ȱ
Allȱdataȱwereȱtranscribedȱverbatim,ȱandȱtheȱcontentȱanalyzedȱusingȱtheȱsoftwareȱNVivo.ȱ ȱ
2.3.ȱQuantitativeȱStudy–ConjointȱAnalysisȱ ȱ
GlobalȱacceptabilityȱofȱfoodȱandȱbeveragesȱdependsȱonȱtheȱmultiȬattributeȱcompositionȱofȱtheȱimportanceȱconsumers’ȱattachȱtoȱeachȱproductȱattribute.ȱForȱthatȱreason,ȱconjointȱanalysisȱwasȱchosenȱasȱtheȱtheoreticalȱandȱmethodologicalȱframeworkȱforȱthisȱstudy.ȱThisȱmethodologyȱhasȱbeenȱwidelyȱusedȱ inȱ foodȱ research,ȱ andȱ itsȱ efficacyȱ andȱ usefulnessȱ hasȱ beenȱ clearlyȱ provenȱ toȱ theȱ studyȱ ofȱconsumers’ȱpreferencesȱandȱ choiceȱ factorsȱ (e.g.,ȱpineappleȱ juice,ȱFincoȱ etȱ al.,ȱ2010ȱ [17];ȱ functionalȱfoods,ȱBechȬLarsenȱandȱGrunert,ȱ2003ȱ[18];ȱwines,ȱGilȱandȱSanchez,ȱ1997ȱ[19];ȱQuesterȱandȱSmart,ȱ1998ȱ[20];ȱolives,ȱMoskowitzȱetȱal.,ȱ2005ȱ[21];ȱimpactȱofȱreducedȱsaltȱcontent,ȱHerslethȱetȱal.,ȱ2011ȱ[22];ȱprocessedȱfoods,ȱCardelloȱetȱal.,ȱ2007ȱ[23];ȱfoodȱbars,ȱMahannaȱetȱal.,ȱ2009ȱ[24]).ȱ
Inȱthisȱstudy,ȱtheȱattributesȱandȱlevelsȱforȱtheȱconjointȱstudyȱmodelȱwereȱdefinedȱaccordingȱtoȱtheȱfindingsȱarisingȱfromȱtheȱfocusȱgroupsȱdiscussions.ȱByȱusingȱaȱfractionalȱorthogonalȱplanȱcreatedȱbyȱtheȱconjointȱalgorithmȱavailableȱinȱtheȱsoftwareȱSPSSȱ(versionȱ19,ȱIBM,ȱNewȱYork,ȱNY,ȱUSA),ȱ37ȱfullȬprofileȱBissapȱbeveragesȱwereȱproduced.ȱAȱquestionnaireȱwasȱwrittenȱinȱwhichȱrespondentsȱhaveȱtoȱevaluateȱtheirȱlikelihoodȱofȱpurchasingȱaȱgivenȱhypotheticalȱprofile,ȱbyȱusingȱfiveȬpointȱLikertȱscale.ȱAnȱexampleȱofȱaȱprofileȱgivenȱtoȱparticipantsȱtoȱperformȱtheȱevaluationȱisȱpresentedȱinȱFigureȱ1.ȱTheȱquestionnaireȱ startedȱwithȱ aȱ briefȱ introductionȱ aboutȱ theȱ studyȱ aimȱ andȱ finishedȱ byȱ askingȱ forȱparticipants’ȱsocioȬdemographicȱinformation:ȱage,ȱgender,ȱeducation,ȱsocialȱgrade,ȱoccupation,ȱandȱfrequencyȱofȱ juiceȱconsumption.ȱTheȱ laterȱ informationȱwasȱusedȱasȱaȱbasisȱ forȱsegmentation.ȱTheȱ
B Hot extract
Calyces were extracted after boiling (1 h) inwater (3.3% m/v). Sugar (130 g/L) was addedafter filtration followed by pasteurization(T = 85 ˝C, 20 min).
C Instant Granules were dissolved in water, 10% (m/v)at room temperature
Beveragesȱ2016,ȱ2,ȱ12ȱ
4
Middleȱclassȱ*ȱ 36%ȱLowerȱmiddleȱclassȱ*ȱ 23%ȱSkilledȱworkersȱ*ȱ 23%ȱUnskilledȱworkersȱ*ȱ 5%ȱ
*ȱAccordingȱtoȱESOMARȱclassificationȱ[16].ȱ
Theȱ firstȱ taskȱ ofȱ theȱ focusȱ groupȱ participantsȱwasȱ toȱ tasteȱ andȱ generallyȱ evaluateȱ sensoryȱattributesȱofȱfourȱblindȱsamplesȱofȱBissapȱbeverage.ȱAȱdescriptionȱofȱtheȱBissapȱbeverageȱsamplesȱisȱpresentedȱinȱTableȱ3.ȱSamplesȱwereȱpresentedȱtoȱparticipantsȱinȱcodedȱtransparentȱglasses.ȱWaterȱandȱcrackersȱwereȱalsoȱmadeȱavailableȱasȱaȱcomplementȱtoȱtheȱtasting.ȱDuringȱtheȱdiscussionȱparticipantsȱwereȱallowedȱtoȱdrinkȱandȱtasteȱtheȱbeveragesȱasȱmuchȱasȱtheyȱwanted.ȱ ȱ
Tableȱ3.ȱIdentificationȱandȱpreparationȱofȱtheȱBissapȱsamples.ȱ
Sampleȱ Nameȱ Preparation ȱ
AȱColdȱextractȱ
Calycesȱwereȱextractedȱinȱwaterȱatȱroomȱtemperatureȱ (2ȱh)ȱ5%ȱ (m/v).ȱSugarȱ (130ȱg/L)ȱwasȱaddedȱafterȱ filtrationȱ followedȱbyȱpasteurizationȱ(Tȱ=ȱ85ȱ°C,ȱ20ȱmin).ȱ
ȱ
BȱHotȱextractȱ
Calycesȱwereȱextractedȱafterȱboilingȱ(1ȱh)ȱinȱwaterȱ(3.3%ȱm/v).ȱSugarȱ(130ȱg/L)ȱwasȱaddedȱ afterȱ filtrationȱ followedȱ byȱpasteurizationȱ(Tȱ=ȱ85ȱ°C,ȱ20ȱmin).ȱ
Cȱ InstantȱGranulesȱwereȱdissolvedȱ inȱwater,ȱ 10%ȱ(m/v)ȱatȱroomȱtemperatureȱ
ȱ
Dȱ Syrupȱ Dilutedȱ1:4ȱwithȱwaterȱ
ȱ
Allȱdataȱwereȱtranscribedȱverbatim,ȱandȱtheȱcontentȱanalyzedȱusingȱtheȱsoftwareȱNVivo.ȱ ȱ
2.3.ȱQuantitativeȱStudy–ConjointȱAnalysisȱ ȱ
GlobalȱacceptabilityȱofȱfoodȱandȱbeveragesȱdependsȱonȱtheȱmultiȬattributeȱcompositionȱofȱtheȱimportanceȱconsumers’ȱattachȱtoȱeachȱproductȱattribute.ȱForȱthatȱreason,ȱconjointȱanalysisȱwasȱchosenȱasȱtheȱtheoreticalȱandȱmethodologicalȱframeworkȱforȱthisȱstudy.ȱThisȱmethodologyȱhasȱbeenȱwidelyȱusedȱ inȱ foodȱ research,ȱ andȱ itsȱ efficacyȱ andȱ usefulnessȱ hasȱ beenȱ clearlyȱ provenȱ toȱ theȱ studyȱ ofȱconsumers’ȱpreferencesȱandȱ choiceȱ factorsȱ (e.g.,ȱpineappleȱ juice,ȱFincoȱ etȱ al.,ȱ2010ȱ [17];ȱ functionalȱfoods,ȱBechȬLarsenȱandȱGrunert,ȱ2003ȱ[18];ȱwines,ȱGilȱandȱSanchez,ȱ1997ȱ[19];ȱQuesterȱandȱSmart,ȱ1998ȱ[20];ȱolives,ȱMoskowitzȱetȱal.,ȱ2005ȱ[21];ȱimpactȱofȱreducedȱsaltȱcontent,ȱHerslethȱetȱal.,ȱ2011ȱ[22];ȱprocessedȱfoods,ȱCardelloȱetȱal.,ȱ2007ȱ[23];ȱfoodȱbars,ȱMahannaȱetȱal.,ȱ2009ȱ[24]).ȱ
Inȱthisȱstudy,ȱtheȱattributesȱandȱlevelsȱforȱtheȱconjointȱstudyȱmodelȱwereȱdefinedȱaccordingȱtoȱtheȱfindingsȱarisingȱfromȱtheȱfocusȱgroupsȱdiscussions.ȱByȱusingȱaȱfractionalȱorthogonalȱplanȱcreatedȱbyȱtheȱconjointȱalgorithmȱavailableȱinȱtheȱsoftwareȱSPSSȱ(versionȱ19,ȱIBM,ȱNewȱYork,ȱNY,ȱUSA),ȱ37ȱfullȬprofileȱBissapȱbeveragesȱwereȱproduced.ȱAȱquestionnaireȱwasȱwrittenȱinȱwhichȱrespondentsȱhaveȱtoȱevaluateȱtheirȱlikelihoodȱofȱpurchasingȱaȱgivenȱhypotheticalȱprofile,ȱbyȱusingȱfiveȬpointȱLikertȱscale.ȱAnȱexampleȱofȱaȱprofileȱgivenȱtoȱparticipantsȱtoȱperformȱtheȱevaluationȱisȱpresentedȱinȱFigureȱ1.ȱTheȱquestionnaireȱ startedȱwithȱ aȱ briefȱ introductionȱ aboutȱ theȱ studyȱ aimȱ andȱ finishedȱ byȱ askingȱ forȱparticipants’ȱsocioȬdemographicȱinformation:ȱage,ȱgender,ȱeducation,ȱsocialȱgrade,ȱoccupation,ȱandȱfrequencyȱofȱ juiceȱconsumption.ȱTheȱ laterȱ informationȱwasȱusedȱasȱaȱbasisȱ forȱsegmentation.ȱTheȱ
D Syrup Diluted 1:4 with water
Beveragesȱ2016,ȱ2,ȱ12ȱ
4
Middleȱclassȱ*ȱ 36%ȱLowerȱmiddleȱclassȱ*ȱ 23%ȱSkilledȱworkersȱ*ȱ 23%ȱUnskilledȱworkersȱ*ȱ 5%ȱ
*ȱAccordingȱtoȱESOMARȱclassificationȱ[16].ȱ
Theȱ firstȱ taskȱ ofȱ theȱ focusȱ groupȱ participantsȱwasȱ toȱ tasteȱ andȱ generallyȱ evaluateȱ sensoryȱattributesȱofȱfourȱblindȱsamplesȱofȱBissapȱbeverage.ȱAȱdescriptionȱofȱtheȱBissapȱbeverageȱsamplesȱisȱpresentedȱinȱTableȱ3.ȱSamplesȱwereȱpresentedȱtoȱparticipantsȱinȱcodedȱtransparentȱglasses.ȱWaterȱandȱcrackersȱwereȱalsoȱmadeȱavailableȱasȱaȱcomplementȱtoȱtheȱtasting.ȱDuringȱtheȱdiscussionȱparticipantsȱwereȱallowedȱtoȱdrinkȱandȱtasteȱtheȱbeveragesȱasȱmuchȱasȱtheyȱwanted.ȱ ȱ
Tableȱ3.ȱIdentificationȱandȱpreparationȱofȱtheȱBissapȱsamples.ȱ
Sampleȱ Nameȱ Preparation ȱ
AȱColdȱextractȱ
Calycesȱwereȱextractedȱinȱwaterȱatȱroomȱtemperatureȱ (2ȱh)ȱ5%ȱ (m/v).ȱSugarȱ (130ȱg/L)ȱwasȱaddedȱafterȱ filtrationȱ followedȱbyȱpasteurizationȱ(Tȱ=ȱ85ȱ°C,ȱ20ȱmin).ȱ
ȱ
BȱHotȱextractȱ
Calycesȱwereȱextractedȱafterȱboilingȱ(1ȱh)ȱinȱwaterȱ(3.3%ȱm/v).ȱSugarȱ(130ȱg/L)ȱwasȱaddedȱ afterȱ filtrationȱ followedȱ byȱpasteurizationȱ(Tȱ=ȱ85ȱ°C,ȱ20ȱmin).ȱ
Cȱ InstantȱGranulesȱwereȱdissolvedȱ inȱwater,ȱ 10%ȱ(m/v)ȱatȱroomȱtemperatureȱ
ȱ
Dȱ Syrupȱ Dilutedȱ1:4ȱwithȱwaterȱ
ȱ
Allȱdataȱwereȱtranscribedȱverbatim,ȱandȱtheȱcontentȱanalyzedȱusingȱtheȱsoftwareȱNVivo.ȱ ȱ
2.3.ȱQuantitativeȱStudy–ConjointȱAnalysisȱ ȱ
GlobalȱacceptabilityȱofȱfoodȱandȱbeveragesȱdependsȱonȱtheȱmultiȬattributeȱcompositionȱofȱtheȱimportanceȱconsumers’ȱattachȱtoȱeachȱproductȱattribute.ȱForȱthatȱreason,ȱconjointȱanalysisȱwasȱchosenȱasȱtheȱtheoreticalȱandȱmethodologicalȱframeworkȱforȱthisȱstudy.ȱThisȱmethodologyȱhasȱbeenȱwidelyȱusedȱ inȱ foodȱ research,ȱ andȱ itsȱ efficacyȱ andȱ usefulnessȱ hasȱ beenȱ clearlyȱ provenȱ toȱ theȱ studyȱ ofȱconsumers’ȱpreferencesȱandȱ choiceȱ factorsȱ (e.g.,ȱpineappleȱ juice,ȱFincoȱ etȱ al.,ȱ2010ȱ [17];ȱ functionalȱfoods,ȱBechȬLarsenȱandȱGrunert,ȱ2003ȱ[18];ȱwines,ȱGilȱandȱSanchez,ȱ1997ȱ[19];ȱQuesterȱandȱSmart,ȱ1998ȱ[20];ȱolives,ȱMoskowitzȱetȱal.,ȱ2005ȱ[21];ȱimpactȱofȱreducedȱsaltȱcontent,ȱHerslethȱetȱal.,ȱ2011ȱ[22];ȱprocessedȱfoods,ȱCardelloȱetȱal.,ȱ2007ȱ[23];ȱfoodȱbars,ȱMahannaȱetȱal.,ȱ2009ȱ[24]).ȱ
Inȱthisȱstudy,ȱtheȱattributesȱandȱlevelsȱforȱtheȱconjointȱstudyȱmodelȱwereȱdefinedȱaccordingȱtoȱtheȱfindingsȱarisingȱfromȱtheȱfocusȱgroupsȱdiscussions.ȱByȱusingȱaȱfractionalȱorthogonalȱplanȱcreatedȱbyȱtheȱconjointȱalgorithmȱavailableȱinȱtheȱsoftwareȱSPSSȱ(versionȱ19,ȱIBM,ȱNewȱYork,ȱNY,ȱUSA),ȱ37ȱfullȬprofileȱBissapȱbeveragesȱwereȱproduced.ȱAȱquestionnaireȱwasȱwrittenȱinȱwhichȱrespondentsȱhaveȱtoȱevaluateȱtheirȱlikelihoodȱofȱpurchasingȱaȱgivenȱhypotheticalȱprofile,ȱbyȱusingȱfiveȬpointȱLikertȱscale.ȱAnȱexampleȱofȱaȱprofileȱgivenȱtoȱparticipantsȱtoȱperformȱtheȱevaluationȱisȱpresentedȱinȱFigureȱ1.ȱTheȱquestionnaireȱ startedȱwithȱ aȱ briefȱ introductionȱ aboutȱ theȱ studyȱ aimȱ andȱ finishedȱ byȱ askingȱ forȱparticipants’ȱsocioȬdemographicȱinformation:ȱage,ȱgender,ȱeducation,ȱsocialȱgrade,ȱoccupation,ȱandȱfrequencyȱofȱ juiceȱconsumption.ȱTheȱ laterȱ informationȱwasȱusedȱasȱaȱbasisȱ forȱsegmentation.ȱTheȱ
All data were transcribed verbatim, and the content analyzed using the software NVivo.
2.3. Quantitative Study–Conjoint Analysis
Global acceptability of food and beverages depends on the multi-attribute composition of theimportance consumers’ attach to each product attribute. For that reason, conjoint analysis waschosen as the theoretical and methodological framework for this study. This methodology has beenwidely used in food research, and its efficacy and usefulness has been clearly proven to the study ofconsumers’ preferences and choice factors (e.g., pineapple juice, Finco et al., 2010 [17]; functional foods,Bech-Larsen and Grunert, 2003 [18]; wines, Gil and Sanchez, 1997 [19]; Quester and Smart, 1998 [20];olives, Moskowitz et al., 2005 [21]; impact of reduced salt content, Hersleth et al., 2011 [22]; processedfoods, Cardello et al., 2007 [23]; food bars, Mahanna et al., 2009 [24]).
In this study, the attributes and levels for the conjoint study model were defined according tothe findings arising from the focus groups discussions. By using a fractional orthogonal plan createdby the conjoint algorithm available in the software SPSS (version 19, IBM, New York, NY, USA),37 full-profile Bissap beverages were produced. A questionnaire was written in which respondents
Beverages 2016, 2, 12 5 of 14
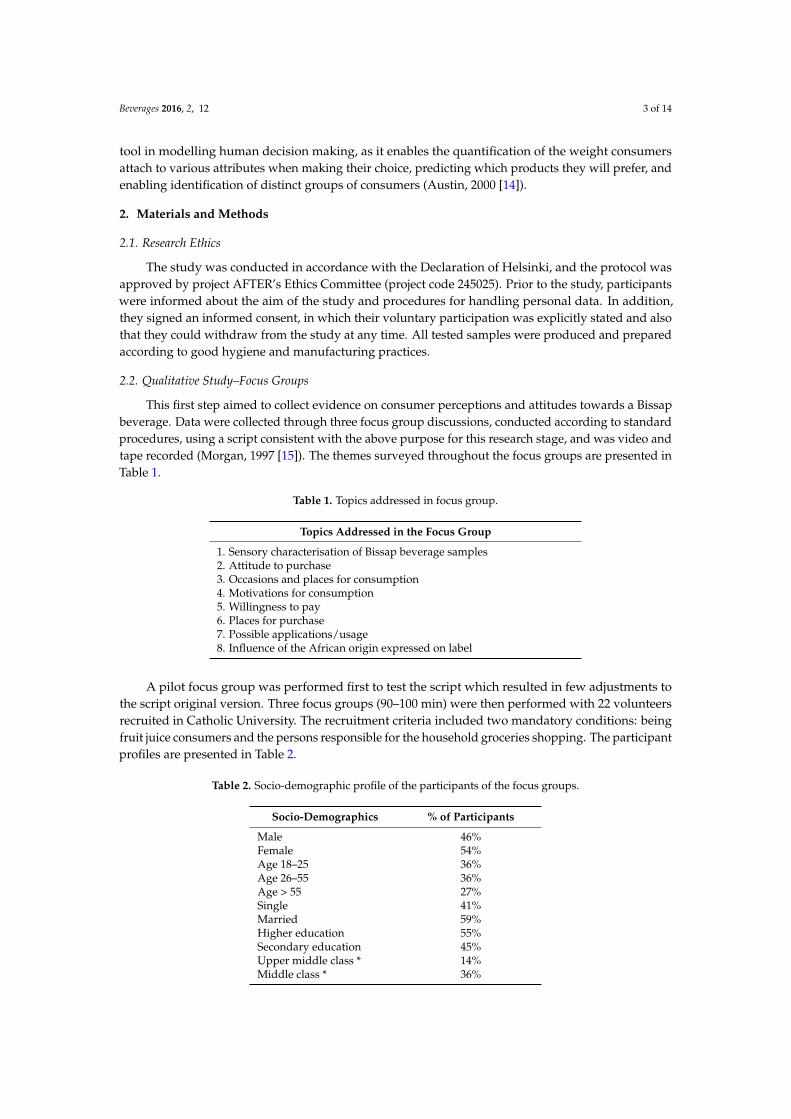
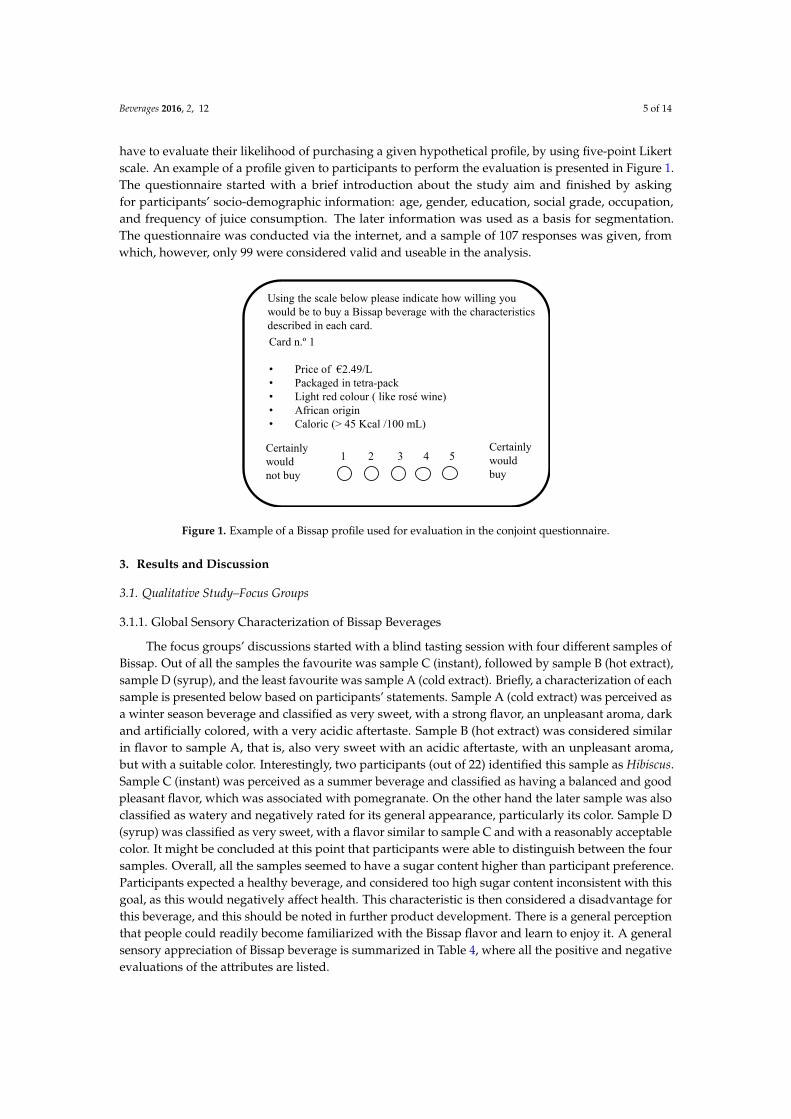
have to evaluate their likelihood of purchasing a given hypothetical profile, by using five-point Likertscale. An example of a profile given to participants to perform the evaluation is presented in Figure 1.The questionnaire started with a brief introduction about the study aim and finished by askingfor participants’ socio-demographic information: age, gender, education, social grade, occupation,and frequency of juice consumption. The later information was used as a basis for segmentation.The questionnaire was conducted via the internet, and a sample of 107 responses was given, fromwhich, however, only 99 were considered valid and useable in the analysis.
Beveragesȱ2016,ȱ2,ȱ12ȱ
5
questionnaireȱwasȱconductedȱviaȱtheȱinternet,ȱandȱaȱsampleȱofȱ107ȱresponsesȱwasȱgiven,ȱfromȱwhich,ȱhowever,ȱonlyȱ99ȱwereȱconsideredȱvalidȱandȱuseableȱinȱtheȱanalysis.ȱ ȱ
ȱ
Figureȱ1.ȱExampleȱofȱaȱBissapȱprofileȱusedȱforȱevaluationȱinȱtheȱconjointȱquestionnaire.ȱ
3.ȱResultsȱandȱDiscussionȱ ȱ
3.1.ȱQualitativeȱStudy–FocusȱGroupsȱ ȱ
3.1.1.ȱGlobalȱSensoryȱCharacterizationȱofȱBissapȱBeveragesȱ
Theȱfocusȱgroups’ȱdiscussionsȱstartedȱwithȱaȱblindȱtastingȱsessionȱwithȱfourȱdifferentȱsamplesȱofȱBissap.ȱOutȱofȱallȱtheȱsamplesȱtheȱfavouriteȱwasȱsampleȱCȱ(instant),ȱfollowedȱbyȱsampleȱBȱ(hotȱextract),ȱsampleȱDȱ(syrup),ȱandȱtheȱleastȱfavouriteȱwasȱsampleȱAȱ(coldȱextract).ȱBriefly,ȱaȱcharacterizationȱofȱeachȱ sampleȱ isȱ presentedȱ belowȱ basedȱ onȱ participants’ȱ statements.ȱ SampleȱAȱ (coldȱ extract)ȱwasȱperceivedȱ asȱ aȱ winterȱ seasonȱ beverageȱ andȱ classifiedȱ asȱ veryȱ sweet,ȱ withȱ aȱ strongȱ flavor,ȱ anȱunpleasantȱaroma,ȱdarkȱandȱartificiallyȱcolored,ȱwithȱaȱveryȱacidicȱaftertaste.ȱSampleȱBȱ(hotȱextract)ȱwasȱconsideredȱsimilarȱinȱflavorȱtoȱsampleȱA,ȱthatȱis,ȱalsoȱveryȱsweetȱwithȱanȱacidicȱaftertaste,ȱwithȱanȱunpleasantȱaroma,ȱbutȱwithȱaȱsuitableȱcolor.ȱInterestingly,ȱtwoȱparticipantsȱ(outȱofȱ22)ȱidentifiedȱthisȱsampleȱasȱHibiscus.ȱSampleȱCȱ(instant)ȱwasȱperceivedȱasȱaȱsummerȱbeverageȱandȱclassifiedȱasȱhavingȱaȱbalancedȱandȱgoodȱpleasantȱflavor,ȱwhichȱwasȱassociatedȱwithȱpomegranate.ȱOnȱtheȱotherȱhandȱtheȱlaterȱsampleȱwasȱalsoȱclassifiedȱasȱwateryȱandȱnegativelyȱratedȱforȱitsȱgeneralȱappearance,ȱparticularlyȱitsȱcolor.ȱSampleȱDȱ(syrup)ȱwasȱclassifiedȱasȱveryȱsweet,ȱwithȱaȱflavorȱsimilarȱtoȱsampleȱCȱandȱwithȱaȱreasonablyȱacceptableȱcolor.ȱItȱmightȱbeȱconcludedȱatȱthisȱpointȱthatȱparticipantsȱwereȱableȱtoȱdistinguishȱbetweenȱtheȱfourȱsamples.ȱOverall,ȱallȱtheȱsamplesȱseemedȱtoȱhaveȱaȱsugarȱcontentȱhigherȱthanȱparticipantȱpreference.ȱParticipantsȱexpectedȱaȱhealthyȱbeverage,ȱandȱconsideredȱtooȱhighȱsugarȱcontentȱinconsistentȱwithȱthisȱgoal,ȱasȱthisȱwouldȱnegativelyȱaffectȱhealth.ȱThisȱcharacteristicȱisȱthenȱ consideredȱ aȱ disadvantageȱ forȱ thisȱ beverage,ȱ andȱ thisȱ shouldȱ beȱ notedȱ inȱ furtherȱ productȱdevelopment.ȱThereȱisȱaȱgeneralȱperceptionȱthatȱpeopleȱcouldȱreadilyȱbecomeȱfamiliarizedȱwithȱtheȱBissapȱflavorȱandȱlearnȱtoȱenjoyȱit.ȱAȱgeneralȱsensoryȱappreciationȱofȱBissapȱbeverageȱisȱsummarizedȱinȱTableȱ4,ȱwhereȱallȱtheȱpositiveȱandȱnegativeȱevaluationsȱofȱtheȱattributesȱareȱlisted.ȱ ȱ ȱ
Certainly would not buy
Certainly would buy
1 2 3 4 5
Using the scale below please indicate how willing you would be to buy a Bissap beverage with the characteristics described in each card.Card n.º 1
• Price of €2.49/L• Packaged in tetra-pack• Light red colour ( like rosé wine)• African origin• Caloric (> 45 Kcal /100 mL)
Figure 1. Example of a Bissap profile used for evaluation in the conjoint questionnaire.
3. Results and Discussion
3.1. Qualitative Study–Focus Groups
3.1.1. Global Sensory Characterization of Bissap Beverages
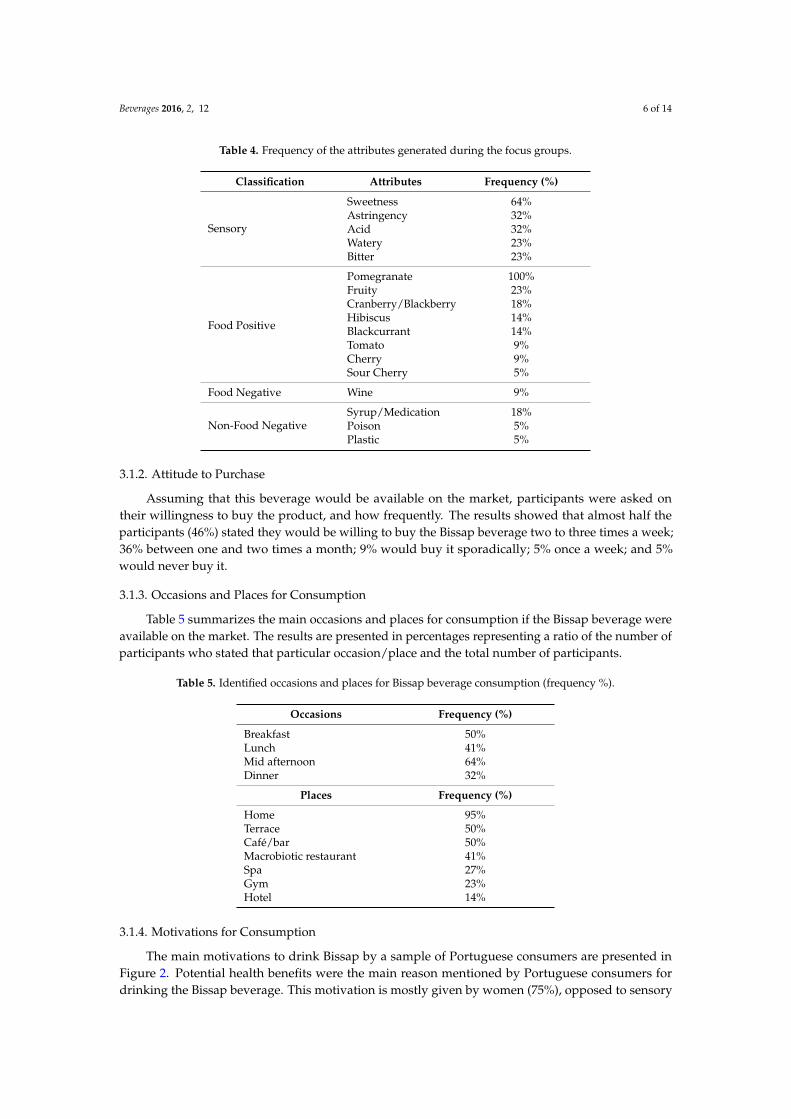
The focus groups’ discussions started with a blind tasting session with four different samples ofBissap. Out of all the samples the favourite was sample C (instant), followed by sample B (hot extract),sample D (syrup), and the least favourite was sample A (cold extract). Briefly, a characterization of eachsample is presented below based on participants’ statements. Sample A (cold extract) was perceived asa winter season beverage and classified as very sweet, with a strong flavor, an unpleasant aroma, darkand artificially colored, with a very acidic aftertaste. Sample B (hot extract) was considered similarin flavor to sample A, that is, also very sweet with an acidic aftertaste, with an unpleasant aroma,but with a suitable color. Interestingly, two participants (out of 22) identified this sample as Hibiscus.Sample C (instant) was perceived as a summer beverage and classified as having a balanced and goodpleasant flavor, which was associated with pomegranate. On the other hand the later sample was alsoclassified as watery and negatively rated for its general appearance, particularly its color. Sample D(syrup) was classified as very sweet, with a flavor similar to sample C and with a reasonably acceptablecolor. It might be concluded at this point that participants were able to distinguish between the foursamples. Overall, all the samples seemed to have a sugar content higher than participant preference.Participants expected a healthy beverage, and considered too high sugar content inconsistent with thisgoal, as this would negatively affect health. This characteristic is then considered a disadvantage forthis beverage, and this should be noted in further product development. There is a general perceptionthat people could readily become familiarized with the Bissap flavor and learn to enjoy it. A generalsensory appreciation of Bissap beverage is summarized in Table 4, where all the positive and negativeevaluations of the attributes are listed.
Beverages 2016, 2, 12 6 of 14
Table 4. Frequency of the attributes generated during the focus groups.
Classification Attributes Frequency (%)
Sensory
Sweetness 64%Astringency 32%Acid 32%Watery 23%Bitter 23%
Food Positive
Pomegranate 100%Fruity 23%Cranberry/Blackberry 18%Hibiscus 14%Blackcurrant 14%Tomato 9%Cherry 9%Sour Cherry 5%
Food Negative Wine 9%
Non-Food NegativeSyrup/Medication 18%Poison 5%Plastic 5%
3.1.2. Attitude to Purchase
Assuming that this beverage would be available on the market, participants were asked ontheir willingness to buy the product, and how frequently. The results showed that almost half theparticipants (46%) stated they would be willing to buy the Bissap beverage two to three times a week;36% between one and two times a month; 9% would buy it sporadically; 5% once a week; and 5%would never buy it.
3.1.3. Occasions and Places for Consumption
Table 5 summarizes the main occasions and places for consumption if the Bissap beverage wereavailable on the market. The results are presented in percentages representing a ratio of the number ofparticipants who stated that particular occasion/place and the total number of participants.
Table 5. Identified occasions and places for Bissap beverage consumption (frequency %).
Occasions Frequency (%)
Breakfast 50%Lunch 41%Mid afternoon 64%Dinner 32%
Places Frequency (%)
Home 95%Terrace 50%Café/bar 50%Macrobiotic restaurant 41%Spa 27%Gym 23%Hotel 14%
3.1.4. Motivations for Consumption
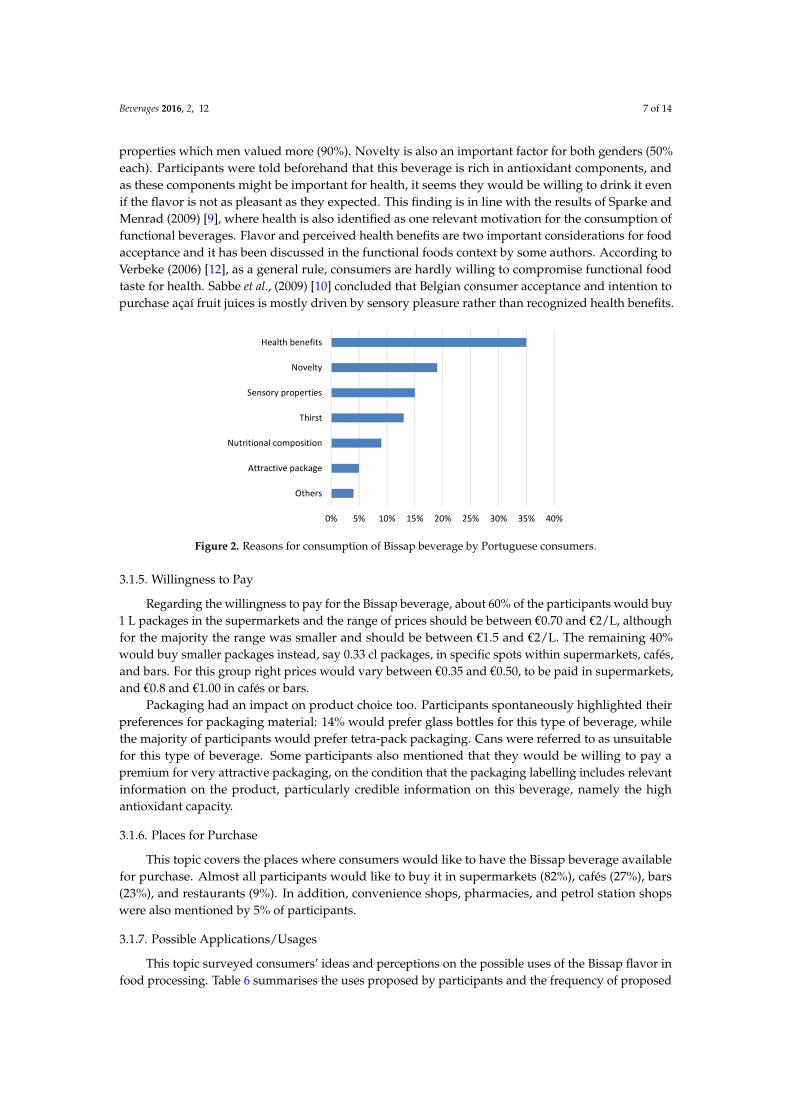
The main motivations to drink Bissap by a sample of Portuguese consumers are presented inFigure 2. Potential health benefits were the main reason mentioned by Portuguese consumers fordrinking the Bissap beverage. This motivation is mostly given by women (75%), opposed to sensory
Beverages 2016, 2, 12 7 of 14
properties which men valued more (90%). Novelty is also an important factor for both genders (50%each). Participants were told beforehand that this beverage is rich in antioxidant components, andas these components might be important for health, it seems they would be willing to drink it evenif the flavor is not as pleasant as they expected. This finding is in line with the results of Sparke andMenrad (2009) [9], where health is also identified as one relevant motivation for the consumption offunctional beverages. Flavor and perceived health benefits are two important considerations for foodacceptance and it has been discussed in the functional foods context by some authors. According toVerbeke (2006) [12], as a general rule, consumers are hardly willing to compromise functional foodtaste for health. Sabbe et al., (2009) [10] concluded that Belgian consumer acceptance and intention topurchase açaí fruit juices is mostly driven by sensory pleasure rather than recognized health benefits.
Beveragesȱ2016,ȱ2,ȱ12ȱ
7
theseȱcomponentsȱmightȱbeȱimportantȱforȱhealth,ȱitȱseemsȱtheyȱwouldȱbeȱwillingȱtoȱdrinkȱitȱevenȱifȱtheȱflavorȱisȱnotȱasȱpleasantȱasȱtheyȱexpected.ȱThisȱfindingȱisȱinȱlineȱwithȱtheȱresultsȱofȱSparkeȱandȱMenradȱ(2009)ȱ[9],ȱwhereȱhealthȱisȱalsoȱidentifiedȱasȱoneȱrelevantȱmotivationȱforȱtheȱconsumptionȱofȱfunctionalȱbeverages.ȱFlavorȱandȱperceivedȱhealthȱbenefitsȱareȱtwoȱimportantȱconsiderationsȱforȱfoodȱacceptanceȱandȱitȱhasȱbeenȱdiscussedȱinȱtheȱfunctionalȱfoodsȱcontextȱbyȱsomeȱauthors.ȱAccordingȱtoȱVerbekeȱ(2006)ȱ[12],ȱasȱaȱgeneralȱrule,ȱconsumersȱareȱhardlyȱwillingȱtoȱcompromiseȱfunctionalȱfoodȱtasteȱforȱhealth.ȱSabbeȱetȱal.ȱ(2009)ȱ[10]ȱconcludedȱthatȱBelgianȱconsumerȱacceptanceȱandȱintentionȱtoȱpurchaseȱaçaíȱfruitȱjuicesȱisȱmostlyȱdrivenȱbyȱsensoryȱpleasureȱratherȱthanȱrecognizedȱhealthȱbenefits.ȱ ȱ
ȱFigureȱ2.ȱReasonsȱforȱconsumptionȱofȱBissapȱbeverageȱbyȱPortugueseȱconsumers.ȱ
3.1.5.ȱWillingnessȱtoȱPayȱ
RegardingȱtheȱwillingnessȱtoȱpayȱforȱtheȱBissapȱbeverage,ȱaboutȱ60%ȱofȱtheȱparticipantsȱwouldȱbuyȱ1ȱLȱpackagesȱ inȱ theȱsupermarketsȱandȱ theȱrangeȱofȱpricesȱshouldȱbeȱbetweenȱ€0.70ȱandȱ€2/L,ȱalthoughȱforȱtheȱmajorityȱtheȱrangeȱwasȱsmallerȱandȱshouldȱbeȱbetweenȱ€1.5ȱandȱ€2/L.ȱTheȱremainingȱ40%ȱwouldȱbuyȱsmallerȱpackagesȱinstead,ȱsayȱ0.33ȱclȱpackages,ȱinȱspecificȱspotsȱwithinȱsupermarkets,ȱcafés,ȱ andȱ bars.ȱ Forȱ thisȱ groupȱ rightȱ pricesȱwouldȱ varyȱ betweenȱ €0.35ȱ andȱ €0.50,ȱ toȱ beȱ paidȱ inȱsupermarkets,ȱandȱ€0.8ȱandȱ€1.00ȱinȱcafésȱorȱbars.ȱ ȱ
Packagingȱhadȱanȱimpactȱonȱproductȱchoiceȱtoo.ȱParticipantsȱspontaneouslyȱhighlightedȱtheirȱpreferencesȱforȱpackagingȱmaterial:ȱ14%ȱwouldȱpreferȱglassȱbottlesȱforȱthisȱtypeȱofȱbeverage,ȱwhileȱtheȱmajorityȱofȱparticipantsȱwouldȱpreferȱtetraȬpackȱpackaging.ȱCansȱwereȱreferredȱtoȱasȱunsuitableȱforȱ thisȱ typeȱofȱbeverage.ȱSomeȱparticipantsȱalsoȱmentionedȱ thatȱ theyȱwouldȱbeȱwillingȱ toȱpayȱaȱpremiumȱ forȱ veryȱ attractiveȱ packaging,ȱ onȱ theȱ conditionȱ thatȱ theȱ packagingȱ labellingȱ includesȱrelevantȱinformationȱonȱtheȱproduct,ȱparticularlyȱcredibleȱinformationȱonȱthisȱbeverage,ȱnamelyȱtheȱhighȱantioxidantȱcapacity.ȱ
3.1.6.ȱPlacesȱforȱPurchaseȱ
ThisȱtopicȱcoversȱtheȱplacesȱwhereȱconsumersȱwouldȱlikeȱtoȱhaveȱtheȱBissapȱbeverageȱavailableȱforȱpurchase.ȱAlmostȱallȱparticipantsȱwouldȱlikeȱtoȱbuyȱitȱinȱsupermarketsȱ(82%),ȱcafésȱ(27%),ȱbarsȱ(23%),ȱandȱrestaurantsȱ(9%).ȱInȱaddition,ȱconvenienceȱshops,ȱpharmacies,ȱandȱpetrolȱstationȱshopsȱwereȱalsoȱmentionedȱbyȱ5%ȱofȱparticipants.ȱ
3.1.7.ȱPossibleȱApplications/Usagesȱ ȱ
Thisȱtopicȱsurveyedȱconsumers’ȱideasȱandȱperceptionsȱonȱtheȱpossibleȱusesȱofȱtheȱBissapȱflavorȱinȱ foodȱprocessing.ȱTableȱ 6ȱ summarisesȱ theȱusesȱproposedȱbyȱparticipantsȱ andȱ theȱ frequencyȱofȱproposedȱuse.ȱAccordingȱtoȱparticipants’ȱviews,ȱBissapȱmightȱnotȱonlyȱhaveȱgreatȱpotentialȱtoȱbeȱusedȱinȱfoodȱindustryȱapplications,ȱbutȱalsoȱforȱhomeȬmadeȱapplications.ȱMostȱsuggestionsȱareȱrelatedȱtoȱsweetȱfoodsȱ(desserts)ȱandȱtoȱbeverages.ȱ
0% 5% 10% 15% 20% 25% 30% 35% 40%
Others
Attractive�package
Nutritional�composition
Thirst
Sensory�properties
Novelty
Health�benefits
Figure 2. Reasons for consumption of Bissap beverage by Portuguese consumers.
3.1.5. Willingness to Pay
Regarding the willingness to pay for the Bissap beverage, about 60% of the participants would buy1 L packages in the supermarkets and the range of prices should be between †0.70 and †2/L, althoughfor the majority the range was smaller and should be between †1.5 and †2/L. The remaining 40%would buy smaller packages instead, say 0.33 cl packages, in specific spots within supermarkets, cafés,and bars. For this group right prices would vary between †0.35 and †0.50, to be paid in supermarkets,and †0.8 and †1.00 in cafés or bars.
Packaging had an impact on product choice too. Participants spontaneously highlighted theirpreferences for packaging material: 14% would prefer glass bottles for this type of beverage, whilethe majority of participants would prefer tetra-pack packaging. Cans were referred to as unsuitablefor this type of beverage. Some participants also mentioned that they would be willing to pay apremium for very attractive packaging, on the condition that the packaging labelling includes relevantinformation on the product, particularly credible information on this beverage, namely the highantioxidant capacity.
3.1.6. Places for Purchase
This topic covers the places where consumers would like to have the Bissap beverage availablefor purchase. Almost all participants would like to buy it in supermarkets (82%), cafés (27%), bars(23%), and restaurants (9%). In addition, convenience shops, pharmacies, and petrol station shopswere also mentioned by 5% of participants.
3.1.7. Possible Applications/Usages
This topic surveyed consumers’ ideas and perceptions on the possible uses of the Bissap flavor infood processing. Table 6 summarises the uses proposed by participants and the frequency of proposed
Beverages 2016, 2, 12 8 of 14
use. According to participants’ views, Bissap might not only have great potential to be used in foodindustry applications, but also for home-made applications. Most suggestions are related to sweetfoods (desserts) and to beverages.
Table 6. Possible applications of Bissap in food.
Applications Type Product Suggestion Frequency
Food industry
Yogurt 27%Gelatin 23%Ice-creams 18%To mix withnon-alcoholic beverages 14%
To make Sangria 5%
Home-madeTopping/Dressing 50%Jelly 41%Sauce 5%
3.1.8. Influence of the African Origin Expressed on Label
This topic surveyed participants’ opinion on the effect of the disclosure on labelling the Bissapas a product of African origin. The concern was that the Portuguese market might have a negativeperception of foods of African origin. It was observed that consumers are split in two different clustersin this matter. The minority (9%—men aged 18 to 25), think that labels and labelling information, arenot at all important, because consumers’ like themselves do not read or look at it at all; so for themit does not really matter whether the product origin is mentioned. For the majority of participants(81%) however, there is a general agreement on the importance of labelling information, especiallyrelating to the product’s geographical origin (Africa). One of the reasons given is because they like tobe informed about the product, knowing its origin, or even getting some extra background information.Another reason also referred to was because Africa has a less intensive agriculture, not overusingpesticides, for example, and some consumers can link this to healthier agricultural products, whichmeans that this information might even add consumer value to the product. Additionally, it wasalso mentioned that since Africa is very much associated with charity campaigns, it could be anadvantage to include this information on labelling, as it would increase the consumer choice likelihood.Summarizing, the research showed a positive response to the Africaness of the product.
3.2. Quantitative Study–Conjoint Analysis
3.2.1. Most Important Attributes and Ideal Profile
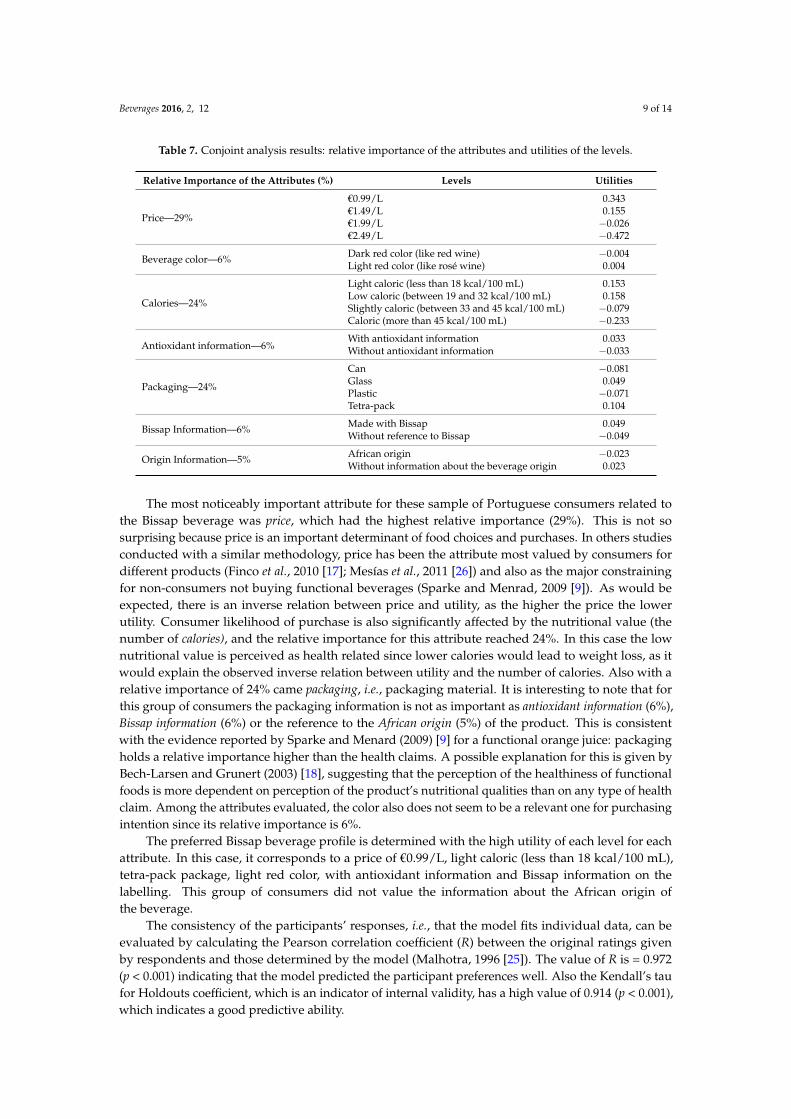
The findings from the focus groups were used as input for the first step of conjoint analysis.The attributes and levels decided are presented in Table 7. The levels are the alternative intensitiesassumed for the attributes. Based on the evaluation by the participants of the hypothetical productprofiles, and applying the Conjoint Module of the Statistical software package SPSS 19, the relativeimportance that participants attach to each attribute and the utility they attach to the levels of theseattributes were estimated. The results are presented in Table 7. For interpretation of the utility it isworth knowing that a higher value means that the attribute, or attribute level, is more important to therespondents (Malhotra, 1996 [25]). All the attributes were classified as discrete variables, although anegative linearity for price could also have been assumed, as the lower the price, the higher the benefitfor the consumers; nevertheless the results did not differ significantly.
Beverages 2016, 2, 12 9 of 14
Table 7. Conjoint analysis results: relative importance of the attributes and utilities of the levels.
Relative Importance of the Attributes (%) Levels Utilities
Price—29%
†0.99/L 0.343†1.49/L 0.155†1.99/L ´0.026†2.49/L ´0.472
Beverage color—6% Dark red color (like red wine) ´0.004Light red color (like rosé wine) 0.004
Calories—24%
Light caloric (less than 18 kcal/100 mL) 0.153Low caloric (between 19 and 32 kcal/100 mL) 0.158Slightly caloric (between 33 and 45 kcal/100 mL) ´0.079Caloric (more than 45 kcal/100 mL) ´0.233
Antioxidant information—6%With antioxidant information 0.033Without antioxidant information ´0.033
Packaging—24%
Can ´0.081Glass 0.049Plastic ´0.071Tetra-pack 0.104
Bissap Information—6% Made with Bissap 0.049Without reference to Bissap ´0.049
Origin Information—5% African origin ´0.023Without information about the beverage origin 0.023
The most noticeably important attribute for these sample of Portuguese consumers related tothe Bissap beverage was price, which had the highest relative importance (29%). This is not sosurprising because price is an important determinant of food choices and purchases. In others studiesconducted with a similar methodology, price has been the attribute most valued by consumers fordifferent products (Finco et al., 2010 [17]; Mesías et al., 2011 [26]) and also as the major constrainingfor non-consumers not buying functional beverages (Sparke and Menrad, 2009 [9]). As would beexpected, there is an inverse relation between price and utility, as the higher the price the lowerutility. Consumer likelihood of purchase is also significantly affected by the nutritional value (thenumber of calories), and the relative importance for this attribute reached 24%. In this case the lownutritional value is perceived as health related since lower calories would lead to weight loss, as itwould explain the observed inverse relation between utility and the number of calories. Also with arelative importance of 24% came packaging, i.e., packaging material. It is interesting to note that forthis group of consumers the packaging information is not as important as antioxidant information (6%),Bissap information (6%) or the reference to the African origin (5%) of the product. This is consistentwith the evidence reported by Sparke and Menard (2009) [9] for a functional orange juice: packagingholds a relative importance higher than the health claims. A possible explanation for this is given byBech-Larsen and Grunert (2003) [18], suggesting that the perception of the healthiness of functionalfoods is more dependent on perception of the product’s nutritional qualities than on any type of healthclaim. Among the attributes evaluated, the color also does not seem to be a relevant one for purchasingintention since its relative importance is 6%.
The preferred Bissap beverage profile is determined with the high utility of each level for eachattribute. In this case, it corresponds to a price of †0.99/L, light caloric (less than 18 kcal/100 mL),tetra-pack package, light red color, with antioxidant information and Bissap information on thelabelling. This group of consumers did not value the information about the African origin ofthe beverage.
The consistency of the participants’ responses, i.e., that the model fits individual data, can beevaluated by calculating the Pearson correlation coefficient (R) between the original ratings givenby respondents and those determined by the model (Malhotra, 1996 [25]). The value of R is = 0.972(p < 0.001) indicating that the model predicted the participant preferences well. Also the Kendall’s taufor Holdouts coefficient, which is an indicator of internal validity, has a high value of 0.914 (p < 0.001),which indicates a good predictive ability.
Beverages 2016, 2, 12 10 of 14
3.2.2. Consumer Performance Segmentation
The market segmentation is the process of finding groups of similar consumers in terms of somespecific criteria of relevance to the product strategic context (Lilien et al., 2007 [27]). In this study, acluster analysis was applied in order to classify participants into homogenous preference clusters.
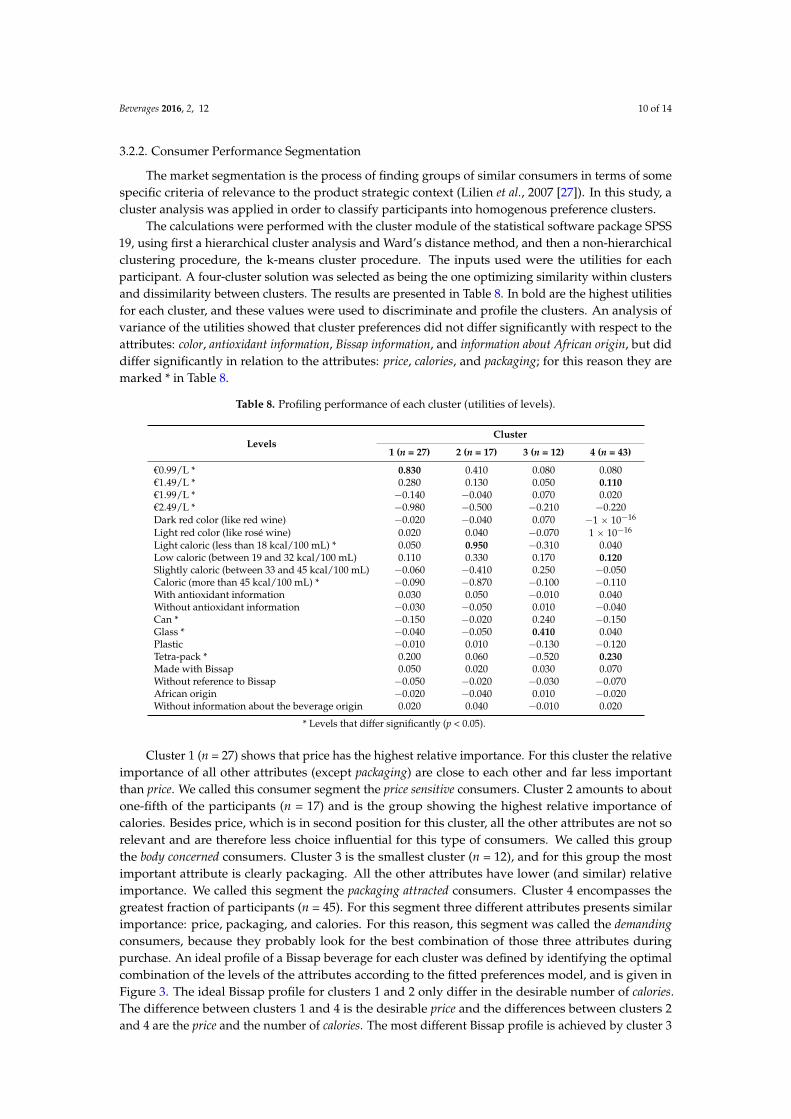
The calculations were performed with the cluster module of the statistical software package SPSS19, using first a hierarchical cluster analysis and Ward’s distance method, and then a non-hierarchicalclustering procedure, the k-means cluster procedure. The inputs used were the utilities for eachparticipant. A four-cluster solution was selected as being the one optimizing similarity within clustersand dissimilarity between clusters. The results are presented in Table 8. In bold are the highest utilitiesfor each cluster, and these values were used to discriminate and profile the clusters. An analysis ofvariance of the utilities showed that cluster preferences did not differ significantly with respect to theattributes: color, antioxidant information, Bissap information, and information about African origin, but diddiffer significantly in relation to the attributes: price, calories, and packaging; for this reason they aremarked * in Table 8.
Table 8. Profiling performance of each cluster (utilities of levels).
LevelsCluster
1 (n = 27) 2 (n = 17) 3 (n = 12) 4 (n = 43)
†0.99/L * 0.830 0.410 0.080 0.080†1.49/L * 0.280 0.130 0.050 0.110†1.99/L * ´0.140 ´0.040 0.070 0.020†2.49/L * ´0.980 ´0.500 ´0.210 ´0.220Dark red color (like red wine) ´0.020 ´0.040 0.070 ´1 ˆ 10´16
Light red color (like rosé wine) 0.020 0.040 ´0.070 1 ˆ 10´16
Light caloric (less than 18 kcal/100 mL) * 0.050 0.950 ´0.310 0.040Low caloric (between 19 and 32 kcal/100 mL) 0.110 0.330 0.170 0.120Slightly caloric (between 33 and 45 kcal/100 mL) ´0.060 ´0.410 0.250 ´0.050Caloric (more than 45 kcal/100 mL) * ´0.090 ´0.870 ´0.100 ´0.110With antioxidant information 0.030 0.050 ´0.010 0.040Without antioxidant information ´0.030 ´0.050 0.010 ´0.040Can * ´0.150 ´0.020 0.240 ´0.150Glass * ´0.040 ´0.050 0.410 0.040Plastic ´0.010 0.010 ´0.130 ´0.120Tetra-pack * 0.200 0.060 ´0.520 0.230Made with Bissap 0.050 0.020 0.030 0.070Without reference to Bissap ´0.050 ´0.020 ´0.030 ´0.070African origin ´0.020 ´0.040 0.010 ´0.020Without information about the beverage origin 0.020 0.040 ´0.010 0.020
* Levels that differ significantly (p < 0.05).
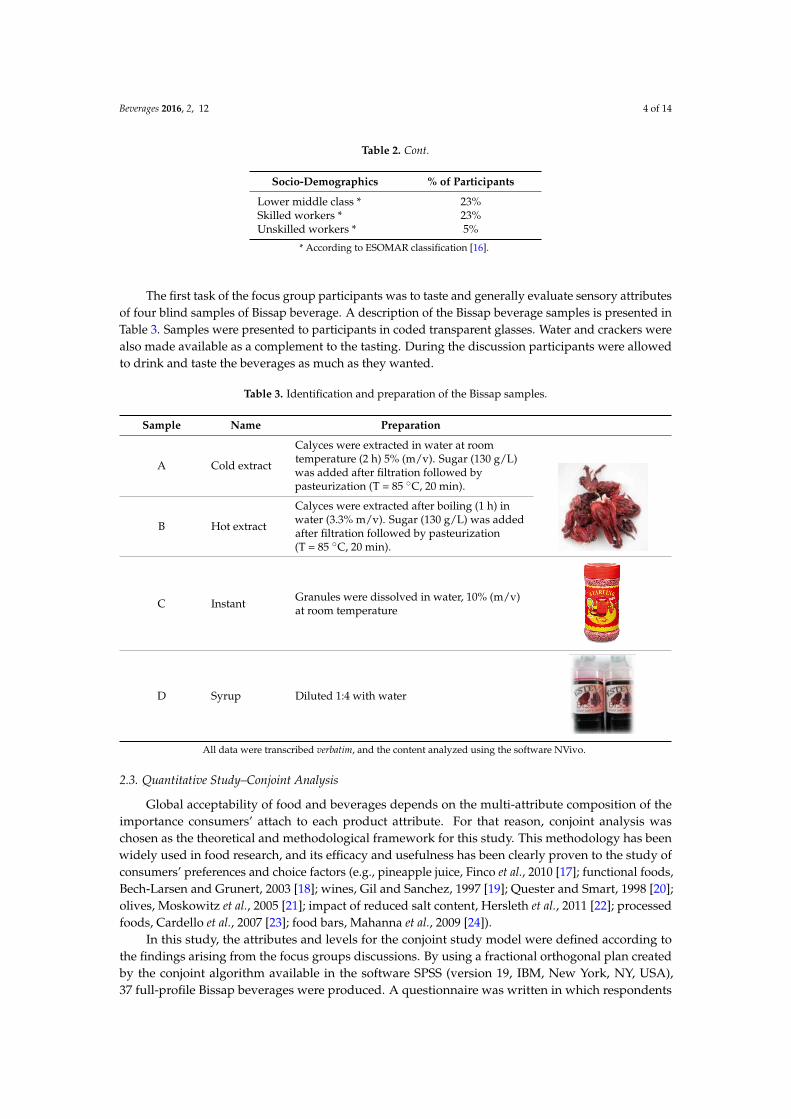
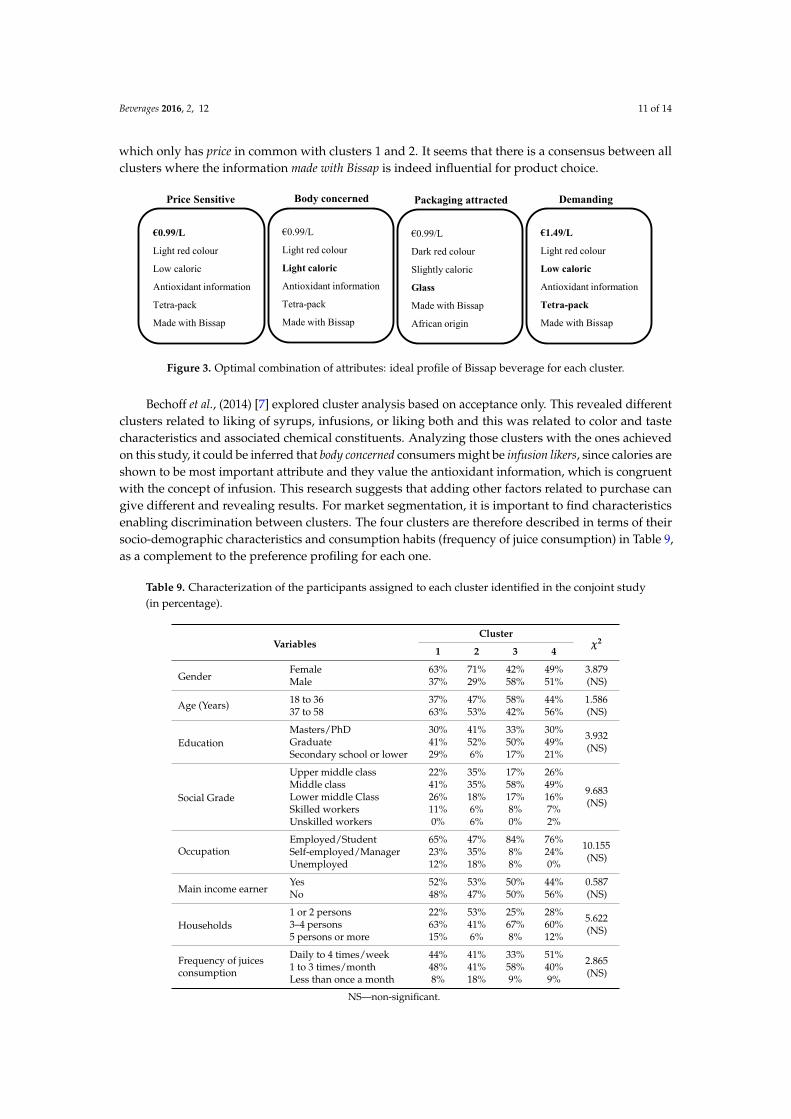
Cluster 1 (n = 27) shows that price has the highest relative importance. For this cluster the relativeimportance of all other attributes (except packaging) are close to each other and far less importantthan price. We called this consumer segment the price sensitive consumers. Cluster 2 amounts to aboutone-fifth of the participants (n = 17) and is the group showing the highest relative importance ofcalories. Besides price, which is in second position for this cluster, all the other attributes are not sorelevant and are therefore less choice influential for this type of consumers. We called this groupthe body concerned consumers. Cluster 3 is the smallest cluster (n = 12), and for this group the mostimportant attribute is clearly packaging. All the other attributes have lower (and similar) relativeimportance. We called this segment the packaging attracted consumers. Cluster 4 encompasses thegreatest fraction of participants (n = 45). For this segment three different attributes presents similarimportance: price, packaging, and calories. For this reason, this segment was called the demandingconsumers, because they probably look for the best combination of those three attributes duringpurchase. An ideal profile of a Bissap beverage for each cluster was defined by identifying the optimalcombination of the levels of the attributes according to the fitted preferences model, and is given inFigure 3. The ideal Bissap profile for clusters 1 and 2 only differ in the desirable number of calories.The difference between clusters 1 and 4 is the desirable price and the differences between clusters 2and 4 are the price and the number of calories. The most different Bissap profile is achieved by cluster 3
Beverages 2016, 2, 12 11 of 14
which only has price in common with clusters 1 and 2. It seems that there is a consensus between allclusters where the information made with Bissap is indeed influential for product choice.
Beveragesȱ2016,ȱ2,ȱ12ȱ
11
numberȱofȱcalories.ȱTheȱmostȱdifferentȱBissapȱprofileȱisȱachievedȱbyȱclusterȱ3ȱwhichȱonlyȱhasȱpriceȱinȱcommonȱwithȱ clustersȱ1ȱandȱ2.ȱ Itȱ seemsȱ thatȱ thereȱ isȱaȱ consensusȱbetweenȱallȱ clustersȱwhereȱ theȱinformationȱmadeȱwithȱBissapȱisȱindeedȱinfluentialȱforȱproductȱchoice.ȱ ȱ
ȱFigureȱ3.ȱOptimalȱcombinationȱofȱattributes:ȱidealȱprofileȱofȱBissapȱbeverageȱforȱeachȱcluster.ȱ ȱ
Bechoffȱ etȱ al.ȱ (2014)ȱ [7]ȱ exploredȱ clusterȱ analysisȱ basedȱ onȱ acceptanceȱ only.ȱ Thisȱ revealedȱdifferentȱclustersȱrelatedȱtoȱlikingȱofȱsyrups,ȱinfusions,ȱorȱlikingȱbothȱandȱthisȱwasȱrelatedȱtoȱcolorȱandȱtasteȱcharacteristicsȱandȱassociatedȱchemicalȱconstituents.ȱAnalyzingȱthoseȱclustersȱwithȱtheȱonesȱachievedȱonȱthisȱstudy,ȱ itȱcouldȱbeȱ inferredȱthatȱbodyȱconcernedȱconsumersȱmightȱbeȱ infusionȱ likers,ȱsinceȱcaloriesȱareȱshownȱtoȱbeȱmostȱimportantȱattributeȱandȱtheyȱvalueȱtheȱantioxidantȱinformation,ȱwhichȱ isȱcongruentȱwithȱ theȱconceptȱofȱ infusion.ȱThisȱresearchȱsuggestsȱ thatȱaddingȱotherȱ factorsȱrelatedȱtoȱpurchaseȱcanȱgiveȱdifferentȱandȱrevealingȱresults.ȱ ȱ
Forȱmarketȱsegmentation,ȱitȱisȱimportantȱtoȱfindȱcharacteristicsȱenablingȱdiscriminationȱbetweenȱclusters.ȱTheȱfourȱclustersȱareȱthereforeȱdescribedȱinȱtermsȱofȱtheirȱsocioȬdemographicȱcharacteristicsȱandȱ consumptionȱ habitsȱ (frequencyȱ ofȱ juiceȱ consumption)ȱ inȱ Tableȱ 9,ȱ asȱ aȱ complementȱ toȱ theȱpreferenceȱprofilingȱforȱeachȱone.ȱ ȱ
Tableȱ9.ȱCharacterizationȱofȱtheȱparticipantsȱassignedȱtoȱeachȱclusterȱidentifiedȱinȱtheȱconjointȱstudyȱ(inȱpercentage).ȱ
VariablesȱCluster
Λ2ȱ1 2 3 4ȱ
GenderȱFemaleȱ 63%ȱ 71%ȱ 42%ȱ 49%ȱ
3.879ȱ(NS)Maleȱ 37%ȱ 29%ȱ 58%ȱ 51%ȱ
Ageȱ(Years)ȱ18ȱtoȱ36ȱ 37%ȱ 47%ȱ 58%ȱ 44%ȱ
1.586ȱ(NS)37ȱtoȱ58ȱ 63%ȱ 53%ȱ 42%ȱ 56%ȱ
EducationȱMasters/PhDȱ 30%ȱ 41%ȱ 33%ȱ 30%ȱ
3.932ȱ(NS)Graduateȱ 41%ȱ 52%ȱ 50%ȱ 49%ȱSecondaryȱschoolȱorȱlowerȱ 29%ȱ 6%ȱ 17%ȱ 21%ȱ
SocialȱGradeȱ
Upperȱmiddleȱclassȱ 22%ȱ 35%ȱ 17%ȱ 26%ȱ
9.683ȱ(NS)Middleȱclassȱ 41%ȱ 35%ȱ 58%ȱ 49%ȱLowerȱmiddleȱClassȱ 26%ȱ 18%ȱ 17%ȱ 16%ȱSkilledȱworkersȱ 11%ȱ 6%ȱ 8%ȱ 7%ȱUnskilledȱworkersȱ 0%ȱ 6%ȱ 0%ȱ 2%ȱ
OccupationȱEmployed/Studentȱ 65%ȱ 47%ȱ 84%ȱ 76%ȱ
10.155ȱ(NS)ȱ
SelfȬemployed/Managerȱ 23%ȱ 35%ȱ 8%ȱ 24%ȱUnemployedȱ 12%ȱ 18%ȱ 8%ȱ 0%ȱ
MainȱincomeȱearnerȱYesȱ 52%ȱ 53%ȱ 50%ȱ 44%ȱ
0.587ȱ(NS)Noȱ 48%ȱ 47%ȱ 50%ȱ 56%ȱ
Householdsȱ1ȱorȱ2ȱpersonsȱ 22%ȱ 53%ȱ 25%ȱ 28%ȱ
5.622ȱ(NS)3–4ȱpersonsȱ 63%ȱ 41%ȱ 67%ȱ 60%ȱ5ȱpersonsȱorȱmoreȱ 15%ȱ 6%ȱ 8%ȱ 12%ȱ
Frequencyȱofȱjuicesȱconsumptionȱ
Dailyȱtoȱ4ȱtimes/weekȱ 44%ȱ 41%ȱ 33%ȱ 51%ȱ2.865ȱ(NS)1ȱtoȱ3ȱtimes/monthȱ 48%ȱ 41%ȱ 58%ȱ 40%ȱ
Lessȱthanȱonceȱaȱmonthȱ 8%ȱ 18%ȱ 9%ȱ 9%ȱ
NS—nonȬsignificant.ȱ
€0.99/L
Light red colour
Low caloric
Antioxidant information
Tetra-pack
Made with Bissap
Price Sensitive
€0.99/L
Light red colour
Light caloric
Antioxidant information
Tetra-pack
Made with Bissap
Body concerned
€0.99/L
Dark red colour
Slightly caloric
Glass
Made with Bissap
African origin
Packaging attracted
€1.49/L
Light red colour
Low caloric
Antioxidant information
Tetra-pack
Made with Bissap
Demanding
Figure 3. Optimal combination of attributes: ideal profile of Bissap beverage for each cluster.
Bechoff et al., (2014) [7] explored cluster analysis based on acceptance only. This revealed differentclusters related to liking of syrups, infusions, or liking both and this was related to color and tastecharacteristics and associated chemical constituents. Analyzing those clusters with the ones achievedon this study, it could be inferred that body concerned consumers might be infusion likers, since calories areshown to be most important attribute and they value the antioxidant information, which is congruentwith the concept of infusion. This research suggests that adding other factors related to purchase cangive different and revealing results. For market segmentation, it is important to find characteristicsenabling discrimination between clusters. The four clusters are therefore described in terms of theirsocio-demographic characteristics and consumption habits (frequency of juice consumption) in Table 9,as a complement to the preference profiling for each one.
Table 9. Characterization of the participants assigned to each cluster identified in the conjoint study(in percentage).
VariablesCluster
c21 2 3 4
GenderFemale 63% 71% 42% 49% 3.879
(NS)Male 37% 29% 58% 51%
Age (Years) 18 to 36 37% 47% 58% 44% 1.586(NS)37 to 58 63% 53% 42% 56%
EducationMasters/PhD 30% 41% 33% 30% 3.932
(NS)Graduate 41% 52% 50% 49%Secondary school or lower 29% 6% 17% 21%
Social Grade
Upper middle class 22% 35% 17% 26%
9.683(NS)
Middle class 41% 35% 58% 49%Lower middle Class 26% 18% 17% 16%Skilled workers 11% 6% 8% 7%Unskilled workers 0% 6% 0% 2%
OccupationEmployed/Student 65% 47% 84% 76% 10.155
(NS)Self-employed/Manager 23% 35% 8% 24%Unemployed 12% 18% 8% 0%
Main income earnerYes 52% 53% 50% 44% 0.587
(NS)No 48% 47% 50% 56%
Households1 or 2 persons 22% 53% 25% 28% 5.622
(NS)3–4 persons 63% 41% 67% 60%5 persons or more 15% 6% 8% 12%
Frequency of juicesconsumption
Daily to 4 times/week 44% 41% 33% 51% 2.865(NS)1 to 3 times/month 48% 41% 58% 40%
Less than once a month 8% 18% 9% 9%
NS—non-significant.
Beverages 2016, 2, 12 12 of 14
The main characteristics of each cluster are: Cluster 1—price sensitive—is characterized as beingmostly women, aged over 37. Cluster 2—body concerned—this group includes mostly women andconsumers with the lowest frequency of juice consumption. Cluster 3—packaging attracted—this clusterincludes mostly men, aged less than 37 years, who have consumed juice between one and three times amonth. Cluster 4—demanding—this cluster is characterized by consumers that are not the main incomeearner, belonging to middle class or above, and having the highest frequency of juice consumption.
Despite the identification of four different preference clusters and profiling them, it was notpossible to find significant differences (according to the Chi-square tests done) between the clusterson their descriptors. With the characteristics covered by this study, it was possible to establish thatheterogeneity between clusters was not found at a significant level, and that is a necessary criterion tobe met if one is to find a relevant segmentation (Lilien et al., 2007 [27]). Maybe using a larger sampleand/or different characteristics or attitudes related to the participants could achieve such significantdifferences. So, further studies are required to find out if there are significantly different segments.
4. Discussion between the Focus Groups and Conjoint Analysis Results
Based on the results, it was not possible to conclude the relevance of the information on theAfrican origin expressed on the packaging. According to the perception expressed by the majorityof consumers in the focus groups this attribute was classified as very important, adding value tothe product, and positively affecting purchase. However when this attribute was assessed within afull product profile, in combination with other attributes, and consumers are forced to indicate theirlikelihood to purchase, the relative importance of this attribute decreased to the point of becoming thelowest priority. Further studies should explore this issue for better clarification.
The price of †0.99/L in the conjoint study was shown to be the most relevant attribute, andone cluster was even called the price sensitive consumers. In the focus group consumers said theywere willing to pay between †1.5/L and †2/L, or even more for more attractive packaging and if thepossible health benefits of Bissap were credibly displayed. In the focus groups, consumers experiencedthe beverage, i.e., they saw, talked about, and tasted the beverage and this experience might be thereason why they stated they would be willing to pay more at the time. In addition, the focus groups’discussions were context related, which is an important factor to attach to an attribute such as the price.Another relevant issue in focus groups can be the fact that participants share opinions within a groupand some sensitive social issues may be affected, namely the price.
Another important outcome from both methods is the perception of high sugar levels evaluatedduring the tasting in the focus groups, which is confirmed by a desirable light or low caloric beveragein the conjoint study. This makes sense when the main motivation for Bissap beverage consumptionis the perceived health benefits, and the body concerned cluster is identified by the conjoint study.What is not so clear is the lowest importance attached to the antioxidant information in the conjointstudy, but again, a forced choice between product profiles gives priority to what is indeed the mostrelevant attribute.
Packaging also appears to be a relevant attribute in both methods and this outcome is therefore inagreement. It seems clear that tetra-pack and glass are the most suitable type of packaging for thisbeverage, while cans are perceived as unsuitable.
5. Limitations and Further Studies
This study was performed in Portugal with a convenient and relatively small sample ofparticipants. So, the results obtained are obviously not generalizable to the whole population. So, inorder to achieve cross-cultural validation, further studies in other European countries should beperformed, using larger sample sizes. Also, a smaller number of Bissap beverage profiles (combinationof attributes) should be tested such as sensory related ones. As significant differences between the foursegments, by using the socio-economic variables and the frequency of juice consumption, were notachieved, other variables should be tested to gain more knowledge about the possible segments of
Beverages 2016, 2, 12 13 of 14
Bissap drinkers. Results from the qualitative and quantitative studies were shown to be inconclusiveto some extent and for some aspects; this might be due to the fact that the quantitative studieswere performed with a hypothetical product. In addition, the effects of food neophobia should beinvestigated, as Bissap is relatively unfamiliar taste to Europeans. It would be interesting to use theinsights from this study to reengineer the Bissap beverage and to include sensory evaluation, foodneophobia, and product imaging together in future studies.
6. Conclusions
Bissap beverage is not commonly consumed in Europe and is largely unknown to the generalpopulation. Due to its nutritional composition, it may have great potential to be considered asa functional beverage, and this probably increases its consumer value and market acceptability.In the field of consumer food behavior studies, one of the major challenges is to identify the keyfactors for consumer acceptance and choice, so this study encompasses this goal, focusing on a Bissapbeverage for Portuguese consumers. Despite being unfamiliar with the Bissap flavor, the global sensoryappreciation of Portuguese consumers of this beverage is mostly positive. Also important insightswere given for the reengineering of the Bissap beverage in a European context. This study showsthat the original beverage has high sugar content and that consumers value more a light/low caloricbeverage. In addition, the actual composition does not seem to be compatible with a heathy beverageconcept. The four clusters of consumers identified are well discriminated in terms of their preferences:price sensitive, body concerned, packaging attracted, and demanding. These clusters confirm and highlightthe most relevant attributes for the choice of Bissap beverage: price, calories, and packaging.
The findings of this study encourage further studies to gain and disseminate more knowledge onthe acceptability of the Bissap beverage on the European market.
Acknowledgments: This study was performed within the European Seven Framework programme (EU FP7),and is part of the AFTER project (African Food Tradition Revisited by Research) under contract no. 245025.Funding of the study by the European Commission is gratefully acknowledged. More information about theproject can be found on http://www.after-fp7.eu/en/. This work was supported by National Funds from FCTthrough project PEst-OE/EQB/LA0016/2013. The authors warmly thank Ana Isabel Costa and Hans-Peter Vossfor their valuable comments on this paper.
Author Contributions: Dominique Pallet, Keith Tomlins, Ben Bennett, Manuela Pintado, and Ana Patricia Silvaconceived and designed the experiments; Ana Patricia Silva and Isabel Franco performed the experiments;Ana Patricia Silva and Miguel Sottomayor analyzed the data; Cissé Mady contributed with the samples andsample preparation; Ana Patricia Silva wrote the paper.
Conflicts of Interest: The authors declare no conflict of interest.
References
1. Mounigan, P.; Badrie, N. Roselle/sorrel (Hibiscus subdariffa L.) wines with varying calyx puree and totalsoluble solids: Sensory acceptance, quantitative descriptive and physicochemical analysis. J. Foodserv. 2006,17, 102–110.
2. Sáyago-Ayerdi, S.; Arranz, S.; Serrano, J.; Goni, I. Dietary Fiber Content and Associated AntioxidantCompounds in Roselle Flower (Hibiscus sabdariffa L.) beverage. J. Agric. Food Chem. 2007, 55, 7886–7890.[CrossRef] [PubMed]
3. Hainida, K.I.; Amin, I.; Normah, H.; Mohd.-Esa, N. Nutritional and amino acid contents of differently treatedRoselle (Hibiscus sabdariffa L.) seeds. Food Chem. 2008, 111, 906–911. [CrossRef]
4. Cisse, M.; Dornier, M.; Sakho, M.; Ndiaye, A.; Reynes, M.; Sock, O. Le Bissap (Hibiscus sabdariffa L.):Composition et principals utilisations. Fruits 2009, 64, 179–193. [CrossRef]
5. Ramırez-Rodrigues, M.M.; Balaban, M.O.; Marshall, M.R.; Rousef, R.L. Hot and Cold Water Infusion AromaProfiles of Hibiscus sabdariffa: Fresh Compared with Dried. J. Food Sci. 2011, 6, 212–217. [CrossRef][PubMed]
6. Functional Foods and Drinks (FFD). A Global Strategic Business Report; Global Industry Analysts, Inc.: San Jose,CA, USA, 2007.
Beverages 2016, 2, 12 14 of 14
7. Bechoff, A.; Cissé, M.; Fliedel, G.; Declemy, A.-L.; Ayessou, N.; Akissoe, N.; Touré, C.; Bennett, B.; Pintado, M.;Pallet, D.; et al. Relationships between anthocyanins and other compounds and sensory acceptability ofHibiscus drinks. Food Chem. 2014, 148, 112–119. [CrossRef] [PubMed]
8. Blackwell, R.; Miniard, P.; Engel, J. Consumer Behavior, 10th ed.; Thomson south-western: Mason, OH,USA, 2006.
9. Sparke, K.; Menrad, K. Cross-European and Functional Food related consumer segmentation for new productdevelopment. J. Food Prod. Mark. 2009, 15, 213–220. [CrossRef]
10. Sabbe, S.; Verbeke, W.; Deliza, R.; Matta, V.; van Damme, P. Effect of a health claim and personal characteristicson consumer acceptance of fruit juices with different concentrations of açaí (Euterpe oleracea Mart.). Appetite2009, 53, 84–92. [CrossRef] [PubMed]
11. Vidigal, M.; Minim, V.; Carvalho, N.; Milagres, M.; Gonçalves, A. Effect of a health claim on consumeracceptance of exotic Brazilian fruit juices: Açaí (Euterpe oleracea Mart.), Camu-camu (Myrciaria dubia), Cajá(Spondias lutes L.) and Umbu (Spondias tuberosa Arruda). Food Res. Int. 2011, 44, 1988–1996. [CrossRef]
12. Verbeke, W. Functional Foods: Consumer willingness to compromise on taste for health? Food Qual. Prefer.2006, 17, 126–131. [CrossRef]
13. Grunert, K.G. European consumers’ acceptance of functional foods. Ann. N. Y. Acad. Sci. 2011, 1190, 166–173.[CrossRef] [PubMed]
14. Austin, I. Preference Structure Measurement: Conjoint Analysis and Related Techniques, 2nd ed.; AmericanMarketing Association: Chicago, IL, USA, 2000.
15. Morgan, D. Focus Groups a Qualitative Research; Sage publications: Thousand Oaks, CA, USA, 1997.16. ESOMAR—Guidelines to Determine Socio-Economic Classification. Available online: http://www.esomar.
org (accessed on 1 July 2015).17. Finco, F.; Deliza, R.; Rosenthal, A.; Silca, C. The Effect of Extrinsic Product Attributes of Pineapple Juice on
Consumer Intention to Purchase. J. Int. Food Agribus. Mark. 2010, 22, 125–142. [CrossRef]18. Bech-Larsen, T.; Grunert, K. The perceived healthiness of functional foods: A conjoint study of Danish,
Finnish and American consumers’ perception of functional foods. Appetite 2003, 40, 9–14. [CrossRef]19. Gil, J.; Sanchez, M. Consumer preferences for wine attributes: A conjoint approach. Br. Food J. 1997, 99, 3–11.
[CrossRef]20. Quester, P.; Smart, J. The influence of consumption situation and product involvement over consumers use
of product attribute. J. Consum. Mark. 1998, 15, 220–238. [CrossRef]21. Moskowitz, H.; Silcher, M.; Beckeley, J.; Minkus-McKenna, D.; Mascuch, T. Sensory benefits, emotions and
usage patterns for olives: Using internet-based conjoint analysis and segmentation to understand patterns ofresponse. Food Qual. Prefer. 2005, 16, 369–382. [CrossRef]
22. Hersleth, M.; Lengard, V.; Verbeke, W.; Guerrero, L.; Naes, T. Consumers acceptance of innovations indry-cured ham: Impact of reduced salt content, prolonged aging time and new origin. Food Qual. Prefer.2011, 22, 31–41. [CrossRef]
23. Cardello, A.; Schutz, H.; Lesher, L. Consumer perceptions of foods processed by innovative and emergingtechnologies: A conjoint analytic study. Innov. Food Sci. Emerg. Technol. 2007, 8, 73–83. [CrossRef]
24. Mahanna, K.; Moskowitz, H.R.; Lee, S.Y. Assessing consumer expectations for food bars by conjoint analysis.J. Sens. Stud. 2009, 24, 851–870. [CrossRef]
25. Malhotra, N.K. Marketing Research an Applied Orientation, 2nd ed.; Prentice-Hall International, Inc.:Englewood Cliffs, NJ, USA, 1996.
26. Mesías, F.; Carrasco-Martínez, F.; Martínez, J.M.; Gaspar, P. Functional and organic eggs as an alternative toconventional production: A conjoint analysis of consumer’s preferences. J. Sci. Food Agric. 2011, 91, 532–538.[CrossRef] [PubMed]
27. Lilien, G.; Rangaswamy, A.; De Bruyn, A. Principles of Marketing Engineering; Trafford: Victoria, BC, Canada,2007; pp. 49–77.
© 2016 by the authors; licensee MDPI, Basel, Switzerland. This article is an open accessarticle distributed under the terms and conditions of the Creative Commons Attribution(CC-BY) license (http://creativecommons.org/licenses/by/4.0/).


![[hal-00263276, v1] Actes du séminaire Contradictions et ... · PDF fileabout the nature of social and organizational reality. 1also ... we have different conceptions of ... we could](https://img.dokumen.tips/doc/110x75/5aa878967f8b9a86188b9223/hal-00263276-v1-actes-du-sminaire-contradictions-et-the-nature-of-social.jpg)


