Embed Size (px)
Citation preview

First International Symposium on Flutter and its Application, 2016
BETZ ANALYSIS OF A SINGLE FLAPPING FOIL POWER GENERATOR
John Young+1, Fang-Bao Tian and Joseph C.S. Lai University of New South Wales, Canberra, Australia
The Betz limit for extraction of power from a flowing fluid is based upon an assumption of steady flow, and effects from viscosity and non-uniform pressures are ignored. Flapping foils used for power generation involve inherently highly unsteady flows, and operate most effectively when there is significant vortex shedding from the foil leading edge. This work conducts an analysis of the theoretical limits of efficiency for such an unsteady system, for the first time. Analysis of the magnitude and impact of the unsteady effects shows that the action of shed vortices as they convect downstream entrains a significant amount of momentum and kinetic energy into the wake of the foil. This entrainment is likely insufficient to render the Betz limit invalid for a single foil, however it is promising for a tandem foil system where the downstream foil benefits from this re-energisation of the upstrem foil wake, and suggests a mechanism by which the Betz limit for such a system (64%) might theoretically be exceeded.
Keywords: Flapping foil, Power generation, Betz analysis.
1. BACKGROUND
Conventional rotary turbines are generally accepted to be governed by the Betz limit in the maximum power that they can extract from a flow. This is based on an analysis of the streamtube enclosing the flow passing through the swept area of the turbine, which is treated as an idealised actuator disk1), and makes no particular assumptions about the nature of the turbine. The flow is assumed to be inviscid and steady, rotation of the flow in the wake is ignored, and ambient pressure at the far upstream and downstream ends of the streamtube as well along its outer boundary is assumed2). The analysis states that the maximum power that can be extracted from a given flow is in the ratio 16/27, or 0.5926, of that which flows through the turbine swept area.
Various models incorporating the wake rotation differ in their predictions about efficiency versus turbine blade tip speed ratio. Sorensen at al.3,4) discuss some recent controversy suggesting that at low tip speed ratios, rotary turbines may in fact substantially exceed the Betz limit.5,6) However when the effect of lateral pressure and friction forces are included in the axial momentum equation, the Betz limit is again respected at all tip speed ratios.3,4)
Vennell7) notes that the 16/27 limit can be exceeded significantly when tidal flow in a channel is considered, due to the constraints imposed by the channel walls (whereas wind turbines are usually considered operating in an infinite, unconstrained space). Incidentally this is also the source of many claims of systems exceeding the Betz limit, by using a flow constriction (e.g. a shroud) ahead of and around the turbine to speed the flow, but using the original flow speed for non-dimensionalisation.
In a similar vein, Vennell7) makes a distinction between high power, and high power coefficient non-dimensionalised by the local mean flow velocity that the turbine is exposed to, which may be much lower than the free stream velocity at the front of a turbine "farm". He thus proposes a stricter definition of the Betz limit, which poses the question of whether a turbine within a farm in a channel can generate more power than a single turbine operating at the Betz limit in the same channel.
The Betz limit for two turbines in tandem, i.e. one behind the other so that the downstream turbine is in the wake of the upstream one, is 0.648) and asymptotes to 0.66 for many turbines in tandem9). There have been some statements that flapping foils are not subject to the Betz limit9), at least for two in tandem, due to the vortical nature of the wake of the leading foil entraining additional momentum from the free stream to re-energise the wake somewhat before it encounters the trailing foil. This is supported by simulations9) of two foils in tandem achieving an efficiency of 𝜂𝜂 = 0.64, right against the Betz limit for this configuration, which
First International Symposium on Flutter and its Application, 2016 485
This document is provided by JAXA.

First International Symposium on Flutter and its Application, 2016
seems unlikely without such a mechanism. Dabiri10) also states that the Betz limit does not apply to flapping foil systems because of the unsteadiness, and that vortex dynamics could be used to exceed the Betz limit.
Flapping foil turbines are under consideration as alternatives to rotary turbines in river and tidal flow applications11,12), due to their potential for higher relative performance at lower Reynolds numbers (i.e. low flow speeds and small scales). However there is as yet no rigorous assessment of the theoretical maximum power extraction capability of flapping foils as there is for rotary systems11). This paper performs that analysis for the first time to determine whether claims of the effects of unsteady momentum and energy transport on the limits of performance have a basis in fact.
2. TIME AVERAGED FLOW OF A FLAPPING WING TURBINE
The Betz limit is derived with the assumption of steady flow2), and in the simplest form also ignores viscous effects. The efficiency of power extraction from the flow depends on the so-called `axial induction factor' defined as the fractional decrease in flow velocity between the free stream and the plane of the turbine. This in turn determines the extent to which the streamtube passing through the maximum extent of the turbine frontal area, spreads between the free stream far upstream and the wake far downstream. How may we then perform a similar analysis of the highly unsteady flow through a flapping wing turbine? A starting point is to time-average the flow field over one cycle of flapping motion (with the provision that the flow is periodic with period 𝑇𝑇 equal to that of the flapping cycle), and to obtain the streamtube passing through the maximum extent of the swept area of the flapping wing, based on the time-averaged velocities.
The unsteady flow satisfies the incompressible Navier Stokes equation (in tensor notation):
∂ui∂t
+ uj∂ui∂xj
= −1ρ∂p∂xi
+ ν ∂2ui∂xj2
(1)
The flow variables may be split into average and fluctuating terms: 𝑢𝑢𝑖𝑖 = 𝑈𝑈𝑖𝑖 + 𝑢𝑢𝑖𝑖′, 𝑝𝑝 = 𝑃𝑃 + 𝑝𝑝′ (2) where 𝑢𝑢𝑖𝑖 and 𝑝𝑝 are defined as flow variables time-averaged over one flapping cycle (using the usual overbar as shorthand for the averaging process):
𝑈𝑈𝑖𝑖 = 𝑢𝑢𝑖𝑖 = 1𝑇𝑇 ∫ 𝑢𝑢𝑖𝑖(𝑡𝑡) 𝑑𝑑𝑡𝑡𝑡𝑡+𝑇𝑇
𝑡𝑡 , 𝑃𝑃 = 𝑝𝑝 = 1T ∫ 𝑝𝑝(𝑡𝑡) 𝑑𝑑𝑡𝑡𝑡𝑡+𝑇𝑇
𝑡𝑡 (3)
and thus are independent of time. This is notationally precisely equivalent to the Reynolds Averaged Navier Stokes (RANS) process more generally employed in modeling the effects of turbulence, although noting that there is no assumption here of turbulence in the flow, and the averaging process is explicitly defined as a time-average with period equal to one flapping cycle. The time-averaged flow then satisfies the steady RANS equation:
𝑈𝑈𝑗𝑗𝜕𝜕𝑈𝑈𝑖𝑖𝜕𝜕𝑥𝑥𝑗𝑗
= − 1𝜌𝜌𝜕𝜕𝜕𝜕𝜕𝜕𝑥𝑥𝑖𝑖
+ 𝜈𝜈 𝜕𝜕2𝑈𝑈𝑖𝑖
𝜕𝜕𝑥𝑥𝑗𝑗2− 𝜕𝜕
𝜕𝜕𝑥𝑥𝑗𝑗�𝑢𝑢𝑖𝑖′𝑢𝑢𝑗𝑗′� (4)
The effect of unsteadiness in the flow is thus encompassed entirely within the Reynolds stress term
𝑅𝑅𝑖𝑖𝑗𝑗 = 𝑢𝑢𝑖𝑖′𝑢𝑢𝑗𝑗′, which manifests as a diffusive effect. There is no convection of any flow property across a streamline locally tangent to the time-averaged
velocity components 𝑈𝑈𝑖𝑖, and diffusion of momentum across streamlines via molecular viscosity is usually ignored in the Betz analysis as being small. However the Reynolds stress term now provides an additional mechanism for diffusion of momentum across the sides of the time-average streamtube, and in principle this diffusion may be large enough that it must be considered in the Betz analysis. Additional transport of kinetic energy across the streamtube sides is similarly apparent from time-averaging the conservation of energy equation.
The integral forms of conservation equations for mass, momentum and mechanical energy (i.e. ignoring changes in internal and potential energy, and no heat transfer) in a control volume constituting the streamtube enclosing the maximum extent of the turbine frontal area are used to perform the analysis in detail (Eq. 5 to 7).
JAXA Special Publication JAXA-SP-16-008E486
This document is provided by JAXA.
First International Symposium on Flutter and its Application, 2016
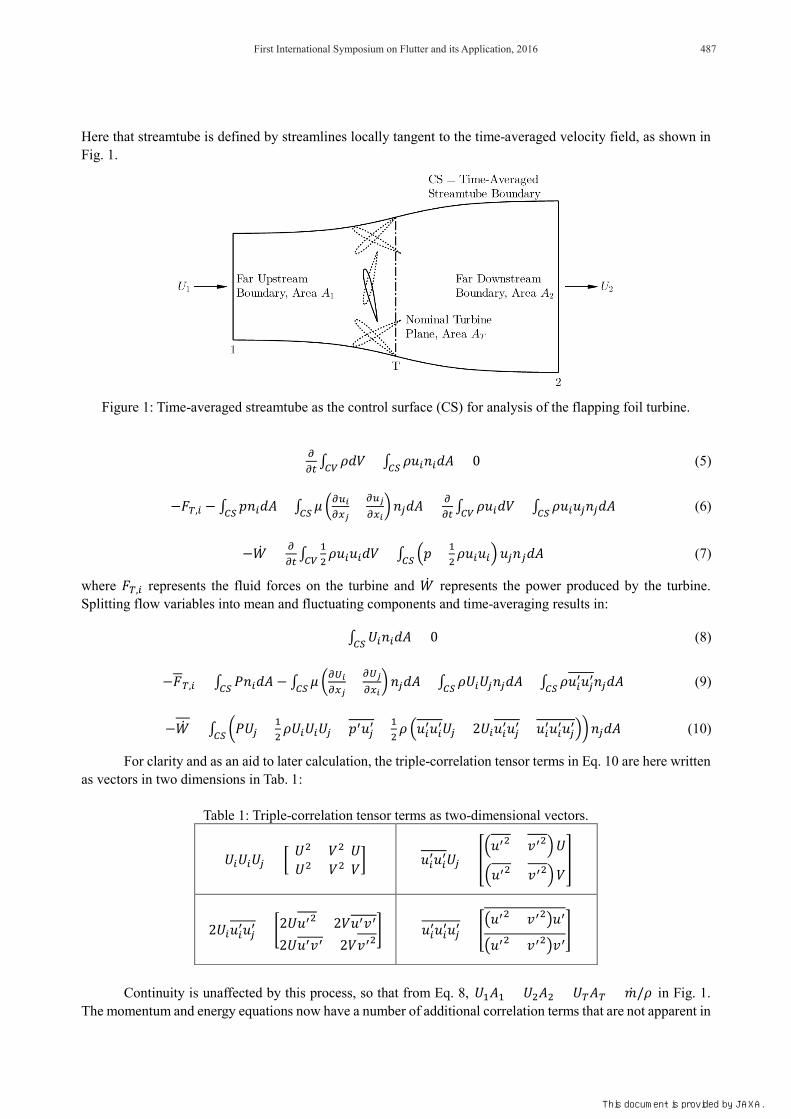
Here that streamtube is defined by streamlines locally tangent to the time-averaged velocity field, as shown in Fig. 1.
Figure 1: Time-averaged streamtube as the control surface (CS) for analysis of the flapping foil turbine.
𝜕𝜕𝜕𝜕𝜕𝜕 ∫ 𝜌𝜌𝜌𝜌𝜌𝜌𝐶𝐶𝐶𝐶 + ∫ 𝜌𝜌𝑢𝑢𝑖𝑖𝑛𝑛𝑖𝑖𝜌𝜌𝑑𝑑𝐶𝐶𝐶𝐶 = 0 (5)
−𝐹𝐹𝑇𝑇,𝑖𝑖 − ∫ 𝑝𝑝𝑛𝑛𝑖𝑖𝜌𝜌𝑑𝑑𝐶𝐶𝐶𝐶 + ∫ 𝜇𝜇 �𝜕𝜕𝑢𝑢𝑖𝑖𝜕𝜕𝑥𝑥𝑗𝑗
+ 𝜕𝜕𝑢𝑢𝑗𝑗𝜕𝜕𝑥𝑥𝑖𝑖� 𝑛𝑛𝑗𝑗𝜌𝜌𝑑𝑑𝐶𝐶𝐶𝐶 = 𝜕𝜕
𝜕𝜕𝜕𝜕 ∫ 𝜌𝜌𝑢𝑢𝑖𝑖𝜌𝜌𝜌𝜌𝐶𝐶𝐶𝐶 + ∫ 𝜌𝜌𝑢𝑢𝑖𝑖𝑢𝑢𝑗𝑗𝑛𝑛𝑗𝑗𝜌𝜌𝑑𝑑𝐶𝐶𝐶𝐶 (6)
−�̇�𝑊 = 𝜕𝜕𝜕𝜕𝜕𝜕 ∫
12𝜌𝜌𝑢𝑢𝑖𝑖𝑢𝑢𝑖𝑖𝜌𝜌𝜌𝜌𝐶𝐶𝐶𝐶 + ∫ �𝑝𝑝 + 1
2𝜌𝜌𝑢𝑢𝑖𝑖𝑢𝑢𝑖𝑖� 𝑢𝑢𝑗𝑗𝑛𝑛𝑗𝑗𝜌𝜌𝑑𝑑𝐶𝐶𝐶𝐶 (7)
where 𝐹𝐹𝑇𝑇,𝑖𝑖 represents the fluid forces on the turbine and �̇�𝑊 represents the power produced by the turbine. Splitting flow variables into mean and fluctuating components and time-averaging results in:
∫ 𝑈𝑈𝑖𝑖𝑛𝑛𝑖𝑖𝜌𝜌𝑑𝑑𝐶𝐶𝐶𝐶 = 0 (8)
−𝐹𝐹𝑇𝑇,𝑖𝑖 = ∫ 𝑃𝑃𝑛𝑛𝑖𝑖𝜌𝜌𝑑𝑑𝐶𝐶𝐶𝐶 − ∫ 𝜇𝜇 �𝜕𝜕𝑈𝑈𝑖𝑖𝜕𝜕𝑥𝑥𝑗𝑗
+ 𝜕𝜕𝑈𝑈𝑗𝑗𝜕𝜕𝑥𝑥𝑖𝑖� 𝑛𝑛𝑗𝑗𝜌𝜌𝑑𝑑𝐶𝐶𝐶𝐶 + ∫ 𝜌𝜌𝑈𝑈𝑖𝑖𝑈𝑈𝑗𝑗𝑛𝑛𝑗𝑗𝜌𝜌𝑑𝑑𝐶𝐶𝐶𝐶 + ∫ 𝜌𝜌𝑢𝑢𝑖𝑖′𝑢𝑢𝑗𝑗′𝑛𝑛𝑗𝑗𝜌𝜌𝑑𝑑𝐶𝐶𝐶𝐶 (9)
−�̇�𝑊 = ∫ �𝑃𝑃𝑈𝑈𝑗𝑗 + 12𝜌𝜌𝑈𝑈𝑖𝑖𝑈𝑈𝑖𝑖𝑈𝑈𝑗𝑗 + 𝑝𝑝′𝑢𝑢𝑗𝑗′ + 1
2𝜌𝜌 �𝑢𝑢𝑖𝑖′𝑢𝑢𝑖𝑖′𝑈𝑈𝑗𝑗 + 2𝑈𝑈𝑖𝑖𝑢𝑢𝑖𝑖′𝑢𝑢𝑗𝑗′ + 𝑢𝑢𝑖𝑖′𝑢𝑢𝑖𝑖′𝑢𝑢𝑗𝑗′��𝑛𝑛𝑗𝑗𝜌𝜌𝑑𝑑𝐶𝐶𝐶𝐶 (10)
For clarity and as an aid to later calculation, the triple-correlation tensor terms in Eq. 10 are here written as vectors in two dimensions in Tab. 1:
Table 1: Triple-correlation tensor terms as two-dimensional vectors.
𝑈𝑈𝑖𝑖𝑈𝑈𝑖𝑖𝑈𝑈𝑗𝑗 = �(𝑈𝑈2 + 𝜌𝜌2)𝑈𝑈
(𝑈𝑈2 + 𝜌𝜌2)𝜌𝜌� 𝑢𝑢𝑖𝑖′𝑢𝑢𝑖𝑖′𝑈𝑈𝑗𝑗 = �
�𝑢𝑢′2 + 𝑣𝑣′2�𝑈𝑈
�𝑢𝑢′2 + 𝑣𝑣′2�𝜌𝜌�
2𝑈𝑈𝑖𝑖𝑢𝑢𝑖𝑖′𝑢𝑢𝑗𝑗′ = �2𝑈𝑈𝑢𝑢′2 + 2𝜌𝜌𝑢𝑢′𝑣𝑣′
2𝑈𝑈𝑢𝑢′𝑣𝑣′ + 2𝜌𝜌𝑣𝑣′2� 𝑢𝑢𝑖𝑖′𝑢𝑢𝑖𝑖′𝑢𝑢𝑗𝑗′ = �
�𝑢𝑢′2 + 𝑣𝑣′2�𝑢𝑢′
�𝑢𝑢′2 + 𝑣𝑣′2�𝑣𝑣′�
Continuity is unaffected by this process, so that from Eq. 8, 𝑈𝑈1𝑑𝑑1 = 𝑈𝑈2𝑑𝑑2 = 𝑈𝑈𝑇𝑇𝑑𝑑𝑇𝑇 = �̇�𝑚/𝜌𝜌 in Fig. 1.
The momentum and energy equations now have a number of additional correlation terms that are not apparent in
First International Symposium on Flutter and its Application, 2016 487
This document is provided by JAXA.

First International Symposium on Flutter and its Application, 2016
steady flow, which may be directly calculated and their effect quantified. In turbulence modeling the Reynolds stress term cannot be determined exactly and is the subject of a
closure problem. Here however we may directly compute the unsteady correlation terms, 𝑅𝑅𝑖𝑖𝑖𝑖 for example, by solving the unsteady flow 𝑢𝑢𝑖𝑖, 𝑢𝑢𝑖𝑖 then time-averaging to obtain: 𝑅𝑅𝑖𝑖𝑖𝑖 = 𝑢𝑢𝑖𝑖′𝑢𝑢𝑖𝑖′ = 𝑢𝑢𝑖𝑖𝑢𝑢𝑖𝑖 − 𝑈𝑈𝑖𝑖𝑈𝑈𝑖𝑖 (11)
3. IMPLICATIONS FOR THE BETZ ANALYSIS OF A SINGLE FOIL SYSTEM
The horizontal components of Eq. 9 and 10 are rewritten as:
𝐹𝐹𝑇𝑇,𝑥𝑥 = 𝐶𝐶𝛼𝛼12�̇�𝑚𝑈𝑈1 − ∫ 𝜌𝜌𝑈𝑈𝑈𝑈𝑖𝑖𝑛𝑛𝑖𝑖𝑑𝑑𝑑𝑑𝐶𝐶𝐶𝐶 = 1
2�̇�𝑚𝑈𝑈1(𝐶𝐶𝐹𝐹𝐹𝐹 + 𝐶𝐶𝛼𝛼) (12)
�̇�𝑊 = 𝐶𝐶𝛽𝛽12�̇�𝑚𝑈𝑈12 − ∫ 𝜌𝜌𝑈𝑈𝑖𝑖𝑈𝑈𝑖𝑖𝑈𝑈𝑖𝑖𝑛𝑛𝑖𝑖𝑑𝑑𝑑𝑑𝐶𝐶𝐶𝐶 = 1
2�̇�𝑚𝑈𝑈12�𝐶𝐶𝑊𝑊𝑊𝑊𝑊𝑊 + 𝐶𝐶𝛽𝛽� (13)
𝐶𝐶𝛼𝛼 = 112�̇�𝑚𝑈𝑈1
(𝐹𝐹𝑃𝑃 + 𝐹𝐹𝑉𝑉 + 𝐹𝐹𝑅𝑅) = 𝐶𝐶𝐹𝐹𝑃𝑃 + 𝐶𝐶𝐹𝐹𝑉𝑉 + 𝐶𝐶𝐹𝐹𝑅𝑅 (14)
𝐶𝐶𝛽𝛽 = 112�̇�𝑚𝑈𝑈12
��̇�𝑊𝑃𝑃𝑃𝑃 + �̇�𝑊𝑃𝑃𝐹𝐹 + �̇�𝑊𝑃𝑃 + �̇�𝑊𝐵𝐵 + �̇�𝑊𝐶𝐶� = 𝐶𝐶𝑊𝑊𝑃𝑃𝑃𝑃 + 𝐶𝐶𝑊𝑊𝑃𝑃𝐹𝐹 + 𝐶𝐶𝑊𝑊𝑃𝑃 + 𝐶𝐶𝑊𝑊𝐵𝐵 + 𝐶𝐶𝑊𝑊𝐶𝐶 (15)
where the coefficients 𝐶𝐶𝛼𝛼 and 𝐶𝐶𝛽𝛽 encompass all the effects due to Reynolds averaging of the unsteady terms, as well as the pressure and viscous terms, leaving just the momentum and power terms due to average velocities remaining in Eq. 12 and 13 (these being the only ones normally accounted in the Betz analysis). The Reynolds average, pressure and viscous pressure-based force and power contributions to the coefficients 𝐶𝐶𝛼𝛼 and 𝐶𝐶𝛽𝛽 are described in Tab. 2.
Table 2: Reynolds average, pressure and viscous force and power contributions.
𝐶𝐶𝐹𝐹𝑃𝑃 = − 112�̇�𝑚𝑈𝑈1
∫ 𝑃𝑃𝑛𝑛𝑥𝑥𝑑𝑑𝑑𝑑𝐶𝐶𝐶𝐶 𝐶𝐶𝐹𝐹𝑉𝑉 = 112�̇�𝑚𝑈𝑈1
∫ 𝜇𝜇 �𝜕𝜕𝑈𝑈𝜕𝜕𝑥𝑥𝑗𝑗
+ 𝜕𝜕𝑈𝑈𝑗𝑗𝜕𝜕𝑥𝑥� 𝑛𝑛𝑖𝑖𝑑𝑑𝑑𝑑𝐶𝐶𝐶𝐶 𝐶𝐶𝐹𝐹𝑅𝑅 = − 1
12�̇�𝑚𝑈𝑈1
∫ 𝜌𝜌𝑢𝑢′𝑢𝑢𝑖𝑖′𝑛𝑛𝑖𝑖𝑑𝑑𝑑𝑑𝐶𝐶𝐶𝐶
𝐶𝐶𝑊𝑊𝑃𝑃𝑃𝑃 = − 112�̇�𝑚𝑈𝑈12
∫ 𝑃𝑃𝑈𝑈𝑖𝑖𝑛𝑛𝑖𝑖𝑑𝑑𝑑𝑑𝐶𝐶𝐶𝐶 𝐶𝐶𝑊𝑊𝑃𝑃𝐹𝐹 = − 112�̇�𝑚𝑈𝑈12
∫ 𝑝𝑝′𝑢𝑢𝑖𝑖′𝑛𝑛𝑖𝑖𝑑𝑑𝑑𝑑𝐶𝐶𝐶𝐶
𝐶𝐶𝑊𝑊𝑃𝑃 = − 112�̇�𝑚𝑈𝑈12
∫ 12𝜌𝜌𝑢𝑢𝑖𝑖′𝑢𝑢𝑖𝑖′𝑈𝑈𝑖𝑖𝑛𝑛𝑖𝑖𝑑𝑑𝑑𝑑𝐶𝐶𝐶𝐶 𝐶𝐶𝑊𝑊𝐵𝐵 = − 1
12�̇�𝑚𝑈𝑈12
∫ 𝜌𝜌𝑈𝑈𝑖𝑖𝑢𝑢𝑖𝑖′𝑢𝑢𝑖𝑖′𝑛𝑛𝑖𝑖𝑑𝑑𝑑𝑑𝐶𝐶𝐶𝐶 𝐶𝐶𝑊𝑊𝐶𝐶 = − 112�̇�𝑚𝑈𝑈12
∫ 12𝜌𝜌𝑢𝑢𝑖𝑖′𝑢𝑢𝑖𝑖′𝑢𝑢𝑖𝑖′𝑛𝑛𝑖𝑖𝑑𝑑𝑑𝑑𝐶𝐶𝐶𝐶
We take the usual step of equating the power extracted by the turbine, with the force on the turbine
multiplied by the average horizontal velocity through the turbine plane 𝑈𝑈𝑇𝑇, and then solving for this velocity: �̇�𝑊 = 𝐹𝐹𝑇𝑇,𝑥𝑥𝑈𝑈𝑇𝑇 (16)
𝑈𝑈𝑇𝑇 =𝐶𝐶𝛽𝛽
12�̇�𝑚𝑈𝑈12+
12𝜌𝜌𝑈𝑈1
2𝑈𝑈1𝑃𝑃1−12𝜌𝜌𝑈𝑈2
2𝑈𝑈2𝑃𝑃2𝐶𝐶𝛼𝛼
12�̇�𝑚𝑈𝑈1+𝜌𝜌�𝑈𝑈12𝑃𝑃1−𝑈𝑈22𝑃𝑃2�
= 𝐶𝐶𝛽𝛽𝑈𝑈12+𝑈𝑈12−𝑈𝑈22
𝐶𝐶𝛼𝛼𝑈𝑈1+2(𝑈𝑈1−𝑈𝑈2) (17)
where it is noted that the only places on the control surface where the time-averaged velocity is not orthogonal to the local outward normal are the inlet and exit. The horizontal time-averaged velocity components at the CS inlet and exit, 𝑈𝑈1 and 𝑈𝑈2 are taken to be uniform across those boundaries, and the vertical components 𝑉𝑉1 and 𝑉𝑉2 are ignored as small relative to the horizontal components. These assumptions are examined for two example cases in Sec. 4. As a check, if 𝐶𝐶𝛼𝛼 = 𝐶𝐶𝛽𝛽 = 0 (indicating no unsteadiness and no mean pressure flow work, i.e. �̇�𝑊𝑃𝑃𝑃𝑃 = 0) then we recover the usual 𝑈𝑈𝑇𝑇 = (𝑈𝑈1 + 𝑈𝑈2)/2.
The efficiency of power extraction is:
𝜂𝜂 = �̇�𝑊12𝜌𝜌𝑈𝑈1
3𝑃𝑃𝑇𝑇=
𝐶𝐶𝛽𝛽12�̇�𝑚𝑈𝑈12+
12𝜌𝜌𝑈𝑈1
2𝑈𝑈1𝑃𝑃1−12𝜌𝜌𝑈𝑈2
2𝑈𝑈2𝑃𝑃212𝜌𝜌𝑈𝑈1
3𝑃𝑃𝑇𝑇= 𝑈𝑈𝑇𝑇
𝑈𝑈1�𝐶𝐶𝛽𝛽𝑈𝑈1
2+𝑈𝑈12−𝑈𝑈22
𝑈𝑈12� (18)
JAXA Special Publication JAXA-SP-16-008E488
This document is provided by JAXA.

First International Symposium on Flutter and its Application, 2016
Substituting Eq. 17 and defining 𝑎𝑎 = 𝑈𝑈2/𝑈𝑈1 gives:
𝜂𝜂 = �𝐶𝐶𝛽𝛽+1−𝑎𝑎2�2
𝐶𝐶𝛼𝛼+2(1−𝑎𝑎) (19)
Differentiating with respect to 𝑎𝑎 and setting the result to zero to find the 𝑎𝑎 value for maximum efficiency gives:
𝑎𝑎𝑜𝑜𝑜𝑜𝑜𝑜 = 13�2 + 𝐶𝐶𝛼𝛼 − �1 + 𝐶𝐶𝛼𝛼2 + 4𝐶𝐶𝛼𝛼 − 3𝐶𝐶𝛽𝛽� (20)
𝜂𝜂𝑚𝑚𝑎𝑎𝑚𝑚 =�9+9𝐶𝐶𝛽𝛽−�2+𝐶𝐶𝛼𝛼−�1+𝐶𝐶𝛼𝛼2+4𝐶𝐶𝛼𝛼−3𝐶𝐶𝛽𝛽�
2�2
27�2+𝐶𝐶𝛼𝛼+2�1+𝐶𝐶𝛼𝛼2+4𝐶𝐶𝛼𝛼−3𝐶𝐶𝛽𝛽� (21)
where again as a check we note that when 𝐶𝐶𝛼𝛼 = 𝐶𝐶𝛽𝛽 = 0 we recover the well-known 𝑎𝑎𝑜𝑜𝑜𝑜𝑜𝑜 = 1/3, 𝑈𝑈𝑇𝑇/𝑈𝑈1 =
2/3 and 𝜂𝜂𝑚𝑚𝑎𝑎𝑚𝑚 = 16/27. Operating under the constraint 1 + 𝐶𝐶𝛼𝛼2 + 4𝐶𝐶𝛼𝛼 − 3𝐶𝐶𝛽𝛽 ≥ 0 we can determine that there exist numerical
combinations of 𝐶𝐶𝛼𝛼 and 𝐶𝐶𝛽𝛽 that result in 𝜂𝜂𝑚𝑚𝑎𝑎𝑚𝑚 > 16/27 (0.5926) . Combining this with the further constraints that 0 < 𝑎𝑎𝑜𝑜𝑜𝑜𝑜𝑜 < 1 (i.e. the downstream flow velocity remains both positive and less than the upstream velocity) and 𝜂𝜂𝑚𝑚𝑎𝑎𝑚𝑚 < 1 (the turbine cannot extract more energy than exists in the flow) results in the region shown in Fig. 2, suggesting that in principle the Betz limit may be exceeded. The question then becomes whether these numerical values are physically realistic or indeed possible for the flapping foil turbine.
Figure 2: Region of 𝐶𝐶𝛼𝛼 and 𝐶𝐶𝛽𝛽 space (shaded) for which 16/27 < 𝜂𝜂𝑚𝑚𝑎𝑎𝑚𝑚 < 1 and 0 < 𝑎𝑎𝑜𝑜𝑜𝑜𝑜𝑜 < 1, from Eq. 20
and 21. For example, leaving 𝐶𝐶𝛽𝛽 = 0, positive values of 𝐶𝐶𝛼𝛼 reduce 𝜂𝜂𝑚𝑚𝑎𝑎𝑚𝑚, but −0.26795 < 𝐶𝐶𝛼𝛼 < 0 results in
0.7698 > 𝜂𝜂𝑚𝑚𝑎𝑎𝑚𝑚 > 0.5926. This would require either the net force due to non-uniform pressure on the control surface to be negative (pressure at the downstream CS outlet higher than at the inlet, which is not physically realistic), or the viscous force on the sides of the CS to be negative (again not physically realistic given that the flow on the CS sides is in the downstream direction), or that there is a net transport of momentum out of the CS sides due to unsteady effects. Whether the latter is realistic is not immediately apparent, but is evaluated in Sec. 4. Alternatively, leaving 𝐶𝐶𝛼𝛼 = 0 , 𝜂𝜂𝑚𝑚𝑎𝑎𝑚𝑚 > 16/27 for 0 < 𝐶𝐶𝛽𝛽 < 0.25 . The �̇�𝑊𝑃𝑃𝑃𝑃 component due to non-uniform pressure would be zero along the CS sides (no time average flow across the boundary) but would be expected to be small and positive from contributions at the CS inlet and outlet since again 𝑃𝑃1 < 𝑃𝑃2 is not physically realistic. Similarly the �̇�𝑊𝑃𝑃 component (transport of turbulent kinetic energy by the mean flow) along the CS sides is zero, and should be small overall due to unsteady kinetic energy differences at the CS inlet and
First International Symposium on Flutter and its Application, 2016 489
This document is provided by JAXA.

First International Symposium on Flutter and its Application, 2016
exit far from the turbine. The expected sign and magnitude of the other terms comprising 𝐶𝐶𝛽𝛽 are again harder to estimate without direct evaluation as in Sec. 4.
4. EVALUATION OF PRESSURE AND VELOCITY CORRELATION TERMS
The two-dimensional unsteady viscous incompressible flow around a flapping foil was simulated with an in-house sharp-interface immersed-boundary method Navier-Stokes solver.13,14) Two flapping parameter combinations were chosen to examine the relative size and impact of each of the terms comprising 𝐶𝐶𝛼𝛼 and 𝐶𝐶𝛽𝛽 in Sec. 3. The two cases were taken from Kinsey and Dumas15), representing the most efficient case from that study, and a low efficiency case for comparison.
(1) Single Foil High Efficiency Case
In Case 1 a NACA0015 aerofoil section oscillates in heave 𝑦𝑦(𝑡𝑡) = ℎ𝑐𝑐 sin(𝜔𝜔𝑡𝑡) and pitch 𝜃𝜃(𝑡𝑡) =𝜃𝜃0 sin(𝜔𝜔𝑡𝑡 + 𝜙𝜙), pitching about the 1/3 chord point with heave amplitude ℎ = 1.0 chords, pitch amplitude 𝜃𝜃0 = 76.3°, pitch leading heave with phase 𝜙𝜙 = 90°, non-dimensional frequency 𝑓𝑓∗ = 𝜔𝜔𝑐𝑐/2𝜋𝜋𝑈𝑈1 = 0.14, at Reynolds number 𝑅𝑅𝑅𝑅 = 1100. This case serves also as a validation of the solver and mesh, conducted and reported in Tian et. al.14) and repeated in Tab. 3 showing the time-averaged power coefficient based on the foil chord 𝑐𝑐 and (unit) span 𝑏𝑏, and the efficiency based on foil swept area 𝐴𝐴𝑇𝑇. The computational domain is a 25𝑐𝑐 × 20𝑐𝑐 rectangular box discretised by 461 × 413 Cartesian nodes. The domain boundaries are thus 5c upstream, 20c downstream, and 10c cross-stream from the foil pivot point. The Cartesian grid is uniform in both 𝑥𝑥 and 𝑦𝑦 directions within a 4𝑐𝑐 × 4𝑐𝑐 inner box enclosing the flapping foil, with grid spacing of ∆𝑥𝑥 = Δ𝑦𝑦 =0.0133𝑐𝑐. The grid is stretched in the remainder of the domain. In one flapping cycle, 2000 time steps were applied. To validate the mesh size convergence, simulations of finer mesh (∆𝑥𝑥 = Δ𝑦𝑦 = 0.008𝑐𝑐) and coarser mesh (∆𝑥𝑥 = Δ𝑦𝑦 = 0.02𝑐𝑐) were conducted. The medium mesh was chosen for the remainder of the present work based on agreement within 2% with both the fine mesh and Kinsey and Dumas15) results.
Table 3: Mesh refinement validation against previous published work.
Source Power Coefficient
𝐶𝐶𝑃𝑃 = �̇�𝑊/ 12𝜌𝜌𝑈𝑈13𝑏𝑏𝑐𝑐
Efficiency
𝜂𝜂 = �̇�𝑊/ 12𝜌𝜌𝑈𝑈13𝐴𝐴𝑇𝑇 (%)
Coarse, ∆𝑥𝑥 = Δ𝑦𝑦 = 0.02𝑐𝑐 0.828 32.3
Medium, ∆𝑥𝑥 = Δ𝑦𝑦 = 0.0133𝑐𝑐 0.878 34.2
Fine, ∆𝑥𝑥 = Δ𝑦𝑦 = 0.008𝑐𝑐 0.861 33.6
Kinsey and Dumas15) 0.860 33.7 Fig. 3 shows the time-averaged values of the non-dimensional velocity field magnitude, pressure
coefficient, and non-dimensional vorticity, with the control surface 𝐶𝐶𝐶𝐶 defined as the streamlines based on the time-averaged velocities 𝑈𝑈 and 𝑉𝑉 passing through the maximum extent of the swept area of the flapping wing. This may be compared to the schematic of the situation shown in Fig. 1. In the velocity field we see some unexpected features, such as the lowest velocity point in the wake not immediately behind the turbine plane but some 4 to 5 chord lengths downstream, as well as a non-monotonic variation of velocity magnitude along the streamtube boundaries. Similarly in the pressure field there is an x-shaped structure of low pressure that extends significantly downstream of the turbine and again leads to a non-monotonic variation of pressure along the streamtube boundaries. The low pressure regions are seen to correspond closely to the regions of high vorticity magnitude, indicating the paths of vortices shed from the leading edge of the foil during the flapping cycle and convecting downstream. This suggests that unsteady effects will make a significant contribution to the time-average behaviour of the system.
Each of the terms in Eq. 12 to 15 are now integrated on the control surface shown in Fig. 3, to determine
JAXA Special Publication JAXA-SP-16-008E490
This document is provided by JAXA.

First International Symposium on Flutter and its Application, 2016
their respective contributions to the time-average force and power output from the flapping foil turbine. The upstream and downstream boundaries (inlet and exit of the streamtube) are placed at x/c = −4.5 and x/𝑐𝑐 = 19.5 respectively, just inside the boundaries of the computational domain.
Figure 3: Time averaged values of non-dimensional 𝑈𝑈𝑚𝑚𝑚𝑚𝑚𝑚 = √𝑈𝑈2 + 𝑉𝑉2/𝑈𝑈1(top), pressure coefficient 𝐶𝐶𝑃𝑃
(middle) and non-dimensional vorticity Ω𝑐𝑐/𝑈𝑈1 (anticlockwise positive, bottom) for Case 1. White region in each plot indicates the area swept by the foil, black lines show the control volume.
Fig. 4 shows the contribution of each of the terms in Tab. 2, as functions of distance along the streamtube
sides. Here the upstream control volume boundary is kept fixed at x/𝑐𝑐 = −4.5, and the contributions integrated from that point to a variable point represented by the x/𝑐𝑐 coordinate. We see weak force contributions from viscous effects and pressure along the streamtube sides, but a strong diffusion of unsteady momentum from the Reynolds stress (represented by the 𝐶𝐶𝐹𝐹𝐹𝐹 term) into the streamtube between 0 and 5 chords downstream of the foil pivot. Momentum is removed between 5 and 7.5 chords, then increases again further downstream. Examining the power contributions, 𝐶𝐶𝑊𝑊𝑃𝑃𝑊𝑊 and 𝐶𝐶𝑊𝑊𝑊𝑊 are exactly zero as expected due to the time-averaged flow field being aligned to the streamtube sides. There is a relatively weak negative contribution in 𝐶𝐶𝑊𝑊𝑃𝑃𝐹𝐹 (power reduced by correlation of fluctuating pressure and velocity), and a stronger negative contribution in 𝐶𝐶𝑊𝑊𝑊𝑊 (transport of turbulent kinetic energy by fluctuating velocities) from 7.5 chords onwards. These are more than balanced by a strong contribution in 𝐶𝐶𝑊𝑊𝑊𝑊 (flow work done by the Reynolds stresses) with the same spatial distribution as 𝐶𝐶𝐹𝐹𝐹𝐹 . The regions of strong inwards diffusion of unsteady momentum and kinetic energy correspond to the regions of high vortcity in Fig. 3, where the shed vortex paths come close to the streamtube
First International Symposium on Flutter and its Application, 2016 491
This document is provided by JAXA.

First International Symposium on Flutter and its Application, 2016
sides and would appear to be instrumental in drawing in momentum and kinetic energy into the wake of the foil, as proposed by Kinsey and Dumas9).
The contributions are further tabulated in Tab. 4, separately for the inlet, exit, and compete sides of the streamtube, and as a combined total. Thus the values for the sides here correspond to the x/𝑐𝑐 = 19.5 values plotted in Fig. 4.
Figure 4: Force and power coefficient contributions as functions of distance along the streamtube sides, Case 1.
Table 4. Force and power contributions integrated on the control surface, Case 1 (high efficiency). *Total values
in parentheses are excluding the inlet and exit values of 𝐶𝐶𝐹𝐹𝐹𝐹 and 𝐶𝐶𝑊𝑊𝐹𝐹𝑊𝑊, as discussed in the text..
Inlet Exit Sides Total
𝐶𝐶𝐹𝐹𝐹𝐹 1.9985 -1.3990 0.0 0.5995
𝐶𝐶𝐹𝐹𝐹𝐹 0.1166 0.1969 -0.0261 0.2873
𝐶𝐶𝐹𝐹𝐹𝐹 0.0 0.0 0.0141 0.0141
𝐶𝐶𝐹𝐹𝐹𝐹 0.0 -0.0118 0.3184 0.3066
𝐶𝐶𝛼𝛼 0.1166 0.1851 0.3064 0.6080 (0.2945)*
𝐶𝐶𝑊𝑊𝑊𝑊𝑊𝑊 1.9972 -0.9834 0.0 1.0138
𝐶𝐶𝑊𝑊𝐹𝐹𝑊𝑊 0.1165 0.1380 0.0 0.2545
𝐶𝐶𝑊𝑊𝐹𝐹𝐹𝐹 0.0 -0.0039 -0.0379 -0.0418
𝐶𝐶𝑊𝑊𝑊𝑊 0.0 -0.0555 0.0 -0.0555
𝐶𝐶𝑊𝑊𝑊𝑊 0.0 -0.0083 0.2677 0.2594
𝐶𝐶𝑊𝑊𝑊𝑊 0.0 0.0001 -0.1244 -0.1243 𝐶𝐶𝛽𝛽 0.1165 0.0704 0.1054 0.2922 (0.0378)*
Examining the values of 𝐶𝐶𝛼𝛼 and 𝐶𝐶𝛽𝛽 we see that they fall well within the shaded region of Fig. 2,
however the pressure field plotted in Fig. 3 shows that the pressure at the upstream and downstream boundaries of the streamtube is still significantly different from the free-stream value. The original Betz analysis ignores any such pressure contributions at the inlet and exit, assuming that the pressure here are equal to the free stream,
JAXA Special Publication JAXA-SP-16-008E492
This document is provided by JAXA.

First International Symposium on Flutter and its Application, 2016
and also ignores any contributions from pressure variation along the streamtube sides. It is clear from Fig. 3 that the upstream and downstream boundaries are insufficiently far from the foil to bring the pressure to near free-stream. It is also worth noting that even 20 chords downstream, the contributions in Fig. 4 have not yet asymptoted to fixed values. Future work will extend the simulations to larger domains, but for this work the 𝐶𝐶𝛼𝛼 and 𝐶𝐶𝛽𝛽 totals are also given with the simple expedient of neglecting the inlet and exit contributions from 𝐶𝐶𝐹𝐹𝐹𝐹 and 𝐶𝐶𝑊𝑊𝐹𝐹𝑊𝑊 . This modification places the coefficients close to but outside the shaded region in Fig. 2. Nevertheless, this analysis shows that for this set of flapping kinematics parameters, there are effects ignored in the standard Betz analysis that make a strong contribution to the force and power output. This is particularly true of the force due to diffusion of unsteady momentum across the streamtube sides which is approximately half that due to momentum in and out of the streamtube through the inlet and exit.
(2) Single Foil Low Efficiency Case
In Case 2 the pitch amplitude is 𝜃𝜃0 = 40.0°, non-dimensional frequency 𝑓𝑓∗ = 0.10, and all other parameters remain unchanged. Kinsey and Dumas15) estimated the efficiency of this parameter combination as 5%, with our estimate as 4% in good agreement. For this kinematics there is little evidence of leading edge vortex shedding in contrast to Case 1, since the angle of attack on the foil remains small throughout the flapping cycle and the vorticity is shed symmetrically from the trailing edge. This can be seen in Fig. 5, as can the low efficiency as shown by the minimal spreading of the streamtube. Fig. 6 shows the unsteady force contributions, which are an order of magnitude smaller than for Case 1. Using the same procedure as for Case 1 we find values of 𝐶𝐶𝛼𝛼 = 0.0772 and 𝐶𝐶𝛽𝛽 = 0.0576, or with the inlet and exit values of 𝐶𝐶𝐹𝐹𝐹𝐹 and 𝐶𝐶𝑊𝑊𝐹𝐹𝑊𝑊 discounted we have 𝐶𝐶𝛼𝛼 = 0.0490 and 𝐶𝐶𝛽𝛽 = 0.0300, showing only very small unsteady effects in this case.
Figure 5: Time averaged non-dimensional vorticity Ω𝑐𝑐/𝑈𝑈1 (anticlockwise positive) for Case 2.
Figure 6: Force coefficient contributions as functions of distance along the streamtube sides, Case 2.
5. CONCLUSIONS
Both the high efficiency case and the low efficiency case considered here yielded values of 𝐶𝐶𝛼𝛼 and 𝐶𝐶𝛽𝛽
First International Symposium on Flutter and its Application, 2016 493
This document is provided by JAXA.

First International Symposium on Flutter and its Application, 2016
that fell outside the shaded region of Fig. 2, indicating that the effects of diffusion of unsteady momentum and kinetic energy across the time-average streamtube boundary were insufficient to allow violation of the Betz limit. However in the high efficiency case, these effects were significant and promising - the action of the vortices shed from the leading edge of the foil during the flapping cycle is to draw momentum and energy into the wake, in a manner not accounted by the standard Betz analysis. This suggests that a second foil in tandem, at the correct downstream location, may benefit from these effects and might indeed account for the high efficiencies for tandem foils reported in the literature9), right up against the tandem-foil Betz limit. A similar analysis as the present work, for such a tandem arrangement, will accordingly be the focus of future work.
ACKNOWLEDGMENTS
This work was supported under the Australian Research Council’s Discovery Projects funding scheme (project number DP130103850), and conducted with the assistance of resources from the Australian National Computational Infrastructure (NCI).
REFERENCES 1) Betz, A. Das Maximum der theoretisch möglichen Ausnützung des Windes durch Windmotoren, Z.
Gesamte Turbinenwesen, Vol. 26, .pp. 307–9, 1920. 2) Manwell, J.F., McGowan, J.G. and Rogers, A.L. Wind Energy Explained, John Wiley & Sons, Ltd, 2009. 3) Sørensen, J.N. Aerodynamic aspects of wind energy conversion, Annual Review of Fluid Mechanics, Vol.
43, pp. 427-448, 2011. 4) Sørensen, J.N. and van Kuik, G.A.M. General momentum theory for wind turbines at low tip speed ratios,
Wind Energy, Vol. 14, pp. 821-839, 2011. 5) Sharpe, D.J. A general momentum theory applied to an energy-extracting actuator disc, Wind Energy, Vol. 7,
pp. 177–188, 2004. 6) Lam, G.C.K. Wind Energy Conversion Efficiency Limit, Wind Engineering, Vol. 30, pp. 431-437, 2006. 7) Vennell, R. Exceeding the Betz limit with tidal turbines, Renewable Energy, Vol. 55, pp. 277-285, 2013. 8) Newman, B. Multiple actuator-disc theory for wind turbines, Journal of Wind Engineering and Industrial
Aerodynamics, Vol. 24, pp. 215-225, 1986. 9) Kinsey, T. and Dumas, G. Optimal tandem configuration for oscillating-foils hydrokinetic turbine, Journal
of Fluids Engineering, Vol. 134, pp. 031103-1 to 11, 2012. 10) Dabiri, J.O. Renewable fluid dynamic energy derived from aquatic animal locomotion, Bioinspiration and
Biomimetics, Vol. 2, No. 3, p. L1, 2007. 11) Young, J., Lai, J.C.S and Platzer, M.F. A Review of Progress and Challenges in Flapping Foil Power
Generation, Progress in Aerospace Sciences, Vol. 67, pp. 2-28, 2014. 12) Xiao, Q. and Zhu, Q. A review on flow energy harvesters based on flapping foils, Journal of Fluids and
Structures, Vol. 46, pp. 174-191, 2014. 13) Tian, F.-B., Dai, H., Luo, H., Doyle, J.F. and Rousseau, B. Fluid-structure interaction involving large
deformations: 3D simulations and applications to biological systems, Journal of Computational Physics, Vol 258, pp. 451-469, 2014.
14) Tian, F.-B., Young, J. and Lai, J.C.S. Improving power-extraction efficiency of a flapping plate: From passive deformation to active control, Journal of Fluids and Structures, Vol. 51, pp. 384-392, 2014.
15) Kinsey, T. and Dumas, G. Parametric Study of an Oscillating Airfoil in a Power-Extraction Regime, AIAA Journal, Vol. 46, pp. 1318-1330, 2008.
JAXA Special Publication JAXA-SP-16-008E494
This document is provided by JAXA.


![[Jeffie Betz] Playing Piano](https://img.dokumen.tips/doc/110x75/577cd07b1a28ab9e78925f4b/jeffie-betz-playing-piano.jpg)