Embed Size (px)
Citation preview

December 23, 2014
Initiating Coverage
ICICI Securities Ltd | Retail Equity Research
Betting on consumer business Voltas, India’s leading room air conditioner (RAC) manufacturer (with ~20% volume market share) & electro-mechanical project & services (EMPS) player, is set to benefit from a changing demographic profile & revival in India’s investment cycle. Its unitary cooling products (UCP) division’s revenue has grown at 16% CAGR in FY10-14 mainly due to a change in product mix towards premium products. With sustained demand from tier-II, tier-III cities and rising trend of urbanisation, we expect the UCP division to witness volume growth of ~8% (vs. ~5% industry growth) for FY14-17E. In the EMPS business, Voltas’ strategy to focus on profitability by bidding for small size, high margin projects and their timely execution would help in margin expansion in future. Given the strong performance of UCP division, its contribution to revenue may change from current 39% to 44% by FY17E. We expect consolidated sales, earnings CAGR of ~12%, ~24%, respectively, in FY14-17E. We initiate coverage on Voltas with a BUY rating.
Strong brand recall value Voltas follows an asset light model for its UCP division, which has an assembling capacity of 7,70,000 units and a total dealer network of over 6500 in India. With the strong brand recall value, the advertising and promotion (A&P) spend (~5-6% of UCP sales) is lower than its competitors like Blue Star and Hitachi Home appliances. This has helped the company to maintain a strong EBIT margin of 9-12% in FY10-14. We expect the EBIT margin of the segment to remain strong (~12.5-12.8% in FY14-17E) due to increasing contribution of split AC (75% vs. industry average of 70%).
Healthy performance of UCP division cushions profitability Given the relatively stable margin and sustained operating cash flow, the UCP segment has provided strong support to Voltas’ overall profitability despite declining profitability of EMPS segment. UCP division recorded strong RoCE of ~40-43% in FY11-14. Strong cash flow generation capacity of UCP division has helped in funding higher working capital requirement of EMPS business in difficult times. We believe a steady recovery in profitability of EMPS and robust cash flow generation capacity of UCP division would translate into operating cash flow of | 413 crore in FY17E.
Sturdy performance of UCP segment justifies premium multiple At the CMP, Voltas is trading at a PE multiple of 20x FY16E and 18x FY17E earnings. We expect the EMPS segment to narrow its losses in FY14 and start contributing to the EBITDA in FY15E by executing high margin projects. It will help reduce working capital requirements with improving return ratios, going forward. The continuous outperformance of the UCP division makes Voltas a re-rating candidate in line with consumer durable stocks. Based on our SOTP valuation, we arrive at a target price of | 348. We initiate coverage on Voltas with a BUY recommendation.
Exhibit 1: Key financials (Year-end March) FY13 FY14 FY15E FY16E FY17ENet Sales (| crore) 5,531.0 5,266.0 5,572.4 6,316.7 7,395.2 EBITDA (| crore) 238.0 265.6 423.8 501.8 591.0 Net Profit (| crore) 207.8 245.4 486.9 410.3 464.8 EPS (|) 6.3 7.4 14.7 12.4 14.1 P/E (x) 39.8 33.7 17.0 20.2 17.8 Price / Book (x) 5.1 4.5 3.7 3.3 3.0 EV/EBITDA (x) 33.2 28.8 17.3 14.3 11.9 RoCE (%) 11.1 11.5 15.9 16.9 18.0 RoE (%) 12.8 13.5 22.1 16.5 16.7
Source: Company, ICICIdirect.com Research
Voltas Ltd (VOLTAS)| 250
Rating Matrix
Rating : BuyTarget : | 348Target Period : 12 monthsPotential Upside : 39%
YoY Growth (%) FY14 FY15E FY16E FY17E
Net Sales (4.8) 5.8 13.4 17.1 EBITDA 11.6 59.5 18.4 17.8 Net Profit 18.1 98.5 (15.7) 13.3 EPS (|) 18.1 98.5 (15.7) 13.3
Current & target multiple FY14 FY15E FY16E FY17E
P/E 33.7 17.0 20.2 17.8 Target P/E 46.9 23.6 28.0 24.8 EV / EBITDA 28.8 17.3 14.3 11.9 P/BV 4.5 3.7 3.3 3.0 RoNW 13.5 22.1 16.5 16.7 RoCE 11.5 15.9 16.9 18.0
Stock Data ParticularsMarket Capitalization | 8268.4 CroreTotal Debt (FY14) | 262.9 CroreCash and Investments (FY14) | 874.5 CroreEV | 7656.7 Crore52 week H/L (|) 282 / 99Equity capital | 33.1 CroreFace value | 1MF Holding (%) 28.1FII Holding (%) 19.8
Comparative return matrix (%) Return % 1M 3M 6M 12MVoltas Ltd (6.6) 4.5 14.4 121.4 Blue Star (14.9) (7.4) 8.2 105.2 Hitachi Home 2.8 64.7 228.5 442.1 Whirlpool (3.4) 45.6 102.5 202.5
Price movement
0
50
100
150
200
250
300
Dec-14Sep-14Jun-14Mar-14Dec-13
0
2,000
4,000
6,000
8,000
10,000
Price (R.H.S) Nifty (L.H.S)
Research analyst Sanjay Manyal [email protected] Hitesh Taunk [email protected]

Page 2ICICI Securities Ltd | Retail Equity Research
Company background Incorporated in 1954, Voltas (promoted by Tata Sons) is a leading air conditioning company in India. The company operates mainly in three business segments, viz. electro mechanical projects and services (EMPS), engineering products & services (EPS) and unitary cooling products (UCP) for comfort & commercial use with topline contribution of 52%, 9% and 39%, respectively, in FY14. Voltas offers engineering solutions for a wide spectrum of industries in areas such as heating, ventilation & air conditioning, refrigeration (HVAC&R), electro-mechanical projects, textile machinery, mining & construction equipment, water management & treatment, cold chain solutions, building management systems and indoor air quality. Voltas has migrated from initial heat, ventilation and air conditioning (HVAC) projects to a wide range of services called MEP projects (includes both domestic and international). MEP projects encompass mechanical, electrical and public health in which HVAC is a sub category of mechanical. Under the EPS segment, it provides mining & construction equipment (M&CE) and textiles machinery to the respective industries. The products offered under M&CE are shovels, dumpers, loaders, crushers & screening plants and textiles machines including spinning, knitting and weaving machines. Voltas is India’s largest room air conditioner manufacturers with a market share of over 20% (volume wise) in FY14 with over 6500 strong dealer network across India. The UCP segment includes air conditioners (home & industrial) and commercial refrigeration machines wherein 75% of total UCP sales come from the air conditioner segment only. The revenue contribution from the domestic market increased ~10 percentage points (to 69.7% in FY14) from FY10 due to UCP segment revenue CAGR of ~16% in FY10-14.
Exhibit 2: Business segments
Unitary cooling products for comfort and commercial use
Voltas Ltd
Engineering products and services
Electro-mechanical projects & services
OthersSegments
>Domestic & international
MEP solutions
>HVAC, electrical systems
for buildings, plumbing, fire
fighting, ELV & specialised
systems, building security
and other utilities
>Electrical projects
>Water treatment projects
Product & Services
> Supply of textiles
manchinery: spinning, weaving,
knitting, processing, finishing,
accessories
>Supply of mining &
construction equipment:
crusher, hydraulic truck cranes
>Air conditioners; split,
window, cassette, slimline
> Deep freezers: Metal top
freezers, glass top freezers
>Chest coolers, visi coolers,
water coolers >Commercial
refrigeration products
>Drilling
>Irrigation
>Landscaping
> Water & waste water
management treatment
Cons. Financial Performance
Topline contribution: 52%
Rev CAGR (FY10-14) : -3.6%
EBIT margin (FY14):-1.5%
RoCE (FY14): NM
Topline contribution: 9%
Rev CAGR (FY10-14) : -1.1%
EBIT margin (FY14):27.8%
RoCE (FY14): 71%
Topline contribution: 39%
Rev CAGR (FY10-14) : 16%
EBIT margin (FY14):12.3%
RoCE (FY14): 43%
Topline contribution: 1%
Rev CAGR (FY10-14) : 7.4%
EBIT Margin (FY14): 1.1%
RoCE (FY14): 2%
Source: Company, ICICIdirect.com Research
Shareholding pattern (Q2FY15)
Shareholding Pattern Holdings (%)
Promoters 30.3
Institutional investors 47.8
Others 21.9
Institutional holding trend (%)
14.5 15.218.1 18.6 19.8
29.8 29.8 28.9 29.2 28.1
0
5
10
15
20
25
30
35
Q2FY14 Q3FY14 Q4FY14 Q1FY15 Q2FY15
(%)
FII DII

Page 3ICICI Securities Ltd | Retail Equity Research
Exhibit 3: Company milestone
Adds a new division, agro-industrial products. It handled hydraulic equipment ranging from larger pumping sets to small irrigation pumps, sprinkler irrigation systems pesticides and fertilisers
Launched ductable split air conditioners, specifically needed for shops, showrooms and general office areas
Incorporated in Mumbai, and jointly promoted by Volkart Brothers & Tata Sons Pvt Ltd. Set up air conditioner manufacturing facility in Thane near Mumbai
-Material handling unit introduced up-to-date warehousing equipment-Received government approval for the technical collaboration agreement convering large-sized efficient compressors
Sold its wholly-owned subsidiary Voltas Foods & Beverages to a Mumbai-based company
- Introduces new ranges of AC in the domestic market-Secures orders from world's tallest building (Burj Tower)
1954 1988
-Merger of Hyderabad Allwyn Ltd with Voltas Ltd -Launch of air cooler- Voltas brand and its operations in refrigerators and washing machines
-Voltas enters into a joint venture agreement with Sermo Montaigu, France for perfect moulds-Enters into a distribution tie-up with Italian airconditioning major Uniflair-Haier enters into a contract manufacturing agreement with Voltas Ltd for air conditioners and refrigerators
Forms 50:50 JV, Universal Comfort Products Ltd (UCPL), with Fedders International Air-conditioning Pvt Ltd
2011-2014
-Transfers its material handling business to KION group -Signs distribution agreement with Swiss textile equipment maker Benninger AG -Forms JV with Dow Chemical Pacific Water and Waste Water treatment market
20071966 1991 1992-2000 2000-2001 2002-2004 2005
Source: ICICIdirect.com Research
Exhibit 4: Geographical revenue break-up
2776 3469 3326 3480 3656
17831632 1789 1870 1468
19976 60
165 119
0
1000
2000
3000
4000
5000
6000
FY10 FY11 FY12 FY13 FY14
(| c
rore
)
India Middle East Others
Source: Company, ICICIdirect.com Research
Exhibit 5: Order book position
4227
3000
42923719 3612
0
1000
2000
3000
4000
5000
FY10 FY11 FY12 FY13 FY14
(| c
rore
)
Source: Company, ICICIdirect.com Research

Page 4ICICI Securities Ltd | Retail Equity Research
Investment Rationale Unitary cooling products for comfort and commercial USE (UCP)
Voltas’ UCP division includes air conditioners (windows and split), deep freezers, chest coolers, visi coolers, water coolers and water dispensers. Voltas is primarily an assembler and not a manufacturer of ACs as it outsources various accessories of ACs (like compressors) and assembles at its Pantnagar plant (Uttarakhand). The segment contributes ~39% to the consolidated topline and recorded sales CAGR of ~16% in the last five years. Room air conditioners (RAC) contribute 75% in the segment revenue while ~25% revenue comes from institutional cooling products. Universal Comfort Products (UCPL) is the company’s wholly owned subsidiary and manufacturing (assembling) arm for room ACs. The subsidiary has increased its total assembling capacity from 4,45,000 in FY12 to 7,70,000 in FY14. Voltas has retained its market leadership position by introducing new models like ‘all weather AC’ during FY13. In the RAC segment, Voltas’ product mix of split and window AC stands at 75% split AC against industry average of 70%. A strong brand coupled with over 6500 dealers in India (sales 90% of segment sales through dealers) has helped Voltas to improve its market share (in the AC) from 14% in FY10 to 19.8% in FY14.
Exhibit 6: Voltas commands strong market share vis-à-vis multinational players
(%) 2009-10 2010-11 2011-12 2012-13 2013-14
LG 25 22 21 19 21
Voltas 14 16 12 18 20
Samsung 17 17 20 17 11
Others 44 45 47 47 48
Source: Crisil, ICICIdirect.com Research
RAC industry outlook
Slower volume growth due to adverse economic conditions
The room air conditioners (RAC) category consists of both window and split air conditioners for cooling applications in the residential and commercial space. The current market size of the RAC industry is estimated at ~| 7900 crore. It has grown at 13.5% CAGR over the last five years. The volume growth was ~7% during the same period largely supported by sharp volume growth of split AC. The share of split ACs in overall industry sales has increased from ~53% in 2009-10 to 60% in 2013-14. The share of split AC is further expected to increase to 80% by the end of 2018-19E mainly due to lower noise levels, no security problems, aesthetic look and space adaptability. However, the overall RAC industry has witnessed muted volume growth in the last three years. This can largely be attributed to sluggish economic condition and a sharp rise in raw material prices. In 2013-14, the RAC industry has grown ~3% (volume) compared to de-growth of about 6% in 2011-12 and ~1% in 2012-13.
Despite the slowdown in volume sales, Voltas recorded volume growth of 6.5% in RAC during FY14. According to Crisil estimates, the overall RAC market is expected to record volume CAGR of 5% in FY14-17E, due to ~9% volume CAGR of split AC. However, window ACs (largely preferred by price sensitive consumers) are expected to record a decline in sales during the same period. Simultaneously, a shift in focus by many AC manufacturers toward split AC (Samsung and LG have stopped window AC sales) would also result in relatively lower demand for window ACs.
The UCP segment contributes ~39% to the consolidated
topline and recorded sales CAGR of ~16% in the last five
years. The company’s room air conditioners (RAC)
contribute 75% to the segment revenue while ~25%
revenue comes from institutional cooling products
Strong brand coupled with over 6500 dealers across India
(sales 90% of segment sales through dealers) has helped
Voltas improve its market share (in the AC) from 14% in
FY10 to 19.8% in FY14
The current market size of the RAC industry is estimated at
~| 7900 crore. It has grown at a CAGR of 13.5% in the last
five years led by rising contribution of split AC
The share of split ACs in overall industry sales has
increased from ~53% in 2009-10 to 60% in 2013-14. The
share of split AC is further expected to increase to 80% by
the end of 2018-19E mainly due to lower noise levels, no
security problems, aesthetic look and space adaptability

Page 5ICICI Securities Ltd | Retail Equity Research
Exhibit 7: RAC sales volume expected to record ~5% CAGR in FY14-17E
2.6
3.2 3.0 3.0 3.0 3.1 3.3 3.5
0.0
0.5
1.0
1.5
2.0
2.5
3.0
3.5
4.0
09-10 10-11 11-12 12-13 13-14E 14-15E 15-16E 16-17E
(mn
units
)
Source: Crisil, ICICIdirect.com Research
Exhibit 8: Shift in consumer preference towards split AC
47 4020
42 3518
53 6080
58 6582
020406080
100
2009-10 2013-14 2018-19E
2009-10 2013-14 2018-19E
Volume Value
(%)
Window Split
Source: Crisil, ICICIdirect.com Research
India: Untapped cooling market, recent slowdown hit industry
In spite of growing aspiration levels, the majority of Indian homes remain untouched by air conditioning, as the overall AC penetration in India remained at ~4%, which is significantly lower than other developing countries. We believe, of the total ~330 million Indian households, ~66% (~220 million) own fans. Only 4% (~13 million) of the total households own air conditioners while 8% (26 million) own coolers. Rising preference for air coolers is also one of the few reasons for lower penetration, specifically in rural India (due to price difference of products and electricity consumption). However, the growing disposable income level (disposable income recorded CAGR of ~15% in the last 10 years), coupled with a progressive shift in consumers’ perception of air conditioners from that of a luxury to a necessity would help in driving demand for RAC in India.
However, in the past three years, the Indian RAC market has suffered on account of 1) a challenging economic environment, 2) higher inflation and interest rate, 3) adverse currency movement, 4) rising competition and 5) implementation of Bureau of Energy Efficiency (BEE) January 2014 necessitating an upward revision in energy efficiency, resulting in an additional increase in prices for the same star rating.
Exhibit 9: Penetration rate of AC
48
66
0
10
20
30
40
50
60
70
AC Air cooler Fans
(%)
Source: Industry, ICICIdirect.com Research
Exhibit 10: Household AC penetration in developing nations
89
72
53 50
8 4
0
20
40
60
80
100
Taiwan Singapore China korea Indonesia India
(%)
Source: Industry, ICICIdirect.com Research
We believe of the total ~330 million Indian households,
~66% (~220 million) own fans. Only 4% (~13 million) of
the total households own air conditioners while 8% (26
million) own coolers

Page 6ICICI Securities Ltd | Retail Equity Research
New BEE norms to hit short-term volume but long-term view remains positive
The RAC industry volume growth is expected to remain sluggish (~3% YoY) mainly due to ratings revision announced by the Bureau of Energy Efficiency (BEE) in January 2014. According to new norms, 5-star air-conditioners purchased in 2011-12 are now a 3-star device while a 5-star AC purchased in 2012-13 has now become a 4-star unit. However, the long term view on the industry remained strong supported by rising disposable income that would provide more room for expenditure in discretionary items. According to PwC-Ficci, the discretionary spend is expected to improve ~1000 bps by the end of 2019-20. We believe low penetration levels, easy availability of finance options, replacement demand and energy efficiency products, growing consumer electronics’ retail stores, online shopping along with growing number of middle class households in India would fuel demand in this industry.
Exhibit 11: Rise in per capita disposable income with population growth
0
200
400
600
800
1000
1200
1400
1994
-95
1997
- 98
2000
- 01
2003
- 04
2006
-07
2 009
- 10
2012
- 13
(Pop
ulat
ion
milli
on)
01000020000300004000050000600007000080000
(|)
Population (Million) Per capita/disposable income (|)
Source: RBI, ICICIdirect.com Research
Exhibit 12: Private final consumption expenditure
70 60 50
30 40 50
0
20
40
60
80
100
120
2000-01 2009-10 2019-20
(%)
Non discretionary spend Discretionary spend
Source: FICCI-PWC, ICICIdirect.com Research
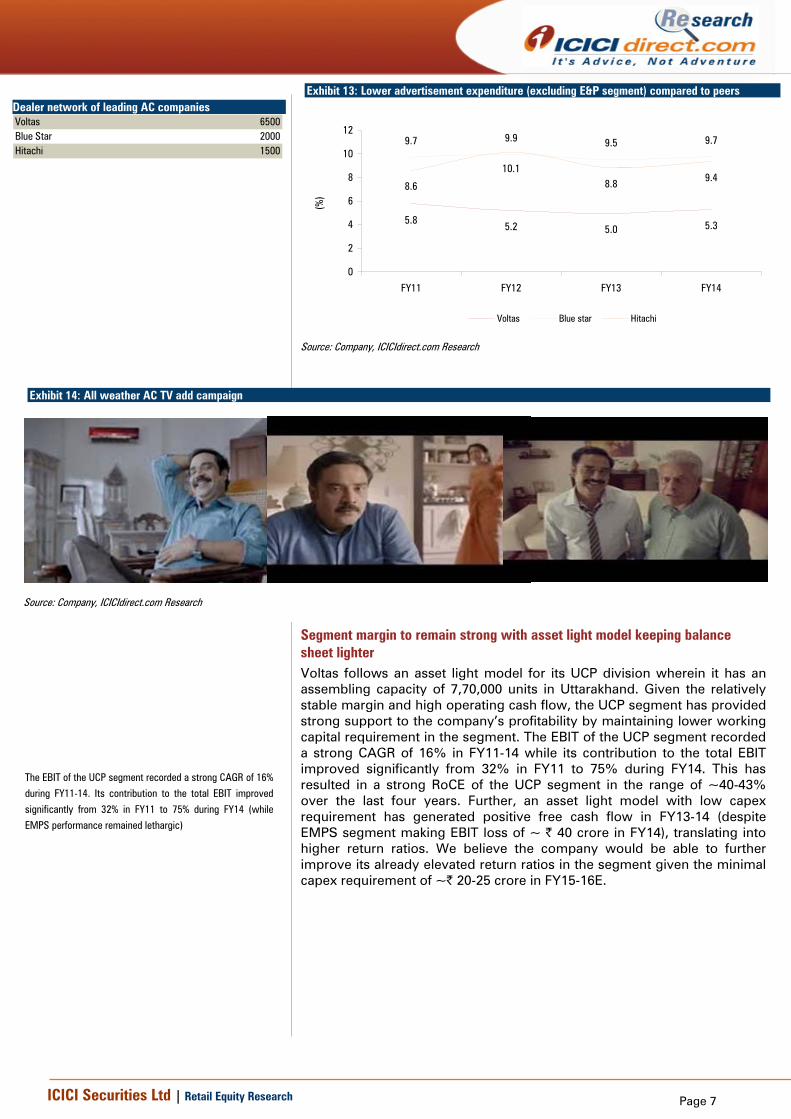
Strong brand recall lead to lower advertisement expenses among peers Voltas’ advertisement expenses over the years remained lower (5-6% of UCP sales) compared to its close competitors like Blue Star and Hitachi Home Appliances. The lower advertisement expenditure can largely be attributed to the company’s strong brand recall and vast dealer network across India (over 6500 dealers across India). In addition, the company’s strategy to introduce new products (such as all weather AC, inverter AC) has helped Voltas to significantly improve its market share by ~800 bps over the last three years despite intense competition in the industry. In addition, large MNCs such as Samsung and LG have stopped window AC sales while Voltas is still continuing with window AC (considered to be for low price point buyers), helping the company to garner additional market share. Further, the company’s strategy to keep very simple and attractive TV ad “Murthy” (no celebrity in the media ad campaigning) and focus on demonstrating the quality of the product (all weather AC) helped Voltas to make major cost savings. In absolute terms, the company’s advertisement expenses recorded a CAGR of ~7% in the last three years. We believe Voltas would keep advertisement expenses at current levels, helping it to maintain operating margin at ~12.6% during FY14-17E.
According to new norms, 5-star air-conditioners purchased
in 2011-12 are now 3-star device while a 5-star AC
purchased in 2012-13 has now become a 4-star unit.
However, the long term view on the industry remained
strong supported by rising disposable income that would
provide more room for expenditure in discretionary items
Voltas’ advertisement expenses (excluding EMPS/EPS
segment) over the years remained lower (5-6%) compared
to its close competitors like Blue Star and Hitachi Home
Appliances
Page 7ICICI Securities Ltd | Retail Equity Research
Exhibit 13: Lower advertisement expenditure (excluding E&P segment) compared to peers
5.85.2 5.0 5.3
9.7 9.9 9.5 9.7
8.6
10.18.8 9.4
0
2
4
6
8
10
12
FY11 FY12 FY13 FY14
(%)
Voltas Blue star Hitachi
Source: Company, ICICIdirect.com Research
Exhibit 14: All weather AC TV add campaign
Source: Company, ICICIdirect.com Research
Segment margin to remain strong with asset light model keeping balance sheet lighter Voltas follows an asset light model for its UCP division wherein it has an assembling capacity of 7,70,000 units in Uttarakhand. Given the relatively stable margin and high operating cash flow, the UCP segment has provided strong support to the company’s profitability by maintaining lower working capital requirement in the segment. The EBIT of the UCP segment recorded a strong CAGR of 16% in FY11-14 while its contribution to the total EBIT improved significantly from 32% in FY11 to 75% during FY14. This has resulted in a strong RoCE of the UCP segment in the range of ~40-43% over the last four years. Further, an asset light model with low capex requirement has generated positive free cash flow in FY13-14 (despite EMPS segment making EBIT loss of ~ | 40 crore in FY14), translating into higher return ratios. We believe the company would be able to further improve its already elevated return ratios in the segment given the minimal capex requirement of ~| 20-25 crore in FY15-16E.
Dealer network of leading AC companies Voltas 6500Blue Star 2000Hitachi 1500
The EBIT of the UCP segment recorded a strong CAGR of 16%
during FY11-14. Its contribution to the total EBIT improved
significantly from 32% in FY11 to 75% during FY14 (while
EMPS performance remained lethargic)

Page 8ICICI Securities Ltd | Retail Equity Research
Exhibit 15: Strong EBIT margin (%) in UCP segment
10.38.4 9.0
12.3 12.5 12.5 12.8
7.95.4
1.6-1.5
0.9 1.7 1.7
18.3 16.719.4
27.8
17.0 16.0 17.1
-5
0
5
10
15
20
25
30
FY11 FY12 FY13 FY14 FY15E FY16E FY17E
(%)
UCP EMPS EPS
Source: Company, ICICIdirect.com Research
Exhibit 16: Strong RoCE due to asset light model
23.3
41.2 42.6 41.3 39.2 42.8
59.348.9
28.816.7
5.0-3.8
36.248.7
68.158.3 55.0
70.9
-20
0
20
40
60
80
FY09 FY10 FY11 FY12 FY13 FY14
(%)
UCP EMPS EPS
Source: Company, ICICIdirect.com Research
Exhibit 17: Strong free cash flow on expectation of recovery in EMPS segment coupled with sustained EBIT margin of UCP segment
23.4
-235.1
133.6
4.6
351.8
204.5168.6
-300
-200
-100
0
100
200
300
400
FY11 FY12 FY13 FY14 FY15E FY16E FY17E
(| c
rore
)
Source: Company, ICICIdirect.com Research
Strong MEP player, victim of poor macro condition Execution of turnkey projects related to mechanical, electrical & public health (MEP) segment comes under Voltas’ electromechanical project & services (EMPS) business. The company commenced its business by providing heat ventilation air conditioning & refrigeration (HVAC&R) services to medium to large office buildings, retail outlets or for industrial projects (such as installation of AC systems in power plants), wherein humidity and temperature must be closely regulated. Over the years, Voltas has expanded its scope of work from being only an HVAC&R player to MEP projects (includes both domestic and international). MEP projects encompass mechanical, electrical and public health in which HVAC is a sub category of mechanical. Voltas' scope of work includes design, engineering, procurement & construction, to commissioning, operation and maintenance, which makes it an end to end MEP player.
The EMPS division contributes over 50% to the topline and is further diversified in terms of geographies. The company has executed major MEP/HVAC&R projects with its strategic partner in Dubai, Abu Dhabi, Qatar, Jeddah, Bahrain and Singapore. These projects include Burj Khalifa (Dubai), Ferrari Experience (Abu Dhabi) and Barwa City Qatar. We expect EMPS segment revenues to record a CAGR of ~10% in FY14-17E with the strategy to focus on profitability by bidding for small size, high margin projects and their timely execution. Over the years, the proportion of international orders in total order has declined significantly. This indicates the company’s strategy to focus on higher margin domestic orders.
An asset light model and lower capital expenditure in the
segment translated into higher return ratios and helped in
maintaining free cashflows (in spite of EMPS segment
making an EBIT loss of ~ | 40 crore during FY14)
The electromechanical project & services division
contributes over 50% to the topline and is further
diversified in terms of geography. The company has
executed major MEP/HVAC&R projects in Dubai, Abu
Dhabi, Qatar, Jeddah, Bahrain and Singapore

Page 9ICICI Securities Ltd | Retail Equity Research
Exhibit 18: Order book and EMPS segment revenue trend 37
32 4227
3000
4292
3719
3612 3810 40
63
4150
2767 31
13
3041
3183
3200
2692
2698 29
90 3545
0
1000
2000
3000
4000
5000FY
09
FY10
FY11
FY12
FY13
FY14
FY15
E
FY16
E
FY17
E
(| c
rore
)
Order Book Revenue (EMPS)
Source: Company, ICICIdirect.com Research
Exhibit 19: Domestic and International order mix
1956 2161 2020
2336 1558 1592
0
1000
2000
3000
4000
5000
FY12 FY13 FY14
(| c
rore
)
Domestic International
Source: company, ICICIdirect.com Research
International domain largely includes GCC countries Voltas’ international project works are largely concentrated in the Gulf Cooperation Council (Bahrain, Kuwait, Oman, Qatar, Saudi Arabia and UAE). The company has executed various projects in these countries. However, GCC countries had not been spared the economic slowdown wherein GDP growth declined to 19% YoY in 2009 led by ~11% YoY dip in average oil production (millions barrels/day). This, in turn, led to a budget deficit of US$36 billion in GCC countries in FY09. Voltas, a subcontractor in the GCC region, was also affected by the slowdown as order inflows during FY10 declined sharply by 42% YoY. Voltas recorded flattish revenue CAGR of 1% in FY10-12 while due to a sharp cost escalation (largely due to a delay in Sidra Project) the EBIT of EMPS recorded a sharp contraction of 25% in FY12 compared to FY10.
Exhibit 20: Link between GCC GDP growth and average oil production in GCC countries
27.4
19.1
26.4 27.2
-19.1
19.3
16.1
15.6
16.1
14.314.5
16.0
-30
-20
-10
0
10
20
30
40
2005 2006 2007 2008 2009 2010
(%)
13
14
14
15
15
16
16
17
(mn
b/da
y)
GCC GDP growth at current price Avg oil production (mn b/day)
Source: World Bank, GIC, ICICIdirect.com Research
Voltas’ EMPS segment revenues were largely hit by sluggish economic conditions in GCC countries. Most overseas projects were hit hard by a sharp rise in operating cost and delay in claim settlement
The GDP growth of GCC countries is highly linked to the demand for crude oil. The GDP growth of GCC countries declined to 19% YoY in 2009 led by ~11% YoY dip in average oil production (million barrels per day)

Page 10ICICI Securities Ltd | Retail Equity Research
Overhang of Sidra project subsides Voltas’ EMPS business recorded flat revenue CAGR in FY10-13 followed by a decline in order inflow and focus on early execution of projects. Voltas received a mega project in 2008 from Sidra Medical & Research Centre, Qatar. This is a large state-of-the-art hospital at a total investment of ~US$2.5 billion. The company’s share of work is valued in excess of | 1000 crore and involves extensive coordination with multiple agencies and intermediaries. The design and build nature and complexity of the project, combined with the client’s quest for attaining truly global standards has had an impact on various cost parameters. In addition to extended project schedules and lapsed time, there have also been numerous difficulties and complications including the non-availability of Indian workmen visas. This has resulted in a sharp contraction in overall EBIT margin of the EMPS segment (9.9% in FY10 to -1.5% in FY14). As on date, booked losses in these projects stood at | 400 crore. However, the company is entitled to the cost overruns and it has lodged its claims with the client. We believe these claims (if approved) would positively impact the earnings in future.
Exhibit 21: Cost overrun hits margin in EMPS segment
2767
31133041
3183 3200
2692
2400250026002700280029003000310032003300
FY09 FY10 FY11 FY12 FY13 FY14
(| c
rore
)
-4-2024681012
(%)
Revenue EBIT Margin
Source: Company, ICICIdirect.com Research
Exhibit 22: Sidra project income and profit/loss trend
30113
213
567432
1403 11
-323-117-11 -13
-400
-200
0
200
400
600
800
FY09 FY10 FY11 FY12 FY13 FY14
(| c
rore
)
Income Profit/Loss
Source: Company, ICICIdirect.com Research
Pick-up in construction activities in GCC to boost order inflow
The GCC construction markets started showing a sharp recovery post FY10 with concerns starting to ease both at the micro as well as macro level and crude prices starting to stabilise. GCC countries provide big opportunities for MEP contractors due to the huge surge in infrastructure investments. According to Drake & Scull [one of the largest MEP players in the Middle East & North Africa (MENA), South Asia and European regions], US$820 billion worth of projects are likely to be awarded in FY13-18 (15% higher than projects awarded in 2008-13) from the MENA region. Saudi Arabia and Qatar represent ~42% of the planned project pipeline, followed by UAE at 13%. Further, construction projects represent 41% of the planned project pipeline compared to 55% in the previous five years. The share of infrastructure projects is likely to increase to 33% in FY13-18 vs. 21% for projects awarded during FY13-18.
Voltas bagged an order of | 1000 crore from Sidra Medical
& Research Centre, Qatar in 2008. This is a large state-of-
the-art hospital with world-class facilities at a total
investment of ~US$2.5 billion. However, a sharp cost
overrun due to various delays, a frequent change in design
and difficulties in obtaining visas for Indian workmen hit
the overall margin
According to Drake & Scull [one of the biggest MEP players
in the Middle East & North Africa (MENA), South Asia and
European regions], US$820 billion worth of projects are
likely to be awarded in the next five years (15% higher than
projects awarded in 2008-13) from the MENA region

Page 11ICICI Securities Ltd | Retail Equity Research
Exhibit 23: MENA (ex-Iran) project pipeline of US$820 billion over next five years
350 402.5
160184
170192.95
3641.4
0100200300400500600700800900
Award 2008-13 Award 2013-2018e
(US$
bn)
Water & Waste Infrastructure Power Construction
716821
+15%
Source: Drake & Scull, ICICIdirect.com Research
Exhibit 24: Industry wise MENA planned project pipeline
55 41
2133
22 23
2 3
0
20
40
60
80
100
120
2008-13 2013-18
(%)
Construction Infrastructure Power Water & Waste
Source: Drake & Scull, ICICIdirect.com Research
GCC: huge investment in construction activities GCC countries have national development plans wherein the governments plan to boost infrastructure and construction activities in the coming decade. According to Deloitte, the GCC construction industry is now valued at over US$1.3 trillion with US$935 billion in execution including long-term mega projects, US$81 billion out to tender, US$211 billion in the design phase and US$136 billion under study. Further, the UAE government plans to boost the Dubai real estate and tourism market as it would be hosting the Expo 2020. This would be largest ever expo to be built in the Jebel Ali (DWC) with total cost at US$2-4 billion. Further, Dubai’s Roads and Transport Authority has announced the expansion of the Dubai Metro’s Red Line to connect it to the Dubai World Central, which will cost US$1.36 billion. According to another consulting firm EC Harris, GCC countries would see acceleration in major programme delivery worth US$50 billion per annum in 2014-19 wherein 46% of the total cost would be allocated to construction works followed by 22% to develop transportation system.
Indian, GCC economic revival to help in order book growth With the formation of a new government at the Centre, the focus has shifted towards large infrastructure projects like new airports, modernisation of railway stations, upcoming metro projects and water sanitation systems. The investment projection for the Twelfth Plan period stands at | 5574663 crore compared to | 2424277 crore during the Eleventh Plan period. Under the Twelfth Plan, investments in railways, airports, ports, water supply & sanitation increased 158%, 142%, 344% & 111%, respectively. We believe Voltas will benefit from the boost in construction and infrastructure focused activities in India. The company has started focusing on the domestic business to offset the losses (due to cost escalation of Sidra Project) from the international business. This has resulted in higher contribution of domestic orders from 45.5% in FY12 to 56% in FY14. The change in the order book mix cushions the sharp contraction in EBIT losses from international businesses during downturns. Exhibit 25: Projected investment in infrastructure 12th Plan
Total Elevent Plan 2012-13 2013-14 2014-15 2015-16 2016-17
Total Twelfth plan
Railways (A) 201237 64713 78570 96884 121699 157355 519221Airports (B) 36311 7691 10716 15233 21959 32116 87714Ports ('C) 44536 18661 25537 35260 49066 69256 197781Water supply & Sanitation (D) 120774 36569 42605 49728 58084 68333 255319Total A+B+C+D 402858 127634 157428 197105 250808 327060 1060035
Source: Mospi, ICICIdirect.com Research
According to Deloitte, the GCC construction industry is now valued at over US$1.3 trillion, with US$935 billion in execution including long-term mega projects, US$81 billion out to tender, US$211 billion in design phases and US$136 billion under study. Further, the UAE government plans to boost the Dubai real estate and tourism market after it won the right to host the Expo 2020
Voltas started to focus more on the domestic business as the proportion of domestic orders in the total order increased from 45.5% in FY12 to 56% in FY14. The change in the order book mix cushions the sharp contraction in EBIT losses from international business during downturns
Page 12ICICI Securities Ltd | Retail Equity Research
Some of the domestic orders of Voltas include: • The | 250 crore order from Delhi Metro Rail Corporation for
environmental control systems and tunnel ventilation for eight stations
• HVAC orders in the IT/ITeS segment, including two new TCS
facilities at Hyderabad & Nagpur and the upcoming Infosys campus at Bhubaneswar
• HVAC orders for Delhi’s Parliament House as well as Tata Steel’s
integrated steel plant at Kalinganagar
• Orders for VRF systems covering the entire residential high-rise buildings, namely the Mantri Group’s Pinnacle and Tata Housing’s Primanti
• The water business orders included zero liquid discharge project for
a paper & pulp mill at Mysore and a large design and-build water systems job for the steel melt shop for Tata Steel’s Kalinganagar works
Focus more on execution of projects to reduce working capital
Due to adverse macroeconomic conditions, Voltas faced a severe working capital crunch on account of the slow pace of execution and delayed payments. It has been observed that large ticket overseas projects (like Sidra Medical in Qatar) have played spoilsport for Voltas as working capital as percentage of sales increased sharply from 1.3% in FY09 to ~10% by the end of FY14. This is also clearly evident from the sharp increase in the EMPS segmental capital employed (excluding unallocated items) from | 222 crore during FY10 to | 708 crore during FY13, on account of a decline in advances and dispute related to Sidra projects. To reduce the working capital requirement and improvement in profitability, the company is now focusing more on timely execution of projects and claim settlement. In this regard, Voltas adopted a strategy to remain selective in the choice of new project undertakings with a ticket size in the range of | 300-400 crore. Also, the execution period of new orders (domestic & international) would be in the range of about 15 months. Apart from this, the management is confident of improving the EBITDA margin from hereon as Voltas is now focusing on bidding for international projects with a minimum EBITDA margin of 5% with domestic project EBITDA margin slightly better than international projects. Out of | 1600 crore worth of the international order book (largely from GCC countries) legacy orders are worth | 250 core (by the end of H1FY15) while | 1000 crore orders are fresh orders with EBITDA margin of 5%.
To reduce the working capital requirement and improve
profitability, the company is now focusing more on the
timely execution of projects and claim settlement. In this
regard, Voltas adopted a strategy to remain selective in the
choice of new project undertakings with a ticket size in the
range of | 300-400 crore

Page 13ICICI Securities Ltd | Retail Equity Research
Exhibit 26: Delays in execution lead to increase in receivable days
0
20
40
60
80
100
FY09 FY10 FY11 FY12 FY13 FY14
(Day
s)
Source: Company, ICICIdirect.com Research
Exhibit 27: Stretched working capital due to slow execution of projects
2.2
-3.6
1.3 2.3
7.9
11.6 11.19.9
-5
0
5
10
15
FY07 FY08 FY09 FY10 FY11 FY12 FY13 FY14
(%)
Net Current asset excl cash % of sales
Source: Company, ICICIdirect.com Research
Exhibit 28: Sharp rise in debtor days push up capital employed of EMPS
0
100
200
300
400
500
600
700
800
900
FY09 FY10 FY11 FY12 FY13 FY14
(| c
rore
)
Source: Company, ICICIdirect.com Research
Lower debtor turnover pushes up working capital requirements during FY12-13

Page 14ICICI Securities Ltd | Retail Equity Research
EBIT margin of EMPS to improve, going forward
Voltas recorded an EBIT loss of ~| 40 crore in FY14 due to cost overrun in international projects. However, the Government of India’s plans to push infrastructure growth in India (high-speed bullet trains, building smart cities and expediting work on the freight and industrial corridors) coupled with upcoming major construction activities in the GCC region would drive the order book growth in future. Consequently, we have modelled an order inflow CAGR of ~12% in FY14-17E [the company is in an advanced stage of negotiation on letter of intent (LoI) aggregating | 500 crore H1FY15]. Considering that the maximum pain in Sidra Medical projects (95% of the project is completed) has been realised, the company’s simultaneous focus on higher margin projects would result in a recovery in EBIT margin. We have modelled an EBIT margin of 1-1.7% for FY15E-17E.
Exhibit 29: EMPS revenue CAGR of ~10% in FY14-17E
0500
1000150020002500300035004000
FY09
FY10
FY11
FY12
FY13
FY14
FY15
E
FY16
E
FY17
E
(| c
rore
)
-4-2024681012
(%)
Revenue (EMPS) EBIT margin
Source: Company, ICICIdirect.com Research
Exhibit 30: Order inflow to record ~12% CAGR in FY14-17E
0
1000
2000
3000
4000
5000
FY09
FY10
FY11
FY12
FY13
FY14
FY15
E
FY16
E
FY17
E
(| c
rore
)
Order inflow
CAGR 12%
Source: Company, ICICIdirect.com Research
Engineering & product services: Focus on improving margin
Voltas provides mining & construction equipments (M&CE) and textiles machineries to industries. The products offered under M&CE are shovels, dumpers, loaders, crushers & screening plants and textiles machines including spinning, knitting and weaving machines. The source of revenue for Voltas under this category is spare parts sales, commission, after sales services and maintenance charges. It contributes ~9% to the topline and earned an EBIT margin of 19.4% and 27.8% during FY13 and FY14, respectively. The segment recorded flattish growth during the last five years as the textile and mining industry faced several challenges like a power supply crunch in Andhra Pradesh and Tamil Nadu and a ban in mining activities in some states.
Currently, textiles contribute about 4% of India’s GDP. This industry provides direct employment to about 45 million people. According to Ministry of Textiles, the domestic and exports segments of the Indian textile & apparel industry is expected to grow at a CAGR of 9.3% and 10.2% per annum, respectively, over the years and reach a size of US$141 billion and US$82 billion, respectively, by 2021. In the last few years, the industry faced severe challenges like an economic slowdown, inadequate power, shortage of manpower, higher interest rates, reluctance to upgrade to contemporary technology and lack of clarity in government policy that continues to plague the industry. However, the outlook of the industry looks promising buoyed by both strong domestic consumption as well as export demand. The government allocated | 116 billion under the Technology Upgradation fund (TUFS) scheme during the Twelfth Five Year Plan Period (2012-17). This is likely to encourage investments in the sector, especially in the areas of modernisation, spinning, weaving, processing and garments.
The Government of India’s plans to push infrastructure growth in India (high-speed bullet trains, building modern cities and expediting work on the freight and industrial corridors) coupled with upcoming major construction boost in GCC countries would drive the order book growth in future
The source of revenue for Voltas under this category is from spare parts sales, commission, after sales services and maintenance charges. It contributes ~9% to the topline and earned an EBIT margin of 19.4% and 27.8% during FY13 and FY14, respectively

Page 15ICICI Securities Ltd | Retail Equity Research
The contribution of the mining sector to Indian GDP has declined from 3.4% during 1992-93 to 2% at present. After clocking an average growth rate of 4.8% in the five years between 2006-07 and 2010-11, the sector witnessed negative growth of 0.6% for two consecutive years now (2011-12 and 2012-13). The Indian mining sector in the last couple of years has witnessed an abysmal performance mainly due to policy paralysis both at the Centre as well as state level. Major mining projects across the country have remained stalled owing to court cases (like the mining ban in Goa), environmental, regulatory and land acquisition issues. The sector has also been reeling under high borrowing costs.
We believe the engineering & product services (EPS) segment of Voltas will record a dismal topline CAGR of ~1% in FY14-17E while the segment EBIT margin is expected to remain at an elevated level. The company is expected to garner a higher margin in the segment largely due to its focus on after sales service, sales of spare parts and operation & maintenance revenue.
Exhibit 31: EPS segment revenue and margin trend
542.2
468.0
563.8
412.1 431.1 448.2 425.8 447.1 460.5
0
100
200
300
400
500
600
FY09 FY10 FY11 FY12 FY13 FY14 FY15E FY16E FY17E
(| c
rore
)
0
5
10
15
20
25
30
(%)
EPS EBIT Margin
Source: Company, ICICIdirect.com Research
In order to address the concern of the Indian mining industry, Voltas has been shifting its focus to Africa based projects. According to the management, the company has recorded encouraging growth in the established business in Mozambique, along with a promising start in the Ivory Coast
We believe, the EPS segment of Voltas to record dismal topline CAGR of ~1% for FY14-17E, while the segment EBIT margin is expected to remain at elevated level

Page 16ICICI Securities Ltd | Retail Equity Research
Pain across industry
MEP players have suffered significantly in the last three or four years, with rising competition (hitting margin), reduction in new order booking due to the dismal business environment and the conscious decision to avoid new contracts that did not meet reasonable financial and commercial criteria. Another impediment was the slow pace of execution of many ongoing projects due to liquidity problems with customers. The pain is clearly visible in the financials of two leading MEP players Voltas and Blue Star, which saw a muted performance in the project business (for both players the project business contributes more than 50% to the overall topline). However, the cooling products business cushioned the margin (cooling product margin in the range of 8-12%) and helped in generating positive operating cash flow for both companies. We believe the UCP business would continue to perform in India for Voltas (revenue CAGR of ~17% in FY14-17E and EBIT margin in FY14-17E: ~12.5-12.8%) due to a change in the product mix, a favourable climate and rising aspiration levels. Further, under the EMPS segment completion of legacy projects with an increase billing volume of new higher margin business would help Voltas to stay afloat.
Exhibit 32: Like to like comparison of Voltas and Blue Star
FY12 FY13 FY14 CAGRFY12-14 FY12 FY13 FY14 CAGRFY12-14
Outstanding order book 4292 3719 3612 -8.3 1614 1412 1478 -4.3
Decline in order book remains largely across the sector due to macroeconomic conditions coupled with the company's strategy to focus more on execution of projects
Segment revenue
Project business 3183 3200 2692 -8.0 1676 1777 1663 -0.4Segment revenue remained muted for both companies. Decline in Votlas' revenue is attributable to lower execution of international orders
Cooling products 1539 1836 2052 15.5 932.6 965.16 1075.5 7.4
Voltas being the largest RAC player in the country, recorded a sharp revenue CAGR of 15.5% due to new product launches, strong brand and dealer network across India
Total net sales 5186 5531 5266 0.8 2820.4 2924 2915 1.7Muted topline growth is largely due to slowdown in project business as the project business of both companies contributes over 50% to the topline
EBIT marginProject business 5.4 1.6 -1.5 -5.9 3.6 3.3
Cooling products 8.4 9.0 12.3 9.4 8.3 8.8Coling product margin remains strong for Voltas, as the company successfully passed on the price hike to end customers to offset higher raw material cost
Blue Star Ltd>MEP player focused in India and Middle East
Voltas
>Largly focused on sectors like airport/ ITes/commercial
>Largly focused on sectors like ITes/commercialAbout Company
>MEP player, largely focused on India>Indian RAC manufacturers with dealer network over 6500 across India With market share of ~20%
>Indian RAC manufacturers with dealer network over 2000 across India With market share of ~8%
Source: Company, ICICIdirect.com Research
MEP players have suffered significantly in the last three or four years, with rising competition (hitting margin), reduction in new order booking due to the dismal business environment and the conscious decision to avoid new contracts that did not meet reasonable financial and commercial criteria
Page 17ICICI Securities Ltd | Retail Equity Research
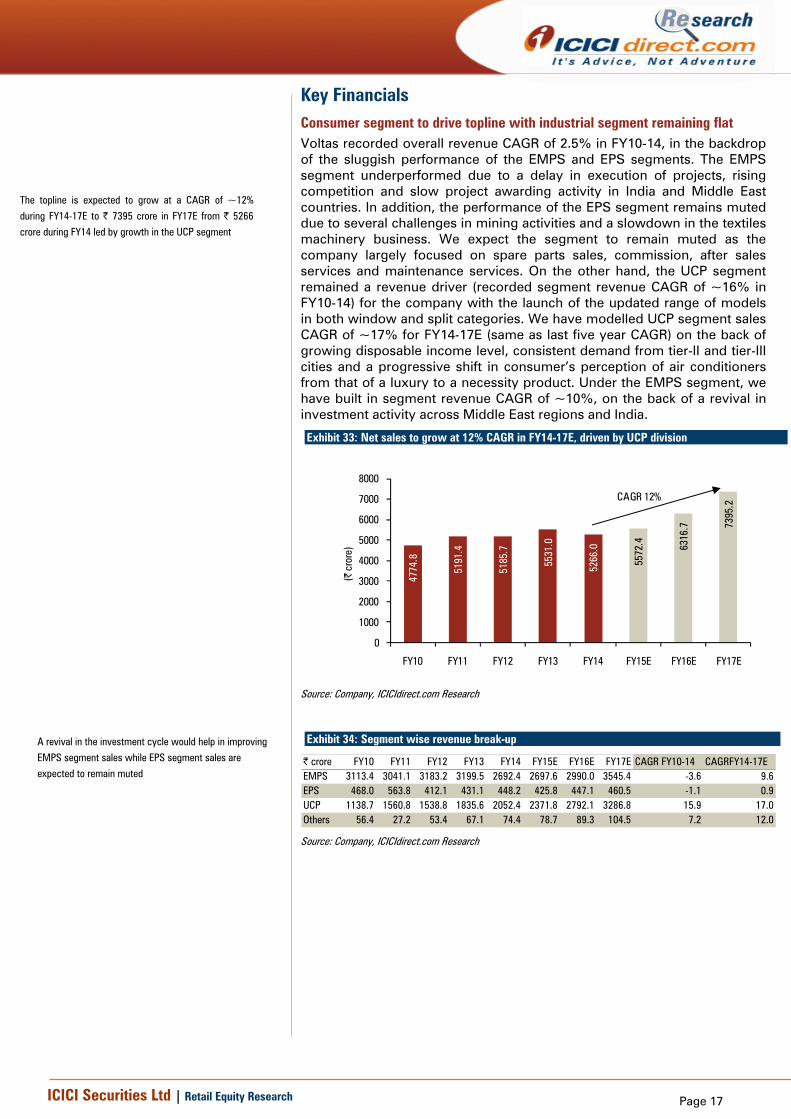
Key Financials Consumer segment to drive topline with industrial segment remaining flat Voltas recorded overall revenue CAGR of 2.5% in FY10-14, in the backdrop of the sluggish performance of the EMPS and EPS segments. The EMPS segment underperformed due to a delay in execution of projects, rising competition and slow project awarding activity in India and Middle East countries. In addition, the performance of the EPS segment remains muted due to several challenges in mining activities and a slowdown in the textiles machinery business. We expect the segment to remain muted as the company largely focused on spare parts sales, commission, after sales services and maintenance services. On the other hand, the UCP segment remained a revenue driver (recorded segment revenue CAGR of ~16% in FY10-14) for the company with the launch of the updated range of models in both window and split categories. We have modelled UCP segment sales CAGR of ~17% for FY14-17E (same as last five year CAGR) on the back of growing disposable income level, consistent demand from tier-II and tier-III cities and a progressive shift in consumer’s perception of air conditioners from that of a luxury to a necessity product. Under the EMPS segment, we have built in segment revenue CAGR of ~10%, on the back of a revival in investment activity across Middle East regions and India.
Exhibit 33: Net sales to grow at 12% CAGR in FY14-17E, driven by UCP division
4774
.8
5191
.4
5185
.7
5531
.0
5266
.0
5572
.4 6316
.7 7395
.2
0
1000
2000
3000
4000
5000
6000
7000
8000
FY10 FY11 FY12 FY13 FY14 FY15E FY16E FY17E
(| c
rore
)
CAGR 12%
Source: Company, ICICIdirect.com Research
Exhibit 34: Segment wise revenue break-up
| crore FY10 FY11 FY12 FY13 FY14 FY15E FY16E FY17E CAGR FY10-14 CAGRFY14-17EEMPS 3113.4 3041.1 3183.2 3199.5 2692.4 2697.6 2990.0 3545.4 -3.6 9.6EPS 468.0 563.8 412.1 431.1 448.2 425.8 447.1 460.5 -1.1 0.9UCP 1138.7 1560.8 1538.8 1835.6 2052.4 2371.8 2792.1 3286.8 15.9 17.0Others 56.4 27.2 53.4 67.1 74.4 78.7 89.3 104.5 7.2 12.0
Source: Company, ICICIdirect.com Research
The topline is expected to grow at a CAGR of ~12%
during FY14-17E to | 7395 crore in FY17E from | 5266
crore during FY14 led by growth in the UCP segment
A revival in the investment cycle would help in improving
EMPS segment sales while EPS segment sales are
expected to remain muted

Page 18ICICI Securities Ltd | Retail Equity Research
Strong UCP performance to help in margin expansion EBITDA margins plunged sharply in FY14 to ~5% on the back of a sharp cost overrun due to delay in execution of projects. Voltas recorded an EBIT loss of | 39.5 crore in the EMPS segment during FY14 Vs | 309 crore EBIT profit recorded during FY10. However, the UCP segment recorded a relatively steadier margin during FY10-14 and provided support to overall margins. We believe sustained growth in revenue from the UCP segment (higher proportion of premium product sales) and a gradual recovery in the EMPS segment (due to timely execution of new projects) will aid margins. We have modelled EBITDA margin of 7.6%, 7.9% and 8% for FY15E, FY16E and FY17E, respectively, considering the improved project execution cycle and focus on higher margin orders, going forward. However, our margin estimates are still below FY10 level, considering the rising competition in the EMPS and RAC segments.
Exhibit 35: Exiting legacy orders, change in product mix in UCP segment to drive margin
477
463
336
238 26
6
424 50
2
591
10.08.9
6.5
4.35.0
7.6 7.9 8.0
0
100
200
300
400
500
600
700
FY10 FY11 FY12 FY13 FY14 FY15E FY16E FY17E
(| c
rore
)
0.0
2.0
4.0
6.0
8.0
10.0
12.0
(%)
EBITDA EBITDA Margin
Source: Company, ICICIdirect.com Research
Recovery in margin leads to growth in profit We believe the sharp contraction in net profit during FY12-13 was largely on account of the EMPS segment. However, the UCP segment cushioned the bottomline and helped in generating positive cash flows. A recovery in margin from the EMPS segment coupled with the steady margin of the UCP segment in FY15E-17E would help drive Voltas’ bottomline, going forward. We believe the bottomline of the company will record a CAGR of ~24% in FY14-17E.
Exhibit 36: Net profit to grow at ~24% CAGR in FY14-17E
381.
0
357.
2
161.
9 207.
8
245.
4
486.
9
410.
3 464.
8
0
100
200
300
400
500
600
FY10 FY11 FY12 FY13 FY14 FY15E FY16E FY17E
(| c
rore
)
Sharp jump in PAT is due to one time gain from the sale of land in Thane
Source: Company, ICICIdirect.com Research
We expect operating margins to have bottomed out in
FY14 and expect the EBITDA margin to recover in FY15E-
17E. However, the recovery in margin would be in line
with the average margin recorded during FY08-10
With a recovery in the EMPS margin (as new orders
commands margin of ~5%) coupled with strong margin
of UCP segment (EBIT margin ~12.5-12.8% in FY15E-
17E) and EPS segment (EBIT margin ~16-17% in FY15E-
17E), respectively. We expect net profit to grow at a
CAGR of 24% in FY14-17E. Further, we believe the
company would record a one-time gain of ~| 195 crore
in FY15E from the sale of the land bank in Thane
Page 19ICICI Securities Ltd | Retail Equity Research
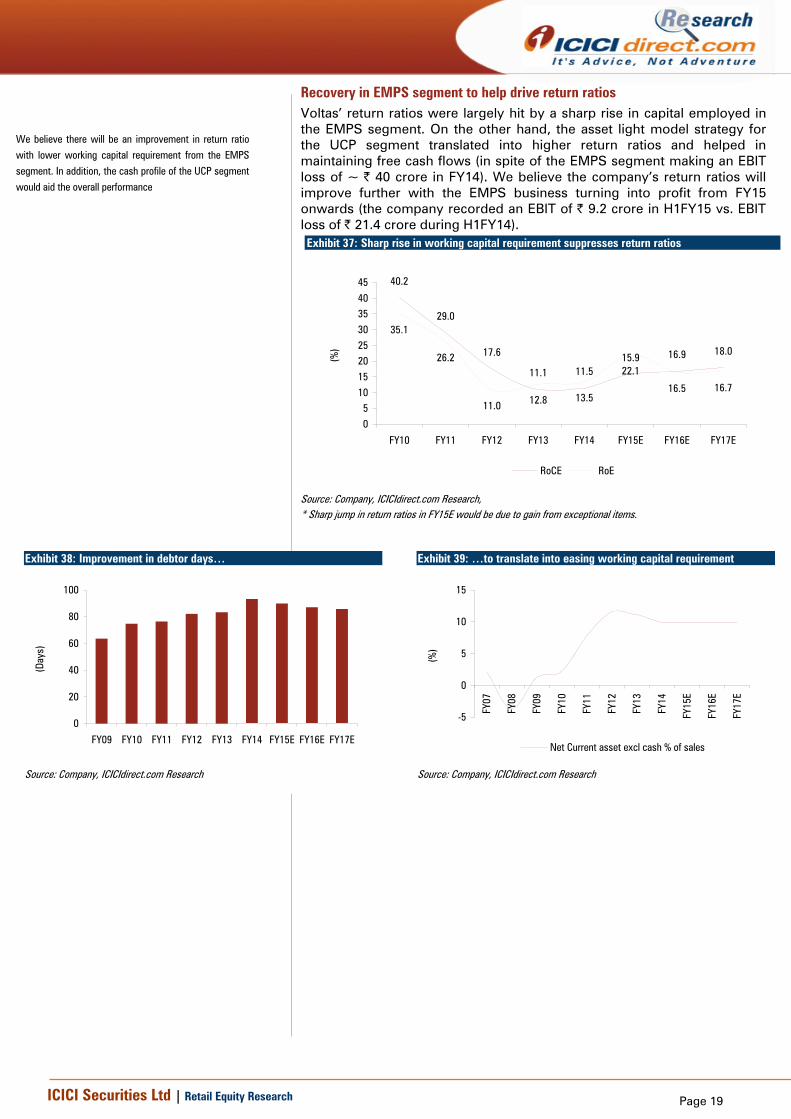
Recovery in EMPS segment to help drive return ratios Voltas’ return ratios were largely hit by a sharp rise in capital employed in the EMPS segment. On the other hand, the asset light model strategy for the UCP segment translated into higher return ratios and helped in maintaining free cash flows (in spite of the EMPS segment making an EBIT loss of ~ | 40 crore in FY14). We believe the company’s return ratios will improve further with the EMPS business turning into profit from FY15 onwards (the company recorded an EBIT of | 9.2 crore in H1FY15 vs. EBIT loss of | 21.4 crore during H1FY14).
Exhibit 37: Sharp rise in working capital requirement suppresses return ratios
40.2
29.0
17.6
11.1 11.515.9 16.9 18.0
35.1
26.2
11.0 12.8 13.5
22.1
16.5 16.7
05
1015202530354045
FY10 FY11 FY12 FY13 FY14 FY15E FY16E FY17E
(%)
RoCE RoE
Source: Company, ICICIdirect.com Research, * Sharp jump in return ratios in FY15E would be due to gain from exceptional items.
Exhibit 38: Improvement in debtor days…
0
20
40
60
80
100
FY09 FY10 FY11 FY12 FY13 FY14 FY15E FY16E FY17E
(Day
s)
Source: Company, ICICIdirect.com Research
Exhibit 39: …to translate into easing working capital requirement
-5
0
5
10
15
FY07
FY08
FY09
FY10
FY11
FY12
FY13
FY14
FY15
E
FY16
E
FY17
E
(%)
Net Current asset excl cash % of sales
Source: Company, ICICIdirect.com Research
We believe there will be an improvement in return ratio with lower working capital requirement from the EMPS segment. In addition, the cash profile of the UCP segment would aid the overall performance

Page 20ICICI Securities Ltd | Retail Equity Research
Risk & concerns Cut in infra spending by Middle East countries may hurt topline growth Middle East countries contribute ~27% in EMPS topline and a decline in crude prices can force Middle East countries to cut their infra spending. Any cut in infra spending would directly hit the earnings of the main contractors in the Middle East regions. This is clearly evident from the fact that during the downturn average oil production of GCC countries declined ~11%, from 16.14 million barrels per day in 2008 to 14.48 million barrels per day in FY10. This led to a decline in GDP per capita from US$27318 to US$23858 during the same period. In addition, visas in the Middle East (mainly in Saudi Arabia and Qatar) remain a challenge.
Flattish revenue from EPS segment The EPS contribution to the topline remained minimal (~9%) over the years due to a slowdown in mining activity and sluggish demand of textiles machineries. The textile machinery business is vulnerable to an investment slowdown, shortages of electricity and changes in government policy. The business is also highly sensitive to any change in import policies of China, which is a major importer of yarn.
Rising competition in RAC segment may hurt margin With the entry of MNCs (LG, Samsung, etc.) and introduction of energy efficient products, India has been identified as a focus market. Competition is, therefore, expected to remain intense in the foreseeable future. It may hit the margin of Voltas.
Continuous price increase may benefit substitutes AC product units have become less affordable due to price hikes across the board, in response to the need to comply with BEE’s upgraded energy regulations and adverse foreign exchange movements. This may impact demand. On the other hand, the Company’s energy efficiency platform for ACs is being challenged by competing DC inverter models, which promise greater cost savings but at relatively high prices. This makes other cooling products like air cooler more affordable for first time buyers.

Page 21ICICI Securities Ltd | Retail Equity Research
Valuation We believe Voltas will record revenue CAGR of 12% in FY14-17E (vs. 2.5% CAGR recorded during FY10-14) owing to the company’s UCP division, which is expected to record a topline growth of ~17% during the same period. We have built in consolidated order inflow growth of 12% in FY14-17E (vs. 8% CAGR in FY10-14) considering the revival in the investment cycle in India and Middle East countries (considering mega events like Dubai Expo and FIFA World Cup). Further, the company’s strategy to focus more on execution of projects and bid for selective smaller projects with a ticket size of | 300-400 crore would help in lower working capital requirement. In addition, a favourable revenue mix with higher share of domestic orders (with margins higher by ~100 bps compared to international order), along with steady revenue would also help in driving the topline growth. We expect EBITDA CAGR of ~31% in FY14-17E (vs. -13.6% in FY10-14) largely due to higher margins in the UCP and EPS segments while a gradual recovery in profitability in the EMPS segment would aid margins. As a result of a recovery in margin, net profit is expected to grow at 24% CAGR in FY14-17E (vs. -10% CAGR in FY10-14). The stock price run up of ~188% in a year was largely due to the robust performance of the UCP division that remained an outperformer (in terms of segment revenue growth and margin profile). We believe the UCP segment provides strong support in the current valuation of Voltas due to its strong margin and cash flow generating nature coupled with its leadership position (despite the presence of MNCs players). If we compare the UCP segment with other CD companies like Whirlpool, Symphony, IFB Industries, Hitachi and Blue Star, Voltas’ performance remains better or in line with its peers. We reckon a revival in profitability with the existing asset light model would translate into better return ratios and healthy cash flows. This will further strengthen the balance sheet (net cash of | 600 crore in FY14). Moreover, a better economic scenario will lead to a further re-rating of the stock. Historically, the stock has traded at an average one year forward PE multiple of 17x. At the CMP, the stock is trading at 20x FY16E and 18x FY17E earnings. We believe the stock is trading at attractive multiples considering the strong performance of the UCP business and recovery in the EMPS segment. Considering the two different portfolio consumer and industrial facing business of Voltas, we are valuing the consumer and industrial businesses separately using the sum of the parts (SOTP) method. We have valued the UCP segment on a PE basis by ascribing PE multiple of 27x FY17 earnings (22% premium to average multiple of other white goods players like Whirlpool, Symphony, IFB Industries, Hitachi and Blue Star). We ascribe a PE multiple of 5x FY17E earning to the EMPS business (considering the sharp volatility in earnings) and 10x FY17E earnings to the EPS segment. We are initiating coverage on the stock with a BUY rating and a target price of | 348/share (based on 25x FY17 earnings).

Page 22ICICI Securities Ltd | Retail Equity Research
Exhibit 41: Historically Voltas has traded at average P/E multiple of 17x
05
10152025303540
Apr-0
5
Apr-0
6
Apr-0
7
Apr-0
8
Apr-0
9
Apr-1
0
Apr-1
1
Apr-1
2
Apr-1
3
Apr-1
4
(x) Avg P/E 17x
Source: Company, ICICIdirect.com Research
Exhibit 42: One year forward P/E (x)
0
50
100
150
200
250
300
Apr-0
5
Apr-0
6
Apr-0
7
Apr-0
8
Apr-0
9
Apr-1
0
Apr-1
1
Apr-1
2
Apr-1
3
Apr-1
4
23x
18x
13x
8x
Source: Company, ICICIdirect.com Research
Exhibit 43: Competitor’s valuation matrix (in | crore)
FY14 FY15E FY16E FY17E FY14 FY15E FY16E FY17E FY14 FY15E FY16E FY17E FY14 FY15E FY16E FY17E FY14 FY15E FY16E FY17E FY14 FY15E FY16E FY17EIFB Ind 1953 999 1249 1491 1726 60 103 136 173 22 68 92 114 15 29 22 17 4 19 14 11 7 18 21 22Hitachi 2270 1099 1456 1805 2238 61 143 179 224 8 82 101 129 59 27 22 17 10 16 13 10 3 30 28 28Symphony 6716 533 689 874 1079 126 170 218 272 106 132 169 213 64 51 40 32 53 39 30 24 38 39 42 43Whirlpool 8003 2835 3404 4045 4920 226 320 407 561 123 199 259 373 24 40 31 21 11 24 19 14 18 23 23 27Blue Star 2926 2915 3162 3615 4167 148 159 226 287 77 111 144 183 23 25 19 15 15 21 15 12 18 19 25 27Average 37 34 27 20 19 24 18 14Voltas 8268 5266 5572 6317 7395 266 424 502 591 245 487 410 465 34 17 20 18 29 17 14 12 13 22 16 17
ROEEBITDA Net Profit PE EV/EBITDAPeer group
Mcap (in crore)
Sales
Source: Bloomberg, ICICIdirect.com Research
Exhibit 40: SOTP valuation Segment EPS (|) PE(x) Fair valueEMPS 0.1 5 1EPS 3.0 10 30UCP 11.8 27 317Target Price 348CMP 250upside/(Downside) (%) 39
Source: Company, ICICIdirect.com Research

Page 23ICICI Securities Ltd | Retail Equity Research
Exhibit 44: Income statement (| crore)
(Year-end March) FY13 FY14 FY15E FY16E FY17E
Net Sales 5,531.0 5,266.0 5,572.4 6,316.7 7,395.2
Expenses - - - - -
Raw Material Expenses 3,716.8 3,163.1 3,329.2 3,773.9 4,418.3
(inc)/Dec in stocks (136.2) 118.0 - - -
Purchase of traded goods 586.5 573.2 606.6 687.6 805.0
Employee Expenses 632.5 594.7 629.3 691.9 810.0
Marketing Expenses 91.1 108.5 114.9 130.2 152.4
Other expenses 402.3 442.9 468.7 531.3 618.6
Total Operating Expenditure 5,293.0 5,000.4 5,148.7 5,814.9 6,804.2
EBITDA 238.0 265.6 423.8 501.8 591.0
Other Income 90.1 100.2 120.6 144.1 154.2
Interest 32.6 22.6 23.7 26.4 28.1
PBDT 295.6 343.2 520.7 619.6 717.1
Depreciation 27.8 24.8 25.3 25.7 27.1
PBT before Exceptional Items 267.8 318.4 495.4 593.9 690.0
Less: Exceptional Items (12.1) (21.5) (195.0) - -
Total Tax 72.8 94.1 198.2 179.8 221.9
PAT before MI 207.1 245.8 492.1 414.0 468.1
Minority Interest (0.7) 0.5 5.6 3.8 3.3
PAT after MI 207.8 245.4 486.5 410.3 464.8
Profit from Associates - - 0.4 - -
PAT 207.8 245.4 486.9 410.3 464.8
EPS 6.3 7.4 14.7 12.4 14.1
Source: Company, ICICIdirect.com Research
Exhibit 45: Performance of subsidiaries
Ownership FY10 FY11 FY12 FY13 FY14 FY10 FY11 FY12 FY13 FY14Weathermaker Ltd 100% 42.5 33.8 41.5 44.1 27.9 6.4 4.7 3.0 3.9 -6.0
Saudi Ensas Company for Eng Serv W.L.L. 100% 12.8 3.4 6.0 21.8 17.7 0.1 3.8 -3.0 0.4 0.4
Metrovol FZE 100% 2.5 0.0 NA NA NA -2.2 -0.5 NA NA NALalbuksh Voltas Eng Serv & Trad. L.L.C. 60% NA NA 46.4 50.9 55.2 NA NA 3.8 0.3 0.5Voltas Oman L.L.C. 65% NA NA 0.0 9.9 56.5 NA NA -2.9 -2.5 0.9Voltas Netherlands B.V. 100% NA NA 0.0 36.4 12.0 NA 7.3 14.9 35.4 11.1Voice Antilles N.V. 100% 2.3 7.9 25.3 NA NA 2.2 7.7 25.1 NA NAVIL Overseas Enterprises 100% 4.3 NA NA NA NA 4.1 NA NA NA NASimto Investment Company Ltd 95.6% 0.9 1.1 1.8 NA NA 0.9 0.8 1.6 NA NAUniversal Comfort Products Ltd 100% 332.2 491.6 485.6 740.1 928.8 14.1 27.4 34.1 32.1 57.5Rohini Industrial Electricals Ltd 100% 213.9 161.9 117.4 83.5 101.0 9.3 -36.6 -26.2 -13.1 -6.9Auto Aircon (India) Ltd 100% NA NA 0 0.0 0.0 0.0 0.0 0.0 0.0 0.0
Revenue PAT
Source: Company, ICICIdirect.com Research
The consolidated topline of the company is expected to
grow at a CAGR of ~12% during FY14-17E to | 7395
crore in FY17E from | 5266 crore during FY14 supported
UCP segment
We expect operating margins to have bottomed out in FY14 and EBITDA margin to recover in FY15E-17E. The recovery in margin would be in line with the average margin recorded during FY08-10
Page 24ICICI Securities Ltd | Retail Equity Research
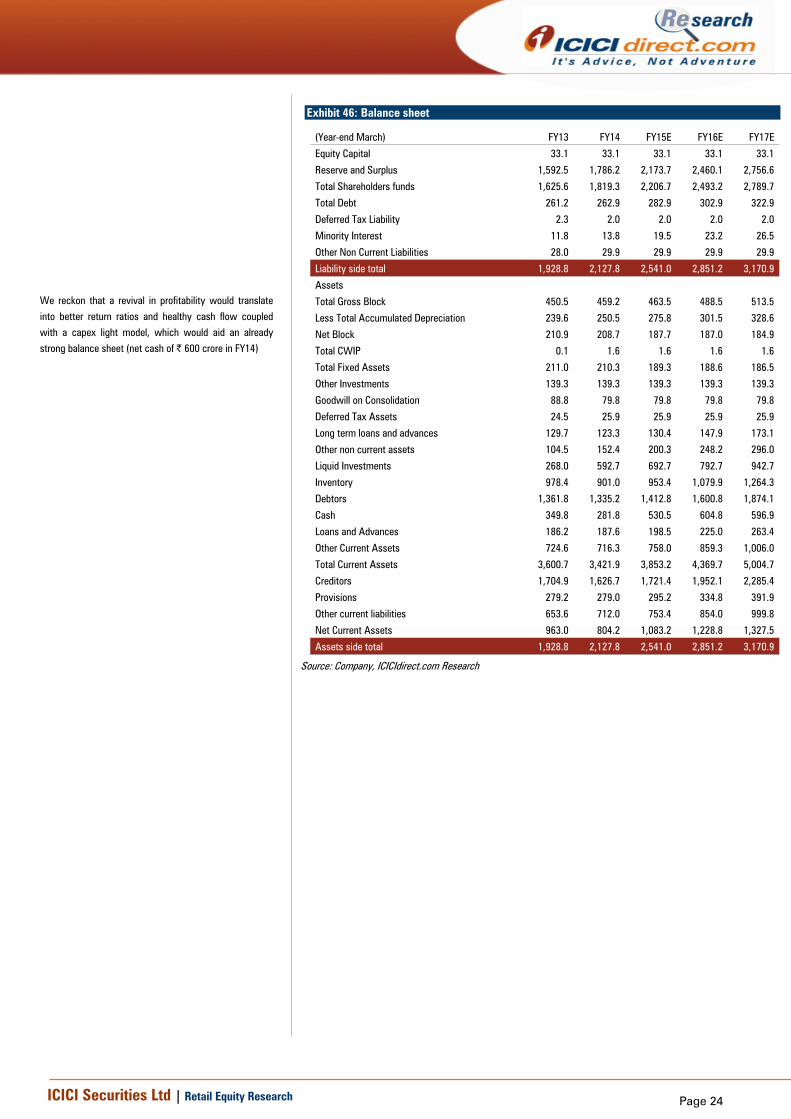
Exhibit 46: Balance sheet
X
(Year-end March) FY13 FY14 FY15E FY16E FY17E
Equity Capital 33.1 33.1 33.1 33.1 33.1
Reserve and Surplus 1,592.5 1,786.2 2,173.7 2,460.1 2,756.6
Total Shareholders funds 1,625.6 1,819.3 2,206.7 2,493.2 2,789.7
Total Debt 261.2 262.9 282.9 302.9 322.9
Deferred Tax Liability 2.3 2.0 2.0 2.0 2.0
Minority Interest 11.8 13.8 19.5 23.2 26.5
Other Non Current Liabilities 28.0 29.9 29.9 29.9 29.9
Liability side total 1,928.8 2,127.8 2,541.0 2,851.2 3,170.9
Assets
Total Gross Block 450.5 459.2 463.5 488.5 513.5
Less Total Accumulated Depreciation 239.6 250.5 275.8 301.5 328.6
Net Block 210.9 208.7 187.7 187.0 184.9
Total CWIP 0.1 1.6 1.6 1.6 1.6
Total Fixed Assets 211.0 210.3 189.3 188.6 186.5
Other Investments 139.3 139.3 139.3 139.3 139.3
Goodwill on Consolidation 88.8 79.8 79.8 79.8 79.8
Deferred Tax Assets 24.5 25.9 25.9 25.9 25.9
Long term loans and advances 129.7 123.3 130.4 147.9 173.1
Other non current assets 104.5 152.4 200.3 248.2 296.0
Liquid Investments 268.0 592.7 692.7 792.7 942.7
Inventory 978.4 901.0 953.4 1,079.9 1,264.3
Debtors 1,361.8 1,335.2 1,412.8 1,600.8 1,874.1
Cash 349.8 281.8 530.5 604.8 596.9
Loans and Advances 186.2 187.6 198.5 225.0 263.4
Other Current Assets 724.6 716.3 758.0 859.3 1,006.0
Total Current Assets 3,600.7 3,421.9 3,853.2 4,369.7 5,004.7
Creditors 1,704.9 1,626.7 1,721.4 1,952.1 2,285.4
Provisions 279.2 279.0 295.2 334.8 391.9
Other current liabilities 653.6 712.0 753.4 854.0 999.8
Net Current Assets 963.0 804.2 1,083.2 1,228.8 1,327.5
Assets side total 1,928.8 2,127.8 2,541.0 2,851.2 3,170.9
Source: Company, ICICIdirect.com Research
We reckon that a revival in profitability would translate
into better return ratios and healthy cash flow coupled
with a capex light model, which would aid an already
strong balance sheet (net cash of | 600 crore in FY14)

Page 25ICICI Securities Ltd | Retail Equity Research
Exhibit 47: Cash flow statement
(Year-end March) FY13 FY14 FY15E FY16E FY17E
Profit after Tax 207.8 245.4 486.9 410.3 464.8
Depreciation 27.8 24.8 25.3 25.7 27.1 Cash Flow before working capital changes 268.2 292.8 535.9 462.3 520.0
(Inc)/Dec Inventory (145.0) 77.4 (52.4) (126.5) (184.4)
(Inc)/Dec Debtors (195.0) 26.6 (77.7) (188.0) (273.3)
(Inc)/Dec Loans and Advances 22.7 (1.4) (10.9) (26.5) (38.4)
(Inc)/Dec Other Current Assets 86.2 8.2 (41.7) (101.2) (146.7)
Net Increase in Current Assets (231.1) 110.9 (182.7) (442.2) (642.8)
Inc/(Dec) Creditors 232.0 (78.2) 94.6 230.7 333.3
Inc/(Dec) Provisions 0.1 (0.2) 16.2 39.6 57.2
Inc/(Dec) Other current liabilities (12.4) 58.4 41.4 100.6 145.8
Net Increase in Current Liabilities 219.7 (20.0) 152.3 370.9 536.3
Net cash flow from operating activities 256.8 383.6 505.5 391.1 413.4
Long term loans and advances (14.1) 6.5 (7.2) (17.4) (25.2)
Other non current assets 15.8 (47.9) (47.9) (47.9) (47.9)
Liquid Investments (44.7) (324.7) (100.0) (100.0) (150.0)
(Purchase)/Sale of Fixed Assets (33.8) (24.1) (4.3) (25.0) (25.0)
Liquid Investments (44.7) (324.7) (100.0) (100.0) (150.0)
Others (1.7) 335.9 105.6 103.8 153.3
Net Cash flow from Investing Activities (123.2) (379.0) (153.7) (186.6) (244.9)
Proceeds/(Repament) loans 37.8 1.7 20.0 20.0 20.0
Total Outflow on account of dividend (61.9) (71.6) (99.4) (123.8) (168.3)
Others (30.7) (2.6) (23.7) (26.4) (28.1)
Net Cash flow from Financing Activities (54.9) (72.6) (103.1) (130.2) (176.4)
Net Cash flow 78.8 (68.0) 248.7 74.3 (7.8)
Cash and Cash Equivalent at the beginning 325.9 422.3 384.9 660.6 781.2
Cash 349.8 281.8 530.5 604.8 596.9
Source: Company, ICICIdirect.com Research
We believe the improved free cash flow for the company would result in higher dividend payout. In turn, this would improve the return ratios of the company

Page 26ICICI Securities Ltd | Retail Equity Research
Exhibit 48: Ratio analysis
(Year-end March) FY13 FY14 FY15E FY16E FY17E
Per Share Data
EPS 6.3 7.4 14.7 12.4 14.1
Cash EPS 7.1 8.2 15.5 13.2 14.9
BV 49.2 55.0 66.7 75.4 84.3
DPS 1.6 1.9 2.6 3.2 4.4
Operating Ratios
EBITDA margin 4.3 5.0 7.6 7.9 8.0
PAT margin 3.8 4.7 8.7 6.5 6.3
Return Ratios - - - - -
RoE 12.8 13.5 22.1 16.5 16.7
RoCE 11.1 11.5 15.9 16.9 18.0
RoIC 16.0 19.2 30.3 32.8 34.6
Valuation Ratios
EV / EBITDA 33.2 28.8 17.3 14.3 11.9
P/E 39.8 33.7 17.0 20.2 17.8
EV / Net Sales 1.4 1.5 1.3 1.1 1.0
Sales / Equity 3.4 2.9 2.5 2.5 2.7
Market Cap / Sales 1.5 1.6 1.5 1.3 1.1
Price to Book Value 5.1 4.5 3.7 3.3 3.0
Turnover Ratios
Asset turnover 3.0 2.6 2.4 2.3 2.5
Debtors Turnover Ratio 4.1 3.9 3.9 3.9 3.9
Creditors Turnover Ratio 3.2 3.2 3.2 3.2 3.2
Solvency Ratios
Debt / Equity 0.2 0.1 0.1 0.1 0.1
Current Ratio 1.4 1.3 1.4 1.4 1.4
Quick Ratio 1.0 1.0 1.0 1.0 1.0
Source: Company, ICICIdirect.com Research
We believe execution of higher margin projects coupled with the consistent performance of the UCP segment in FY14-17E would reduce the working capital requirement and, hence, help in improving return ratios, going forward
Page 27ICICI Securities Ltd | Retail Equity Research
ANALYST CERTIFICATION We /I, Abhishek Shindadkar, MBA and Hardik Varma, MBA, Research Analysts, authors and the names subscribed to this report, hereby certify that all of the views expressed in this research report accurately reflect our views about the subject issuer(s) or securities. We also certify that no part of our compensation was, is, or will be directly or indirectly related to the specific recommendation(s) or view(s) in this report.
Terms & conditions and other disclosures: ICICI Securities Limited (ICICI Securities) is a full-service, integrated investment banking and is, inter alia, engaged in the business of stock brokering and distribution of financial products. ICICI Securities is a wholly-owned subsidiary of ICICI Bank which is India’s largest private sector bank and has its various subsidiaries engaged in businesses of housing finance, asset management, life insurance, general insurance, venture capital fund management, etc. (“associates”), the details in respect of which are available on www.icicibank.com. ICICI Securities is one of the leading merchant bankers/ underwriters of securities and participate in virtually all securities trading markets in India. We and our associates might have investment banking and other business relationship with a significant percentage of companies covered by our Investment Research Department. ICICI Securities generally prohibits its analysts, persons reporting to analysts and their relatives from maintaining a financial interest in the securities or derivatives of any companies that the analysts cover. The information and opinions in this report have been prepared by ICICI Securities and are subject to change without any notice. The report and information contained herein is strictly confidential and meant solely for the selected recipient and may not be altered in any way, transmitted to, copied or distributed, in part or in whole, to any other person or to the media or reproduced in any form, without prior written consent of ICICI Securities. While we would endeavour to update the information herein on a reasonable basis, ICICI Securitiesis is under no obligation to update or keep the information current. Also, there may be regulatory, compliance or other reasons that may prevent ICICI Securities from doing so. Non-rated securities indicate that rating on a particular security has been suspended temporarily and such suspension is in compliance with applicable regulations and/or ICICI Securities policies, in circumstances where ICICI Securities might be acting in an advisory capacity to this company, or in certain other circumstances. This report is based on information obtained from public sources and sources believed to be reliable, but no independent verification has been made nor is its accuracy or completeness guaranteed. This report and information herein is solely for informational purpose and shall not be used or considered as an offer document or solicitation of offer to buy or sell or subscribe for securities or other financial instruments. Though disseminated to all the customers simultaneously, not all customers may receive this report at the same time. ICICI Securities will not treat recipients as customers by virtue of their receiving this report. Nothing in this report constitutes investment, legal, accounting and tax advice or a representation that any investment or strategy is suitable or appropriate to your specific circumstances. The securities discussed and opinions expressed in this report may not be suitable for all investors, who must make their own investment decisions, based on their own investment objectives, financial positions and needs of specific recipient. This may not be taken in substitution for the exercise of independent judgment by any recipient. The recipient should independently evaluate the investment risks. The value and return on investment may vary because of changes in interest rates, foreign exchange rates or any other reason. ICICI Securities accepts no liabilities whatsoever for any loss or damage of any kind arising out of the use of this report. Past performance is not necessarily a guide to future performance. Investors are advised to see Risk Disclosure Document to understand the risks associated before investing in the securities markets. Actual results may differ materially from those set forth in projections. Forward-looking statements are not predictions and may be subject to change without notice. ICICI Securities or its associates might have managed or co-managed public offering of securities for the subject company or might have been mandated by the subject company for any other assignment in the past twelve months. ICICI Securities or its associates might have received any compensation from the companies mentioned in the report during the period preceding twelve months from the date of this report for services in respect of managing or co-managing public offerings, corporate finance, investment banking or merchant banking, brokerage services or other advisory service in a merger or specific transaction. ICICI Securities or its associates might have received any compensation for products or services other than investment banking or merchant banking or brokerage services from the companies mentioned in the report in the past twelve months. ICICI Securities encourages independence in research report preparation and strives to minimize conflict in preparation of research report. ICICI Securities or its analysts did not receive any compensation or other benefits from the companies mentioned in the report or third party in connection with preparation of the research report. Accordingly, neither ICICI Securities nor Research Analysts have any material conflict of interest at the time of publication of this report. It is confirmed that Abhishek Shindadkar, MBA and Hardik Varma, MBA, Research Analysts of this report have not received any compensation from the companies mentioned in the report in the preceding twelve months. Compensation of our Research Analysts is not based on any specific merchant banking, investment banking or brokerage service transactions. ICICI Securities or its subsidiaries collectively or Research Analysts do not own 1% or more of the equity securities of the Company mentioned in the report as of the last day of the month preceding the publication of the research report. Since associates of ICICI Securities are engaged in various financial service businesses, they might have financial interests or beneficial ownership in various companies including the subject company/companies mentioned in this report. It is confirmed that Abhishek Shindadkar, MBA and Hardik Varma, MBA, Research Analysts do not serve as an officer, director or employee of the companies mentioned in the report. ICICI Securities may have issued other reports that are inconsistent with and reach different conclusion from the information presented in this report. Neither the Research Analysts nor ICICI Securities have been engaged in market making activity for the companies mentioned in the report. We submit that no material disciplinary action has been taken on ICICI Securities by any Regulatory Authority impacting Equity Research Analysis activities. This report is not directed or intended for distribution to, or use by, any person or entity who is a citizen or resident of or located in any locality, state, country or other jurisdiction, where such distribution, publication, availability or use would be contrary to law, regulation or which would subject ICICI Securities and affiliates to any registration or licensing requirement within such jurisdiction. The securities described herein may or may not be eligible for sale in all jurisdictions or to certain category of investors. Persons in whose possession this document may come are required to inform themselves of and to observe such restriction.
RATING RATIONALE ICICIdirect.com endeavours to provide objective opinions and recommendations. ICICIdirect.com assigns ratings to its stocks according to their notional target price vs. current market price and then categorises them as Strong Buy, Buy, Hold and Sell. The performance horizon is two years unless specified and the notional target price is defined as the analysts' valuation for a stock. Strong Buy: >15%/20% for large caps/midcaps, respectively, with high conviction; Buy: >10%/15% for large caps/midcaps, respectively; Hold: Up to +/-10%; Sell: -10% or more;
Pankaj Pandey Head – Research [email protected]
ICICIdirect.com Research Desk, ICICI Securities Limited, 1st Floor, Akruti Trade Centre, Road No 7, MIDC, Andheri (East) Mumbai – 400 093

Page 28ICICI Securities Ltd | Retail Equity Research
ANALYST CERTIFICATION We /I, Sanjay Manyal, MBA (Finance) and Hitesh Taunk, MBA (Finance), Research Analysts, authors and the names subscribed to this report, hereby certify that all of the views expressed in this research report accurately reflect our views about the subject issuer(s) or securities. We also certify that no part of our compensation was, is, or will be directly or indirectly related to the specific recommendation(s) or view(s) in this report.
Terms & conditions and other disclosures: ICICI Securities Limited (ICICI Securities) is a full-service, integrated investment banking and is, inter alia, engaged in the business of stock brokering and distribution of financial products. ICICI Securities is a wholly-owned subsidiary of ICICI Bank which is India’s largest private sector bank and has its various subsidiaries engaged in businesses of housing finance, asset management, life insurance, general insurance, venture capital fund management, etc. (“associates”), the details in respect of which are available on www.icicibank.com. ICICI Securities is one of the leading merchant bankers/ underwriters of securities and participate in virtually all securities trading markets in India. We and our associates might have investment banking and other business relationship with a significant percentage of companies covered by our Investment Research Department. ICICI Securities generally prohibits its analysts, persons reporting to analysts and their relatives from maintaining a financial interest in the securities or derivatives of any companies that the analysts cover. The information and opinions in this report have been prepared by ICICI Securities and are subject to change without any notice. The report and information contained herein is strictly confidential and meant solely for the selected recipient and may not be altered in any way, transmitted to, copied or distributed, in part or in whole, to any other person or to the media or reproduced in any form, without prior written consent of ICICI Securities. While we would endeavour to update the information herein on a reasonable basis, ICICI Securitiesis is under no obligation to update or keep the information current. Also, there may be regulatory, compliance or other reasons that may prevent ICICI Securities from doing so. Non-rated securities indicate that rating on a particular security has been suspended temporarily and such suspension is in compliance with applicable regulations and/or ICICI Securities policies, in circumstances where ICICI Securities might be acting in an advisory capacity to this company, or in certain other circumstances. This report is based on information obtained from public sources and sources believed to be reliable, but no independent verification has been made nor is its accuracy or completeness guaranteed. This report and information herein is solely for informational purpose and shall not be used or considered as an offer document or solicitation of offer to buy or sell or subscribe for securities or other financial instruments. Though disseminated to all the customers simultaneously, not all customers may receive this report at the same time. ICICI Securities will not treat recipients as customers by virtue of their receiving this report. Nothing in this report constitutes investment, legal, accounting and tax advice or a representation that any investment or strategy is suitable or appropriate to your specific circumstances. The securities discussed and opinions expressed in this report may not be suitable for all investors, who must make their own investment decisions, based on their own investment objectives, financial positions and needs of specific recipient. This may not be taken in substitution for the exercise of independent judgment by any recipient. The recipient should independently evaluate the investment risks. The value and return on investment may vary because of changes in interest rates, foreign exchange rates or any other reason. ICICI Securities accepts no liabilities whatsoever for any loss or damage of any kind arising out of the use of this report. Past performance is not necessarily a guide to future performance. Investors are advised to see Risk Disclosure Document to understand the risks associated before investing in the securities markets. Actual results may differ materially from those set forth in projections. Forward-looking statements are not predictions and may be subject to change without notice. ICICI Securities or its associates might have managed or co-managed public offering of securities for the subject company or might have been mandated by the subject company for any other assignment in the past twelve months. ICICI Securities or its associates might have received any compensation from the companies mentioned in the report during the period preceding twelve months from the date of this report for services in respect of managing or co-managing public offerings, corporate finance, investment banking or merchant banking, brokerage services or other advisory service in a merger or specific transaction. ICICI Securities or its associates might have received any compensation for products or services other than investment banking or merchant banking or brokerage services from the companies mentioned in the report in the past twelve months. ICICI Securities encourages independence in research report preparation and strives to minimize conflict in preparation of research report. ICICI Securities or its analysts did not receive any compensation or other benefits from the companies mentioned in the report or third party in connection with preparation of the research report. Accordingly, neither ICICI Securities nor Research Analysts have any material conflict of interest at the time of publication of this report. It is confirmed that Sanjay Manyal, MBA (Finance) and Hitesh Taunk, MBA (Finance), Research Analysts of this report have not received any compensation from the companies mentioned in the report in the preceding twelve months. Compensation of our Research Analysts is not based on any specific merchant banking, investment banking or brokerage service transactions. ICICI Securities or its subsidiaries collectively or Research Analysts do not own 1% or more of the equity securities of the Company mentioned in the report as of the last day of the month preceding the publication of the research report. Since associates of ICICI Securities are engaged in various financial service businesses, they might have financial interests or beneficial ownership in various companies including the subject company/companies mentioned in this report. It is confirmed Sanjay Manyal, MBA (Finance) and Hitesh Taunk, MBA (Finance), Research Analysts do not serve as an officer, director or employee of the companies mentioned in the report. ICICI Securities may have issued other reports that are inconsistent with and reach different conclusion from the information presented in this report. Neither the Research Analysts nor ICICI Securities have been engaged in market making activity for the companies mentioned in the report. We submit that no material disciplinary action has been taken on ICICI Securities by any Regulatory Authority impacting Equity Research Analysis activities. This report is not directed or intended for distribution to, or use by, any person or entity who is a citizen or resident of or located in any locality, state, country or other jurisdiction, where such distribution, publication, availability or use would be contrary to law, regulation or which would subject ICICI Securities and affiliates to any registration or licensing requirement within such jurisdiction. The securities described herein may or may not be eligible for sale in all jurisdictions or to certain category of investors. Persons in whose possession this document may come are required to inform themselves of and to observe such restriction.