Embed Size (px)
Citation preview

Bettering the Branch: An Overview of the Current Conditions
Habitat, Water Quality, and General Morphology
N. Turyk, P. McGinley, K. Rasmussen University of Wisconsin-Stevens Point
Report to the Friends of the Branch River and
Wisconsin Department of Natural Resource
December 2004

Bettering the Branch – University of Wisconsin-Stevens Point - December 2004 ii

Bettering the Branch – University of Wisconsin-Stevens Point - December 2004 iii
ACKNOWLEDGEMENTS Sincere thanks goes to the organizations that provided funding for this project including: Wisconsin Department of Natural Resources, the Friends of the Branch River, University of Wisconsin Stevens Point – College of Natural Resources, Southern Brown Conservation Club, and Trout Unlimited. Special thanks go out to John and Nancy Roberts and the other members of the Friends of the Branch River for their unwavering assistance throughout the course of the project. I would like to sincerely thank the following individuals and agencies who have provided assistance throughout the course of the project: • Nancy Turyk (UWSP Center for Watershed Science and Education) for her guidance,
support, patience, and assistance throughout the entire project. • Paul McGinley (UWSP Center for Watershed Science and Education) for his guidance,
editing, and technical assistance. • Kevin Lawton, the Information Processing Consultant at UWSP, for his assistance with
spatial informational systems. • UWSP Water and Environmental Analysis Lab (WEAL) for the analysis of water and
crayfish samples. • UWSP Aquatic Entomology Lab for the technical assistance and analysis of the
macroinvertebrate samples. • Village of Whitelaw • Wisconsin Department of Natural Resources • Brown and Manitowoc County Soil and Water Conservation Department • Southern Brown Conservation Club • Village of Whitelaw • Wisconsin River Alliance • The Center for Watershed Science and Education including the following students: Kirk
Lambrecht, Chris Dietrich, Luke Hennigan, Stacy Lueck, Mark Breunig, Andy Janicki, and Ross Crandall

Bettering the Branch – University of Wisconsin-Stevens Point - December 2004 iv
EXECUTIVE SUMMARY The Branch River is a 37-mile river system located in Brown and Manitowoc Counties. Approximately 110 square miles of land drain to the Branch River. The land uses in the watershed are predominantly agriculture, forests, and grasslands. The Branch River receives its water from direct precipitation, surface runoff, tributaries, and groundwater. One hundred sixty springs that discharge to the Branch River were identified by the Friends of the Branch River (FOBR) in 2003/04. This study was designed to evaluate the current conditions in the Branch River for general water quality, in-river habitat, and physical characteristics. This study was conducted cooperatively by Friends of the Branch River, Wisconsin DNR, UWSP Center for Watershed Science and Education, Brown and Manitowoc County Land Conservation Departments, Southern Brown Conservation Club, and Trout Unlimited. In the Branch River watershed, wetlands can accumulate water during high flow periods and slowly release the water. They also act as a filter, removing sediment and associated nutrients. Although efforts have been made to restore wetlands near the upper reaches of the Branch River, the river continues to be flashy and erosive in the middle reaches. This adds sediment and nutrients to the river system. The high velocities during peak flows may also limit the longevity of fish habitat improvements; therefore, efforts to restore wetlands and use land management practices that slow the movement of water would improve conditions in the Branch River. An assessment of fish habitat was conducted in August 2003 during low flow. Wisconsin DNR baseline monitoring techniques were used at 11 stations in the Branch River and the Sunny Slope Rd. tributary. This assessment evaluated 12 transects per station for river sediment characteristics, depth of water, fish cover, and shoreland vegetative health. In general, many of the stations had good to excellent fish cover, riparian buffer width, and rocky substrate. Limiting factors at many sites included bank instability, minimal pool area, shallow depth of the thalweg, and excessive fine sediment. Water quality was evaluated at ten sites on the Branch River and two tributaries and in eleven springs. River water was analyzed twice during baseflow (low flow) conditions and during three events (high flow). Although the small number of samples precludes in-depth interpretation, they are sufficient to give a general overview of water quality conditions in the Branch River and its watershed. Similar to most rivers, total suspended solids, nitrogen, and phosphorus are entering the Branch River during snowmelt and runoff. High concentrations of these reduce habitat quality through sedimentation and can encourage excessive algal growth. The amount of these constituents can be significantly reduced with adjustments in land use practices. Restoration of wetlands, use of retention ponds, minimal mowing of grass, use of buffers, winter cover crops, and other best management practices can be employed to slow the movement of water, reduce runoff volume, and decrease the quantity of solids in the Branch River. These practices can reduce some of the in-stream erosion and many of these practices also help to increase the amount of water in the Branch River during low flow periods.
Bettering the Branch – University of Wisconsin-Stevens Point - December 2004 v
Nitrate-N and chloride concentrations were greater in baseflow than event samples from the Branch River. This indicates that the river water quality is strongly influenced by the groundwater discharging into it, particularly during low flow. Baseflow nitrate-N concentrations ranged from 0.1 to 10.9 mg/L with median nitrate concentrations of 0.8 mg/L and 2.5 mg/L in 2003 and 2004, respectively. Nitrate-N concentrations in the springs ranged from 0.04 to 16.8 mg/L, with a median concentration of 6.2 mg/L. Historic private well data from the watershed showed 21% of the 88 samples exceeded the federal drinking water nitrate standard of 10 mg/L, indicating that nitrate is not only a potential issue in the river, but may also be a problem for many of the residents living in the Branch River watershed. It is likely that other agricultural chemicals are moving though the groundwater with the nitrate and chloride. The only additional chemical that was analyzed in this study was triazine, which was analyzed in the fall 2004 baseflow and spring samples. Concentrations were low, but this may be due to the time of year and/or the intense precipitation in early summer 2004. Non-native rusty crayfish are abundant in the Branch River. These crayfish may be responsible for the lack of aquatic vegetation in some stretches of the river. Limited aquatic vegetation reduces habitat for aquatic biota, increases erosion of bottom sediments, and allows nutrients to be delivered to the Manitowoc River and Lake Michigan. The non-native species clip the aquatic vegetation to feed on the microbes and algae living on the leaves. The abundant rusty crayfish are caught and consumed by many of the nearby residents, so tail tissue was analyzed for mercury and PCBs. Mercury concentrations ranged from 0.04 to 0.10 mg/kg. The mercury consumption advisory level is 0.05 mg/kg. No PCBs were detected in the samples.

Bettering the Branch – University of Wisconsin-Stevens Point - December 2004 vi
TABLE OF CONTENTS EXECUTIVE SUMMARY ........................................................................................................ IV LIST OF TABLES................................................................................................................... VIII LIST OF FIGURES.................................................................................................................... IX INTRODUCTION .........................................................................................................................1
BACKGROUND INFORMATION............................................................................................1 PHYSICAL WATERSHED CHARACTERISTICS ..................................................................3
Climate ....................................................................................................................................4 Topography..............................................................................................................................4 Geology ...................................................................................................................................5 Soil...........................................................................................................................................5 Land Use..................................................................................................................................7
AQUATIC CONTAMINANTS IN THE WATERSHED ........................................................10 PROJECT GOALS/OBJECTIVES ...........................................................................................11
METHODS...................................................................................................................................13 FIELD/LAB PROCEEDURES .................................................................................................13
Baseflow Sampling................................................................................................................13 Event Flow Sampling ............................................................................................................14 Groundwater Sampling..........................................................................................................15 Sample Analysis ....................................................................................................................16 Stream Flow Measurements ..................................................................................................17 Pressure Transducers .............................................................................................................17 Stream Bank Erosion.............................................................................................................17 Baseline Monitoring ..............................................................................................................18 Metadata ................................................................................................................................21 Sub-Watershed Delineation...................................................................................................21 Sinuosity ................................................................................................................................21
WATER QUALITY INTERPRETATION...............................................................................23 TEMPERATURE ......................................................................................................................23 DISOLVED OXYGEN .............................................................................................................23 CONDUCTIVITY.....................................................................................................................25 pH ..............................................................................................................................................25 NUTRIENTS.............................................................................................................................26
Nitrogen.................................................................................................................................26 Phosphorus ............................................................................................................................29
CHLORIDE...............................................................................................................................30 TOTAL SUSPENDED SOLIDS...............................................................................................30 ATRAZINE ...............................................................................................................................31
RESULTS AND CONCLUSIONS.............................................................................................33 STREAM BANK EROSION AND Changes in the riverbed ...................................................34 STREAMFLOW........................................................................................................................40
Branch River Discharge and Temperature ............................................................................41 Groundwater ..........................................................................................................................57
BASELINE MONITORING.....................................................................................................62 Way-Morr Park Station .........................................................................................................65
Way-Morr Park Habitat Assessment .................................................................................66

Bettering the Branch – University of Wisconsin-Stevens Point - December 2004 vii
Way-Morr Park Macroinvertebrate Assessment ...............................................................67 Hill Road Station ...................................................................................................................67
Hill Road Habitat Assessment ...........................................................................................68 Hill Road Macroinvertebrate Assessment .........................................................................69
Wayside Road Station ...........................................................................................................70 Wayside Road Habitat Assessment....................................................................................70 Wayside Road Macroinvertebrate Assessment..................................................................72
Man Cal Road Station ...........................................................................................................72 Man Cal Road Habitat Assessment ...................................................................................73 Man Cal Road Macroinvertebrate Assessment .................................................................74
County Highway K Station ...................................................................................................75 County Highway K Habitat Assessment ............................................................................76 County Highway K Macroinvertebrate Assessment ..........................................................77
Taus Road Station..................................................................................................................78 Taus Road Habitat Assessment .........................................................................................78 Taus Road Macroinvertebrate Assessment .......................................................................79
County Highway J Station.....................................................................................................80 County Highway J Habitat Assessment.............................................................................81 County Highway J Macroinvertebrate Assessment ...........................................................82
Sunny Slope Road Station – Hempton Lake Tributary .........................................................82 Sunny Slope Road Habitat Assessment..............................................................................83 Sunny Slope Road Macroinvertebrate Assessment............................................................85
West Hillcrest Road Station ..................................................................................................85 West Hillcrest Road Habitat Assessment ..........................................................................86 West Hillcrest Road Macroinvertebrate Assessment ........................................................87
County Highway T Station....................................................................................................88 County Highway T Habitat Assessment ............................................................................89 County Highway T Macroinvertebrate Assessment ..........................................................90
Village Drive Station.............................................................................................................90 Village Drive Habitat Assessment .....................................................................................91 Village Drive Macroinvertebrate Assessment ...................................................................92
North Union Road Station .....................................................................................................93 North Union Road Habitat Assessment.............................................................................94 North Union Road Macroinvertebrate Assessement .........................................................95
Electrofishing Results............................................................................................................95 North Union Road .............................................................................................................95
Village Drive .........................................................................................................................97 Highway T .............................................................................................................................99 Discussion............................................................................................................................100
Crayfish Consumption.............................................................................................................102 CONCLUSIONS/RECOMMENDATIONS............................................................................103 LITERATURE CITED.............................................................................................................106 APPENDICES............................................................................................................................108

Bettering the Branch – University of Wisconsin-Stevens Point - December 2004 viii
LIST OF TABLES Table 1. Analytical methods and corresponding detection limits for water quality analyses run in
the UWSP Water and Environmental Analysis Lab..............................................................16 Table 2. Water chemistry results for samples collected during baseflow in the Branch River and
tributaries. ..............................................................................................................................56 Table 3. Water chemistry of springs sampled near the Branch River in Fall 2004......................58 Table 4. Macroinvertebrate assessment results for the baseline monitoring on the Branch River.
...............................................................................................................................................65 Table 5. Score summary of habitat ratings for the Way-Morr Park station. ................................66 Table 6. Score summary of habitat ratings for the Hill Road station. ..........................................69 Table 7. Score summary of habitat ratings for the Wayside Road station. ..................................72 Table 8. Score summary of the habitat ratings for the Man Cal Road station. ............................74 Table 9. Score summary of the habitat ratings for the County Highway K station. ....................77 Table 10. Score summary of the habitat ratings for the Taus Road station..................................79 Table 11. Score summary of the habitat ratings for the County Highway J station.....................82 Table 12. Score summary of the habitat ratings for the Sunny Slope Road station. ....................84 Table 13. Score summary of the habitat ratings for the West Hillcrest Road (center) station. ....87 Table 14. Score summary of the habitat ratings for the County Highway T station. ...................90 Table 15. Score Summary of the habitat ratings for the Village Drive station. ...........................92 Table 16. Score summary of the habitat ratings for the North Union Road station. ....................95 Table 17. Species collected during electroshocking at North Union Road on the Branch River,
August, 2003..........................................................................................................................96 Table 18. Species collected during electroshocking at Village Drive on the Branch River, August,
2003. ......................................................................................................................................98 Table 19. Species collected during electroshocking at Highway T on the Branch River, August,
2003. ....................................................................................................................................100

Bettering the Branch – University of Wisconsin-Stevens Point - December 2004 ix
LIST OF FIGURES Figure 1. Location of the Branch River Watershed in Wisconsin..................................................3 Figure 2. General soil associations of the Branch River Watershed. (STATSGO WI Soils 1994)6 Figure 3. Land use in the Branch River Watershed........................................................................8 Figure 4. Diagram of a Siphon Sampler for event samples..........................................................14 Figure 5. Plan view map of a baseline monitoring habitat assessment station, transects, and
observation points..................................................................................................................19 Figure 6. Cross section of a river indicating areas of bank erosion measurements for the WDNR
baseline monitoring habitat assessment.................................................................................20 Figure 7. Diagram of the transformation of various forms of nitrogen within the environment of
an agricultural area. (University of Minnesota 2000) ..........................................................28 Figure 8. Stream bank erosion sites observed in the March 2003 survey of the Branch River. ..35 Figure 9. Natural change in sinuosity of the Branch River between 1952 and 1992, Brown
County, WI. ...........................................................................................................................38 Figure 10. Artificial alterations to the Branch riverbed between 1952 and 1992 Brown County,
WI. .........................................................................................................................................38 Figure 11. Riparian zone, natural, and manmade changes to the Branch River in Brown and
Manitowoc Counties, WI between 1952 and 1992. ..............................................................39 Figure 12. Location of FOBR staff gages, pressure transducers, and measured discharge sites in
the Branch River watershed...................................................................................................41 Figure 13. Gradient (slope) of the Branch River. .........................................................................42 Figure 14. Measured discharge in the Branch River during the study. ........................................43 Figure 15. Discharge estimated from the pressure transducers in November/December 2004. ..45 Figure 16. Temperature measured by the pressure transducers in November/December 2004. ..45 Figure 17. Discharge estimated from the pressure transducers in March/April 2004..................46 Figure 18. Temperature (C) measured by the pressure transducers in March/April 2004. ..........46 Figure 19. Discharge estimated from the pressure transducers in April/May 2004. ....................47 Figure 20. Temperature (C) measured by the pressure transducers in March/April 2004. ..........47 Figure 21. Average monthly air temperatures for 2001 – 2004 in the Branch River watershed
(WPS Data, J. Roberts, FOBR). ............................................................................................48 Figure 22. Temperatures recorded by FOBR temperature data recorders in the Branch River
during summer 2003..............................................................................................................49 Figure 23. Location of FOBR temperature data recorders in the Branch River in summer 2004.
...............................................................................................................................................50 Figure 24. Maximum daily temperatures measured by FOBR temperature data recorders in the
Branch River in summer 2004...............................................................................................50 Figure 25. Minimum temperatures measured by FOBR temperature data recorders in the Branch
River in summer 2004. ..........................................................................................................51 Figure 26. Nitrate concentrations during baseflow and events at two tributaries and sample sites
within the Branch River.........................................................................................................54 Figure 27. Chloride concentrations during baseflow and events at two tributaries and sample
sites within the Branch River. ...............................................................................................55 Figure 28. Total suspended solid concentrations during baseflow and events at two tributaries
and sample sites within the Branch River. ............................................................................55 Figure 29. Total phosphorus concentrations during baseflow and events at two tributaries and
sample sites within the Branch River. ...................................................................................56

Bettering the Branch – University of Wisconsin-Stevens Point - December 2004 x
Figure 30. Location and names of springs identified by FOBR and spring water quality samples sites. .......................................................................................................................................59
Figure 31. Nitrate-N and chloride concentrations in spring water samples collected in fall 2004. Road names are labeled. ........................................................................................................59
Figure 32. Phosphorus concentrations in spring water samples collected in fall 2004. ...............60 Figure 33. Chemical oxygen demand concentrations in spring water samples collected in fall
2004. ......................................................................................................................................60 Figure 34. Nitrate concentrations in private wells. Central Wisconsin Groundwater Center
database (1991-2004). ...........................................................................................................61 Figure 35. Chloride concentrations in private wells. Central Wisconsin Groundwater Center
database (1991-2004). ...........................................................................................................62 Figure 36. Location of 12 baseline monitoring stations in the Branch River and fish habitat
ratings for the baseline stations. ............................................................................................63 Figure 37. Smallmouth bass length frequency from the North Union Road sample location on the
Branch River..........................................................................................................................97 Figure 38. Smallmouth bass length frequency from Village Drive on the Branch River. ............99 Figure 39. Smallmouth and largemouth bass length frequency from Highway T on the Branch
River. ...................................................................................................................................100

Bettering the Branch – University of Wisconsin-Stevens Point - December 2004 1
INTRODUCTION The Branch River is 37-mile river that is located in east-central Wisconsin within the
Manitowoc River Basin. This river was the focus of a two-year study performed by the
Friends of the Branch River (FOBR) and the UWSP Center for Watershed Science and
Education (CWSE). The Friends of the Branch River (FOBR) is concerned with the
improving and preservation of the Branch River Watershed through education, facilitation,
and cooperation with local residents, officials and other conservation organizations. The
Center for Watershed Science and Education (CWSE) provides education, testing and
analysis for the citizens of Wisconsin on water resource issues. It is affiliated with the
University of Wisconsin-Stevens Point (UWSP) and UW-Extension.
The objectives of this study were to: (1) obtain background data on water quality and
quantity in the Branch River, (2) assemble this information in a way that will be useful for
current and future improvement projects, and (3) discuss the findings with sponsors and
citizens interested in the Branch River.
BACKGROUND INFORMATION
The Branch River is 37-mile river that is located in east-central Wisconsin within the
Manitowoc River Basin. The headwaters of the Branch River are located in southern Brown
County and the lower segments of the Branch River are located in northern Manitowoc
County (Figure 1). The Branch River discharges into the Manitowoc River approximately 11
miles upstream from Lake Michigan (WDNR, 1996). The headwaters of the river has little
groundwater baseflow and flow occurs primarily in response to precipitation and snowmelt.
The headwaters of the Branch River consist of a series of unnamed intermittent and perennial
streams. During baseflow (low flow) conditions, continuous flow was first observed at the
Morrison Road crossing above State Highway 96. The upper reaches of the Branch River
have portions that are shallow, wide, and slow, as a result of the low gradient of the river. As
the river continues downstream, there is an increase in groundwater inputs which are
predominately from springs scattered throughout the system. The Branch River gains
volume of flow as it continues downstream from a series of intermittent streams and several
tributaries which contribute continuous flow. The lower reaches of the river have a well

Bettering the Branch – University of Wisconsin-Stevens Point - December 2004 2
developed pool-riffle habitat structure. Here the river has a more diverse range of habitats;
ranging from wide shallow riffles to deep pools. The river gradient of the lower Branch
River is significantly higher than that of the upper reaches.
The Branch River is a beautiful river that flows through rural areas and some small
communities. Many people enjoy the river for its scenic beauty and picturesque
surroundings. The river is also used for many different recreational activities; from fishing to
canoeing. Anglers from the Midwest fish the Branch River for the seasonal runs of
anadromous trout and salmon. Native fish species, including smallmouth bass and northern
pike, attract anglers to the Branch River. Crayfish are another aquatic organism that is
heavily sought after by local people for consumption.
Many terrestrial animals and aquatic organisms rely upon the Branch River and its riparian
edges for survival. According to Gansberg, the lower Branch River, from the mouth to the
Brown County line is considered a great lakes aquatic community. North of the Brown
County line the river is classified as a warm water forage fish community (Gansberg, 1995).
The Branch River also provides habitat for the threatened fish species Greater Redhorse
(Moxostrama carinatun), which is very sensitive to chemical pollutants, turbidity, and
siltation (WDNR, 1996). In summer 2003, the WDNR released young sturgeon in the lower
reaches of the Branch.
Remediation, protection, and enhancement of the Branch River is a state and local priority.
In 1996 the Branch River Watershed was designated as a priority watershed by the WDNR to
address groundwater and surface water issues related to non-point source pollution. The
project is scheduled to continue until 2006.
The Friends of the Branch River first met as an informal group in 1996. (WDNR, 1996) In
2000 it began a 2-year organizational development effort aimed at becoming self-sustaining.
By the end of 2002, Friends of the Branch River, Inc. (FOBR) had incorporated and gained
official status as a 501c3 tax-exempt conservation organization. FOBR has grown to 125
members. The FOBR mission is to improve and preserve the Branch River Watershed

Bettering the Branch – University of Wisconsin-Stevens Point - December 2004 3
through education, facilitation, and cooperation with local residents, officials, and other
conservation organizations.
Figure 1. Location of the Branch River Watershed in Wisconsin.
PHYSICAL WATERSHED CHARACTERISTICS
The Branch River Watershed drains approximately 111 square miles (70,951 acres) of land in
Brown (37%) and Manitowoc (63%) Counties (Gansberg, 1995). The watershed includes the
village of Whitelaw and many small unincorporated villages such as Branch, Cato, Grimms,
Lark, Maple Grove, Mechalville, Morrison, North Grimms, Reifs Mills, Taus, and Wayside
(Manitowoc County S&W Cons. Dept., 1999; WDNR, 1996; Gansberg, 1995). These
communities are generally small in population and cover only a small portion of the
watershed. Agriculture is an important component of their economy. The watershed also has
two large wetland areas, Cooperstown Swamp and Morrison Swamp, which intercept
precipitation, sediment, and nutrients before slowly discharging water the Branch River.
There are two small lakes, Hempton Lake (10 acres) and Kellners Lake (14.6 acres), which
each play a role in the water quality and water budget of the Branch River Watershed

Bettering the Branch – University of Wisconsin-Stevens Point - December 2004 4
(Manitowoc County S&W Cons. Dept., 1999; WDNR, 1996; Gansberg, 1995). The Village
of Whitelaw Wastewater Treatment Plant discharges water to a small intermittent tributary to
Hempton Lake. Hempton Lake has an outlet on the north-west side that discharges into a
tributary (Hempton Lake Tributary) that flows into the Branch River just downstream from
the County Highway J crossing. Hempton Lake is a source of streamflow for the Branch
River continually throughout the year. The Branch River Watershed also contains two
abandon landfills (both are superfund sites), one operational landfill, and two golf courses.
The operational landfill covers 69 acres and is located near the intersection of Hempton Lake
Road and Reifs Mills Road. One of the golf courses, Wandering Springs, is located on
Wayside Road in the south west corner of Brown County. The other golf course, Branch
River Country Club, is located on Union Road in the lower reaches of the Branch River
watershed; parts of both of the golf courses are adjacent to the river.
Climate
The Branch River Watershed is located in the continental zone which generally has long
snowy and relatively cold winters and warm summers with periods of hot humid weather.
Mean annual precipitation for this region ranges from 30 to 33 inches of rain and melted
snow. Most precipitation falls during the growing season (May-September) from
thunderstorms. Precipitation events from February, March, and April generally contribute
the most runoff to the Branch River because the subsoil is still frozen, making infiltration
impossible, so the water runs over the land. (WDNR, 1996)
Topography
The landscape in the Branch River Watershed ranges from gently sloping to sloping till plain
that has some steep ridges. Elevation ranges from 900 feet above sea level in the northern
part of the watershed to approximately 700 feet at the confluence of the Branch River and the
Manitowoc River (WDNR, 1996). The Branch River drops 240 ft (73 m) from headwaters to
Union Rd with changes in elevation from 920 ft to 680 ft (280 m to 207 m) above sea level,
respectively. The topography of the Branch River Watershed is the result of several periods
of continental glaciation. Two major glacial advances, the Green Bay Lobe and the Lake
Michigan Lobe, are primarily responsible for reshaping the land much as we see it today.

Bettering the Branch – University of Wisconsin-Stevens Point - December 2004 5
The Green Bay Lobe moved from the northwest and advanced through Green Bay. The Lake
Michigan Lobe moved in from the northeast colliding with the Green Bay Lobe just west of
Menchalville.
Geology
The bedrock underlying much of the Branch River Watershed is primarily made up of the
Niagara dolomite formation. This formation slopes to the east towards Lake Michigan.
Dolomite is primarily made up of calcium/magnesium carbonate. This bedrock is prone to
fracturing and dissolution by groundwater. This landscape that is associated with dissolution
of carbonate bedrock is called karst. Groundwater in karst regions can exhibit rapid flow,
short water residence times and little filtering of surface contaminants (WDNR, 1996 and
Hole, 1976).
Soil
Soil types affect the amount of water that runs off the landscape or soaks into the ground to
become groundwater. Runoff containing large quantities of sediment and particulate matter
can be a problem because sediment in the water can lower the oxygen levels and destroys
fish habitat. Additional nutrients contained in the particles can result in increased aquatic
plant and algae growth. Generally, the ability for water to infiltrate decreases as the particle
size decreases resulting in more surface runoff. This is referred to as poorly drained soil.
Soil with bigger particles, such as sand, generally have larger pores and allows water to
infiltrate into the soil easier which permits more water to reach the groundwater. The soil in
the Branch River Watershed can be divided into four major groups based on the type of
parent materials (Figure 2). These four groups are: soil formed in glacial till, soil formed in
lacustrine deposits, soil that is underlain by glacial outwash deposits, and soil formed in
organic deposits. The soil along the Branch River is primarily deep loamy soil that ranges
from well drained to poorly drained (WDNR, 1996 and Hole, 1976).
Following are general descriptions of the dominant soils in the Branch River Watershed
(STATSGO WI Soils 1994). Kewaunee-Manawa-Poygan Association – This soil is
generally deep, nearly level to sloping, well drained to poorly drained, dominantly has a

Bettering the Branch – University of Wisconsin-Stevens Point - December 2004 6
Figure 2. General soil associations of the Branch River Watershed. (STATSGO WI Soils 1994)
clayey subsoil and substratum are formed from glacial till. Waymor-Hochheim-Keewaune
Association– This soil is deep, nearly level to moderately steep, well drained, have loamy
subsoil, and are formed in glacial till on plains and ridges. Hortonville-Kewaunee-Symco
Association – This soil is deep, nearly level to moderately steep, well drained to somewhat
poorly drained, have a loamy texture, and are formed in glacial till on plains and ridges.

Bettering the Branch – University of Wisconsin-Stevens Point - December 2004 7
Shiocton-Keowns-Zurich Association – This soil is deep, nearly level to gently sloping, well
drained to poorly drained, has a loamy texture, and are formed in lacustrine (lake) deposits.
Casco-Wauseon-Boyer Association – This soil is deep, nearly level to moderately steep, has
a loamy texture, and are formed over outwash deposits. Houghton-Palms-Boots Association
– This soil is deep, nearly level, very poorly drained, have a mucky texture, and are formed
in organic deposits and marshes over glacial till plains. (Hole, 1976)
Land Use
Land use in the Branch River Watershed is dominated by agriculture with approximately
78.2% of the watershed is in some form of agricultural use (Figure 3). The communities and
the economy in the Branch River Watershed are largely supported by agricultural land
practices (WDNR 1996). The residential population within the watershed is projected to
show a one percent increase between the years 1990 and 2015, including a 12% increase for
the village of Whitelaw (WDNR 1996). Over the past two decades the total number of farms
in the watershed has decreased steadily, but the average size of each farm has increased
significantly from 164 acres in 1981, to 226 acres in 1991 (WDNR 1996). Some agricultural
land is being converted to residential land with urban sprawl being on an upward trend
(WDNR 1996). Financial assistance from the state has given Manitowoc and Brown
Counties the opportunity to locate prime agricultural land and offer tax incentives to farmers
who maintain the land in agricultural use (WDNR 1996). The Branch River Watershed also
has some large open and forested wetlands including the Cooperstown Swamp and the
Morrison Swamp. Large-scale efforts to drain the wetlands for agricultural land between
1960 and 1985 considerably reduced the percentage of wetlands in the watershed. Brown
and Manitowoc Counties and private landowners have been working to restore areas of
wetland in the Branch River Watershed through the priority watershed project. Forestland
makes up only about 4.5 percent of the watershed and grassland only approximately 3.6
percent.

Bettering the Branch – University of Wisconsin-Stevens Point - December 2004 8
Figure 3. Land use in the Branch River Watershed (WISCLAND, 2000).

Bettering the Branch – University of Wisconsin-Stevens Point - December 2004 9

Bettering the Branch – University of Wisconsin-Stevens Point - December 2004 10
AQUATIC CONTAMINANTS IN THE WATERSHED
Aquatic contaminants are substances that can damage aquatic ecosystems or impact the
health of those using aquatic resource. Fish and aquatic invertebrates are particularly
sensitive to water quality. Contaminants introduced into stream systems can impact them
directly through toxic interactions or by creating conditions that lead to undesirable
conditions within the stream (e.g., oxygen levels). In the Branch River Watershed, there are
several possible sources of contamination including hazardous landfills, land disposed
organic wastes such as manure, old dumps, and wastewater discharges. Non-point source
pollution from a variety of land use practices within the watershed also contribute aquatic
contaminants to the Branch River.
There are two Environmental Protection Agency (EPA) superfund sites located within the
Branch River watershed. One of the sites is a 16 acre unlined landfill used by Lemberger
Transport and Recycling from 1970 to 1976. This site is located north of the Village of
Whitelaw, approximately one-half mile west of the Branch River. The site contained
800,000 to 1,000,000 gallons of tar and paint sludge as well as large amounts of aluminum
dust and polychlorinated biphenyls. The wastes leached into the groundwater and
contaminated multiple wells near the site with volatile organic compounds (VOC’s) and
heavy metals. In 1987 the EPA began to investigate and by 1993 cleanup efforts were
underway. Efforts to clean up the site included removing drums of waste, capping the
landfill, and groundwater extraction. After the groundwater is extracted it is treated and
discharged into the Branch River (EPA, 2003 - Lemberger Transport and Recycling). The
other superfund site, Lemberger Landfill, is located approximately one-quarter mile from the
Lemberger Transport and Recycling superfund site. This site includes a 21 acre unlined
gravel pit that was used by the Town of Franklin as a dump from 1940 to 1970. From 1969
to 1976 Lemberger Landfill Incorporated used the site as a DNR licensed sanitary landfill.
Wettencamp and Brunner Excavating Company used the site from 1976 to 1977 to dispose of
fly ash from Manitowoc Public Utilities. The drinking water from nearby residences was
tested in 1985 and found to be contaminated with volatile organic compounds including
methylene chloride and vinyl chloride. The EPA cleanup plan involved continued
groundwater monitoring, groundwater use restrictions, capping the landfill, containment of

Bettering the Branch – University of Wisconsin-Stevens Point - December 2004 11
contaminated groundwater inside of slurry walls, and the extraction and treatment of
groundwater. Cleanup of the site began in 1992 and construction was completed in 1996.
Both superfund sites discharge the treated groundwater into the Branch River. Modifications
were made to both of the groundwater extraction systems in the winter of 2001 to capture
more of the contaminant plume (EPA, 2003 - Lemberger Landfill Incorporated).
The introduction of organic materials into streams can lead to rapid oxygen depletion and
damage or kill fish and invertebrate populations. A sizable fish kill took place in the Branch
River from the Grimms Road crossing to the West Hillcrest Road crossing during August
1994. This incident claimed approximately 274 fish, including 58 northern pike along with
many macroinvertebrates. The severity of this incident is evident because it also claimed the
lives of carp and bullheads, two fish species that are quite tolerant to low oxygen conditions.
The exact source of this fish kill was never identified; it is believed that heavy precipitation
on August 26, 1994 caused manure to flow into the river causing the incident. (Gansberg,
1995)
In October 2000, 230,000 gallons of manure spilled directly into the Branch River. The spill
devastated nine miles of river, resulting in the loss of many aquatic organisms. These
organisms included 309 smallmouth bass, 137 northern pike, 281 chinook salmon, 1 coho
salmon, 14 steelhead, 2 brown trout, 213 rock bass, 78 bullhead, 4 channel cats, many
thousands of forage fish, and thousands of crayfish. The spill resulted in a payment of
restitution for killed gamefish (FOBR, 2003).
PROJECT GOALS/OBJECTIVES
This project sought to answer questions related to water quality including
macroinvertebrates, streambank erosion, shade cover, and physical attributes of the river and
its watershed, leading to the Friends of the Branch River’s (FOBR) development of a
“strategic plan for river enhancement projects” that will seek to: (1) improve FOBR’s
capacity through partnerships with sportsmen organizations interested in fish habitat
improvement projects, (2) enhance FOBR’s capacity to play a significant contributing role in
assisting local DNR and SWCD with their Branch River Priority Watershed goals and (3)

Bettering the Branch – University of Wisconsin-Stevens Point - December 2004 12
improve FOBR and SWCD’s ability to respond effectively to new pressures on the river
ecosystem from manure spills to new riparian development.
The objectives designed to accomplish these goals include:
Identify areas in the Branch River that are best suited for fish habitat improvements
1. Conduct DNR Baseline Survey at 12 locations 2. Revise shoreland erosion survey
Develop understanding of relationship between groundwater, surface runoff, land uses, and
water quality in the Branch River
1. Measure discharge, pH, conductivity, and dissolved oxygen at approximately 100 locations in the tributaries and main river
2. Sample river water during baseflow and event conditions 3. Sample springs for water quality analysis 4. Establish rating curves for sites with staff gauges 5. Map areas of greatest groundwater influence
Evaluate safety of fish/crayfish for human consumption
1. Analysis of edible tissue for mercury and PCBs
Restoration/enhancement/planning efforts
(More details on these objectives are provided in the sections that follow).
1. Advanced volunteer river monitoring training (FOBR, SBCC, CWSE, DNR) 2. Strategic planning workshops for the identification and prioritization of FOBR river
enhancement projects will be facilitated by River Alliance of Wisconsin and seek participation from CWSE, DNR, SWCD, WAV, FOBR, SBCC, Interfluve, and the Lakeshore Basin Educator.
3. FOBR has some on-going, pre-existing projects (“Buy a Tree for the Branch” and a brochure for riparian landowners) that will immediately utilize and benefit from the information acquired in this project. For examples, it is anticipated that temperature and dissolved oxygen data will be useful in promoting the increased planting of trees into buffer strips for shading. Revising the shoreline erosion survey will help to provide examples and target specific areas for direct distribution of the brochures. (FOBR, Manitowoc County Lakes Association, Master Gardeners)
4. Data presentation informational meetings (FOBR, SBCC, CWSE, SWCD, DNR, WAV, and Lakeshore Basin Educator)

Bettering the Branch – University of Wisconsin-Stevens Point - December 2004 13
METHODS
FIELD/LAB PROCEEDURES
The equipment and techniques used in the field and laboratory were selected because they are
appropriate for water quality analysis and habitat assessment of the Branch River. WDNR
provided training and assistance for conducting the Baseline Monitoring of the Branch River.
All information that was gathered and placed into the Center for Watershed Science and
Education’s computer database in programs such a Microsoft Excel and Arcveiw GIS where
the data was analyzed. Water samples were collected by University of Wisconsin Stevens
Point (UWSP) Staff unless otherwise mentioned. Training and guidance for sample
collection was provided for the Friends of the Branch River by the UWSP staff.
Baseflow Sampling
Baseflow is the streamflow that occurs during periods of low rainfall. In general, baseflow
represents the streamflow generated solely from groundwater. Baseflow samples were
collected in July 2003 at nine different locations located on the Branch River and again in
September 2004. Baseflow samples were gathered using three different polyethylene bottles:
one 500 ml bottle which was unfiltered and unpreserved, one 125 ml bottle which was
unfiltered and preserved with 1 molar H2SO4, and another 125 ml bottle which was filtered
and preserved with 1 molar H2SO4. Sample was collected by lowering the capped bottle to
the mid depth of the river with the lid facing downstream and then opening it, allowing the
bottle to fill with water. Water from this bottle was used to fill the unfiltered 125 mL
preserved bottle. The second 125 mL bottle was filtered by filling a 60 mL syringe with
sample and than screwing it onto a 47mm in-line filtering cassette. The in-line filter
contained two filter papers: a 934 / AH coarse glass filter paper and a fine 0.45 micron filter
paper. The water first passed through the coarse filter and then the finer filter. After
collection, the bottles were immediately placed on ice and transported to the WEAL lab for
analysis. Baseflow samples were analyzed for nitrate + nitrite - N (NO2 + NO3), ammonium
- N (NH4 - N), total Kjedahl nitrogen (TKN), total phosphorus (Total P), dissolved reactive
phosphorus (Reactive P), chloride (Cl), and total suspended solids (TSS). Field

Bettering the Branch – University of Wisconsin-Stevens Point - December 2004 14
measurements including pH, conductivity, temperature, dissolved oxygen, and streamflow
were made one day prior to the collection of the July 2003 baseflow samples.
Event Flow Sampling
Runoff event samples were collected from ten sites throughout the Branch River watershed.
Event flow sampling took place three times over the course of the project. The first round
took place in August 2003, the second during March winter snowmelt 2004, and the final
round during a very large spring runoff after planting in May of 2004. Runoff event
sampling was instituted by use of grab samples or using siphon samplers. Figure 4 illustrates
the siphon sampler and its components. The siphon sampler used for this study was modified
from devices designed by the USGS. Siphon samplers were attached to a fence post that was
installed in the central part of the river. The siphon samplers were positioned to sample an
anticipated rise in the stream from an event. This height varied from site to site depending
upon the morphology (size, shape) of the stream and location within watershed. When the
water crested above the peak of the lower tube, the river water entered the bottom tube and
filled the 500 mL Polypropylene sample bottle. The 500 mL sample was then transferred to
two smaller bottles: one 60 mL polyethylene bottle which was filled with an unfiltered
sample and preserved with 1 molar H2SO4 and a second 60 mL polyethylene bottle which
Figure 4. Diagram of a Siphon Sampler for event samples.

Bettering the Branch – University of Wisconsin-Stevens Point - December 2004 15
was preserved with 1 molar H2SO4 and filled with filtered sample. (See previous section on
Baseflow Sampling for description of filtering process). The water sample remaining in the
500 mL sample bottle was then left unfiltered and unpreserved and sealed to be later
analyzed for total suspended solids. The sample preservation and filtering process took place
was within 24 hours of sample collection. Samples were then stored and transported on ice
to the WEAL lab. Event samples were analyzed for nitrate+nitrite - N (NO2+NO3-N),
ammonium - N (NH4-N), total Kjedahl nitrogen (TKN), total phosphorus (TP), soluble
reactive phosphorus (SRP), chloride (Cl), and total suspended solids (TSS).
Groundwater Sampling
The areas of groundwater inflow and springs were located using several different techniques.
An airplane was used to map and photograph areas of open water that was likely due to
groundwater inflow (springs). The aerial survey was conducted by flying slowly over the
Branch River on two different days during January 2004 with the FOBR and CWSE. The
river was clearly visible from the air and areas of the river that were not frozen over were
mapped and photographed. The areas of the river that were lacking ice were assumed to be
areas where warmer groundwater temperatures keep the ice from freezing. After the
mapping from the air was complete, the springs were located on the ground by members of
the FOBR and SBCC.
GPS locations of the springs and visual observation were used to collect groundwater
samples on August 31st and Septmber 16th 2004 at 11 different sites along the Branch River
by the CWSE and FOBR; six samples were collected on the first date and five on the second.
Temperature readings with a digital thermometer were used to verify that the water was
actually cold enough to be groundwater. Other field measurements included pH and
conductivity (Oakton Instruments, Inc.). Samples were collected from the springs using
mini-piezometers or extracted using a 60 cc syringe. Groundwater samples were collected in
three separate polyethylene bottles: one 125 mL bottle which was unfiltered and preserved
with 1 molar H2SO4, another 125 mL bottle which was filtered and preserved with 1 molar
H2SO4, and one 50 mL triazine tube. Groundwater samples were analyzed at the UWSP
WEAL for nitrate+nitrite-N (NO2+NO3-N), ammonium (NH4), total phosphorus (TP), soluble

Bettering the Branch – University of Wisconsin-Stevens Point - December 2004 16
reactive phosphorus (SRP), chloride (Cl), chemical oxygen demand (COD), total suspended
solids (TSS), and triazine.
Sample Analysis
After collection, all water samples were stored and transported on ice to the state-certified
Water and Environmental Analysis Lab (WEAL) at the University of Wisconsin-Stevens
Point. The analyses run in the Water and Environmental Analysis Lab followed the
methodology in Table 1. Nitrate + nitrite- N (NO2 + NO3-N), ammonium (NH4), total
Kjedahl nitrogen (TKN), total phosphorus (TP), dissolved reactive phosphorus (DRP),
chloride (Cl) were all analyzed using Latchet methods. Total suspended solids, chemical
oxygen demand and triazine were all analyzed using standard methods (Franson, 1995).
Table 1. Analytical methods and corresponding detection limits for water quality analyses run in the UWSP Water and Environmental Analysis Lab.
Analyses Method Method Detection Limit
Nitrogen, Nitrate+Nitrite Automated Cadmium Reduction 4500-NO3 F 0.1 mg/L
Nitrogen, Ammonium Automated Salicylate 4500-NH3 G 0.01 mg/L
Nitrogen, Total Kjeldahl Block Digester; Auto Salicylate 4500-NH3 G 0.08 mg/L
Phosphorus, Reactive Automated Colorimetric 4500 P F 0.003 mg/L
Phosphorus, Total Block Digestor, Automated 4500 P F 0.012 mg/L
Chloride Automated Ferricyanide 4500 C1 E 1.0 mg/L
Total Suspended Solids Gravimetric 2540 D 2.0 mg/L
Triazine Enzyme Linked Immunosorbant assay 0.05 µg/L
Metals ICP Atomic Emissions Spectometry EPA 200-7 Varies with element
Chemical Oxygen Demand Titrimetric 5220C 3.0 mg/L

Bettering the Branch – University of Wisconsin-Stevens Point - December 2004 17
Stream Flow Measurements
Stream flow, the amount of water passing a location within a specific time period, was
measured on the Branch River multiple times throughout the project. Stream flow was
measured by CWSE using a Marsh-McBirney Flo-Mate Model 2000 personal flowmeter to
determine flow velocity and a 100’ tape/wading rod to measure stream area through which
that flow passes. Funds from this study helped the purchase of a Global flow probe
flowmeter that was utilized by FOBR to measure stream flow on the Branch River and its
tributaries. The total width of the stream was divided into 20 even increments (segments).
Velocity and depth measurements were collected at the mid-point of the segment. Stream
flow (or discharge) was calculated by multiplying the total depth by the segment width by the
average velocity. Total stream flow (discharge) was then calculated by summing up the
stream flow for the individual segments [Total Discharge = Σ (Discharge 1, 2, 3, 4…20)].
Pressure Transducers
Pressure Transducers were used at five stations along the river to obtain continuous
measurements of stream height (“stage”) which were used to estimate stream flow. The
pressure transducers were Solinst level loggers. They were installed within the river at a
fixed height above the sediment. When pressure of the water increased more than 1% from
the previous reading, the level logger collected measured pressure and temperature. The
instruments were set to check for changes in stream height at 15 minute intervals. A rating
curve was developed for each site by using discharge measurements that were made by
FOBR and CWSE at varying water levels. The level logger data was adjusted for changes in
barometric pressure by using another logger (“baro logger”) outside the stream (collected at
the Roberts’ home in Whitelaw).
Stream Bank Erosion
Stream Bank inventories of erosion were conducted on the Branch River during March and
April of 2004. This survey was done using the Natural Resource Conservation Service
(NRCS) Stream Bank Inventory guidelines. Bank erosion was conducted by floating a canoe
down the Branch River and locating areas of substantial erosion. These areas were mapped
and estimates were made of height, length, and degree of lateral recession of the eroding

Bettering the Branch – University of Wisconsin-Stevens Point - December 2004 18
stream banks. Other important information was noted ( e.g., land use adjacent to the eroded
stream banks, cow access to the stream, etc).
Baseline Monitoring
Baseline monitoring surveys of the Branch River were conducted during baseflow conditions
in August 2003. Twelve stations were selected by Wisconsin DNR fishery biologists. All of
the data collection procedures followed WDNR standard protocol outlined in Wisconsin
DNR publications Guidelines for Evaluating Habitat of Wadable Streams and Guidelines for
Collecting Macroinverebrate Samples from Wadable Streams. Biologists from the WDNR
spent the first day of the survey in the field with CWSE. This survey involved three primary
areas of data collection: habitat, macroinvertebrates (e.g., aquatic insects), and fish. Habitat
and fish data were collected during August 2003. Macroinvertebrate samples were collected
during October 2003 and were analyzed by the UWSP Aquatic Entomology Laboratory.
Fish Community data was collected at three of the sites by the WDNR.
Habitat data for the 12 stations on the Branch River was collected over the course of six days
(August 14, 15, and 18-21, 2003). Water characteristics such as water level, water clarity,
water temperature, dissolved oxygen (DO), DO percent saturation, pH, and discharge were
all measured at one position per station. Discharge was calculated as outlined earlier.
Pictures (up and downstream) and GPS coordinates were taken at both the beginning and end
of each station. The total length of the station was based on the preliminary mean stream
width (MSW). The MSW was based on the average of ten stream width measurements,
unless there was little variability in stream width and only five were used. Stations had a
stream length of 35 times the MSW. If the stream had a well developed pool-riffle structure,
then the station began and ended at the downstream end of a riffle (WDNR, 2002). Each
station was divided into 12 transects which each had four transect points across the stream
width (Figure 5). The first transect was located one MSW from the starting point of the
station. Each subsequent transect was three MSW apart. At each transect, data on the stream
width, habitat type (riffle, run, or pool), bankfull depth, bankfull width, cover for fish, bank
erosion, riparian land use, and riparian buffer width within 10 m of the stream was recorded
(Figure 6). At each of the four points on the transect measurements of the water depth and

Bettering the Branch – University of Wisconsin-Stevens Point - December 2004 19
the depth of fines and water were made. In addition, a section of river substrate with an area
of 0.3 by 0.3 m was evaluated for embeddedness of coarse gravel and rubble/cobble (to the
nearest 10%), the percent of stream bottom covered (to the nearest 5 %), and the percent of
algae, macrophytes (aquatic plants), and shading (to the nearest 10%) (WDNR, 2002). Raw
data was shared with WDNR biologists for inclusion in their state database.
Figure 5. Plan view map of a baseline monitoring habitat assessment station, transects,
and observation points.

Bettering the Branch – University of Wisconsin-Stevens Point - December 2004 20
Figure 6. Cross section of a river indicating areas of bank erosion measurements for
the WDNR baseline monitoring habitat assessment.
Macroinvertebrates (e.g., aquatic insects) were collected at one location at each of the 12
baseline monitoring stations. Sampling took place throughout the entire day in October 2003.
Macroinvertebrates were collected by kick sampling with a D-shaped net. Samples were
taken in riffle habitats when they were available within a station. When riffles were not
present, the samples were taken in snags, logjams, overhanging vegetation, aquatic plants, or
in rip-rap along the bridges. Sampling with a kick net used a D-net firmly planted against the
stream bottom and disturbing the upstream substrate (approximately a full arm’s length from
the net) with the sampler’s waders. This kick method disturbance was done for three minutes
and then the net was inspected. If the net contained more than 100 macroinvertebrates, then
sampling at that station was considered complete. If there were less than 100 organisms
captured, then the station would be sampled again for an additional three minutes. Whether
or not the second sampling produced 100 organisms, the sampling ended because low
macroinvertebrate numbers may have be due to poor water quality or habitat problems.
(WDNR, 2000) Following the sample collection, macroinvertebate samples were placed into
quart glass jars and preserved with 85% isopropyl alcohol. After 24 hours the isopropyl
alcohol was decanted and the sample was refilled with fresh 85 % isopropyl alcohol. (Dimick,
2003) The macroinvertebrates were taken to the UWSP Aquatic Entomology Lab for
analysis.

Bettering the Branch – University of Wisconsin-Stevens Point - December 2004 21
Fish community data were collected by the WDNR during August, immediately following
the habitat data collection at three stations. The data was collected by using a towed-barge
stream electroshocker outputting DC current. The entire station was sampled from the
nearest riffle in the first transect to the nearest riffle in the final transect. Sampling took
place during the early morning to mid-afternoon in an upstream direction. Shallow riffles
were used as natural barriers to fish movement and these areas were utilized as stops where
captured fish could be identified and counted. Data was recorded on the total number of each
fish species collected, total lengths of all game fish (mm), and if the fish had deformities,
eroded fins, lesions, and tumors.
Metadata
ArcView GIS 3.2a software was used with land use, soil, hydrology, road, and topography
coverages for data interpretation Land use coverages Wisconsin were obtained from the
Wisconsin Initiative for Statewide Cooperation on Landscape Analysis and Data
(WISCLAND). Land cover data was derived from Landsat Thematic Mapper (TM) satellite
imagery acquired from fly-overs from 1991-1993. On the map, each pixel represents a 30 by
30 meter square resolution on the ground. Statsgo was used for the soil coverage (WI
general soils). DNRgeodisk3 coverages were used for hydrology (hydtopen) and watershed
delineation (wsdnw924 – wsdrwats). Tiger coverages were used for the designation of roads.
Sub-Watershed Delineation
The sub watersheds were delineated using the ESRI CRWR-Preprocessor and a 30 by 30
meter resolution DEM with the hydrology coverage. Sample sites were located with a GPS
unit, which was then used to create a GIS coverage of the sample points. The sample sites
were added as outlets for the final delineation of the Branch River Watershed and associated
sub-watersheds. The digitized watershed map was compared to the DNR watershed
boundary and where discrepancies existed they were ground-truthed.
Sinuosity
Air photos from 1952 were obtained from Brown and Manitowoc County FSAs. These
images were scanned at high resolution (600). Locations on digital 1992 air photos were

Bettering the Branch – University of Wisconsin-Stevens Point - December 2004 22
located and geographical locations were defined. Selected locations were stable sites that
resisted dramatic change between 1952 and 1992. Building corners proved most effective for
attaining small RMS (measure of needed image modification for fit from spatial distortion).
RMS limits were maintained below 6.00 because larger RMS often distorted images too
greatly to accurately assess sinuosity. Didger 3 software was used in coordination with
ArcView 3.3 to georeference each air photo. Once images were georeferenced the images
were warped, formatting 1952 images to correspond with 1992 locations. The 1952 images
were then exported from Didger 3 and opened in Adobe Photoshop CS where images were
saved as tagged image files (.tif). Tif images were opened and digitized ArcGIS 9 Arc Map.
Shape files were created for each 1952 Tiff image and the Branch River was digitized from
each image. A complete digital image of the Branch River was assembled and compared to
underlain 1992 digital air photos and key differences in stream stretches were highlighted.

Bettering the Branch – University of Wisconsin-Stevens Point - December 2004 23
WATER QUALITY INTERPRETATION
TEMPERATURE
Temperature is very important in a river system because it influences the dissolved gases,
chemical reactions, and the aquatic biota. Generally, cooler water has the capacity for more
dissolved oxygen then warmer water. Warmer water generally increases the rate of chemical
reactions, which can directly affect the aquatic ecosystem. Some compounds are more toxic
to aquatic life at higher temperatures (Michaud, 1994). The aquatic organisms of the Branch
River all have preferred temperature and oxygen ranges. As the temperature goes above or
below these ranges that stretch of river becomes less desirable and the population of that
specific specie can decrease.
There are many factors within the Branch River Watershed that impact the temperature of the
water. The degree of shade cover along the banks of the river plays a big role in the
temperature of the water. Shade cover along waterways reduces the amount of sunlight
directly hitting the water which allows the water to be cooler. The general morphology of
the stream can influence the temperature as well. Wide shallow streams have more surface
area for the sun and air to warm compared to narrow deep streams. Land use in the
watershed also impacts the water temperature. Drainage from unshaded agricultural fields or
paved urban areas generally has a warmer temperature than drainage from wooded areas
because of the exposure to sunlight. As a result, tributaries that drain agricultural land and
urban land may discharge warmer water (Michaud, 1994). The color of the water can also
affect water temperature, with darker colors absorbing more heat. Color can enter the Branch
naturally, via “tannic” acids or other organic compounds from wetlands or less naturally from
increased sediment in runoff. The amount of sediment in the runoff varies from season to
season and is related to land use practices. Poorly covered soil can increase sediment
delivery to the river compared with well vegetated soil.
DISOLVED OXYGEN
Dissolved oxygen is needed by respiring aquatic organisms for survival. Dissolved oxygen
can be defined as oxygen molecules dissolved within the water. Fish and other aquatic

Bettering the Branch – University of Wisconsin-Stevens Point - December 2004 24
organisms use oxygen from the water by moving water past their gills (or other respiration
apparatus). The dissolved oxygen in the water is transferred to the blood of the aquatic
organisms through the process of diffusion. All aquatic organisms require certain minimum
concentrations of dissolved oxygen in the water to survive. Some organisms, like trout,
require well oxygenated water for survival. If the dissolved oxygen concentration in the
water gets too low for a specific species, that stretch of stream becomes less desirable.
Dissolved oxygen is also required for many chemical and biological reactions, including the
decomposition of organic material (Michaud, 1994).
Oxygen gas can enter the water through several mechanisms. Diffusion from the atmosphere
is likely the most important source of oxygen in the Branch River. The surface of water in
contact with the atmosphere can get oxygen through diffusion. In areas of turbulent water,
such as riffle areas or small waterfalls, dissolved oxygen concentrations increase because
more surface area of the water is exposed to atmosphere, allowing more oxygen gas to enter
the water. Other sources of oxygen are from aquatic plants and algae within the river. As the
aquatic plants and algae undergo the process of photosynthesis, carbon dioxide gets
consumed and dissolved oxygen is released into the water. The amount of oxygen dissolved
in water fluctuates throughout the day. Generally, aquatic plants are partially responsible for
these daily fluctuations. During the day photosynthesis adds oxygen into the water. As night
falls, the process of photosynthesis slows but decomposition and respiration continue. These
conditions result in higher dissolved oxygen concentrations during the day and lower
throughout the night. The lowest dissolved oxygen concentrations can usually be found just
before dawn. As discussed in the above section, temperature plays a big role in the amount
of gasses that can be dissolved into water. Cooler water can hold more oxygen, so there are
also season variances in dissolved oxygen levels (Michaud, 1994).
Human activities can have a large impact on the dissolved oxygen of streams and rivers.
Waste water discharges from industry or municipal sources and urban runoff generally have
chemical or biological constituents that require large amounts of oxygen to be broken down.
During precipitation events the run off from urban, agricultural, or farm land uses can deposit
many oxygen demanding substances to streams and rivers. Sediment, metals, and organic

Bettering the Branch – University of Wisconsin-Stevens Point - December 2004 25
matter all need oxygen to undergo reactions or be decomposed. Nutrients in the water also
promote the growth of aquatic plants and algae. As these plants die and begin to decompose
oxygen is consumed by microbial decomposers during this process. This can create low
oxygen situations in water, especially during the night while no photosynthesis is occurring.
CONDUCTIVITY
Conductivity is a measure of the ability to conduct an electric current and it increases with
increases in the total dissolved inorganic solids in water. These dissolved solids are brought
naturally in groundwater or surface runoff from dissolution of local minerals or unnaturally
by wastewater from sewage treatment plants, septic systems, agricultural fields, and urban
groundwater and runoff. Generally, the more contact the water has with soil and bedrock
usually allows for more materials to dissolve, resulting in higher conductance values. In
Wisconsin, conductivity is typically two times the water hardness unless the water is
receiving high concentrations of contaminants such as salts introduced by humans (Shaw et
al., 2002). Hardness is the concentration of of cations, such as calcium (Ca2+) and
magnesium (Mg2+) that have a positive charge of 2 or greater. In the Branch River, hardness
is related to the dissolution of minerals such as dolomite in the watershed (Shaw et al., 2002).
PH
pH describes the river waters acid concentrations by measuring hydrogen ions (H+) in
solution. pH is measured on a scale ranging between 1 and 14 with lower values indicating
acidic conditions and higher pH values indicating basic conditions. Rivers with low pH
values often allow metals (aluminum, zinc, mercury) which can be located in the river
sediment, to become soluble. These metals can then make their way into the food chain and
bioaccumulate in larger organisms (Shaw et al., 2000). Conversely, rivers with a high pH
provide buffering against acidic conditions. Higher pH values are created when limestone or
dolomite (carbonate minerals) are found in the watershed geology. Groundwater dissolves
these rocks and once in the river, neutralizes the acid from rainfall. The value of pH can
change throughout the day, year, and depth because of chemical interaction with
photosynthesizing biota, which effectively lower the pH by releasing carbon dioxide during

Bettering the Branch – University of Wisconsin-Stevens Point - December 2004 26
respiration or increase pH by removing carbon dioxide during photosynthesis (Michaud,
1994).
NUTRIENTS
Nutrients are essential for the growth and productivity of plants and animals in an aquatic
ecosystem. The primary nutrients in aquatic ecosystems are nitrogen and phosphorus. An
over abundance or lack of nutrients can create a problem in the system. Human activity in a
watershed can affect the storage and movement of nutrients, resulting in a surplus or
deficiency. Excess nutrients can be transported to rivers via groundwater, overland flow, and
sedimentation. In stream ecosystems, the effects of nutrient overloading can be difficult to
see at a given site, as the water movement reduces the amount of time nutrients are available
(residence time) and tree canopy can restrict light, making it difficult for aquatic plants or
algae to utilize nutrients at a given point. Slower moving streams or more complex stream
systems (i.e. drainage type, channel structure) have a longer residence time (Newton, 1999).
If the residence time is too short, unattached algae are swept downstream, giving them little
chance to increase in population at that location; however, algae can accumulate in areas of
slower moving water, such as pools or impoundments, possibly causing a population increase
in that area. In addition, as the velocity of the river slows down, the nutrients that are carried
by sediments in suspension in the water column also settle out. This settling is typical of
impoundments and bays where the residence time is longer due to the slowing of the water
movement. An excess of nutrients in the areas of stream with longer residence time
promotes the growth of algae and aquatic plants. When the algae and aquatic plants die, they
are decomposed by bacteria. These bacteria consume available oxygen through respiration,
reducing oxygen levels in the water. Low oxygen levels in water may create problems for
respiring aquatic organisms.
Nitrogen
Nitrogen is a major nutrient found within the Branch River and its tributaries. In an aquatic
ecosystem, nitrogen in its various forms is critical for plant and animal growth and survival.
However, an excess of nitrogen can negatively impact the ecosystem, affecting the plant life,
invertebrates, fish and humans. For example, as on land, nitrogen can increase plant growth
and elevated concentrations can lead to abundant plant growth. This can alter the types of

Bettering the Branch – University of Wisconsin-Stevens Point - December 2004 27
plants and ecological communities that are present. Nitrogen concentrations can be elevated
by human activity such as lawn and agricultural fertilization, and animal and human waste.
Nitrogen is transported to the Branch River and its tributaries via groundwater, surface runoff,
sedimentation, and in small quantities, by dry deposition and rain.
Nitrogen can be found in several different forms. The different forms of nitrogen are
converted both through biological and physical mechanisms. The nitrogen cycle illustrates
how different forms of nitrogen are derived and transformed (Figure 7). All sources of
nitrogen are constantly under the influence of certain natural chemical changes producing the
different forms of nitrogen. The most common input of nitrogen in many systems is through
groundwater; however, nitrogen can be added at any point throughout the following scenario.
As rainwater falls to the ground it percolates through soil and picks up nitrates, ammonium,
and organic nitrogen. Organic nitrogen is then decomposed through microbiological activity
in the soil and transformed to ammonium through the process of denitrification. This
ammonium compound is oxidized by two groups of bacteria to form nitrate and an unstable
intermediate nitrite product (which we are combining in the label of “nitrates”) in a process
called nitrification. Ammonium can be adsorbed to clay particles and moved with soil during
sedimentation processes. Nitrates are large contributors of nutrient pollution since they are
water-soluble and may readily move through the soil profile to groundwater by the process of
leaching. The nitrates can then enter rivers, lakes, or streams as groundwater recharge
causing a constant inflow of nitrogen to the surface water bodies.
The forms of nitrogen measured in this study include nitrate + nitrite (NO2 + NO3-N),
ammonium (NH4), organic nitrogen, and total nitrogen. NO2 + NO3-N, or nitrates as they
will be referred to in further discussion, are a highly soluble form of nitrogen that is readily
available for use by plants. Nitrate that is not utilized by plants can leach out of the soil
profile and into groundwater. Nitrate can be input to streams through groundwater if the
stream receives groundwater discharge. Many of the streams in the Branch River Watershed
are baseflow-dominated or have strong groundwater inputs. In Wisconsin, naturally
occurring concentrations of nitrate are typically less than 0.2 mg/L. Sources of nitrate in

Bettering the Branch – University of Wisconsin-Stevens Point - December 2004 28
surface and groundwater can include livestock excrement, nitrogenous fertilizers, septic
system effluent, and wildlife. The nitrate that is applied to the land through fertilizers and
manure spreading can follow several paths. It can either be taken up by plants, degraded by
microorganisms in the substrate, removed by leaching of infiltrating water and thus
transported into the groundwater, or the nitrate goes through denitrification, a process by
which the nitrate is reduced to the gaseous form of nitrogen (Figure 7). Nitrate is extremely
soluble, so if allowed to infiltrate the groundwater it will persist unless it is reduced to
another form of nitrogen or moves to a discharge region such as a river, lake or wetland.
Figure 7. Diagram of the transformation of various forms of nitrogen within the environment of an agricultural area. (University of Minnesota 2000)
Ammonium (NH4) is another form of nitrogen pertinent to water quality. Ammonium serves
as a secondary source of nitrogen to plant life (NCSWQG, 2002). The major sources of NH4
include livestock waste, fertilizers, and spillage during transport/application of NH4 fertilizer.
Septic systems and improper disposal of household cleaning products containing ammonia
are other sources. A natural source of NH4 release in the environment is wetlands. Wetlands
can act as a sink for nutrients like nitrogen with some loss of nitrogen as nitrogen gas,

Bettering the Branch – University of Wisconsin-Stevens Point - December 2004 29
however, given the right conditions ammonium can also be released. Ammonium is
transported into rivers via overland flow after a precipitation event. It is also transported to
surface water through groundwater discharge (NCSWQG, 2002). In certain conditions (high
pH) ammonia can be toxic to aquatic organisms.
Organic nitrogen (organic N) is the portion of the total nitrogen (total N) that is associated
with soil particles or organic matter. Typically this form of nitrogen is not readily available
for plant uptake, however changes in form of nitrogen can occur and through these changes
organic nitrogen can become available. Total N is the sum of nitrate, ammonium, and
organic nitrogen. USEPA recommendation levels for total N in streams in this region is less
than 0.54 mg/L (USEPA, 2002).
Phosphorus
Phosphorus is a major nutrient that is important to water quality in the Branch River. In most
of Wisconsin’s surface water, phosphorus is a limiting nutrient, meaning that plant growth is
controlled by the amount of available phosphorus. In these systems, an increase in the level
of phosphorus will lead to increased aquatic plant and/or algae growth (NCSWQG, 2002).
Levels typically increase as a result of human activity when excess phosphorus levels enter
the environment via human and animal wastes, soil erosion, detergents, septic systems, and
runoff from farmlands or lawns (Shaw, 1996). There are numerous sources of phosphorus
throughout the Branch River Watershed. Phosphorus can come from animal waste through
barnyard runoff, manure applied field runoff, and direct access of livestock into the surface
water itself. Decomposing vegetation and organic matter releases phosphorus. Therefore,
even trees along a river contribute some phosphorus through leaf drop. Phosphorus is also
found in agricultural and lawn/garden fertilizers and over time, phosphorus associated with
septic systems can move from the drainfield to groundwater. Like nitrogen, phosphorus can
also be re-released from wetland sediments.
Phosphorus is necessary for a healthy aquatic ecosystem, yet in excess it can lead to multiple
water problems including: increased aquatic plant growth, taste and odor problems for human
Bettering the Branch – University of Wisconsin-Stevens Point - December 2004 30
consumption, and oxygen consumption from excessive plant decomposition leading to fish
kills (Shaw, 2002). For this region of the country, acceptable levels of total phosphorus in a
freshwater river are considered to be below 0.33 mg/l (USEPA, 2002).
Most often, phosphorus is measured as soluble reactive phosphorus (SRP), and total
phosphorus (TP) (Shaw et al., 2002). SRP is principally the inorganic dissolved form
orthophosphate, which is a form that is readily available for use by plants and animals. TP
includes both organic P and SRP. TP includes less soluble forms of phosphorus. It is usually
adsorbed to soil or organic matter and most often enters a river system associated with soil
particles carried by overland flow during runoff events. Once in the stream, particles will
settle out in areas of lower velocity and as temperature, pH, and oxygen conditions change,
phosphorus can be released from the particle changing to more soluble forms of phosphorus
that can readily be utilized by plants.
CHLORIDE
Chloride is neither a nutrient nor toxin on its own, but because the natural levels of chloride
in Wisconsin are relatively low it is an indicator of inputs to the river system.
Microorganisms do not degrade chloride and it does not react with soil as it moves to the
river. Where there is chloride there may be nutrients and other contaminants coming into the
river system. Sources of chloride include septic systems, animal waste, potassium chloride
fertilizer, pesticides, and road-salting chemicals (Shaw et al., 2002). Studies have shown
when chloride is moving to the river, primarily via groundwater, the concentrations tend to
be higher during baseflow (low flow) conditions. If chloride is moving to the system through
overland flow, concentrations will be elevated during runoff events and lower during
baseflow.
TOTAL SUSPENDED SOLIDS
Total suspended solids (TSS) are the amount of solids, both organic and mineral, that remain
‘suspended’ within the water column (Michaud, 1994). Although suspended solids occur
naturally with storm events and fish activity, they are also influenced by runoff from
commercial, agricultural, and residential land uses within a watershed where soils are
Bettering the Branch – University of Wisconsin-Stevens Point - December 2004 31
exposed or cultivated. During rainfall, snow melt, or wind storms, soil can be carried by
either water or wind and deposited in low areas such as rivers. TSS can also move to a river
through conduit discharges such as storm sewers and municipal or industrial effluent pipes or
over impervious surfaces such as roads and driveways. Once in the system, bottom feeding
fish like carp re-suspend sediment that has settled to the bottom of a river.
High concentrations of TSS can transport other constituents, such as pesticides, phosphorus,
nitrogen, and bacteria that adhere to soil colloids and travel into the river through overland
flow during a storm event (USEPA, 2000 and Michaud, 1994). Excess TSS can also turn
water murky, therefore, limiting the amount of sunlight able to reach the rivers. The decrease
in sunlight inhibits plant growth in rivers. This loss of aquatic vegetation can increase the
level of TSS by causing the riverbed to become unstable and increasing susceptibility to bank
erosion. Another problem associated with high TSS is an increase in water temperature.
When the river is a dark color it will absorb heat, therefore increasing the water temperature
and inhibiting invertebrate and fish habitat by lower oxygen concentrations (Michaud, 1994).
The suspended particles, often tinier than a grain of sand, may eventually settle to the river
bottom where the velocity slows. This can blanket fish breeding or macroinvertebrate habitat,
making those areas less desirable for use by some species. TSS can also affect various fish
and aquatic species by creating a more turbid environment, making it difficult to see.
ATRAZINE
Atrazine, an herbicide, is one of the most frequently used selective pesticides in the United
States. Atrazine was most widely used between 1987 and 1989 throughout the Midwest, and
is still quite widely used today (USEPA, 2001). Atrazine is taken up through plant roots and
foliage inhibiting the growth of plants by limiting photosynthesis (Oregon State University,
1996). Its primary function is to control broadleaf and annual grasses (NCSWQG, 2002).
Atrazine belongs to the chemical group of triazine which also includes other herbicides such
as simazine, cyanazine, and propazine. Atrazine is classified as being very persistent in the
soil substrate, although soil microorganisms can degrade atrazine at shallow depths (Oregon

Bettering the Branch – University of Wisconsin-Stevens Point - December 2004 32
State University, 1996). In areas of low to medium clay content, similar to the some of the
subsurface conditions in the Branch River Watershed, atrazine is very mobile through the soil
horizons, therefore, readily moving to groundwater. Atrazine can move to water bodies via
overland flow during rainstorms or via groundwater flow that is discharging to the water
bodies. In river systems, the main concern with this chemical is the detrimental effects to
aquatic biota. It is a potential health hazard to humans and animals with a federal drinking
water standard of 3 ug/L. Some studies have shown atrazine to affect aquatic biota, however,
standards do not currently exist. Toxicity to some aquatic plants occurs above 10 ug/L,
however, more sensitive species can be affected by lower concentrations. Aquatic plant and
animal community structure can be altered at concentrations above 10 ug/L (USEPA, 2001).

Bettering the Branch – University of Wisconsin-Stevens Point - December 2004 33
RESULTS AND CONCLUSIONS
One of the objectives of this study was to assess some of the physical characteristics of
the Branch River. The suitability of a river to provide in-river habitat for aquatic
organisms and water quality conditions to support a healthy ecosystem is dependent upon
physical conditions in the river’s watershed, its tributaries, and the river itself. These
physical attributes include the topography of the land (hilly or level), soil type, amount
and location of wetlands, land uses, land use practices, and the structure within the river.
During snowmelt or a precipitation event water moves across the surface of the landscape
towards lower elevations such as wetlands, lakes and rivers, or internally drained areas
(where water on the surface reacharges groundwater). The capacity of this landscape to
hold water and filter particulates ultimately determines the water quality, habitat, and in-
stream erosion. Simply put, the more the landscape can hold water during a storm, the
slower the water is delivered to the streams and the greater the ability to filter the runoff.
Historically the Branch River had abundant wetlands at its headwaters and sporadically
throughout its reaches. Wetlands act as a sponge, holding large quantities of water during
heavy periods of rain or runoff and slowly releasing it during dryer periods. At the same
time, as the water’s flow slows in the wetland, particles that are moving with the flow are
filtered out. Frequently these particles (soil, organic material, animal waste, etc) have
nutrients associated with them which are also filtered out and predominantly remain in
the wetland. When wetlands are drained the water holding and filtering functions are lost
and water moves more swiftly to the streams carrying more nutrient rich particles with it.
Ultimately the additional fast flow also increases the erosion taking place in the stream;
midway downstream in the Branch River. As the river cuts a deeper more defined
channel, it can no longer spill over its banks, which would result in a loss of energy. This
energy is then used in erosive action and moves in-stream habitat such as logs, branches,
and rocks. Before one can successfully improve in-stream habitat, it is necessary to
address conditions on the landscape to slow water delivery to the streams.

Bettering the Branch – University of Wisconsin-Stevens Point - December 2004 34
Many areas of bottomland that once acted as wetlands are now in crop production in the
upper part of the Branch River watershed. During the spring as the river levels rise due
to spring thaw and rains, these fields become part of the river. If the soil is bare, it is not
only incapable of retaining and filtering water, they are a source of sediment, nutrients,
and pesticides.
River meanders are another natural means of slowing water and disbursing energy. A
meandered stretch of river includes a variety of habitat for aquatic biota including
shallow slow moving water in areas of deposition, cool deep pools, and fast, well
oxygenated water in the main flow. Straightened meanders loose this habitat variability
and allow energy in the water to increase, often resulting in increased downstream
erosion.
Rooted aquatic vegetation can help to buffer the erosive down-cutting forces of water in a
stream. They also collect sediment, provide food and habitat for aquatic biota, and help
to oxygenate water through photosynthesis. Vast areas of river bottom in the Branch
River lack aquatic vegetation. Loss of this vegetation may be due to the abundant
populations of rusty crayfish (a non-native invasive species), scouring of the river bottom,
and/or herbicide inputs.
STREAM BANK EROSION AND CHANGES IN THE RIVERBED
The amount of stream bank erosion in the Branch River is a cumulative result of many
factors including the ability to hold water in upland areas and higher reaches of the
watershed, change in stream elevation, the adjacent land use practices, time of year,
condition of the soil (dry versus moist), and the duration of the storm. A stream bank
erosion inventory was conducted on approximately 28 km of the Branch River from a
canoe over the course of two days to assess current conditions of the stream banks in the
Branch River. The first segment of river that was surveyed for bank erosion took place
on March 25, 2004, and went from County Highway K to the second downstream
crossing at W. Hillcrest Road crossing in northern Manitowoc County. The second
segment of river that was surveyed took place on April 9, 2004, and went from County

Bettering the Branch – University of Wisconsin-Stevens Point - December 2004 35
Highway G in southern Brown County to County Highway K in northern Manitowoc
County.
Sites of substantial bank erosion were marked on maps and the degree of erosion was
noted. In addition, crop fields that were clearly submerged as part of the river were also
recorded during higher flow. Visual estimates were made to quantify the amount of soil
eroding from each site. Location and range of estimated erosion are shown in Figure 8.
Between County Highway G and the second downstream crossing of West Hillcrest Road
soil loss to new erosion was approximately 267 tons/year. The greatest amounts of
submerged agricultural fields were located between County Highway G and Grimms
Road.
Figure 8. Stream bank erosion sites observed in the March 2003 survey of the
Branch River.

Bettering the Branch – University of Wisconsin-Stevens Point - December 2004 36
The 2.1 mile (3.4 km) stretch of river between County Line Road (Man Cal Road) and
County Highway K had a soil loss of approximately 192 tons/year. That shorter stretch
of river was contributing 72% of the total mass of soil eroded per year from County
Highway G to the second downstream West Hillcrest Road crossing. As the stream bank
inventory was conducted, one of the constituents of the survey was recording the land use
that was adjacent to sites with substantial stream bank erosion. Seventy-two percent of
the stream bank erosion was taking place near adjacent wooded areas. Other adjacent
land uses included grassland with an estimate of 9.5% of the total amount of erosion and
cropland with about 4.5%. Overall, the wooded stream banks from Man Cal Road
(County Line Road) to Grimms Rd were the most substantial areas of erosion. This area
has steep stream banks that the river can not spill over; therefore, increased velocity
during heavy storms and spring thaw result in eroding the banks in this section. Several
bridges were too low for passage and required portage while canoeing the Branch River.
River systems are dynamic and over time naturally change, affecting width, depth,
shoreland, and sinuosity (bends in the river). Sinuosity is the ratio of channel centerline
length compared to the straight line length of the river. Older streams have greater
sinuosity giving rivers a snake like appearance (Figure 9) with areas of scouring and
deposition creating pooling and fast moving water that provide habitat for a variety of
aquatic biota. Scouring and pooling areas also help slow river discharge by forcing
discharge against stream banks causing flow to lose force.
During floods sinuosity slows flow to a point where water pools and flows over the land
where it can be absorbed and held in lowlands. At times the natural bank overflow can
create problems for people by flooding roads, crops, homes, etc. One approach to
address this issue is to straighten stretches of a river to move water through a given reach
at a faster rate. However, straightening can create other problems; with increased
velocity the water holds greater energy, which is often dissipated in a river system though
erosive force downstream. Also, straightening eliminates the rivers natural form, altering
some habitat by widening, decreasing the depth, and eroding the banks of the stream.
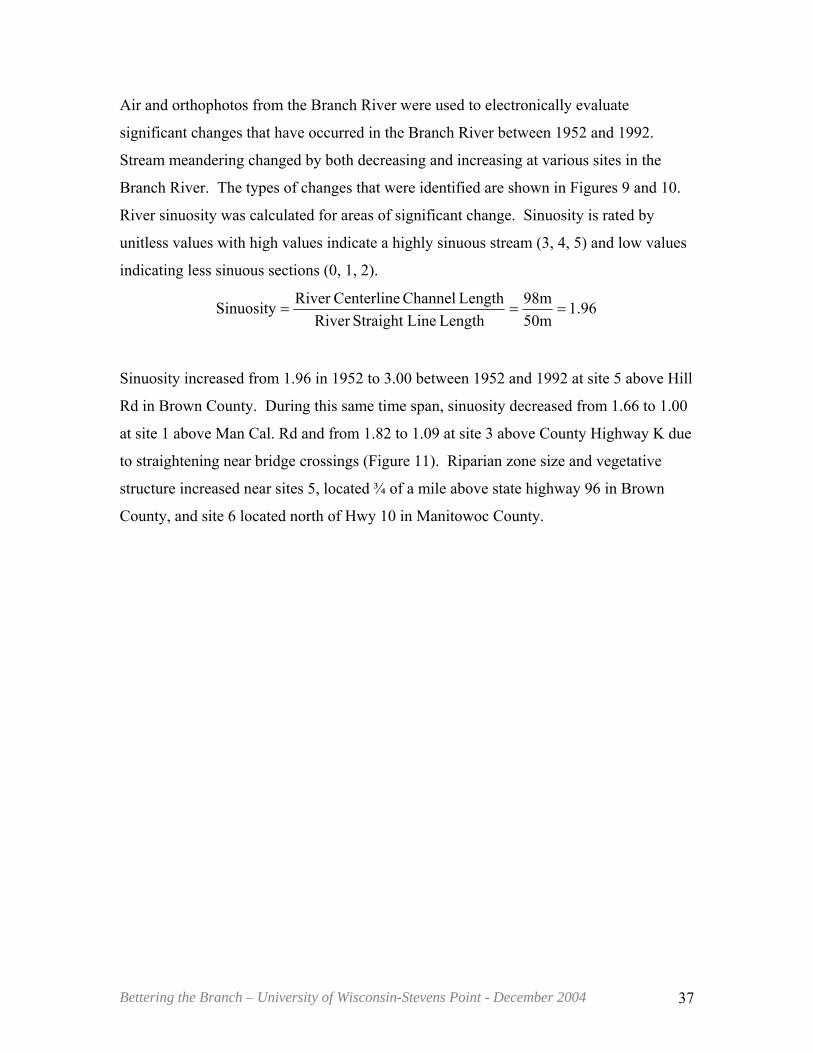
Bettering the Branch – University of Wisconsin-Stevens Point - December 2004 37
Air and orthophotos from the Branch River were used to electronically evaluate
significant changes that have occurred in the Branch River between 1952 and 1992.
Stream meandering changed by both decreasing and increasing at various sites in the
Branch River. The types of changes that were identified are shown in Figures 9 and 10.
River sinuosity was calculated for areas of significant change. Sinuosity is rated by
unitless values with high values indicate a highly sinuous stream (3, 4, 5) and low values
indicating less sinuous sections (0, 1, 2).
1.9650m98m
Length LineStraight River Length Channel CenterlineRiver Sinuosity ===
Sinuosity increased from 1.96 in 1952 to 3.00 between 1952 and 1992 at site 5 above Hill
Rd in Brown County. During this same time span, sinuosity decreased from 1.66 to 1.00
at site 1 above Man Cal. Rd and from 1.82 to 1.09 at site 3 above County Highway K due
to straightening near bridge crossings (Figure 11). Riparian zone size and vegetative
structure increased near sites 5, located ¾ of a mile above state highway 96 in Brown
County, and site 6 located north of Hwy 10 in Manitowoc County.

Bettering the Branch – University of Wisconsin-Stevens Point - December 2004 38
Figure 9. Natural change in sinuosity of the Branch River between 1952 and 1992,
Brown County, WI.
Figure 10. Artificial alterations to the Branch riverbed between 1952 and 1992
Brown County, WI.

Bettering the Branch – University of Wisconsin-Stevens Point - December 2004 39
Figure 11. Riparian zone, natural, and manmade changes to the Branch River in
Brown and Manitowoc Counties, WI between 1952 and 1992.

Bettering the Branch – University of Wisconsin-Stevens Point - December 2004 40
STREAMFLOW
Streamflow in the Branch River watershed was measured in a multitude of ways to
demonstrate how water was moving into and through the system. Generally speaking,
streamflow, or the quantity of water moving past a point over a certain period of time,
increases from upstream to downstream. This is often directly related to the amount of
land that drains to groundwater, tributaries, wetlands, and other regions in the river
system; as the area of land that drains to the river increases, streamflow also increases.
Streamflow was measured using flow meters by both CWSE and FOBR. Streamflow
measurements were collected periodically from the beginning of the project in July 2003
through May 2004. Eleven sites were routinely measured by the FOBR. This
information was used to create rating curves for FOBR staff gages and pressure
transducers that were installed as part of this study. This will enable FOBR to estimate
discharge from their staff gage readings. Additional points should be collected during
low flow and high flow (if allowable) to make the rating curves more robust. Pressure
transducers were deployed in the Branch River. These instruments were programmed to
collect pressure and temperature measurements every 15 minutes, if there was a change
in pressure of more than 1% from the previous reading. This information was used to
evaluate the changes in flow and the river’s response to a variety of precipitation events.
The five pressure transducer sites were at crossings with County Highway G, West
Hillcrest Road (west and/or Zipperer Bridge), West Hillcrest Road (center), West
Hillcrest Road (east), and Branch River Road (within the Golf Course). Locations of the
pressure transducers and staff gages are shown in Figure 12.

Bettering the Branch – University of Wisconsin-Stevens Point - December 2004 41
Figure 12. Location of FOBR staff gages, pressure transducers, and measured
discharge sites in the Branch River watershed. Branch River Discharge and Temperature
The amount of water in the Branch River varies over time and at different locations.
Sources of streamflow include precipitation that falls directly on the river, runoff
generated through precipitation events, and groundwater discharging to the stream
through springs and groundwater.
Once the water enters the Branch River, it flows downstream at a rate influenced by the
stream slope, geometry and substrate characteristics. These stream features vary with
distance downstream. In Figure 13, the stream bottom slope is shown. This shows that

Bettering the Branch – University of Wisconsin-Stevens Point - December 2004 42
upstream and downstream portions of the stream have a steeper slope and mid-stream
sections have a more gradual slope.
600
650
700
750
800
850
900
950
0 5 10 15 20 25 30 35
Distance from the Headwaters (miles)
Ele
vatio
n (ft
.)
Figure 13. Gradient (slope) of the Branch River.
Figure 14 shows the variation in river discharge measured at different locations and
different times. We would expect that the stream discharge would increase moving
downstream, however, as this figure shows, that increase was not linear with distance
downstream. Reasons for variation in the increase in streamflow moving downstream
include variations in slope, configuration of the stream (e.g., pools), variations in
streambank resistance to flow (e.g., smooth versus rough) and the amount of water that
enters the stream in a particular stream segment. That amount of water can vary because
of changes in the size of the contributing area and variations in the contributions from
groundwater in the different stream segments.

Bettering the Branch – University of Wisconsin-Stevens Point - December 2004 43
Discharge in the Branch River
0.0
50.0
100.0
150.0
200.0
250.0
300.0
350.0
Mill Rd.
County
G
Manca
l
Zipperer
County
J
Hillcres
t Wes
t
Hillcres
t
Reifs M
ills
Village
Branch
Rive
r Rd.
Union
Dis
harg
e (c
fs)
11/16/200311/28-29/200312/6/200312/13/20033/17/20043/24/20044/21/20045/2/20044/2/20045/22/20045/15/2004
Figure 14. Measured discharge in the Branch River during the study.
The variations in streamflow with distance in Figure 14 show that certain segments of the
stream, such as that between West Hillcrest East and West Hillcrest Center show little
increase in streamflow at certain times of the year. Other times, the flow decreases
between these locations. Because that stream section has close contact with the dolomite
bedrock, this water may be reentering groundwater between these sections. Because the
bedrock system is cracked and fractured near the surface, this flow could convey water
away from the stream rapidly.
To further evaluate the variations in streamflow between locations, results from pressure
transducers were used. In Figures 15 and 16, the flow and temperature are shown at the
five different transducer locations in early winter. Flow is shown at the different
locations after dividing by the surface watershed contributing to that location. The
increase in flow and decrease in stream temperature in later November coincides with a
runoff event in the stream. As colder runoff water enters the stream, water temperature
drops and stream discharge increases. Stream temperature was similar between locations
during this runoff event. In the weeks following that runoff event, streamflow decreased

Bettering the Branch – University of Wisconsin-Stevens Point - December 2004 44
in response to the absence of event runoff. As streamflow drops, the flow in the upstream
Way-Morr transducer location decreased more rapidly than at the downstream locations.
This is consistent with lower groundwater inputs in the upstream portion of this
watershed that was observed during the mapping of springs.
Figures 17 and 18 show the flow and temperature in the stream in March/April, 2004.
Once again, storm events lead to increases in streamflow and corresponding increases in
temperature as warmer air temperatures now lead to increases in stream temperature
during storms. Similar to the early winter results, relatively low streamflow is observed
at the Way-Morr location consistent with relatively small groundwater inputs when
streamflow is low. Although the West Hillcrest East and West Hillcrest Center sites are
relatively close and differ little in drainage area, it is clear that the flow is higher at West
Hillcrest Center than at West Hillcrest East. As discussed above, this stream section
appears likely to have some loss of water back to groundwater, particularly at low flow.
During the March/April monitoring period, stream temperatures were increasing over
time at all locations. The increase in temperature was fairly uniform at all locations.
Flow and temperature measurement during late April and May are shown in Figures 19
and 20. This was a period of intermediate flow. Initially, the lowest flow, after adjusting
for drainage area, was measured at Way-Morr and West Hillcrest East. As discussed
above, Way-Morr appears to be a stream segment with relatively low groundwater input
and West Hillcrest East appears to lose some water to groundwater. After streamflow
increases in early May, Way-Morr continues to have relatively low flow, but West
Hillcrest East has relatively high flow compared to the other sites. Although this is a
complex flow regime, the relatively cool stream temperatures at the West Hillcrest East
site during this period suggest this may be a time of greater groundwater inputs there.

Bettering the Branch – University of Wisconsin-Stevens Point - December 2004 45
0.10
1.00
10.00
11/8/03 11/15/03 11/22/03 11/29/03 12/6/03 12/13/03 12/20/03
cfs/
sq m
ileGolf CourseHllcrest EastHllcrest CenterZippererWay-Morr
Figure 15. Discharge estimated from the pressure transducers in
November/December 2004.
0
1
2
3
4
5
6
7
8
9
10
11/8/03 11/15/03 11/22/03 11/29/03 12/6/03 12/13/03 12/20/03
Tem
pera
ture
C
0
10
20
30
40
50
Tem
pera
ture
F
Golf CourseHllcrest EastHllcrest CenterZippererWay-Morr
Figure 16. Temperature measured by the pressure transducers in
November/December 2004.

Bettering the Branch – University of Wisconsin-Stevens Point - December 2004 46
0.10
1.00
10.00
100.00
3/6/04 3/13/04 3/20/04 3/27/04 4/3/04 4/10/04 4/17/04 4/24/04Date
cfs/
sq m
ile
Golf CourseHllcrest EastHllcrest CenterZippererWay-Morr
Figure 17. Discharge estimated from the pressure transducers in March/April 2004.
0
2
4
6
8
10
12
14
16
18
20
3/6/04 3/13/04 3/20/04 3/27/04 4/3/04 4/10/04 4/17/04 4/24/04Date
Tem
pera
ture
C
0
17
34
51
68
Tem
pera
ture
F
Golf CourseHllcrest EastHllcrest CenterZippererWay-Morr
Figure 18. Temperature (C) measured by the pressure transducers in March/April
2004.

Bettering the Branch – University of Wisconsin-Stevens Point - December 2004 47
0.10
1.00
10.00
4/10/04 4/17/04 4/24/04 5/1/04 5/8/04 5/15/04 5/22/04 5/29/04Date
cfs/
sq m
ileGolf CourseHllcrest EastHllcrest CenterZippererWay-Morr
Figure 19. Discharge estimated from the pressure transducers in April/May 2004.
0
5
10
15
20
25
4/10/04 4/17/04 4/24/04 5/1/04 5/8/04 5/15/04 5/22/04 5/29/04Date
Tem
pera
ture
C
0
11
22
33
44
55
66
77
Tem
pera
ture
F
Golf CourseHllcrest EastHllcrest CenterZippererWay-Morr
Figure 20. Temperature (C) measured by the pressure transducers in March/April
2004.

Bettering the Branch – University of Wisconsin-Stevens Point - December 2004 48
Temperature was also measured in the Branch River using temperature data loggers that
were deployed and managed by FOBR. Data that provide most information about the
upper temperature limits to the fishery were collected in summer 2003 as the river levels
were low and the summer air temperatures were slightly higher (Figure 21). Data were
also collected throughout 2004; however, that year had heavy spring rains and a slightly
cooler summer.
Branch River Watershed Air Temperature
-10.0
-5.0
0.0
5.0
10.0
15.0
20.0
J F M A M J J A S O N D
o C
14
24
34
44
54
64
74
o F
2001200220032004
Figure 21. Average monthly air temperatures for 2001 – 2004 in the Branch River
watershed (WPS Data, J. Roberts, FOBR).
Maximum recorded temperatures from the temperature data loggers in summer 2003 are
shown in Figure 22. Between mid-June and mid-July the temperature in the Branch
River was above 25°C on several occasions. These temperatures can be stressful to cool-
water fish, however, pools in the Branch may provide refuge for the fish if the warmest
periods occur over short durations.
The temperature data loggers were deployed at slightly different sites in the river in 2004.
Locations of these sites are identified in Figure 23. The maximum and minimum daily
temperatures in summer 2004 are displayed in Figures 24 and 25. Over the period of
record, the only sites that exceeded 25°C occurred for several days in July and August

Bettering the Branch – University of Wisconsin-Stevens Point - December 2004 49
near the Dodge Preserve and County T, respectively. Some of the coolest water occurred
near the headwaters of the Branch River at the Cashman site. There are a significant
number of springs near this site that contribute cold water to the stream. Similar regions
of springs are located throughout the river system and may provide some respite for fish
during hotter times of the year.
16
18
20
22
24
26
28
30
5/1/03 5/31/03 6/30/03 7/30/03
oC
61
63
65
67
69
71
73
75
77
79
81
83
85
oF
Union Rd
Branch River Rd
Hillcrest (East)
Taus-Decker
Grimms Rd
Figure 22. Temperatures recorded by FOBR temperature data recorders in the Branch River during summer 2003.

Bettering the Branch – University of Wisconsin-Stevens Point - December 2004 50
Figure 23. Location of FOBR temperature data recorders in the Branch River in
summer 2004.
6
11
16
21
26
Jun-04 Jul-04 Aug-04 Sep-04
oC
43454749515355575961636567697173757779
oF
County J
Cashman
Grimms
Cherney
W. Hillcrest(center)
Dodge
County T
Figure 24. Maximum daily temperatures measured by FOBR temperature data
recorders in the Branch River in summer 2004.

Bettering the Branch – University of Wisconsin-Stevens Point - December 2004 51
6
11
16
21
26
Jun-04 Jul-04 Aug-04 Sep-04
oC
43454749515355575961636567697173757779
oF
County J
Cashman
Grimms
Cherney
W. Hillcrest(center)
Dodge
County T
Figure 25. Minimum temperatures measured by FOBR temperature data recorders
in the Branch River in summer 2004.

Bettering the Branch – University of Wisconsin-Stevens Point - December 2004 52
WATER QUALITY A portion of this study was designed to characterize the general water quality conditions
in the Branch River in 2003 through 2004. During this study precipitation and
corresponding river flow varied significantly from “normal” years. Summer 2003 was
very dry, with very low flows reported throughout the state. Late spring 2004 had
tremendous rain that resulted in water quantities in the Branch that created areas of
significant erosion and bridge failure. Therefore, water quality results may not be
considered normal, but still give insight about the general water quality conditions in the
Branch River system.
Samples were collected during two low flow (baseflow) periods (July 2003 and
September 2004), one snowmelt (March 2004) and two precipitation events (August 2003
and May 2004). Single samples were collected during each sampling period. A more
detailed assessment of water quality would include sampling during several periods
within an event, and collecting more samples throughout the year.
Baseflow discharge in July 2003 was much greater compared with September 2004. The
water chemistry results were also quite different. Nitrate-N concentrations in the Branch
in the 2003 samples ranged from 0.2 to 10.9 mg/L with a median of 0.8 mg/L (Figure 26
and Table 2). In 2004 nitrate concentrations in the Branch River samples ranged from
0.2 to 6.2 mg/L with a median of 2.5 mg/L. Typically we do not see this variability in
baseflow concentrations; it may be due to the lack of groundwater recharge in 2003, but
may also be related to multiple applications of nitrogen on agricultural land during the
2004 growing season. Additional applications were necessary in some of the fields due
to loss of nitrogen from the heavy rains. Background concentrations of nitrate in surface
water in Wisconsin are generally less than 1 mg/L. Chloride concentrations followed
similar patterns as the nitrate, with concentrations at most sites greater during baseflow
than events (Figure 27). Background chloride concentrations for this region are around 3
mg/L (Shaw et al., 2002); however, chloride concentrations can be variable in
groundwater within the Silurian dolomite. A study of groundwater chloride
concentrations in Manitowoc County reported an average of 16 mg/L and a range of 1-99

Bettering the Branch – University of Wisconsin-Stevens Point - December 2004 53
mg/Ll in Manitowoc County (Kammerer, 1981). In the Branch River baseflow sample
chloride concentrations in 2003 ranged from 30 to 86 mg/L with a median of 33.5 mg/L.
In the 2004 baseflow samples, chloride concentrations ranged ranged from 22 to 72 mg/L
with a median concentration of 26.2 mg/L. These concentrations are higher than those of
the 1981 study and suggest chloride inputs are significant to the Branch River.
Additional agricultural chemicals may also be moving to the river via groundwater.
Triazine was analyzed in the 2004 baseflow samples. Concentrations were quite low;
however, the unusual spring rains and may account for diluted concentrations. During
events, nitrate and chloride concentrations were diluted with median concentrations of
1.5 mg/L and 13.5 mg/L, respectively. Ammonium concentrations were low in the
baseflow and all events with the exception of the March samples where ammonium was
elevated. This is likely associated with runoff of winter land spread manure.
Approximately 50% of the nitrogen in the Branch River is in solution; the other half is in
the organic form which is associated with soil and other particles of organic material.
The EPA suggests a concentration of 0.54 mg/L total nitrogen for streams in this region
of the country.
Total suspended solid concentrations were relatively low during baseflow; ranging from
1 to 8 mg/L with a median concentration of 3.5 mg/L (Figure 28). Not surprisingly,
suspended solid concentrations during events ranged from 31 to 673 mg/L, with a median
of 74 mg/L. These sediments carry nutrients (nitrogen and phosphorus) into the water, so
it is not surprising that the phosphorus and organic nitrogen concentrations were higher
during events (Figure 29). Median total phosphorus concentrations during baseflow are
89 ug/L and 528 ug/L during events. EPA recommended total phosphorus concentrations
in this region of the state is 33 ug/L.
Samples for water quality analysis were also collected at two tributaries prior to their
confluence with the Branch. They were the Dodge Tributary (at W. Hillcrest) and the
Hempton Lake Tributary. Neither of them exhibited the same level of groundwater

Bettering the Branch – University of Wisconsin-Stevens Point - December 2004 54
influence as many sites in the Branch. In general, contributions of nutrients, solids, and
chloride were much less from these tributaries.
Several grab samples were collected in March and April 2004 during the erosion survey.
They included a drain tile, effluent from the Superfund site, and the tributary feeding the
Branch from the Wandering Springs golf course. The golf course tributary was occupied
by significant quantities of algae, and aquatic plants. The nitrate-N concentrations in the
water sample were 10.9 mg/L and total phosphorus concentrations were 30 ug/L. On the
date of sampling, the other two samples had relatively low concentrations of nutrients and
solids.
Branch River - NO2 + NO3
0
2
4
6
8
10
12
Morriso
n Roa
d
Mill Roa
d
County
G
Hill Roa
d
Grimms R
oad
Reifs M
ills R
oad
W.HILL
CREST TRIB.
W. Hillc
rest R
oad (
Center
)
W.Hillc
rest R
oad (
East)
SUNNY SLOPE TRIB.
County
T
Danmar
Road
Union R
oad
Sample Site
NO
2 +
NO
3 (m
g/L)
Baseflow7/16/2003Event8/3/2003Event3/2/2004Event5/31/2004Baseflow9/13/2004
Figure 26. Nitrate concentrations during baseflow and events at two tributaries and
sample sites within the Branch River.

Bettering the Branch – University of Wisconsin-Stevens Point - December 2004 55
Branch River - Cl
0102030405060708090
100
Morriso
n Roa
d
Mill Roa
d
County
G
Hill Roa
d
Grimms R
oad
Reifs M
ills R
oad
W.HILL
CREST TRIB.
W. Hillc
rest R
oad (
Center
)
W.Hillc
rest R
oad (
East)
SUNNY SLOPE TRIB.
County
T
Danmar
Road
Union R
oad
Sample Site
Chl
orid
e (m
g/L)
Baseflow7/16/2003Event8/3/2003Event3/2/2004Event5/31/2004Baseflow9/13/2004
Figure 27. Chloride concentrations during baseflow and events at two tributaries
and sample sites within the Branch River.
Branch River - TSS
0
100
200
300
400
500
600
700
Morriso
n Roa
d
Mill Road
County
G
Hill Roa
d
Grimms R
oad
Reifs M
ills R
oad
W.HILL
CREST TRIB
.
W. Hillc
rest Roa
d (Cen
ter)
W.Hillc
rest R
oad (
East)
SUNNY SLOPE TRIB.
County
T
Danmar
Road
Union R
oad
Sample Site
TSS
Baseflow7/16/2003Event8/3/2003Event3/2/2004Event5/31/2004Baseflow9/13/2004
Figure 28. Total suspended solid concentrations during baseflow and events at two
tributaries and sample sites within the Branch River.

Bettering the Branch – University of Wisconsin-Stevens Point - December 2004 56
Branch River - Total P
0200400600800
100012001400160018002000
Morriso
n Roa
d
Mill Roa
d
County
G
Hill Roa
d
Grimms R
oad
Reifs M
ills R
oad
W.HILL
CREST TRIB.
W. Hillc
rest R
oad (
Center
)
W.Hillc
rest R
oad (
East)
SUNNY SLOPE TRIB.
County
T
Danmar
Road
Union R
oad
Sample Site
Tota
l P (u
g/L)
Baseflow7/16/2003Event8/3/2003Event3/2/2004Event5/31/2004Baseflow9/13/2004
Figure 29. Total phosphorus concentrations during baseflow and events at two
tributaries and sample sites within the Branch River.
Table 2. Water chemistry results for samples collected during baseflow in the Branch River and tributaries.
Site Name Date NO2+NO3 NH4 Total
N Organic
N SRP TP Cl- TSS Triazine mg/L mg/L mg/L mg/L ug/L ug/L mg/L mg/L ug/L Morrison Rd 7/16/2003 10.9 0.04 12.2 1.2 24 35 86 1 Morrison Rd 9/13/2004 3.90 0.10 5.3 1.4 61 89 72 1 0.05 County G 9/13/2004 0.23 0.05 1.6 1.3 25 86 62 2 0.07 Mill Road 7/16/2003 0.1 0.04 1.6 1.5 494 584 98 1 Hill Road 7/16/2003 0.4 0.14 1.6 1.0 305 343 45.5 3 Hill Road 9/13/2004 2.37 0.06 3.1 0.7 47 70 27.5 3 0.06 Grimms Rd 7/16/2003 3.7 0.06 4.9 1.2 55 97 37 4 Grimms Rd 9/13/2004 6.20 0.01 6.9 0.8 17 49 26.5 4 0.07 Reifs Mills Rd 7/16/2003 2 0.08 3.2 1.1 73 121 33.5 7 Reif Mills Rd 9/13/2004 4.25 0.01 4.9 0.7 14 31 26 3 0.09 West Hillcrest Rd (East) 7/16/2003 0.9 0.06 1.8 0.9 70 143 31 9 West Hillcrest (center) 9/13/2004 2.69 0.01 3.4 0.7 30 54 23 8 0.07 County T 7/16/2003 0.6 0.05 1.5 0.9 77 129 30 3 County T 9/13/2004 2.12 0.01 2.8 0.7 24 45 23 5 0.06 Danmar Rd 7/16/2003 0.4 0.06 1.4 0.9 104 127 29.5 4 Union Rd 7/16/2003 0.8 0.05 1.8 0.9 73 124 30 4 Union Rd 9/13/2004 1.69 0.01 2.4 0.7 25 52 22.5 3 0.06 Dodge Trib (at W Hillcrest) 9/13/2004 0.36 0.03 0.9 0.5 29 49 4.5 6 0.05 Hempton Lake Trib 9/13/2004 0.12 0.08 1.2 1.0 150 165 32 2 0.07

Bettering the Branch – University of Wisconsin-Stevens Point - December 2004 57
Groundwater
According to the DNR, Branch River watershed has the highest potential for groundwater
contamination in the Lakeshore Basin. This ranking was based on land cover, nitrate and
pesticides in well water samples, and presence of confined animal feeding operations
(WDNR, 2000). Groundwater was evaluated several ways in this study including
mapping, sampling springs, and interpreting private well data within the topographic
Branch River watershed. A groundwater watershed has not been delineated for the
Branch River.
Eleven springs were sampled for water quality analysis in late August and early
September 2004. These springs were selected throughout the watershed from the 160
springs that were mapped by FOBR in winter 2003/04. The springs were initially located
using GPS coordinates provided by FOBR, then through observation and temperature
measurements. Most of the springs were located in the riparian zone of the Branch River
or small tributaries. Figure 30 shows the location of the springs identified by FOBR and
the sampling sites of the springs for water quality analysis. The number of samples
collected for analysis is minimal, yet still provides a picture of the groundwater quality
entering the Branch River. To supplement these data, we also queried the UWSP
Groundwater Center database for private well sample information within the Branch
River watershed.
Temperature of the spring water gives a general indication of how long the groundwater
has been below ground. Cooler temperatures indicate a deeper flow path that usually
originates a greater distance from the river than warmer temperatures. Nitrate and
chloride readily move through soil and into groundwater. Spring samples confirm that
this is happening in the Branch River watershed. Only two of the samples had natural
background concentrations of nitrate and five (45%) of the samples had concentrations
over the 10 mg/L federal drinking water standard (Figure 31 and Table 3). The
remainder of samples (4) had moderate concentrations of nitrate. Chloride concentrations
ranged from high to very high. It is quite possible that other constituents applied on the
land with the nitrogen are also moving to the river. Triazine was analyzed and

Bettering the Branch – University of Wisconsin-Stevens Point - December 2004 58
concentrations were relatively low. This may be due to the time of the year and the
amount of precipitation in the basin in the spring of the year.
Phosphorus does not usually move as readily to groundwater as nitrate and chloride. Six
(54%) of the samples had low concentrations of SRP, but concentrations of TP were quite
elevated in the majority of samples (Figure 32 and Table 3). Most of the nitrogen
moving through the groundwater was in the form of nitrate. In groundwater, chemical
oxygen demand (COD) is usually due to metals in solution (i.e. Fe, Mn, etc). COD
concentrations above 30 mg/L can effect the dissolved oxygen in surface water, however,
because of the movement of rivers they tend to be less susceptible to oxygen depletion
than lakes (Figure 33).
Table 3. Water chemistry of springs sampled near the Branch River in Fall 2004.
Location Temp Total P SRP NO2+NO3
- N NH4 TKN Org N Total
N Chloride COD Triazine C ug/L ug/L mg/L mg/L mg/L mg/L mg/L mg/L mg/L ug/L Cashman 9.3 525 51 17.2 0.02 0.98 0.96 18.18 99.0 21.4 0.050 Cty Hwy Z 11.1 25 15 5.8 0.02 0.14 0.12 5.94 57.0 6.4 <.05
Wandering 9.8 70 18 16.8 0.01 0.62 0.61 17.42 41.5 13.0 0.070 Grimms 11.0 14 14 2.7 0.01 0.16 0.15 2.84 17.5 <3 <.05 ZippererU 17.0 54 43 <.2 0.06 0.92 0.86 0.96 21.0 32.7 0.050 ZippererM 15.0 437 31 0.4 0.02 1.89 1.87 2.29 17.0 81.3 0.050 ZippererL 9.2 33 18 6.6 0.04 0.38 0.34 6.98 34.5 5.8 0.050 Hillcrest 9.0 631 16 11.3 0.04 2.47 2.43 13.77 22.0 68.9 0.050 Reifs 15.0 621 43 12.8 0.04 1.58 1.54 14.38 31.5 41.7 0.050 Rahr 9.1 56 2 4.9 0.01 0.55 0.54 5.44 23.5 9.6 0.080 Spring67 12.9 120 27 10.1 0.08 0.63 0.55 10.73 56.0 18.8 0.160

Bettering the Branch – University of Wisconsin-Stevens Point - December 2004 59
Figure 30. Location and names of springs identified by FOBR and spring water
quality samples sites.
Figure 31. Nitrate-N and chloride concentrations in spring water samples collected
in fall 2004. Road names are labeled.

Bettering the Branch – University of Wisconsin-Stevens Point - December 2004 60
Figure 32. Phosphorus concentrations in spring water samples collected in fall 2004.
Figure 33. Chemical oxygen demand concentrations in spring water samples
collected in fall 2004.

Bettering the Branch – University of Wisconsin-Stevens Point - December 2004 61
Figures 34 and 35 show nitrate and chloride concentrations in private wells in the Branch
River watershed. Data are from the Central Wisconsin Groundwater Center located at
UWSP. The federal drinking water standard for nitrate is 10 mg/L. Of the 88 samples
that were analyzed for nitrate-N 21% (19 samples) exceeded this standard. Thirty-five
percent of the samples (31) had minimal impact and 41% (36) had concentrations
between 2 and 10 mg/L.
Figure 34. Nitrate concentrations in private wells. Central Wisconsin Groundwater
Center database (1991-2004).

Bettering the Branch – University of Wisconsin-Stevens Point - December 2004 62
Figure 35. Chloride concentrations in private wells. Central Wisconsin
Groundwater Center database (1991-2004). BASELINE MONITORING
Baseline monitoring on the Branch River was conducted in the summer and fall 2003.
There are three primary components to baseline monitoring: habitat data collection,
macroinvertebrate data collection, and fish community data collection. All of the
procedures followed the DNR baseline protocol outlined in the Methods section. Habitat
data were collected over the course of six days (August 14, 15, and 18-21, 2003) at 12
stations on the Branch River (Figure 36). Several significant rain events took place ten
days prior to the first sampling date which resulted in the Branch River to be slightly

Bettering the Branch – University of Wisconsin-Stevens Point - December 2004 63
above baseflow conditions. The weather throughout the baseline monitoring was on
average hot and sunny; around 80oF. No significant precipitation events took place while
the assessment was underway. Fish community data was collected by WDNR fishery
biologists in the lower end of the Branch River at three stations: County Highway T,
Village Drive, and Union Road.
Figure 36. Location of 12 baseline monitoring stations in the Branch River and fish
habitat ratings for the baseline stations.
Macroinvertebrates or aquatic insects are used as indicators for water quality. Data
derived from macroinvertebrate samples provides valuable insight on the biological and
physical condition of the stream (WDNR, 2000). Macroinvertebrate samples were
collected from the Branch River throughout the entire day on October 18, 2003, at one
point from each of 12 baseline monitoring stations. The weather for macroinvertebrate
data collection was on an unusually warm and sunny day in October. The
macroinvertebrate samples were taken to the Aquatic Entomology Laboratory (AEL) at
UWSP where they were identified and analyzed. The macroinvertebrate assessment was
assessed using several different methods: the Hilsenhoff Biotic Index (HBI), Family

Bettering the Branch – University of Wisconsin-Stevens Point - December 2004 64
Level Biotic Index (FBI), and the percent EPT (Ephemeroptera, Plecoptera, and
Trichoptera) (Table 4). The Hilsenhoff Biotic Index and Family Level Biotic Index
assess water quality constituents based upon the degree of organic loading which results
in varying levels of dissolved oxygen in streams. Generally, as the degree of organic
loading increases levels of dissolved oxygen in the water decrease which directly impacts
the type of macroinvertebrates residing in that area. The macroinvertebrates that are
sensitive to organic loading are assigned a pollution tolerance level; the lower the
pollution tolerance level the more intolerant that specific organism is to organic pollution.
The macroinvertebrates with higher tolerance values can generally be found in streams
that have high degrees of organic pollution and low dissolved oxygen levels. For HBI
determinations; macroinvertebrate identification is carried to the lowest possible
taxonomic (family) level to assign a pollution tolerance level. According to Lillie (2003)
the FBI was designed as a rapid field assessment tool. As a consequence, the FBI can be
less precise than the HBI. Generally the FBI underestimates the severity of pollution in
highly polluted streams and overestimates the degree of impact in clean streams. Percent
EPT provides the number of distinct genera found among the orders Ephemeroptera,
Plecoptera, and Trichoptera in a biotic index sample. These three orders are separated
from the rest based upon the common characteristic of being intolerant of organic
pollution. Table 4 shows the macroinvertebrate assessment results for all of the 12
stations on the Branch River including the results of past assessments conducted by the
WDNR on several of the stations.

Bettering the Branch – University of Wisconsin-Stevens Point - December 2004 65
Table 4. Macroinvertebrate assessment results for the baseline monitoring on the Branch River. Road Crossing HBI HBI Rating HBI % EPT FBI FBI Rating FBI % EPTWay-Morr Park 7.89 Poor 13 7.78 Very Poor 12Way-Morr Park * 8.15 Poor 13Hill Road 7.89 Poor 25 7.46 Very Poor 24Wayside Road 7.94 Poor 42 6.23 Fairly Poor 39Man Cal Road (County G) 6.99 Fairly Poor 13 5.96 Fairly Poor 12County Highway K 7.51 Poor 13 6.57 Poor 17Taus Road 4.90 Good 40 5.04 Fair 41County Highway J 5.32 Good 43 5.70 Fair 44Sunny Slope Road(Hempton Lake Tributary) 8.11 Poor 27 7.14 Poor 22
Sunny Slope Road *(Hempton Lake Tributary) 6.45 Fairly Poor
West Hillcrest Road 4.27 Very Good 62 4.27 Good 63West Hillcrest Road * 4.55 Good 44County Highway T 3.53 Very Good 75 4.05 Very Good 77Village Drive 4.18 Very Good 61 4.36 Good 59Branch River Road * 3.96 Very Good 53North Union Road 4.41 Very Good 51 4.41 Good 50
* Macroinvertebrate samples done by Mary Gansberg in September and October of 1993.
Way-Morr Park Station
The Way-Morr Park baseline monitoring station was located in southern Brown County
near the headwaters of the Branch River. This station was the most upstream station in
this survey. The beginning of the Way-Morr Park station was located approximately 100
ft (30.5 m) upstream from the County Z Bridge. The station had a mean stream width
(MSW) of 35.8 ft (10.9 m) and a total station length of 1115 ft (340 m) upstream from the
starting point. The physical characteristics of the Branch River were very diverse
throughout this station. The river in the upper portion was narrow, shallow, and fast.
This part of the river was made up of a series of runs and riffles. The substrate of the
river in the upper part of the station was comprised primarily of gravel, rubble, and
boulders. Throughout the entire station riparian land use was dominated by woodland
and meadow. Two houses could be seen from the river but only one had a mowed lawn
that approached the river. The lower reaches of the Way-Morr Park station are very
different from that of the upper. The river in the downstream portion of the station was
very wide, deep, and slow moving. The river through this part of the station went
through a series of large wide ponds. The substrate throughout the lower section was
very soft with sand, silt, and clay dominating the stream bottom. Filamentous algae were

Bettering the Branch – University of Wisconsin-Stevens Point - December 2004 66
prevalent throughout the “ponds” where the water was slow and deep. The majority of
the river was well shaded with the exception of the midsection of the ponds.
Way-Morr Park Habitat Assessment
The habitat assessment of the Way-Morr Park station was conducted on August 20, 2003.
As the mean stream width of river throughout this station was 35.8 ft (10.9 m) the Fish
Habitat Rating (FHR) for rivers greater than 32.8 ft (10 m) wide was used to compute the
quanitative ratings. Utilizing the bend-to-bend ratio and the riffle-to-riffle ratio the Way-
Morr Park station was found to have quantitative score of 52 giving it the rating fair
(Table 5). The lowest scoring component of the assessment was bank stability. Many of
the banks along this section of the Branch River had bare soil on both sides of the river:
therefore, bank stability scored in the poor range due to 49% of the banks within one
meter of the river being bare and unprotected. The maximum thalweg depth also scored
low on the habitat assessment with a rating of fair. Because the Way-Morr Park station
was near the headwaters of the Branch River a shallow maximum thalweg depth of 0.6 m
is considered normal. The bend to bend and the riffle to riffle ratios both rated excellent
which is indicative of a diverse habitat structure. Boulders, coble, and gravel dominate
the substrate of the river in the riffle and run habitat types. The substrate of the large
deep pools was primarily sand, silt, clay, and detritus. An average of 64% of the
substrate was boulder, cobble, and gravel, giving the rocky substrate a rating of good for
all of the transect points sampled. Fish cover was variable throughout the station. The
upper reaches of the station were comprised of runs and riffles in which the water became
to shallow for substantial fish cover. The lower stretches of the station consisted of large
pools that contained boulders, filamentous algae, and woody debris which provided fish
cover. Overall, the station rated good on the fish cover component.
Table 5. Score summary of habitat ratings for the Way-Morr Park station. Habitat Item Calculated Value Score RatingBank Stability 51% 0 PoorRocky Substrate 64% 16 GoodCover For Fish 11% 16 GoodMax. Thalweg Depth 0.62 m 8 FairBend:Bend 9.7 m 12 ExcellentRiffle:Riffle 3.4 m 12 Excellent
52 Fair52 Fair
Total (using bend to bend)Total (using riffle to riffle)

Bettering the Branch – University of Wisconsin-Stevens Point - December 2004 67
Way-Morr Park Macroinvertebrate Assessment
Macroinvertebrate samples were collected in the Branch River at the Way-Morr Park
station October 18, 2003. The macroinvertebrate sampling location was at the north end
of Way-Morr Park. The sampling was done in rip-rap beneath the Park Road Bridge.
Total sample time lasted three minutes using the kick method with a D-net. The water at
this site was stained brown, had a temperature of 12.3°C, and had a velocity of 0.06
ft/second (0.018 m/sec). The river at the Way-Morr Park site was 24.9 ft (7.6 m) wide
and had an average depth of 2 ft (0.6 m). The sample was taken in a 100% shaded
environment with boulders dominating the substrate composition. Filamentous algae
were commonly found along the banks of the Branch River throughout this station. The
scores of the biotic indices used to assess the Way-Morr Park station macroinvertebrate
sample ranged from 7.78 to 7.89, resulting in a water quality rating that ranged from very
poor to poor for this station. This is consistent with the previous rating of poor that was
given to the Way-Morr Park station in a past study done by the WDNR in 1993
(Gansberg, 1995). According to the macroinvertebrate water quality rating, this section
of the Branch River has very severe to significant organic pollution; however, significant
amounts of organic material (decaying vegetation) can be expected in these headwaters
with fairly flat terrain and associated wetlands. Overall, the Branch River at the Way-
Morr Park station was slow and shallow, indicative of low oxygen situations. The ratings
given by the biotic indices could be predicted due to the morphological characteristics of
the river at the Way-Morr Park station.
Hill Road Station
The Hill Road station was located in southern Brown County approximately two miles
downstream from the Way-Morr Park station. The starting point for the Hill Road station
was located approximately 100 ft (30.5 m) from the Hill Road Bridge over the Branch
River. The station proceeded upstream from this point for 564 ft (72 m). The Hill Road
station had an overall mean stream width of 16.7 ft (5.1 m). There was one farm along
the station that was located approximately 246 ft (75 m) to the west. The physical
characteristics of the river and the riparian edges were similar throughout the entire
station. The river was generally narrow and shallow with one large run. Meanders were

Bettering the Branch – University of Wisconsin-Stevens Point - December 2004 68
common throughout the Hill Road station. The substrate of the river was primarily
comprised of sand and silt with some detritus. Submergent aquatic plants were prevalent
throughout the station and included pondweed (potamogetan sp.), filamentous algae
(periphyton), and duckweed (lemna sp.). Emergent aquatic plants including cattails
(typha sp.) were commonly found throughout this station in the shallow water near the
rivers edge. The vegetation in the riparian zone of the river was dominated by a variety
of grasses. The riparian land use within 16.4 ft (5 m) of the river was lowland meadow
throughout the entire station. The riparian buffer width extended beyond 32.8 ft (10 m)
at all of the transects within the Hill Road station. The meadow on both sides of the Hill
Road station provided almost zero shade cover to the Branch River.
Hill Road Habitat Assessment
The habitat assessment in the Hill Road station was conducted on August 18, 2003. The
mean stream width of the Branch River was 16.7 ft (5.1 m) throughout this station, so the
Fish Habitat Rating (FHR) method for rivers less than 32.8 ft (10 m) wide was used to
compute the quanitative ratings. The bend-to-bend ratio for assessing the fish habitat the
Hill Road station gave a score of 45. The riffle-to-riffle ratio in this station gave a score
of 30. The corresponding rating of fish habitat associated with both of these scores was
fair. Due to the low frequency of riffles throughout the Hill Road station, the bend-to-
bend ratio provided a better estimate of the fish habitat rating. The lack of riffles was
associated with the typical morphology of the Branch River near the headwaters. The
lowest scoring components of the habitat assessment were the percent of fine sediments
in the substrate, the percent cover for fish in the stream, and the percent of pools
throughout the length of the station. Fine sediment comprised 83.2% of the river
substrate throughout the Hill Road station yielding a rating of poor for fish habitat. Silt
made up the largest portion of the substrate in the Hill Road station, followed by sand,
detritus, clay, and gravel. There was little cover for fish throughout the entire length of
the station. The total amount of cover for fish that was measured along the transects was
7.9 ft (2.4 m) out of the 201.7 ft (61.5 m) of transect that were surveyed. The percent of
fish cover for each station averaged approximately 3.7% of the station; this gives a
qualitative rating of poor. Another low scoring component of this habitat assessment was
the percent of pools within the river. The Hill Road station was one big run. The Branch

Bettering the Branch – University of Wisconsin-Stevens Point - December 2004 69
River at this location had a series of meanders and had no pool or riffle habitats
associated with it, which gave the pool area a rating of poor. The average thalweg depth
for the Hill Road station was approximately 1 ft (0.3 m) and the width to depth ratio
(mean stream width divided by the average thalweg depth) had a value of 21, a rating of
fair. The banks along the Hill Road station showed little sign of bank erosion within 1 m
of the water. Of the 78.7 ft (24 m) of bank that were surveyed, only 26.6 ft (8.1 m) had
substantially eroded banks. The average length of un-vegetated eroded bank was 0.3 m
of bank measured. This yielded a rating of good. The erosion was minimal throughout
this station because of the grassed banks and large riparian buffer widths. The riparian
buffer width was over 32.8 ft (10 m) on each side of the river at all of the transects. The
Hill Road station received the rating of excellent on the riparian buffer width component
of the fish habitat rating. The general riparian land cover along the Hill Road station was
lowland grasses.
Table 6. Score summary of habitat ratings for the Hill Road station.
Habitat Item Calculated Value Score RatingRiparian Buffer Width 10.0 m 15 ExcellentWidth:Depth Ratio 21.0 5 FairBank Erosion 0.34 m 10 GoodFine Sediments 83.2% 0 PoorCover for Fish 3.9% 0 PoorPool Area 0% 0 PoorBend:Bend Ratio 5 m 15 ExcellentRiffle:Riffle Ratio 0 m 0 Poor
45 Fair30 Fair
Total (using Bend:Bend)Total (using Riffle:Riffle) Hill Road Macroinvertebrate Assessment
Macroinvertebrate samples were collected in the Branch River at the Hill Road station on
October 18, 2003. The sampling location was approximately 100 ft (30.5 m) upstream
from the Hill Road Bridge. The macroinvertebrate samples were collected in aquatic
plants growing along the edge of the river. The total sample time lasted for three
minutes using the kick sampling method with a D-net. The water at this site was stained
brown with a temperature of 13.8°C, and flowed at a velocity of 0.3 ft/sec (0.09 m/sec).
The river at the sample site was 16.7 ft (5.1 m) wide and had an average depth of 0.33 ft
(0.1 m). The sample was taken in a site with zero shade. The substrate was primarily
comprised of silt, clay, and very fine organic matter. Filamentous algae were prevalent

Bettering the Branch – University of Wisconsin-Stevens Point - December 2004 70
along the banks of the station. The Hill Road station macroinvertebrate sample yielded
biotic indices scores that ranged from 7.46 to 7.89 with a corresponding water quality
rating that ranged from very poor to poor. This indicates very severe to significant
organic pollution, and hence, low oxygen concentrations at the Hill Road station.
Wayside Road Station
The Wayside Road baseline monitoring station was located in the south-eastern corner of
Brown County. The downstream end of the Wayside Road station was situated
approximately 2.5 mi (4 km) downstream from the Hill Road station. The downstream
end of the Wayside Road station was approximately 200 ft (61 m) upstream from the
Wayside Road Bridge. The station then proceeded upstream for 548 ft (167 m). The
station had a mean stream width (MSW) of 26.9 ft (8.2 m). There was one commercial
building along the station that was located approximately 65.6 ft (20 m) east of the
Branch River. The physical characteristics of the Branch River were similar throughout
the entire station length. The habitat type of the river was primarily a run throughout the
Wayside Road station. The substrate of this station was comprised primarily of sand, silt,
and clay. Detritus was also prevalent throughout the station. Submergent aquatic plants
like pondweed (potomogetan sp.) and filamentous algae (periphyton sp.) were common
throughout the station. Emergent aquatic plants including grasses and arrow head
(sagittaria) could be found in the water near the river banks. Most of the riparian zone
within 32.8 ft (10 m) of the river had a well vegetated buffer made up primarily of
lowland grasses. The riparian zone extended beyond 32.8 ft (10 m) on the west side of
the river, but only around 29.5 ft (9 m) east of the Branch River. East of the river was a
steep hill in the riparian zone with tile drains from the adjacent field that discharged into
the river. Land use in the area was dominated by lowland meadow to the west and
agricultural fields to the east. The riparian plants offered very little shading of the Branch
River throughout the Wayside Road station.
Wayside Road Habitat Assessment
The habitat assessment in the Wayside Road station was conducted on August 19, 2003.
The mean stream width was 59.7 ft (18.2 m) throughout the station, so the Fish Habitat
Rating (FHR) method for rivers greater than 32.8 ft (10 m) wide was used to compute the

Bettering the Branch – University of Wisconsin-Stevens Point - December 2004 71
quantitative ratings. Utilizing the bend-to-bend ratio, the fish habitat was given a
quantitative score of 57 which yields a rating of good. Using the riffle-to-riffle ratio, the
Wayside Road station yielded a quantitative score of 42 which gives the station a rating
of fair. Do to the low number of riffles throughout the Wayside Road station, the bend-
to-bend ratio provides a better estimate of the actual fish habitat rating. The lack of
riffles is a result of the morphology of the Branch River near the headwaters. The lowest
scoring components of the Wayside Road station were the width-to-depth ratio and the
percent of fine sediments in the substrate. The width-to-depth ratio is the average width
divided by the average thalweg depth of run and pool habitats. The Wayside Road
station had a width-to-depth ratio of 34.6 which gave a rating of poor. This rating
indicates that the stream is very shallow and wide (Simonson, 1994). The optimum
width-to-depth ratio value is ≤ 7 which corresponds to an average thalweg depth in runs
and pools of 3.9 ft (1.2 m) for a 32.8 ft (10 m) wide stream. The other low scoring
component of the Fish Habitat Rating was the percent of fine sediments in the river
substrate. Fine sediment fraction of substrate included sand, silt, clay, and detritus.
These sediments comprised 83% of the substrate throughout the Wayside Road station
which gives this component of the fish habitat a poor rating. The Wayside Road station
also had some characteristics that are ideal for fish habitat. The riparian buffer width
within 32.8 ft (10 m) averaged 31.5 ft (9.6 m) on both sides of the river, which yields a
good rating for fish habitat. At each of the 12 transects within the Wayside Road station,
bank erosion was measured within one meter of the water on both sides of the river. Out
of the 78.7 ft (24 m) of soil of surveyed only 30.5 ft (9.3 m) were substantially eroded
yielding the rating of good. Cover for fish was also measured. Of the total stream width
surveyed, 19% provided cover for fish giving it an excellent rating. Pool area also had a
rating of good and occupied 39% of the total length of the station. The bend-to-bend
ratio had a rating of excellent due to the number of meanders throughout the station.

Bettering the Branch – University of Wisconsin-Stevens Point - December 2004 72
Table 7. Score summary of habitat ratings for the Wayside Road station. Habitat Item Calculated Value Score RatingRiparian Buffer Width 9.6 m 10 GoodWidth:Depth Ratio 34.6 0 PoorBank Erosion 0.39 m 10 GoodFine Sediments 83.0% 0 PoorCover for Fish 19.0% 15 ExcellentPool Area 39% 7 GoodBend:Bend Ratio 2.4 m 15 ExcellentRiffle:Riffle Ratio 0 m 0 Poor
57 Good42 Fair
Total (using Bend:Bend)Total (using Riffle:Riffle)
Wayside Road Macroinvertebrate Assessment
Macroinvertebrate samples were collected in the Branch River at the Wayside Road
station on October 18, 2003. The location of the sampling site was approximately 105 ft
(32 m) upstream from Wayside Road. The macroinvertebrate samples were collected
under snags and in woody debris along the river banks. The total sample time was three
minutes using the kick sampling method with a D-net. The water at this site was stained
brown, with a temperature of 15.1°C, and flowed at a velocity of 0.16 ft/sec (0.05 m/sec).
The river at the sample site was 16.1 ft (4.9 m) wide and had an average depth of 1 ft (0.3
m). The sample site was partially shaded. The substrate was comprised of silt. Small
patches of filamentous algae were growing around the snags and woody debris. The
biotic indices ranged from 6.23 to 7.94 with the associated water quality rating ranging
from poor to fairly poor. This indicates substantial to very significant organic pollution
at the Wayside Road station making the water subject to low oxygen concentrations.
Man Cal Road Station
The Man Cal Road station was located on the Branch River in the southern most part of
Brown County. This station was located approximately 2.6 km downstream from the
Wayside Road station. The overall length of the Man Cal Road station was 518 ft (158 m)
with the downstream end located approximately 32.8 ft (10 m) upstream from the Man
Cal Road Bridge crossing the Branch River. The Man Cal Road station had a mean
stream width of 14.8 ft (4.5 m). There was a gravel driveway that ran along the eastern
side of the Branch River within the Man Cal Road station. The water throughout the
station was clear with a temperature of 22.9°C. The dissolved oxygen concentration in

Bettering the Branch – University of Wisconsin-Stevens Point - December 2004 73
the water was 7.90 mg/L, yielding an 88.9% dissolved oxygen saturation. The pH of the
water at the station was 7.86. The physical characteristics of the Branch River and
riparian edges were homogeneous throughout the station. The river was deep and narrow
with a natural channel containing many meanders. The habitat types found in the Branch
River throughout the Man Cal Road station were runs and pools. The substrate in the
river was primarily comprised of sand and silt with spotty areas of clay. Detritus and
woody debris were also present in small amounts throughout the station. No submergent
or emergent aquatic plants were observed while conducting the habitat assessment. The
banks of the river showed substantial signs of erosion throughout the station. The
dominant riparian land use throughout the station was woodland, with some areas of
meadow and wetland. The woodland was primarily comprised of larger Silver Maples
(Acer saccharinum). The riparian buffer width extended beyond 32.8 ft (10 m) on both
sides of the Branch River throughout the entire station. The woodland land use in the
riparian zone provided exceptional shading to the river.
Man Cal Road Habitat Assessment
The habitat assessment in the Man Cal Road station was conducted on August 19, 2003.
The mean average stream width of the Branch River was 14.8 ft (4.5 m) throughout the
station so the Fish Habitat Rating (FHR) for streams less than 10 m was used to compute
the quanitative ratings. Utilizing the bend-to-bend ratio for assessing fish habitat, the
Man Cal Road station was found to have a quantitative score 58, a good rating. Using the
riffle-to-riffle ratio, the station was found to have a quantitative score of 48, with a
corresponding rating of fair. Due to the low gradient and lack of riffles within the Man
Cal Road station, the bend-to-bend ratio provided a better estimate of the actual fish
habitat rating in this stretch. The lowest scoring components of the habitat assessment
were the percent of fine sediments in the substrate, the bank stability within one meter of
the river, and the length of pool habitat area throughout the station. Fine sediment made
up 82.5% of the substrate throughout the Man Cal Road station, yielding a poor rating.
The fine sediment fraction of the substrate was comprised of sand, silt, clay, and detritus.
Sand made up the largest portion of the substrate in the station. At each of the 12
transects within the Man Cal Road station, bank erosion was measured within one meter
of the water on both sides of the river. Out of the 78.7 ft (24 m) of soil of surveyed 65.3

Bettering the Branch – University of Wisconsin-Stevens Point - December 2004 74
ft (19.9 m) were substantially eroded yielding a rating of fair. Length of pool habitat area
throughout the entire station was also a limiting attribute. Out of the 519 ft (158.3 m) of
river that was surveyed, only 147 ft (44.8 m) were pool habitat yielding a rating of fair.
This means that only 28% of the Man Cal Road station was made up of pool habitat
which is indicative of shelter or resting areas for fishes, particularly predators or other
large fish (Simonson, 1994). The Branch River also had some characteristics that are
optimum for fish habitat throughout the Man Cal Road station. The width-to-depth ratio
was rated as good indicating that the river was deep and narrow throughout much of this
station. Cover for fish was prevalent and rated excellent. Twenty-eight percent of the
total stream width surveyed offered cover to fish in the form of undercut banks,
overhanging vegetation, woody debris, and boulders. The Man Cal Road station was
excellent, based on riparian buffer width because all of the buffers extended beyond 10 m.
The dominant land cover within the riparian zone was woodland followed by meadow
and shrubs.
Table 8. Score summary of the habitat ratings for the Man Cal Road station. Habitat Item Calculated Value Score RatingRiparian Buffer Width 10.0 m 15 ExcellentWidth:Depth Ratio 9.2 10 GoodBank Erosion 0.83 m 5 FairFine Sediments 82.5% 0 PoorCover for Fish 27.8% 15 ExcellentPool Area 28% 3 FairBend:Bend Ratio 12.5 m 10 GoodRiffle:Riffle Ratio 0 m 0 Poor
58 Good48 Fair
Total (using Bend:Bend)Total (using Riffle:Riffle)
Man Cal Road Macroinvertebrate Assessment
Macroinvertebrate samples were collected in the Branch River at the Man Cal Road
station on October 18, 2003. Two sampling intervals were conducted in different
locations. The first sample was taken in an aquatic plant bed approximately 60 ft (18.3 m)
upstream from the Man Cal Road Bridge. The other sampling interval was conducted in
rip-rap beneath the Man Cal Road Bridge. The total sampling time lasted for six minutes
(two three minute intervals) using the kick sampling method with a D-net. The water at
this site was slightly brown, with a temperature of 10.7°C, and flowed at a velocity of 1.0

Bettering the Branch – University of Wisconsin-Stevens Point - December 2004 75
ft/sec (0.3 m/sec). The river at the sampling site was 16.1 ft (4.9 m) wide with an average
depth of .66 ft (0.2 m). The first sample site was approximately 50% shaded and the
substrate was primarily silt and clay. The second sample site was completely shaded
with the substrate dominated by silt covered boulders. The biotic indices ranged from
5.96 to 6.99 with the corresponding water quality rating of fairly poor. According to the
water quality rating, the Branch River has substantial to significant organic pollution at
the Man Cal Road station. As a result, the Man Cal Road station may be subject to some
periods of low oxygen conditions.
County Highway K Station
The County Highway K station was located on the Branch River in the northwestern
Manitowoc County. County Highway K runs east-west and crosses the Branch River just
east of its intersection with Grimms Road. The upstream end of the County Highway K
station was situated approximately 1.7 mi (2.8 km) downstream from the Man Cal Road
station. The overall length of the County Highway K station was 951 ft (290 m) and had
a mean stream width of 18.4 ft (5.6 m). The downstream end of the station was located
approximately 100 ft (30.5 m) upstream from the County Highway K Bridge. The river
became wider as it approached the bridge, indicating possible anthropogenic impacts.
There was one farmstead approximately 295 ft (90 m) east of the station. The water
throughout the County Highway K station was slightly turbid with a temperature of
22.4°C and a pH of 7.93. The dissolved oxygen levels of the water were 6.30 mg/L,
which equates to 71.8% saturation. The physical characteristics of the Branch River
throughout the County Highway K station were fairly similar. The river had some
diversity in the stream morphology, with pool habitat dominating the station. Runs and
riffles were also present. The substrate of the County Highway K station was primarily
made up of fine sediment. Sand was most abundant followed by silt, clay, and cobble.
Boulders and detritus also were present within the station in minimal quantities. No
submergent or emergent aquatic plants were observed while conducting the habitat
assessment on this station. The banks of the river showed some obvious signs of erosion
close to the river. This station had a well established riparian buffer that extends beyond
32.8 ft (10 m) on both sides of the river. The dominant riparian land uses change

Bettering the Branch – University of Wisconsin-Stevens Point - December 2004 76
throughout the station. The upstream section of the station was made up of woodland and
meadow. As the river progressed downstream the land use switched to meadow and
shrub land. As a result the upstream portion of this Branch River in this station was well
shaded, while the meadow and shrubs in the downstream stretches provide very little
shade for the river.
County Highway K Habitat Assessment
The habitat assessment of the County Highway K station was conducted on August 21,
2003. The mean stream width of the Branch River was 18.4 ft (5.6 m) throughout this
station, so the Fish Habitat Rating (FHR) method for rivers less than 10 m wide was used
to compute the quantitative ratings. Utilizing the bend-to-bend ratio for assessing the fish
habitat the County Highway K station was found to have a quantitative score of 62, a
rating of good. With the riffle-to-riffle ratio the station had an overall quantitative score
of 47 with the corresponding rating of fair. Due to the low gradient and lack of riffles
within the County Highway K station, the bend-to-bend ratio provides a better estimate of
the actual fish habitat rating. The lowest scoring components of the habitat assessment
are the percent of fine sediments in the substrate and the stability of the banks within one
meter of the river. Seventy-nine percent of the substrate in the Branch River was
comprised of fine sediment, including sand, silt, clay, and detritus which gives this
station a rating of poor. The large amount of fine sediment throughout this station is
detrimental to spawning sites, available shelter, and potentially the food supply for fish.
Bank stability within one meter of the river also received a low score on the fish habitat
assessment. Of the 78.7 ft (24 m) that were surveyed 72.5 ft (22.1 m) (92%) were
substantially eroded, giving the bank stability component of the station a rating of fair.
This station also has some components of the fish habitat assessment that indicate good
fish habitat. The width-to-depth ratio was calculated to have a rating of good. This
indicates that the stream was relatively deep and narrow throughout the County Highway
K station. The pool area throughout the station also was given the rating of good. The
total length of the County Highway K station was found to be 951 ft (290 m), in which
pool habitat made up 666 ft (203 m) (70.1%). This indicated that pool habitats were
overabundant throughout the station, providing less diversity in habitats. Fish cover was
prevalent throughout the station, yielding a rating of good. Of the 221.5 ft (67.5 m) of

Bettering the Branch – University of Wisconsin-Stevens Point - December 2004 77
river transects that were surveyed, 26.6 ft (8.1 m) of fish cover were measured. Primary
sources of fish cover were woody debris, boulders, overhanging vegetation, and undercut
banks. The riparian buffer width was greater than 32.8 ft (10 m) on both sides of the
Branch River throughout the County Highway K station, which yields a rating of
excellent. The land cover in the riparian zone was primarily woodland, shrubs, and
meadow.
Table 9. Score summary of the habitat ratings for the County Highway K station. Habitat Item Calculated Value Score RatingRiparian Buffer Width 10.0 m 15 ExcellentWidth:Depth Ratio 10.9 10 GoodBank Erosion 0.92 m 5 FairFine Sediments 78.9% 0 PoorCover for Fish 11.9% 10 GoodPool Area 70% 7 GoodBend:Bend Ratio 6.6 m 15 ExcellentRiffle:Riffle Ratio 0 m 0 Poor
62 Good47 Fair
Total (using Bend:Bend)Total (using Riffle:Riffle)
County Highway K Macroinvertebrate Assessment
Macroinvertebrate samples were collected in the Branch River at the County Highway K
station on October 18, 2003. The sampling location was approximately 16.4 ft (5 m)
from the County Highway K Bridge, which is located in northern Manitowoc County.
Two sampling intervals were necessary to collect a representative number of
macroinvertebrates. These sampling sites were located close to each other. The first
sampling interval was collected in a section of river with well shaded overhanging
vegetation. The substrate at this site was primarily silt and clay. The second sampling
interval was collected in the shade-free rip-rap upstream from the bridge. The substrate
at this site was comprised of silt covered boulders. The total sampling time lasted four
minutes (2- two minute intervals) using the kick sampling method with a D-net. The
water at this site was stained slightly brown, with a temperature of 10.2°C, and flowed at
a velocity of 1.6 ft/sec (0.5 m/sec). The river at the sample sites was 28.9 ft (8.8 m) wide
and had an average depth of 0.5 m. The biotic indices scores from the County Highway
K station macroinvertebrate samples ranged from 6.57 to 7.51, with a water quality rating
of poor. Based on the water quality rating, the Branch River had very substantial to very
significant organic pollution at the County Highway K station. As a result, the County

Bettering the Branch – University of Wisconsin-Stevens Point - December 2004 78
Highway K station may be subject to low oxygen conditions which inhibit oxygen
intolerant macroinvertebrates.
Taus Road Station
The Taus Road station was located on the Branch River in northwestern Manitowoc
County. Taus Road runs east-west and crosses the Branch River just west of its
intersection with Menchalville Road. This station was located approximately 5.5 km
downstream from the County Highway K station. The downstream end of the station was
located approximately 59.1 ft (18 m) upstream from the Taus Road Bridge over the
Branch River. The overall length of the Taus Road station was 1138 ft (347 m) and had a
mean stream width of 38.4 ft (11.7 m). There was a farm located approximately 98.4 ft
(30 m) east of the Branch River within the Taus Road station. There were also two
houses located on the west side of the river, but neither of them could be seen from the
river. The water throughout the Taus Road station was clear with a temperature of
12.5°C. The dissolved oxygen concentration in the water was 9.16 mg/L, yielding 88.9%
dissolved oxygen saturation. The pH of the river in the Taus Road station was at 8.06.
The river habitat throughout this station had a lot of diversity with riffles, runs, and pools.
The river channel appeared to be natural and contained several large bends. The
substrate of the Branch River was primarily made up of gravel and sand, with some areas
of cobble or silt. No aquatic plants were observed. The banks of the Branch River
showed substantial signs of erosion throughout the station. The dominant riparian land
cover throughout the Taus Road station was woodland, but meadow and shrubland were
also present. The riparian buffer widths extended beyond 10 m on each side of the river
almost throughout the station. The woodland in the riparian zone provided exceptional
shading for the river in the Taus Road station.
Taus Road Habitat Assessment
The habitat assessment of the Taus Road station was conducted on August 20, 2003. The
mean stream width of the Branch River was 38.4 ft (11.7 m) throughout this station, so
the Fish Habitat Rating (FHR) method for rivers greater than 32.8 ft (10 m) wide was
used to compute the quanitative ratings. Utilizing the bend-to-bend ratio for assessing
fish habitat the Taus Road station had a quantitative score of 57, a fair rating (Table 10).
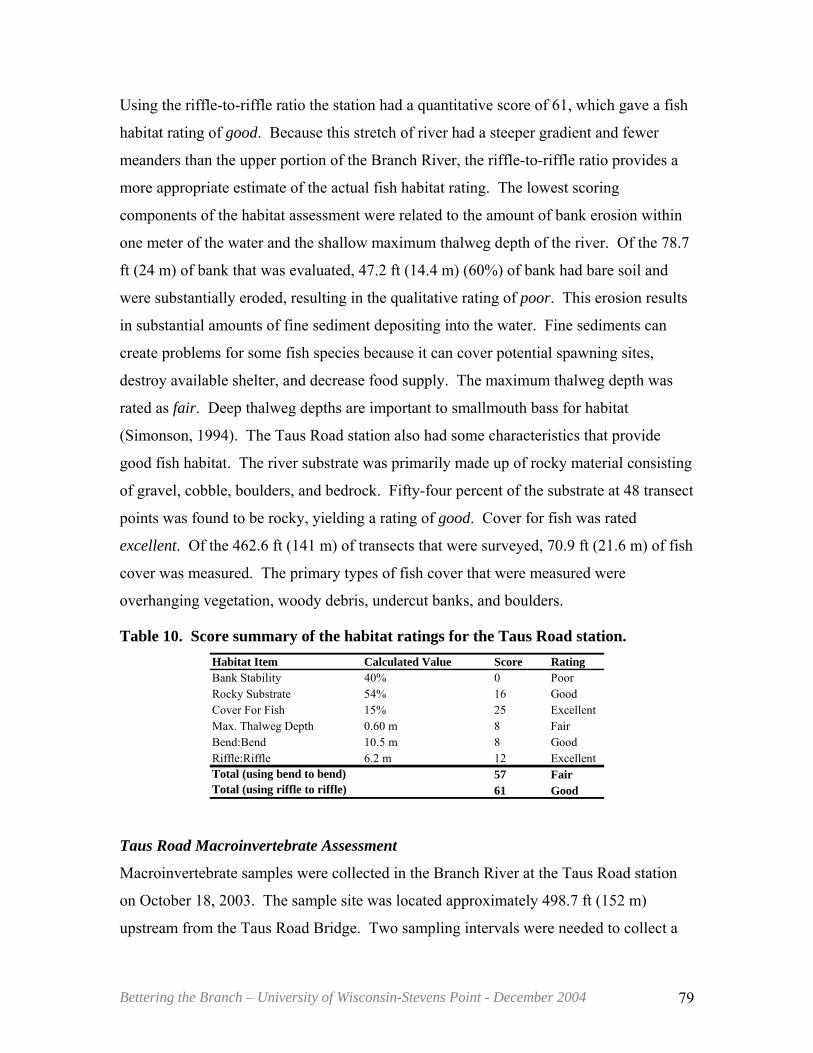
Bettering the Branch – University of Wisconsin-Stevens Point - December 2004 79
Using the riffle-to-riffle ratio the station had a quantitative score of 61, which gave a fish
habitat rating of good. Because this stretch of river had a steeper gradient and fewer
meanders than the upper portion of the Branch River, the riffle-to-riffle ratio provides a
more appropriate estimate of the actual fish habitat rating. The lowest scoring
components of the habitat assessment were related to the amount of bank erosion within
one meter of the water and the shallow maximum thalweg depth of the river. Of the 78.7
ft (24 m) of bank that was evaluated, 47.2 ft (14.4 m) (60%) of bank had bare soil and
were substantially eroded, resulting in the qualitative rating of poor. This erosion results
in substantial amounts of fine sediment depositing into the water. Fine sediments can
create problems for some fish species because it can cover potential spawning sites,
destroy available shelter, and decrease food supply. The maximum thalweg depth was
rated as fair. Deep thalweg depths are important to smallmouth bass for habitat
(Simonson, 1994). The Taus Road station also had some characteristics that provide
good fish habitat. The river substrate was primarily made up of rocky material consisting
of gravel, cobble, boulders, and bedrock. Fifty-four percent of the substrate at 48 transect
points was found to be rocky, yielding a rating of good. Cover for fish was rated
excellent. Of the 462.6 ft (141 m) of transects that were surveyed, 70.9 ft (21.6 m) of fish
cover was measured. The primary types of fish cover that were measured were
overhanging vegetation, woody debris, undercut banks, and boulders.
Table 10. Score summary of the habitat ratings for the Taus Road station. Habitat Item Calculated Value Score RatingBank Stability 40% 0 PoorRocky Substrate 54% 16 GoodCover For Fish 15% 25 ExcellentMax. Thalweg Depth 0.60 m 8 FairBend:Bend 10.5 m 8 GoodRiffle:Riffle 6.2 m 12 Excellent
57 Fair61 Good
Total (using bend to bend)Total (using riffle to riffle)
Taus Road Macroinvertebrate Assessment
Macroinvertebrate samples were collected in the Branch River at the Taus Road station
on October 18, 2003. The sample site was located approximately 498.7 ft (152 m)
upstream from the Taus Road Bridge. Two sampling intervals were needed to collect a

Bettering the Branch – University of Wisconsin-Stevens Point - December 2004 80
representative number of macroinvertebrates. Both sampling intervals were collected in
well shaded riffles. The total sample time lasted for six minutes (two intervals of three
minutes) using the kick sampling method with a D-net. The water at this site was slightly
stained brown, with a temperature of 10.3°C, and flowed at a velocity of 1.4 ft/sec (0.43
m/sec). The river at this site was 33.5 ft (10.2 m) wide with an average depth of 1 ft (0.3
m). The substrate was very similar for both sampling intervals, which was primarily
gravel and cobble. The biotic indices ranged from 4.9 to 5.04 with a water quality that
ranged from fair to good. According to the water quality rating, the Branch River has
fairly substantial to some existing organic pollution at the Taus Road station.
County Highway J Station
The County Highway J station was located in the northern part of Manitowoc County.
County Highway J runs north-south and crosses the Branch River approximately 2165.3
ft (660 m) north of Sunny Slope Road. This station was located approximately 3.4 km
downstream from the Taus Road station. The downstream end of the station was
approximately 154.2 ft (47 m) upstream from the County Highway J Bridge. The County
Highway J station had an overall length of 918 ft (280 m) and a mean stream width of 44
ft (13.4 m). There was one house located approximately 118.1 ft (36 m) from the Branch
River within the County Highway J station. The water throughout the station was turbid,
had a temperature of 21.8°C, and a pH of 7.94. The dissolved oxygen concentration in
the water was 6.02 mg/L, 67.2% saturation. The physical characteristics of the Branch
River and the riparian edges were similar throughout the entire station. The river habitat
types were diverse and included riffles, runs, and pools. The substrate in the County
Highway J station was primarily made up of gravel and sand; however, it was largely
dependent upon the different river habitats. Pools contained more sand and silt and
riffles had gravel and cobble. The downstream end of the County Highway J station
accommodated a lot of pondweed (potomogetan sp.) aquatic plants. The north side of the
station had a very steep hill with more erosion than the south side of the station. The
riparian zone on the north side of the station was dominated by woodland and extended
more than 32.8 ft (10 m) from the river. The riparian zone on the south side of the station
was primarily meadow with some pockets of woodland. Beyond the meadow grasses

Bettering the Branch – University of Wisconsin-Stevens Point - December 2004 81
growing near the river, the remainder of the southern side of the station was cropland that
came as close as 26.2 ft (8 m) from the water within the station. The woodland in the
riparian zone provided some shade for the Branch River, but much of the river was not
shaded.
County Highway J Habitat Assessment
The habitat assessment of the County Highway J station was conducted on August 20,
2003. The mean stream width of the Branch River was 44 ft (13.4 m) throughout this
station, so the Fish Habitat Rating (FHR) method for evaluating rivers greater than 32.8 ft
(10 m) was used to compute the ratings. Utilizing the bend-to-bend ratio and the riffle-
to-riffle ratio the County Highway J station was given an overall quantitative score of 48,
an overall station rating of fair (Table 11). The lowest scoring components of the fish
assessment were the maximum thalweg depth and the amount of bank erosion within one
meter of the river. The maximum thalweg depth was 1.3 ft (0.4 m), a rating of poor.
This rating was based on an optimum depth of 4.9 ft (1.5 m), which is considered an
important component of smallmouth bass habitat (Simonson, 1994). Bank stability was
another component of the fish habitat assessment that could be improved. Of the 7.87 ft
(24 m) of bank that was measured, 35.8 ft (10.9 m) (45.4%) of bank was bare soil and
substantially eroded, giving a rating of fair. This erosion was depositing substantial
amounts of fine sediment to the water. The County Highway J station also had some
habitat characteristics that are beneficial to fish. Fifty-five percent of the Branch River
substrate throughout this station was rocky, a rating of good. Rocky substrate was
generally comprised of gravel, cobble, boulders, and bedrock. The dominant substrate
material throughout the County Highway J Station was gravel and cobble. Course rocky
substrate is important for many species of fish because it offers spawning sites and
suitable habitat. Cover for fish was abundant and received a good rating. Of the 528.2 ft
(161 m) of river transect that were measured, 53.5 ft (16.3 m) offered cover for fish
which is also a good rating. The dominant types of fish cover at the County Highway J
station were boulders, overhanging vegetation, submerged and emergent aquatic plants,
woody debris, and undercut banks.

Bettering the Branch – University of Wisconsin-Stevens Point - December 2004 82
Table 11. Score summary of the habitat ratings for the County Highway J station.
Habitat Item Calculated Value Score RatingBank Stability 55% 4 FairRocky Substrate 55% 16 GoodCover For Fish 10% 16 GoodMax. Thalweg Depth 0.43 m 0 PoorBend:Bend 7.6 m 12 ExcellentRiffle:Riffle 8.6 m 12 Excellent
48 Fair48 Fair
Total (using bend to bend)Total (using riffle to riffle)
County Highway J Macroinvertebrate Assessment
Macrinvertebrate samples were collected from the Branch River at the County Highway J
station on October 18, 2003. The sample location was approximately 600 ft (183 m)
upstream from the County Highway J bridge. Two sampling intervals were conducted to
obtain a representative number of macroinvertebrates. Both sampling intervals were
collected in macrophyte beds that had little to no shade cover. The total sample time
lasted four minutes (two intervals of two minutes) using the kick sampling method with a
D-net. The water at this site was very slightly stained brown, with a temperature of
11.5°C, and flowed at a velocity of 1.4 ft/sec (0.43 m/sec). The river at this site was 59.7
ft (18.2 m) wide with an average depth of .66 ft (0.2 m). The substrate in the river was
similar for both sampling sites, primarily gravel and sand with small influences from
cobble and silt. Both of the sampling sites were completely covered with aquatic plants.
The biotic indices ranged from 5.32 to 5.70 with a water quality range from fair to good.
According to the water quality rating, the Branch River had fairly substantial to some
existing organic pollution at the County Highway J station.
Sunny Slope Road Station – Hempton Lake Tributary
The Sunny Slope Road station was located in the north central part of Manitowoc County.
Sunny Slope Road runs east-west and the bridge over the tributary was located
approximately 1280 ft (390 m) west of its intersection with County Highway J. The
Sunny Slope Road station was located on a tributary that drains Hempton Lake and
discharges into the Branch River. Hempton Lake is a small 10 acre woodland-edged lake
located just northwest of the Village of Whitelaw. The confluence of the tributary from
Hempton Lake and the Branch River was approximately 951 ft (290 m) downstream from

Bettering the Branch – University of Wisconsin-Stevens Point - December 2004 83
the County Highway J station. The Sunny Slope Road station was located approximately
3215 ft (980 m) upstream from its confluence with the Branch River. The station length
was 97 m with the downstream end located approximately 19.7 ft (6 m) from the Sunny
Slope Road Bridge. The mean stream width for the station was 7.2 ft (2.2 m). The water
throughout the station was clear, with a temperature of 27.5°C and a pH of 8.18. The
dissolved oxygen concentration in the water was 9.34 mg/L, 114.4% dissolved oxygen
saturation. The Sunny Slope Road station was primarily runs, but pools were also present.
The tributary was shallow and narrow with many meanders. The substrate of the
tributary throughout the station was largely dominated by silt, with some sand and clay.
Aquatic plants were prevalent throughout this station. Pondweed (potomogetan sp.),
Coontail (ceratophyllum demersum), duckweed (lemna sp.), and water weed (elodea sp.)
were all identified throughout this station. The banks of the tributary were well vegetated
with a variety of grasses without any substantial signs of erosion. Land cover on both
sides of the tributary was primarily meadow, with some small scattered shrubs. There
was a riparian buffer on both sides of the stream that extended well beyond 32.8 ft (10 m).
Beyond the riparian buffer was cropland that paralleled the tributary. The grasses in the
riparian buffer offered little to no shade for this tributary of the Branch River.
Sunny Slope Road Habitat Assessment
The habitat assessment of the Sunny Slope Road station was conducted on August 14,
2003. The mean stream width of this tributary draining Hempton Lake and discharging
into the Branch River was 7.2 ft (2.2 m) throughout the station. The Fish Habitat Rating
(FHR) for rivers less than 10 m was used to compute the ratings. Utilizing the bend-to-
bend ratio the Sunny Slope Road station received an overall quantitative score of 48, a
rating of fair (Table 12). With the riffle-to-riffle method the overall quantitative score
was 38, which also had a rating of fair. Due to the low gradient and high degree of
meandering associated with the tributary, the bend-to-bend ratio provided a more
appropriate estimate of the actual fish habitat rating. The lowest scoring components of
the habitat assessment were the percentage of fine sediments in the substrate, the amount
of cover for fish, and the amount of pool area within the Sunny Slope Road station. Fine
sediment comprised 90% of the substrate throughout the station, a rating of poor. The
fine sediment fraction of the substrate was sand, silt, clay, and detritus with silt making

Bettering the Branch – University of Wisconsin-Stevens Point - December 2004 84
up the largest portion of the substrate in the Sunny Slope Road station. Fish cover also
received a qualitative rating of poor. To provide effective fish cover the depth of water
must be at least 0.66 ft (0.2 m). This particular tributary was very shallow and only
reached a depth of 0.2 m or deeper twice within the entire station. Of the 87.3 ft (26.6 m)
of stream that was evaluated, only 1.6 ft (0.5 m) of fish cover was measured in water with
sufficient depth to provide good fish habitat. The total amount of pool habitat was
lacking from the Sunny Slope Tributary station. Of the 318 ft (97 m) of stream that were
assessed, only 32.8 ft (10 m) or 10% was pool habitat, yielding a qualitative rating of fair.
Pools are important to provide shelter or resting areas for fishes, particularly predators
and other large fish (Simonson, 1994). As a result of being a very small stream, this
tributary of the Branch River was generally too small to supply sufficient habitat for
larger fish; however, the Sunny Slope Road station had some characteristics related to
fish habitat. The width to depth ratio received a rating of good. Bank stability also
received the qualitative rating of good. Bank stability was measured by the amount of
bare soil within one meter of the stream. Of the 78.7 ft (24 m) of bank that were
surveyed, 29.5 ft (9.0 m) of shoreline showed signs of substantial erosion. The riparian
buffer widths associated with the Sunny Slope Road station were rated as excellent. All
of the riparian buffers extend beyond 32.8 ft (10 m) on both sides of the stream. The
general land cover throughout this area was meadow and the riparian vegetation consisted
primarily of grasses and a few smaller shrubs.
Table 12. Score summary of the habitat ratings for the Sunny Slope Road station. Habitat Item Calculated Value Score RatingRiparian Buffer Width 10.0 m 15 ExcellentWidth:Depth Ratio 15.1 10 GoodBank Erosion 0.38 m 10 GoodFine Sediments 90.1% 0 PoorCover for Fish 1.9% 0 PoorPool Area 10% 3 FairBend:Bend Ratio 12.3 m 10 GoodRiffle:Riffle Ratio 0 m 0 Poor
48 Fair38 Fair
Total (using Bend:Bend)Total (using Riffle:Riffle)

Bettering the Branch – University of Wisconsin-Stevens Point - December 2004 85
Sunny Slope Road Macroinvertebrate Assessment
Macroinvertebrate samples were collected in the Hempton Lake tributary at the Sunny
Slope Road station on October 18, 2003. The sampling location was approximately 6.6 ft
(2 m) upstream from the Sunny Slope Road Bridge. Two sampling intervals were
necessary to collect a representative number of macroinvertebrates. The first sample site
was located in an aquatic plant bed that had very little shade cover. The substrate at this
site was 100% silt. The second sample site was located in the rip-rap along the culvert
that goes below Sunny Slope Road. The substrate at this site was primarily silt and large
cobble. The total sample time lasted for four minutes (two intervals of two minutes)
using the kick sampling method with a D-net. The water at this site was clear, with a
temperature of 12.8°C and flowed at a velocity of 0.13 ft/sec (0.04 m/sec). The river at
this site was 8.9 ft (2.7 m) wide with an average depth of 0.66 ft (0.2 m). The biotic
indices ranged from 7.14 to 8.11; the water quality rating associated with those scores
was poor. Macroinvetebrate sampling was conducted in 1993 and the tributary was rated
fairly poor (Gansberg, 1995). According to the water quality rating, the Hempton Lake
tributary to the Branch River has very substantial to very significant organic pollution at
the Sunny Slope Road station which can result in periods of low dissolved oxygen
concentrations.
West Hillcrest Road Station
The West Hillcrest Road station was located in north-central Manitowoc County. West
Hillcrest Road runs east-west and the bridge over the Branch River was located
approximately 2887 ft (880 m) from its intersection with Decker Road. This station was
located approximately 3.7 km downstream from the County Highway J station and 3.4
km from the confluence of the Hempton Lake tributary. The downstream end of the
station was approximately 114.8 ft (35 m) upstream from the West Hillcrest Road Bridge.
The overall length of this station was 1115 ft (340 m) with mean stream width of 40.7 ft
(12.4 m). Within the West Hillcrest Road station there was one house located
approximately 98.4 ft (30 m) east of the Branch River with a mowed lawn that came
within seven meters of the water’s edge. The water throughout the station was stained a

Bettering the Branch – University of Wisconsin-Stevens Point - December 2004 86
coffee color, with a temperature of 21.5°C and a pH of 8.03. The dissolved oxygen
concentrations in the water were 6.86 mg/L, 80.6% saturation. The Branch River was
generally shallow and wide throughout this station with a diverse habitat structure,
including riffles, runs, and pools. The substrate throughout the station was generally
rocky, with cobble being the most abundant sediment size. Boulders and gravel were
also very abundant throughout the station. Small amounts of sand and silt were present in
the pools within the station. No aquatic plants were observed while conducting the
habitat assessment. The banks of the Branch River throughout the West Hillcrest Road
station had substantial erosion. The topography on the east side of the river was a very
steep hill containing many boulders. The west side of the river was almost flat and
generally had much less relief. Woodland dominated the riparian zone on both sides of
the river, but there were also areas of meadow and shrub land. The riparian buffer
extended well beyond 32.8 ft (10 m) throughout the entire station, with the exception of
the one house on the east side of the river. Beyond the large wooded buffer, the
dominant land use in the area was agricultural cropland. The wooded riparian zone
throughout the West Hillcrest Road provided good shade cover to the Branch River.
West Hillcrest Road Habitat Assessment
The habitat assessment in the West Hillcrest Road station was conducted on August 19,
2003. The mean stream width of the Branch River in this station was 40.7 ft (12.4 m), so
the Fish Habitat Rating (FHR) method for rivers greater than 32.8 ft (10 m) wide was
used to compute the ratings. Utilizing the bend-to-bend ratio for assessing the fish
habitat, the West Hillcrest Road station was found to have a total quantitative score of 50
giving it an overall rating of fair (Table 13). With the riffle-to-riffle method the station
was found to have a total quantitative score of 62 and an overall qualitative rating of good.
Due to the steeper gradient and fewer meanders than the upper portion of the Branch
River, the riffle-to-riffle ratio provides a better estimate of the actual fish habitat rating
for this stretch of river. The lowest scoring attributes of the habitat assessment were the
degree of bank stability within one meter of the water and the maximum thalweg depth.
Of the 24 total m of bank surveyed, 50.5 ft (15.4 m) were bare and subject to substantial
erosion, a poor rating. Only 36% of the surveyed banks within one meter of the water
were protected from erosion. Maximum thalweg depth also was given the poor rating for

Bettering the Branch – University of Wisconsin-Stevens Point - December 2004 87
fish habitat due to a maximum thalweg depth of 1.3 ft (0.4 m). The optimum maximum
thalweg depth is at least 4.9 ft (1.5 m) for smallmouth bass habitat. The degree of rocky
substrate and the total amount of cover for fish both provide beneficial fish habitat in this
station. Rocky substrate was generally comprised of gravel, cobble, boulders, and
bedrock. The rocky substrate made up 89% of the 48 transect points in the West Hillcrest
Road station, giving a rating of excellent. Rocky substrate provides fish with spawning
sites, food, and shelter. Cover for fish was very abundant throughout this station. Of the
486 ft (148 m) of surveyed river, 115.8 ft (35.3 m) of fish cover was measured, yielding a
rating of excellent. The dominant types of fish cover in the West Hillcrest Road station
was boulders, overhanging vegetation, and woody debris.
Table 13. Score summary of the habitat ratings for the West Hillcrest Road (center) station.
Habitat Item Calculated Value Score RatingBank Stability 36% 0 Poor Rocky Substrate 89% 25 ExcellentCover For Fish 24% 25 ExcellentMax. Thalweg Depth 0.44 m 0 Poor Bend:Bend 0 m 0 Poor Riffle:Riffle 2.5 m 12 Excellent
50 Fair62 Good
Total (using bend to bend)Total (using riffle to riffle)
West Hillcrest Road Macroinvertebrate Assessment
Macroinvertebrate samples were collected in the Branch River at the West Hillcrest Road
station on October 18, 2003. The sampling location was approximately 19.7 ft (6 m)
upstream from the West Hillcrest Road Bridge. The macroinvertebrate sample was
collected in a partly shaded riffle. The ample time was three minutes using the kick
sampling method with a D-net. The water at this site was very slightly stained brown,
with a temperature of 10.0°C and flowed at a velocity of 1.2 ft/sec (0.37 m/sec). The
river at the sample site was 31.8 ft (9.7 m) wide with an average depth of 1 ft (0.3 m).
The substrate of the Branch River at the site was primarily comprised of gravel, cobble,
and boulders. Both biotic indices were 4.27 with a water quality rating from good to very
good. A past sampling done by the WDNR in 1993 also showed the water quality to rate
good, based on the macroinvertebrates collected at this site (Gansberg, 1995). According

Bettering the Branch – University of Wisconsin-Stevens Point - December 2004 88
to this water quality rating, the Branch River has the slight possibility to some probable
organic pollution at the West Hillcrest Road station.
County Highway T Station
The County Highway T station was located on the Branch River in the north-central part
of Manitowoc County. County Highway T runs north-south and crosses the Branch
River approximately 623 ft (190 m) north of West Reifs Mills Road. The downstream
end of the County Highway T station was approximately 98.4 ft (30 m) upstream from
the County Highway T Bridge crossing the Branch River. This station was located
approximately 5.3 km downstream from the West Hillcrest Road station. The overall
length of the County Highway T station was 968 ft (295 m), with a mean stream width of
45 ft (13.7 m). There were three houses along the south side of the Branch River
throughout this station. All of the houses were set back between 98.4 and 164 ft (30 and
50 m) from the river. There was one house within the station on the north side of the
river and it was located approximately 328 ft (100 m) from the river. The water
throughout the station was slightly stained brown, had a temperature of 24.2°C and a pH
of 8.33. The river was generally shallow and wide throughout the station with natural
channel conditions. The river still had some meanders, but not to the same extent as the
upper watershed. The habitat types found within the County Highway T station were
riffles, runs, and pools. Overall the station was primarily made up of rocky material
gravel size and bigger, the substrate in the Branch River changed with the different river
habitats. The substrate of the riffles and runs contained gravel, cobble, and boulders.
The pools contained finer materials, including sand, silt, and detritus. No aquatic plants
were observed within this station. The banks of the Branch River throughout this station
were primarily bare soil, lacking vegetative protection. The dominant riparian land cover
within this station was woodland, meadow, and shrub land. The riparian buffer width
extended beyond 32.8 ft (10 m) on both sides of the river. The Branch River received
some shading from the woodland riparian buffer, but the meadow and shrub land offered
little to no shade.

Bettering the Branch – University of Wisconsin-Stevens Point - December 2004 89
County Highway T Habitat Assessment
The habitat assessment of the County Highway T station was conducted August 14, 2003.
The mean stream width of the Branch River was 45 ft (13.7 m) within this station, so the
Fish Habitat Rating (FHR) method for rivers greater than 10 m wide was used to compute
the ratings. Both the bend-to-bend ratio and the riffle-to-riffle ratio for assessing the fish
habitat at the County Highway T station had the same score of 44 (Table 14). Both the
bend-to-bend ratio and the riffle-to-riffle ratio components of the assessment were rated
as fair. The lowest scoring attributes of the habitat assessment were the degree of bank
stability within one meter of the river and the maximum thalweg depth throughout the
station. Bank stability was given the qualitative rating of poor, due to extent of erosion
taking place on the stream banks within one meter of the water. Of the 78.7 ft (24 m) of
stream bank that were surveyed, 52.2 ft (15.9 m) showed evidence of substantial erosion.
Only 34% of the banks in the survey had vegetation or ground cover that offered
protection against erosion. The other component of the habitat assessment that was given
the qualitative rating of poor was the maximum thalweg throughout the station. The
County Highway T station had a maximum thalweg depth of 1.3 ft (0.4 m). An optimal
thalweg based on smallmouth bass habitat is a depth of 4.9 ft (1.5 m) or greater. The
remaining components of the habitat assessment, percent of rocky substrate and cover for
fish, received good qualitative ratings based on their quality of physical fish habitat.
Rocky substrate made up 61.6% of the river bottom. The dominant substrate material
throughout this station was gravel, followed by cobble, sand, and boulders. Cover for
fish was found to be prevalent throughout the County Highway T station. Of the 541 ft
(165 m) that were surveyed 51.8 ft (15.8 m) offered shelter for fish. The dominant type
of fish cover found in this station was overhanging vegetation, followed by woody debris,
boulders, and undercut banks.

Bettering the Branch – University of Wisconsin-Stevens Point - December 2004 90
Table 14. Score summary of the habitat ratings for the County Highway T station. Habitat Item Calculated Value Score RatingBank Stability 34% 0 Poor Rocky Substrate 62% 16 GoodCover For Fish 10% 16 GoodMax. Thalweg Depth 0.42 m 0 Poor Bend:Bend 6.0 m 12 ExcellentRiffle:Riffle 1.7 m 12 Excellent
44 Fair44 Fair
Total (using bend to bend)Total (using riffle to riffle)
County Highway T Macroinvertebrate Assessment
Macroinvertebrate samples were collected in the Branch River at the County Highway T
station on October 18, 2003. The sampling location was below the County Highway T
Bridge. The macroinvertebrate sample was collected from a completely shaded riffle.
The sample time was three minutes using the kick sampling method with a D-net. The
water at this site was very slightly stained brown, with a temperature of 9.4°C and flowed
at a velocity of 1.9 ft/sec (0.58 m/sec). The river at the sample site was 28.9 ft (8.8 m)
wide with an average depth of 0.66 ft (0.2 m). The substrate in the Branch River at the
sample site was primarily gravel and cobble. The biotic indices ranged from 3.53 to 4.05
which gives a water quality rating of very good. According to the water quality rating,
the Branch River has a slight possibility of organic pollution at the County Highway T
station.
Village Drive Station
The Village Drive station was located on the Branch River in the central part of
Manitowoc County. The section of Village Drive that crosses the Branch River runs
east-west which is parallel to US Highway 10. It is located in the Village of Branch. The
Village of Branch is a small community that is located approximately 4 km east of
Whitelaw on US Highway 10. The bridge over the Branch River was approximately
1542 ft (470 m) east of the intersection of Village Drive and US Highway 10. The
downstream end of the Village Drive station was located approximately 98.4 ft (30 m)
from the bridge over the river. This station was approximately 6.8 km downstream from
the County Highway T station. The length of the Village Drive station was 1955 ft (596
m) with a mean stream width of 52.2 ft (15.9 m). The south side of the Village Drive

Bettering the Branch – University of Wisconsin-Stevens Point - December 2004 91
station had houses and businesses adjacent to the river. The north side of this station was
relatively undeveloped. The water throughout the station was slightly stained brown, had
a temperature of 20.9°C and a pH of 8.02. The dissolved oxygen concentration in the
water was 6.73 mg/L, with 73.6% dissolved oxygen saturation. The downstream end of
the Village Drive station was deep and narrow. As the station progressed upstream the
river became slightly more shallow and wide. The downstream end of the station used to
be the location of a dam on the Branch River that formed a millpond. The dam is now
gone and the river has taken a natural pathway, but the evidence of the millpond still
exists. There was a lot of diversity in river habitats at this location, with a large number
of riffles, runs, and pools. Overall the station was primarily made up of rocky material
gravel size and bigger; however, the substrate in the Branch River throughout the Village
Drive station depended upon the river habitat within the station. The substrate of the
riffles and runs was gravel, cobble, and boulders. The pools had finer materials,
including sand, silt, and detritus. No aquatic plants were observed while conducting the
transects for the habitat assessment. The majority of the riverbanks in the Village Drive
station showed obvious signs of erosion and were lacking protective vegetative cover.
The dominant riparian land cover throughout this station was woodland, meadow, and
shrub land. The south-west bank of the station was wooded and had a steep hill along the
bank of the river. The north-east bank was the plain that had previously been a millpond,
so it was low and vegetated by lowland shrubs and grasses. The riparian buffer width
exceeded 32.8 ft (10 m) at all of the transects except one. The land use beyond the
riparian zone was primarily residential and agricultural cropland. The Branch River
receives some shading from the woodland riparian buffer, but the meadow and shrub land
offer little to no shade.
Village Drive Habitat Assessment
The habitat assessment to the Village Drive station was conducted on August 18, 2003.
The mean stream width of the Branch River throughout this station was 51.8 ft (15.8 m),
so the Fish Habitat Rating (FHR) for rivers greater than 32.8 ft (10 m) wide was used to
determine ratings. Utilizing the bend-to-bend ratio for assessing the overall fish habitat,
the Village Drive station received the quantitative score of 62. With the riffle-to-riffle
ratio the station received the overall quantitative score of 70. Both scores correspond
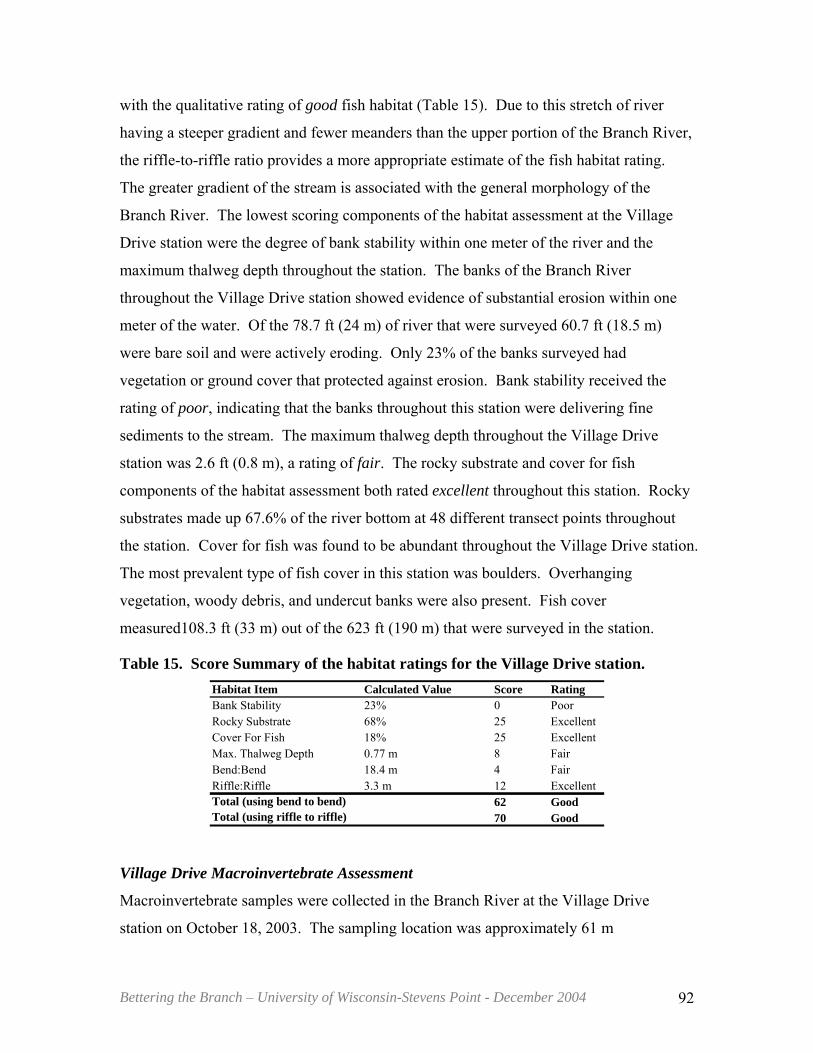
Bettering the Branch – University of Wisconsin-Stevens Point - December 2004 92
with the qualitative rating of good fish habitat (Table 15). Due to this stretch of river
having a steeper gradient and fewer meanders than the upper portion of the Branch River,
the riffle-to-riffle ratio provides a more appropriate estimate of the fish habitat rating.
The greater gradient of the stream is associated with the general morphology of the
Branch River. The lowest scoring components of the habitat assessment at the Village
Drive station were the degree of bank stability within one meter of the river and the
maximum thalweg depth throughout the station. The banks of the Branch River
throughout the Village Drive station showed evidence of substantial erosion within one
meter of the water. Of the 78.7 ft (24 m) of river that were surveyed 60.7 ft (18.5 m)
were bare soil and were actively eroding. Only 23% of the banks surveyed had
vegetation or ground cover that protected against erosion. Bank stability received the
rating of poor, indicating that the banks throughout this station were delivering fine
sediments to the stream. The maximum thalweg depth throughout the Village Drive
station was 2.6 ft (0.8 m), a rating of fair. The rocky substrate and cover for fish
components of the habitat assessment both rated excellent throughout this station. Rocky
substrates made up 67.6% of the river bottom at 48 different transect points throughout
the station. Cover for fish was found to be abundant throughout the Village Drive station.
The most prevalent type of fish cover in this station was boulders. Overhanging
vegetation, woody debris, and undercut banks were also present. Fish cover
measured108.3 ft (33 m) out of the 623 ft (190 m) that were surveyed in the station.
Table 15. Score Summary of the habitat ratings for the Village Drive station. Habitat Item Calculated Value Score RatingBank Stability 23% 0 Poor Rocky Substrate 68% 25 ExcellentCover For Fish 18% 25 ExcellentMax. Thalweg Depth 0.77 m 8 FairBend:Bend 18.4 m 4 FairRiffle:Riffle 3.3 m 12 Excellent
62 Good70 Good
Total (using bend to bend)Total (using riffle to riffle)
Village Drive Macroinvertebrate Assessment
Macroinvertebrate samples were collected in the Branch River at the Village Drive
station on October 18, 2003. The sampling location was approximately 61 m

Bettering the Branch – University of Wisconsin-Stevens Point - December 2004 93
downstream from the Village Drive Bridge. Two sampling sites were used to collect a
representative number of macroinvertebrates. Both sampling intervals were collected in
partially shaded riffle. The total sample time lasted for six minutes (two intervals of three
minutes) using the kick sampling method with a D-net. The water at this site was very
slightly stained brown, had a temperature of 8.4°C, and flowed at a velocity of 1.7 ft/sec
(0.52 m/sec). The river at this site was 17.4 m wide with an average depth of 0.2 m. The
substrate was very similar for both sampling intervals, which was primarily gravel,
cobble, and boulders. The biotic indices ranged from 4.18 to 4.36 resulting in a water
quality rating from good to very good. According to the water quality rating, the Branch
River has a slight possibility to probably some existing organic pollution at the Village
Drive station.
North Union Road Station
The North Union Road station was located on the Branch River in the central part of
Manitowoc County. The section of North Union Road that crosses the Branch River runs
east-west and was located approximately 1.1 km south of US Highway 10 in the Village
of Branch. The North Union Road station was the farthest downstream station in the
baseline monitoring study. It was situated approximately 1.3 km downstream from the
Village Drive station and approximately 1.5 km upstream from the confluence of the
Branch River and the Manitowoc River. The downstream end of the station was located
approximately 65 m upstream from the North Union Road Bridge. The station continued
upstream from this point for 487 m and had a mean stream width of 13.8 m. There was a
golf course along the entire west side of the station and crosses the river near the
upstream portion of the station. There were also three houses and a cemetery located
near the river within the North Union Road station. The water throughout the station was
slightly stained brown, had a temperature of 22.2°C and a pH of 8.05. This station had a
very diverse range of river habitats, including riffles, runs, and pools. Overall the station
was primarily made up of rocky material gravel size and bigger; however, the substrate in
the Branch River throughout the North Union Road station depended partly upon the
river habitats within the station. The substrate of the riffles and runs contained gravel,
cobble, and boulders. The pools had some finer materials including sand, silt, and

Bettering the Branch – University of Wisconsin-Stevens Point - December 2004 94
detritus. No aquatic plants were observed except a small area of filamentous algae
(periphyton). The riverbanks of the station were predominantly unprotected and erosion
was evident. The dominant riparian land cover in this station was woodland, followed by
meadow and shrub land. The riparian buffer width extended beyond 10 m on both sides
of the river at each of the 12 transects. Beyond the riparian buffer the land uses were
primarily golf course, residential, and woodland. The Branch River received some
shading from the woodland riparian buffer, but the meadow and shrub land offer little to
no shade.
North Union Road Habitat Assessment
The habitat assessment to the North Union Road station was conducted on August 15,
2003. The mean stream width of the branch River throughout this station was 13.8 m, so
the Fish Habitat Rating method for rivers greater than 10 m was used to compute the
ratings. Utilizing the bend-to-bend and riffle-to-riffle ratio, the North Union Road station
was found to have the same overall score of 61 which were rated as excellent indicating
that the Branch River has diverse habitats with deep corners and riffles throughout this
station. The corresponding fish habitat rating associated with that score was good (Table
16). The lowest scoring components of the habitat assessment were the degree of bank
stability within one meter of the river and the maximum thalweg depth throughout the
station. Bank stability was given the qualitative rating of poor, due to extent of erosion
taking place on the stream banks within one meter of the water. Of the 24 m of stream
bank that were surveyed, 20.4 m showed evidence of substantial erosion. Only 15% of
the banks in the survey had vegetation or ground cover that offered protection from
erosion. Maximum thalweg depth throughout the station was given the rating of fair due
to a maximum thalweg depth of 0.4 m. This station had some components of the habitat
assessment that were beneficial to fish. Cover for fish received the rating of good. Of
the 166.0 m of river that were surveyed, 16.5 m of fish cover was measured. The primary
type of fish cover within this station was overhanging vegetation, followed by boulders,
woody debris, and undercut banks. Rocky substrate was abundant throughout this station,
and it received the rating excellent. Rocky substrate comprised 78.1% of the river bottom
throughout the station. The most common rocky substrate that was found was cobble,
followed by gravel and boulders.

Bettering the Branch – University of Wisconsin-Stevens Point - December 2004 95
Table 16. Score summary of the habitat ratings for the North Union Road station. Habitat Item Calculated Value Score RatingBank Stability 15% 0 Poor Rocky Substrate 78% 25 ExcellentCover For Fish 9% 16 GoodMax. Thalweg Depth 0.66 m 8 FairBend:Bend 2.5 m 12 ExcellentRiffle:Riffle 3.7 m 12 Excellent
61 Good61 Good
Total (using bend to bend)Total (using riffle to riffle)
North Union Road Macroinvertebrate Assessement
Macroinvertebrate samples were collected in the Branch River at the North Union Road
station on October 18, 2003. The sampling location was approximately 65 m upstream
from the North Union Road Bridge. Two sampling intervals were needed to collect a
representative number of macroinvertebrates. Both sampling intervals were collected in a
partially shaded riffle. The sample time lasted for six minutes (two intervals of three
minutes) using the kick sampling method with a D-net. The water at this site was very
slightly stained brown, had a temperature of 8.3°C, and flowed at a velocity that was less
than 2ft/sec (0.61 m/sec). At this site the river was 14.3 m wide with an average depth of
0.3 m. The substrate was very similar for both sampling intervals, which was primarily
gravel, cobble, and boulders. The two biotic indices were both 4.41 which is a water
quality rating of good to very good. This corresponds with the previous rating of very
good that was given to a nearby site on Branch River Road by in a sampling event by the
WDNR in 1993 (Gansberg, 1995). According to the water quality rating, the Branch
River has a slight possibility to probably some existing organic pollution at the Village
Drive station.
Electrofishing Results
(Contibuted by Steve Holger, Fishery Biologist, Wisconsin DNR) North Union Road The 488 meter survey section upstream of North Union Road was electroshocked in a
single upstream pass in 52 minutes. During electroshocking, 791 individuals representing
16 species were captured (Table 17). Common shiner dominated the catch, with
substantially fewer hornyhead chub and smallmouth bass captured. Of the catch, four

Bettering the Branch – University of Wisconsin-Stevens Point - December 2004 96
species are classified as intolerant to organic pollution and twelve as tolerant species.
Most, (84%) of the collected species were insectivores. The IBI score at this site was 70,
which is indicative of an excellent fishery.
Table 17. Species collected during electroshocking at North Union Road on the Branch River, August, 2003.
Species Number
Largescale Stoneroller 4
Hornyhead Chub 122
Common Shiner 447
Rosyface Shiner 38
Sand Shiner 21
Fathead Minnow 2
Bluntnose Minnow 2
Blacknose Dace 18
Longnose Dace 9
Northern Creek Chub 4
White Sucker 36
Stonecat 3
Rock Bass 20
Green Sunfish 1
Smallmouth Bass 43
Johnny Darter 21
Total 791
The captured smallmouth ranged in length from 49 mm to 240 mm and had an average
length of 68 mm. Most of the captured smallmouth bass were young-of-year, but several
other age fish were also captured (Figure 37). Rock bass from this location ranged in
length from 50 mm to 225 mm with an average length of 162 mm.

Bettering the Branch – University of Wisconsin-Stevens Point - December 2004 97
0
2
4
6
8
10
12
14
16
18
Num
ber
40 60 80 100 120 140 160 180 200 220 240
Length (mm)
Smallmouth Bass Length Frequency
Figure 37. Smallmouth bass length frequency from the North Union Road sample location on the Branch River.
Village Drive
The 596 meter survey section upstream of Village Drive was electroshocked in a single
upstream pass in 54 minutes. Several large pools were not shocked because of their water
depth. During electroshocking, 564 individuals representing 19 species were captured
(Table 18). Common shiner dominated the catch, with substantially fewer other species
captured. Of the catch, five species are classified as intolerant to organic pollution and
twelve as tolerant species. Most of the collected species were insectivores. The IBI score
at this site was 75, which is indicative of an excellent fishery. The stocked steelhead were
not used to calculate the IBI score for this location.
The captured smallmouth bass ranged in length from 45 mm to 261 mm and had an
average length of 95 mm. Similar to North Union Road, several age classes of
smallmouth were captured during the survey above Village Drive (Figure 38). Also
captured at this location was one northern pike (470 mm), a left maxillary fin clipped
steelhead (196 mm) and three adult steelhead that were not measured, but were likely
adult skamania strain steelhead.

Bettering the Branch – University of Wisconsin-Stevens Point - December 2004 98
Table 18. Species collected during electroshocking at Village Drive on the Branch River, August, 2003.
Species Number
Central Mudminnow 2
Northern Pike 1
Largescale Stoneroller 3
Common Carp 2
Hornyhead Chub 31
Common Shiner 359
Rosyface Shiner 34
Bluntnose Minnow 2
Fathead Minnow 1
Blacknose Dace 5
Northern Creek Chub 6
White Sucker 77
Greater Redhorse 2
Black Bullhead 1
Stonecat 3
Rock Bass 2
Smallmouth Bass 26
Johnny Darter 21
Blackside Darter 6
Total 564

Bettering the Branch – University of Wisconsin-Stevens Point - December 2004 99
0
1
2
3
4
5
6
7
8
Num
ber
40 60 80 100 120 140 160 180 200 220 240 260
Length (mm)
Smallmouth Bass Length Frequency
Figure 38. Smallmouth bass length frequency from Village Drive on the Branch River.
Highway T
The 295 meter survey section upstream of Highway T was electroshocked in a single
upstream pass in 29 minutes. During electroshocking, 645 individuals representing 12
species were captured (Table 19). Common shiner and hornyhead chub dominated the
catch, with substantially fewer white sucker and other species captured. Of the catch,
three species are classified as intolerant to organic pollution and nine as tolerant species.
Most of the collected species were insectivores. The IBI score at this site was 55, which
is indicative of a good fishery.
The captured smallmouth bass ranged in length from 57 mm to 104 mm and had an
average length of 69 mm (Figure 39). We also captured five largemouth bass with an
average length of 86 mm. Several young-of-year northern pike were observed but not
captured.

Bettering the Branch – University of Wisconsin-Stevens Point - December 2004 100
Table 19. Species collected during electroshocking at Highway T on the Branch River, August, 2003.
Species Number
Largescale Stoneroller 5
Hornyhead Chub 226
Common Shiner 256
Rosyface Shiner 38
Sand Shiner 1
Blacknose Dace 14
Northern Creek Chub 22
Stonecat 1
Smallmouth Bass 16
Largemouth Bass 5
Johnny Darter 18
Total 645
0
1
2
3
4
5
6
Num
ber
40 50 60 70 80 90 100 110 120 130 140 150
Length (mm)
Bass Length Frequency
Smallmouth Bass Largemouth Bass
Figure 39. Smallmouth and largemouth bass length frequency from Highway T on the Branch River.
Discussion
The IBI scores from the three sections of river sampled indicate that the lower section of
the Branch River has good to excellent fisheries. The species mixture is what would be

Bettering the Branch – University of Wisconsin-Stevens Point - December 2004 101
expected from a warm water river in the east-central part of Wisconsin, with forage
species dominating the fish community. The benthic insect community is an important
food source to the fishery, as most of the captured fish were insectivores. The IBI also
indicates that despite the good to excellent rating for the fishery, many of the collected
species were tolerant to organic pollution, which could be an indication that non-point
source pollution has influenced the make-up of the fish community.
Smallmouth bass were the most common gamefish captured which is likely due to the
type of available habitat found in this section of river as well as the apparent good water
quality. The extensive runs that were surveyed also appear to provide excellent spawning
habitat for smallmouth bass as evidenced by the number of young- of-year bass that were
collected.
Because few adult smallmouth bass were observed, it is likely that pool habitat which is
used by adult bass during summer and winter is limited in the surveyed sections of the
Branch River.
The rocky habitat and higher flows of this section of river does not favor northern pike,
but one large adult and several young-of-year were observed, indicating use of the area
by northern pike. It is likely, if upstream sites that had more wetlands and slower flow
had been sampled, more northern pike would have been collected.
The capture of adult skamania steelhead above Village Drive indicates continued use of
the Branch River by migrating Lake Michigan trout and salmon that are stocked in the
Manitowoc/Branch River system.
Rock bass were the dominant panfish captured in the survey. Areas that had deeper runs
or pool habitat were likely locations in which the rock bass were collected.

Bettering the Branch – University of Wisconsin-Stevens Point - December 2004 102
CRAYFISH CONSUMPTION
Annually the abundant crayfish in The Branch River are harvested and consumed by
local citizens. Two sites in the Branch River were sampled for crayfish August 2004 for
analysis of mercury at UWSP and PCBs at the State Lab of Hygiene. A number of
crayfish from each site were composited and abdominal tissue was analyzed. Mercury
concentrations in the crayfish collected at the Zipperer site were 0.04 mg/kg and 0.10 for
other portions of the Branch River. The DNR health consumption advisory for mercury
is 0.05 mg/kg. No PCBs were identified in either sample.
Bettering the Branch – University of Wisconsin-Stevens Point - December 2004 103
CONCLUSIONS/RECOMMENDATIONS
• High nitrate concentrations were measured in springs, river water during baseflow, and historically in private wells.
o Private well samples should routinely be analyzed for nitrate and if indicated, pesticides. Best management plans (nutrient management plans) should be followed to reduce inputs of nitrogen to groundwater. The variations in stream flow, spring network, and water quality all suggest water movement in the Branch River system is influenced by karst (cave) features. Groundwater recharge that occurs through thin soils or through sinkholes has little opportunity for nitrogen or phosphorus removal and can transfer excessive nutrients downstream.
o Housing developments should be designed to reduce the potential impacts to groundwater quality from septic systems in areas with sandy soil and shallow depth to groundwater.
o Residential and commercial fertilizer use should also be based on plant needs and consideration of possible downstream impacts owing to groundwater and surface water contamination. Consider reducing/eliminating the use of lawn and garden fertilizer.
o The groundwater-shed for the Branch River should be determined.
• Suspended solids and total phosphorus are entering the Branch River system during snowmelt and runoff events.
o Water should be retained on land for as long as possible. This can be accomplished by the restoration or remediation of wetlands, retention ponds, and water gardens and upland conservation practices.
o Reduce the amount of mowed vegetation near shore. o Near shore practices should include: buffers, winter cover crops, and
incorporation of manure into the soil.
• Little long-term water quality, biotic, and streamflow data exist for the Branch River to evaluate long-term trends.
o Continue collecting baseflow samples for water quality analysis during low flow in summer and winter.
o Continue macroinvertebrate sampling follow WAV and/or WDNR protocol.
o Consider measuring streamflow continuously at one site in the river using a device like a pressure trandsducer. (preferably near where the previous USGS gauging station was located)
• Many agricultural fields are located in the floodplain and are underwater during
high flow, particularly in the spring. Although inundation of the floodplain slows water movement and reduces downstream peakflows, when cultivated, these fields lose soil, nutrients, and residual pesticides to the river. These sites were identified as “LCD sites” in the erosion survey.
o Fields should have vegetative cover for as much of the year as possible.

Bettering the Branch – University of Wisconsin-Stevens Point - December 2004 104
• Hay or alfalfa provide year round vegetation • Winter cover crops would help to retain soil in spring
o Manure should not be spread on these fields in the fall. o A significant vegetative buffer of grasses and forbs could help to filter
sediments and nutrients. o Use of near shore berms to retain, infiltrate and filter water. o Conservation easements and land purchases may be used to compensate
producers for loss of income due to change in practices. • Most baseline monitoring stations had some limiting attributes that could be
enhanced for improved fishery habitat. The matrix below indicates the summary for key attributes by station. In most cases fish cover and rocky substrate were sufficient. Bank stability and depth of thalweg were the most common limiting attributes throughout the watershed. Fine sediments were excessive in the upper part of the watershed.
Baseline Monitoring Site Ri
paria
n Bu
ffer W
idth
Bank
St
abili
ty
Fish
Cov
er
Pool
Are
a
Wid
th:D
epth
Ra
tio
Thal
weg
Dept
h
Fine
Se
dim
ents
Rock
y Su
bsta
te
Waymore Park P G F GHill Rd E G P P F PWayside Rd G G E G P PMan Cal Rd E F E F G PCounty Hwy K E F G G G PTaus Rd P E F GCounty Hwy J F G P GSunny Slope Rd (Tributary) E G P F G PWest Hillcrest Rd P E P ECounty Hwy T P G P GVillage Dr P E F ENorth Union Rd P G F EE=Excellent G=Good F=Fair P=Poor
• Streamflow is flashy in the mid section of the Branch River. This will increase
erosion and may limit the longevity of fish habitat improvements. Many of the actions that help to slow the water flow to the river during a runoff event will also help to later release the water to the river during low flow periods.
o Continue to remediate wetlands (particularly in the headwaters). o Allow for natural meanders in the stream and remediate areas that have
been straightened. o When possible, allow for the river to spill over its banks during high
flow, but if possible retain/develop land cover in those areas that slows water movement and reduces sediment loss.
o Shoreland vegetation should include a mixture of forbs, shrubs, and trees to slow movement of water to the river.

Bettering the Branch – University of Wisconsin-Stevens Point - December 2004 105
• Aquatic plants play many roles in an aquatic ecosystem. They are habitat and food for aquatic biota, tie up available nutrients, reduce erosion of bottom sediments, and add oxygen to the system. Many reaches of the Branch River are devoid of aquatic plants. This may be due to invasive rusty crayfish, in-stream herbicides, and/or lack of pools/backwaters in some reaches of the Branch River. Rusty crayfish clip aquatic vegetation to feed on the microbial life that lives on it. As they are abundant in much of the Branch River, they may be responsible for the lack of aquatic plants.
• Crayfish tissue contained mercury concentrations that were above the advisory
levels. No PCBs were detected in the crayfish tissue.

Bettering the Branch – University of Wisconsin-Stevens Point - December 2004 106
LITERATURE CITED Dimick, Jeffery J. Macroinvertebrate Sample Preservation Guidelines. Aquatic
Entomology Lab, University of Wisconsin Stevens Point. Environmental Protection Agency. January 2003. National Priorities List: Lemberger
Landfill, Incorporated. EPA ID# WID980901243 http://www.epa.gov/R5Super/npl/wisconsin/WID980901243.htm
Environmental Protection Agency. January 2003. National Priorities List: Lemberger Transport and Recycling. EPA ID# WID056247208 http://www.epa.gov/R5Super/npl/wisconsin/WID056247208.htm
Franson, Mary Ann (Editor). 1995. Standard Methods for the Examination of Water and Wastewater. 19 ed.
Gansberg, 1995. Branch River Priority Watershed Surface Water Resource Appraisal Report. Wisconsin Department of Natural Resources.
Hey, RD. “River Mechanics.” Institution of Water Engineers and Scientists, Journal Vol. 40, No. 2, p 139-158, April 1986. 10 fig, 1 tab, 44 ref.
Hole, Francis D. 1976. Soils of Wisconsin. The University of Wisconsin Press. Kammerer, 1981 Ground-Water Quality Atlas of Wisconsin, USGS Information Circular
39. Lillie, R.D., S.W. Szcytko, and M.A. Miller. 2003. Macroinvertebrate; Data
Interpretation and Guidance Manual. Wisconsin Department of Natural Resources. Madison, WI
Manitowoc County Land and Water Conservation Dept. 1999. Manitowoc County Land and Water Resource Management Plan.
Marsh-McBirney, Inc. Flo-Mate Model 2000 Personal Flowmeter Instruction Manual. December 1990.
Michaud, Joy P. 1994. A Citizen’s Guide to Understanding and Monitoring Lakes and Streams. Washington State Department of Ecology: Water Quality Program. www.ecy.wa.gov/programs/wq/plants/management/joysmanual/turbidity.html
North Carolina State Water Quality Group (NCSWQG). 2002. Water Quality and Land Treatment Education Component. Watershedss: A Decision Support System for Non-Point Source Pollution. 21 January 2002. http://h2osparc.wq.ncsu.edu/info/index.html.
Newton, B. J., Jarrell, W. M., et.al. 1999. A Procedure to Estimate the Response of Aquatic Systems to Changes in Phosphorus and Nitrogen Inputs. USDA: National Water and Climate Center.
Oregon State University. 1996. "Pestcide Information Profiles - Atrazine." Extoxnet. June 1996. http://ace.orst.edu/cgi-bin/mfs/01/pips/atrazine.htm.
Shaw, Byron, C. Mechenich, and L. Klessig. 1996. Understanding Lake Data. University of WI Extension, pub G3582.
Shankman, D; Pugh, TB. “Discharge response to channelization of a coastal plain stream.” Wetland, vol. 12, no. 3, pp. 157-162, 1992.
Schoof, R. “Environmental Impact of Channel Modification.” Water Resources Bulletin Vol 16, No 4, p 697-701, August, 1980. 21 Ref.
Simonson, T.D., J. Lyons, and P.D. Kanehl. 1994. Guidelines for Evaluating Fish Habitat in Wisconsin Streams. U.S. Department of Agriculture, Forest Service,

Bettering the Branch – University of Wisconsin-Stevens Point - December 2004 107
North Central Forest Experimental Station, General Technical Report NC-164. St. Paul, Minnesota.
USEPA. 2001. Consumer Fact Sheet on Atrazine. EPA - Groundwater and Drinking water. 12 March 2001. http://www.epa.gov/safewater/dwh/c-soc/atrazine.html
USEPA. 2002. Ambient Water Quality Criteria Rivers and Streams in Ecoregion VII. EPA 822-B-01-015.
WDNR. 2000. State of the Lakeshore Basin. PUB WT 667 2000 WDNR. 2000. Guidelines for Collecting Macroinvertebrate Samples from Wadable
Streams. Bureau of Fisheries Management and Habitat Protection. Monitoring and Data Assessment Section. Madison, Wisconsin.
WDNR. 2002. Guidelines for Evaluating Habitat of Wadable Streams. Modified from Simonson et al. 1994. Guidelines for Evaluating Fish Habitat in Wisconsin Streams. U.S. Department of Agriculture, Forest Service, General Technical Report NC-164. Madison, Wisconsin.
WDNR. 1996. Nonpoint Source Control Plan for the Branch River Priority Watershed Project. PUBs-WR-449-96

Bettering the Branch – University of Wisconsin-Stevens Point - December 2004 108
APPENDICES