Embed Size (px)
Citation preview

Better Plants Challenge
U.S. Department of Energy May 2015
Martin L. Adams, P.E. Senior Assistant General Manager – Water System
Los Angeles Department of Water and Power
Barriers and Solutions to Energy Efficiency and Renewable Energy in the Water Facilities

Our Water System infrastructure: Service Area (473 sq. miles) About 697,100 water service
accounts About 7,260 miles of distribution
mains 114 local tanks / reservoirs 9 LAA reservoirs 88 pump stations 421 regulator stations 23 chlorination stations 7 fluoridation stations 60,400 fire hydrants Advanced water treatment facility
uses ozone as disinfectant
Water System Overview
2
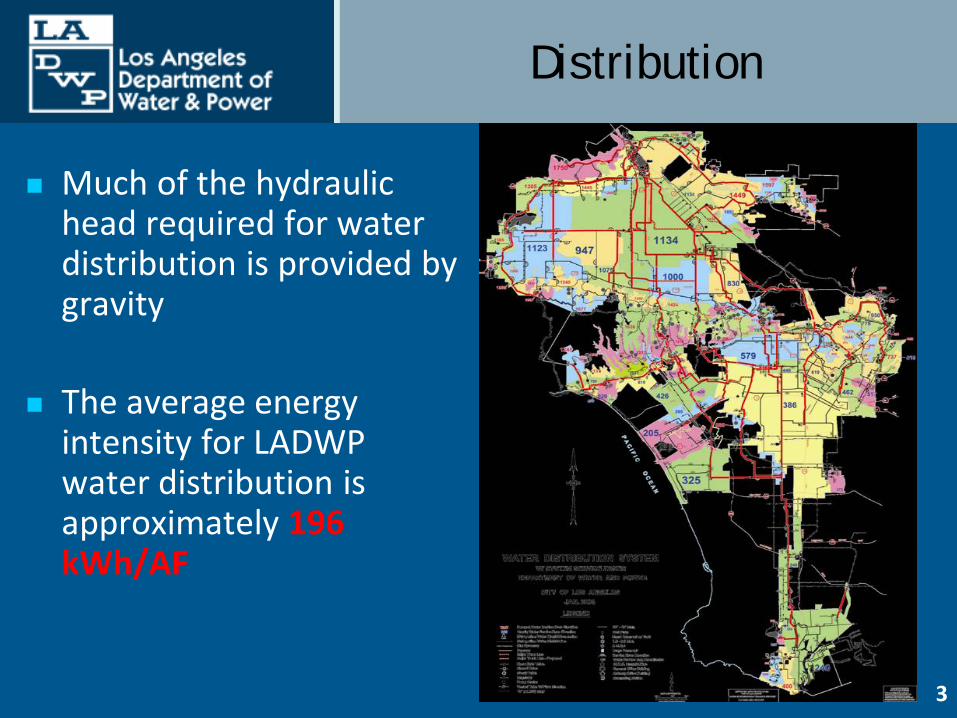
Distribution
3
Much of the hydraulic head required for water distribution is provided by gravity
The average energy
intensity for LADWP water distribution is approximately 196 kWh/AF
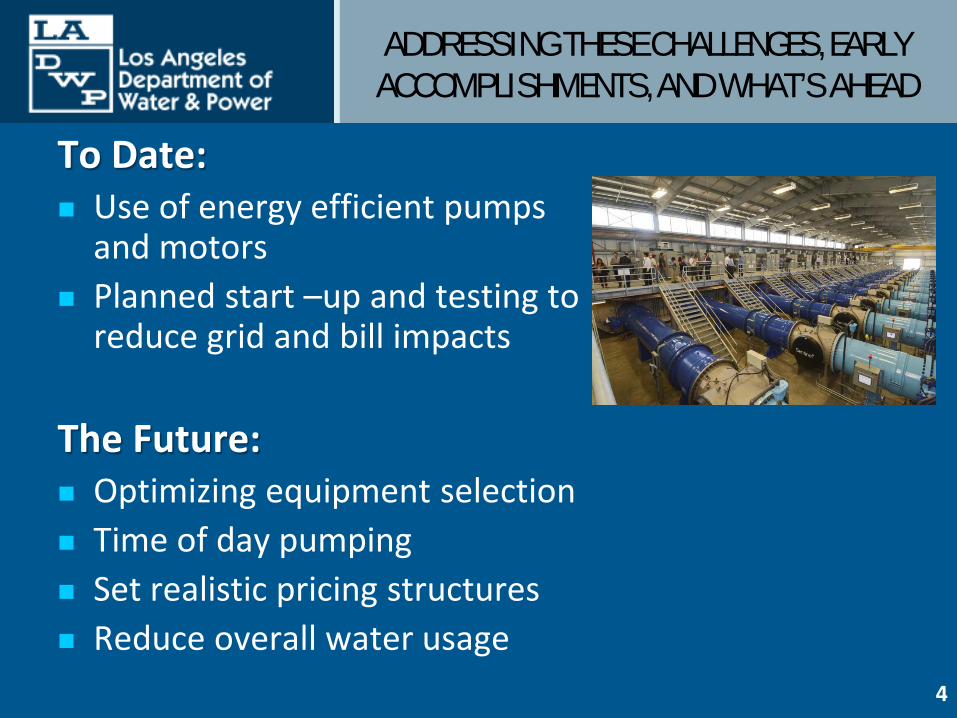
ADDRESSING THESE CHALLENGES, EARLY ACCOMPLISHMENTS, AND WHAT’S AHEAD
To Date: Use of energy efficient pumps
and motors Planned start –up and testing to
reduce grid and bill impacts
The Future: Optimizing equipment selection Time of day pumping Set realistic pricing structures Reduce overall water usage
4
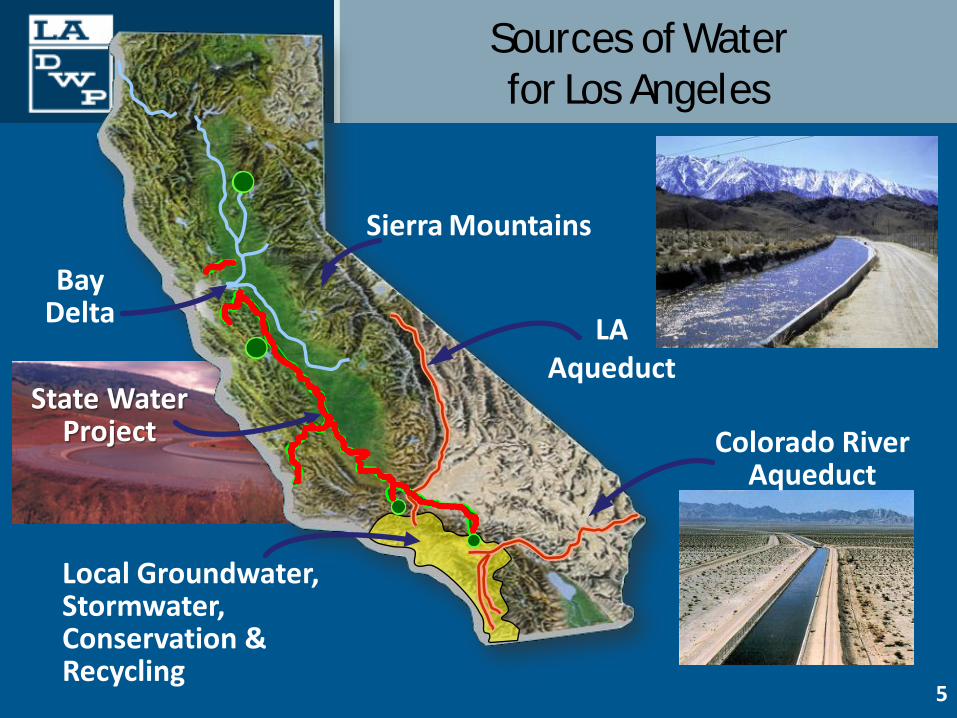
Sources of Water for Los Angeles
Bay Delta LA
Aqueduct
Colorado River Aqueduct
State Water Project
Sierra Mountains
Local Groundwater, Stormwater, Conservation & Recycling
5
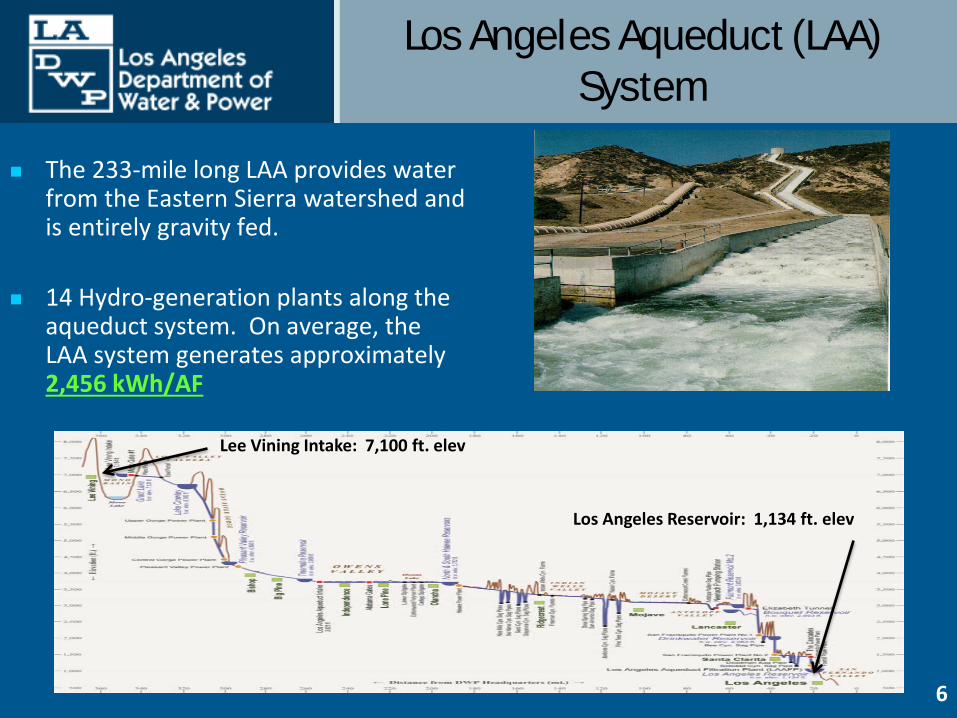
Los Angeles Aqueduct (LAA) System
6
The 233-mile long LAA provides water from the Eastern Sierra watershed and is entirely gravity fed.
14 Hydro-generation plants along the
aqueduct system. On average, the LAA system generates approximately 2,456 kWh/AF
Lee Vining Intake: 7,100 ft. elev
Los Angeles Reservoir: 1,134 ft. elev

State Water Project (SWP)
7
Water supplies are conveyed along the 444-mile California Aqueduct
Energy intensity of the West Branch is 2,614 kWh/AF
Energy intensity of the East Branch is 3,263 KWh/AF
Highest Single Pump Lift: 1,926 ft.
1,500 ft. elev.

Colorado River Aqueduct (CRA)
8
Water supplies are conveyed along the 242-mile CRA Aqueduct
CRA Energy Intensity is 2,027 kWh/AF
Net Pump Lift: 1,617 ft; Highest Single Lift 441 ft. at Hinds PP.
Colorado River, 450 ft. elev. Lake Matthews, 1,390 ft. elev.
0
200,000
400,000
600,000
800,000
1,000,000
1,200,000
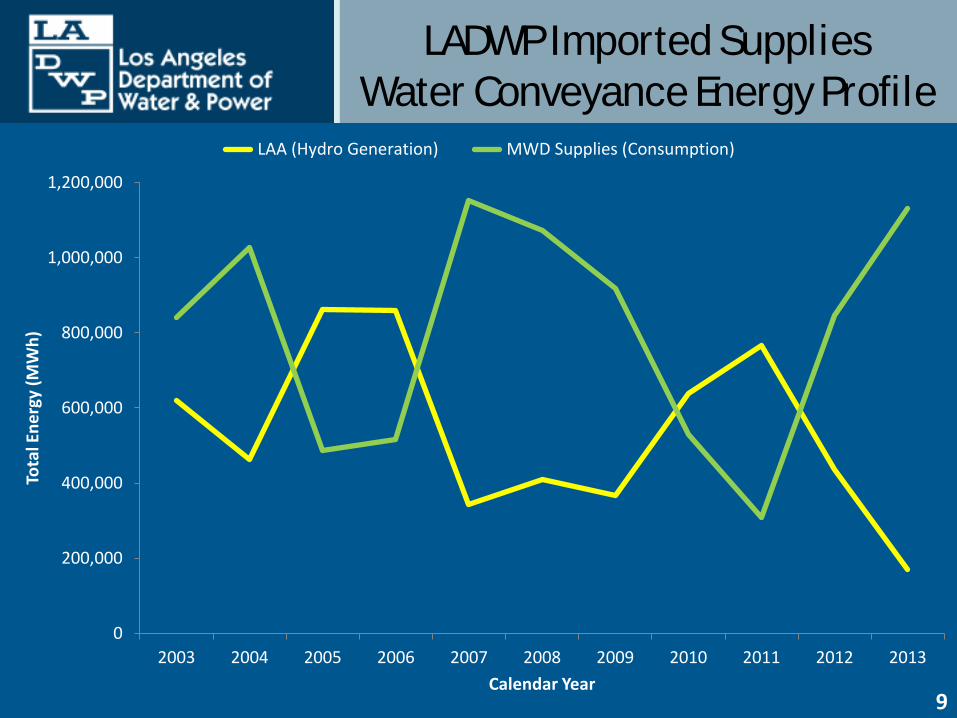
2003 2004 2005 2006 2007 2008 2009 2010 2011 2012 2013
Tota
l Ene
rgy
(MW
h)
Calendar Year
LAA (Hydro Generation) MWD Supplies (Consumption)
LADWP Imported Supplies Water Conveyance Energy Profile
9
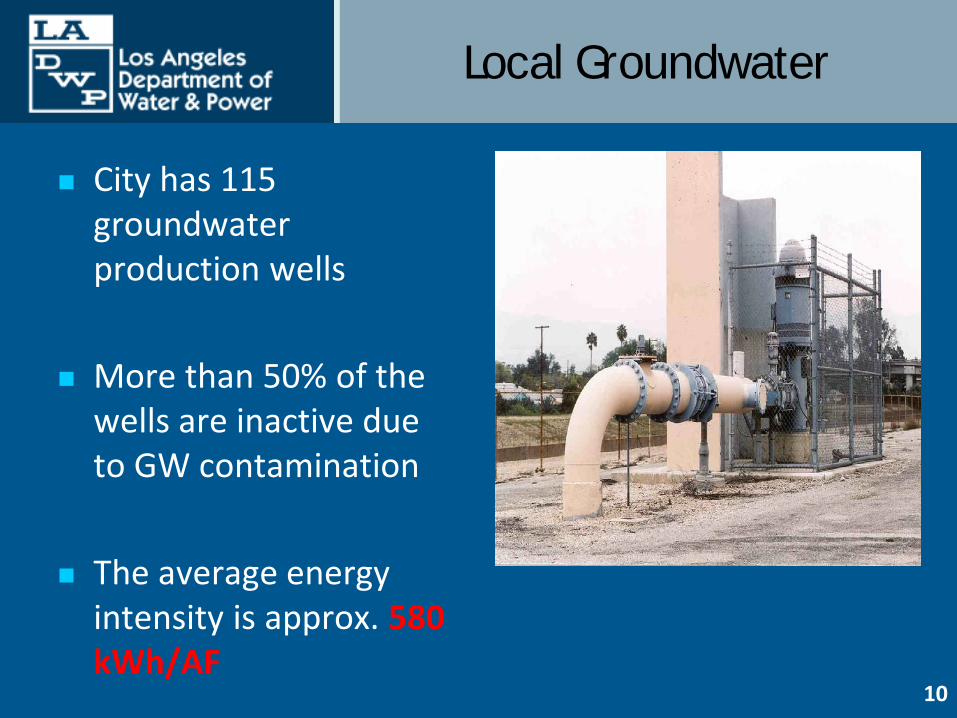
Local Groundwater
10
City has 115 groundwater production wells
More than 50% of the
wells are inactive due to GW contamination
The average energy intensity is approx. 580 kWh/AF
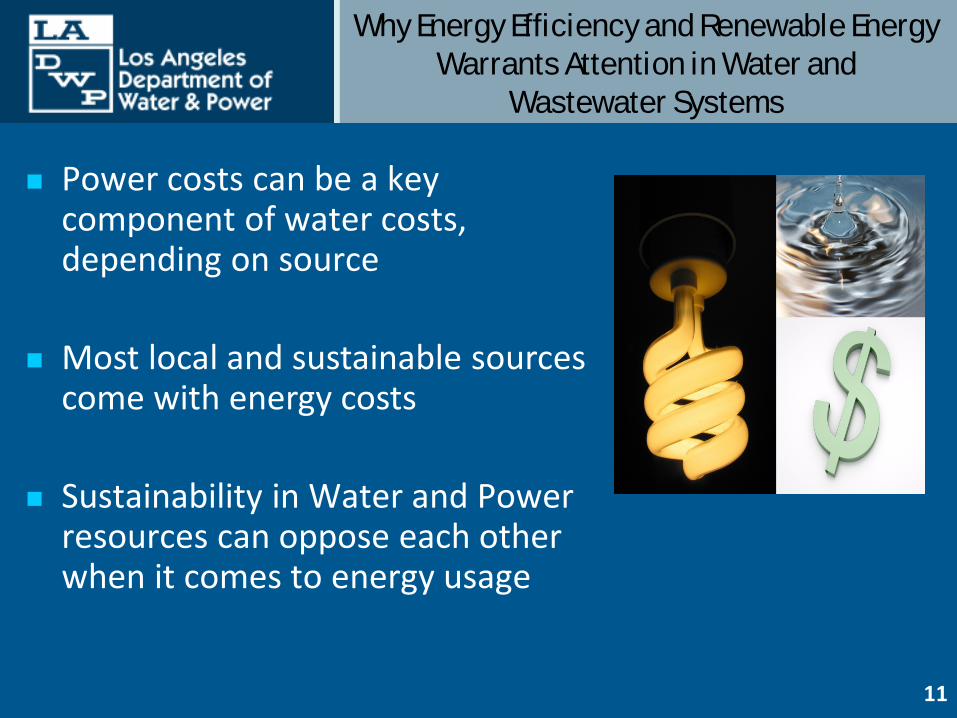
Why Energy Efficiency and Renewable Energy Warrants Attention in Water and
Wastewater Systems
Power costs can be a key component of water costs, depending on source
Most local and sustainable sources
come with energy costs
Sustainability in Water and Power resources can oppose each other when it comes to energy usage
11
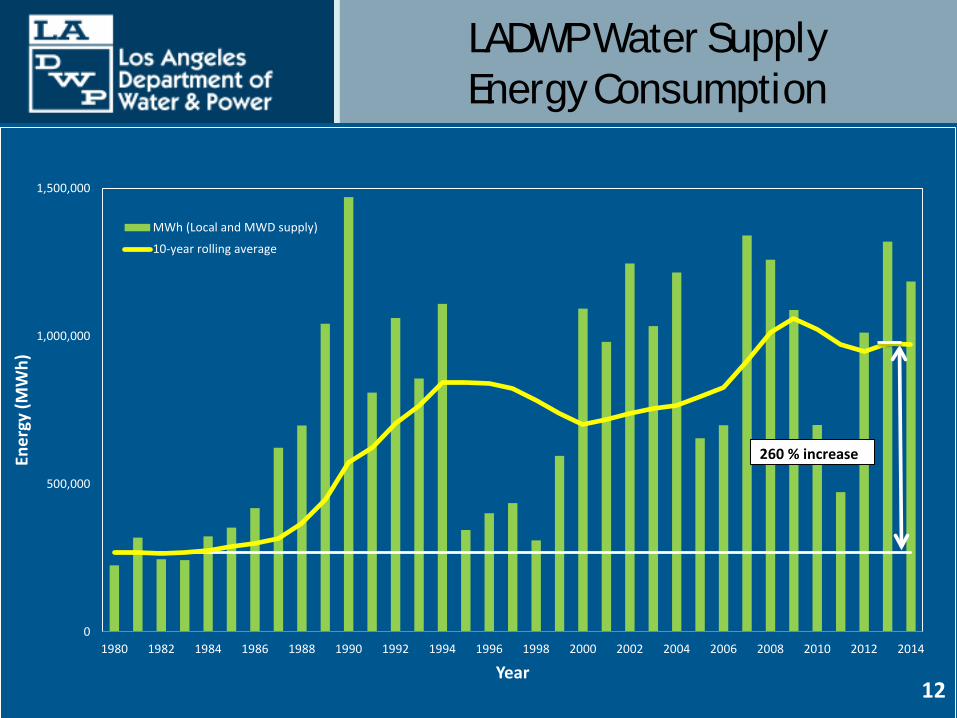
LADWP Water Supply Energy Consumption
12
0
500,000
1,000,000
1,500,000
1980 1982 1984 1986 1988 1990 1992 1994 1996 1998 2000 2002 2004 2006 2008 2010 2012 2014
Ener
gy (M
Wh)
Year
MWh (Local and MWD supply)
10-year rolling average
260 % increase
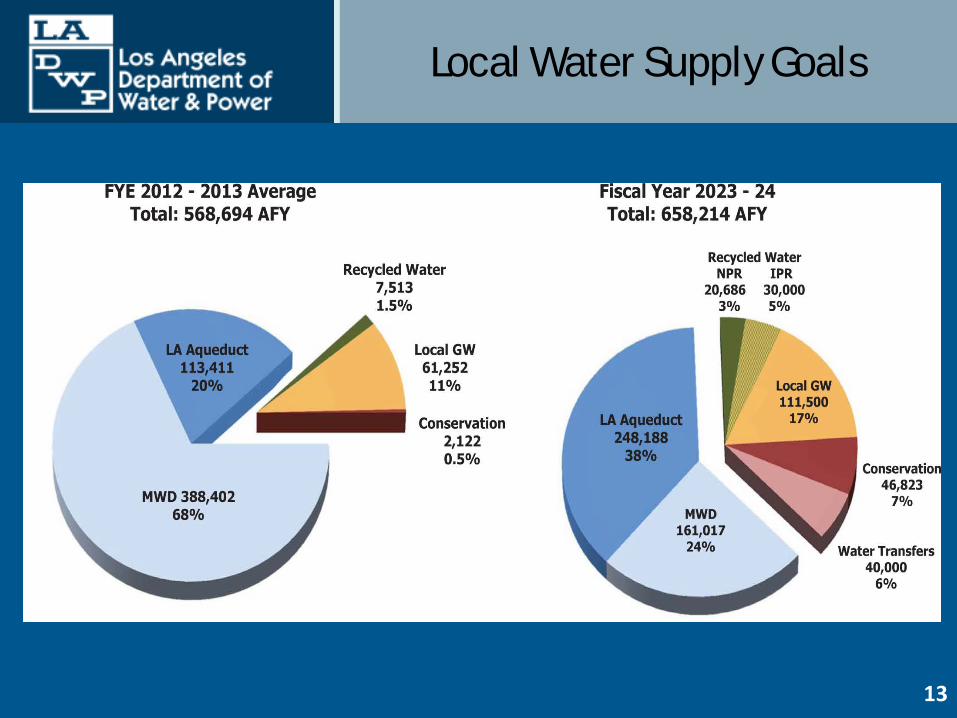
Local Water Supply Goals
13

Benefits of Water Conservation
Cumulative water conserved from FY 2007/08 to FY 2013/14 by LADWP customers is 578,141 acre-feet.
Equivalent to: Powering over 308,000 homes in
L.A. for 1 year Eliminating 1.48 billion pounds of
CO2 emissions Eliminating 134,772 passenger
vehicle emissions for 1 year Avoiding GHG emissions by recycling
over 244,000 tons of waste instead of sending it to the landfill
14

Summary Comparison of Energy Intensity
15

The Challenges Faced
In contrast to other forms of energy efficiency typically addressed by local or state governments, meaningful savings in the water sector brings into question:
Large scale energy efficiency Reliability of energy supply Substantial cost impacts to an historically cheap commodity Absorbing energy needs of new water sources
16

Recycled Water System
17
LADWP directly receives recycled water from three WW treatment plants operated by the City of Los Angeles, Bureau of Sanitation (LASAN).
The weighted average
of recycled water energy intensity is approximately 1,347 kWh/AF
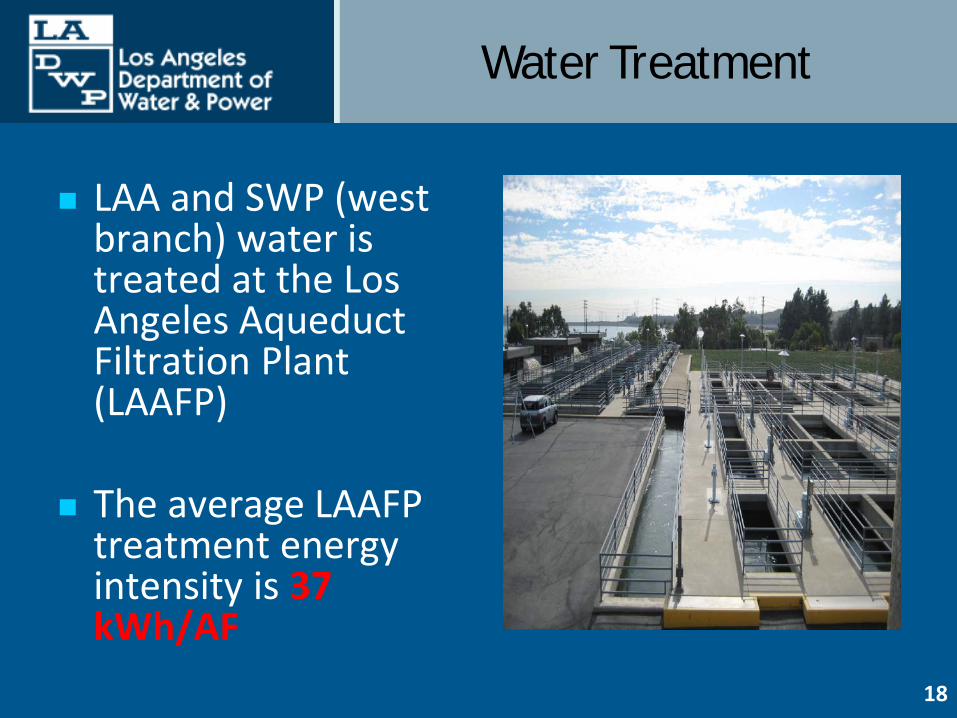
Water Treatment
18
LAA and SWP (west branch) water is treated at the Los Angeles Aqueduct Filtration Plant (LAAFP)
The average LAAFP
treatment energy intensity is 37 kWh/AF

Projected Water Supply Energy Demands
19
0
200,000
400,000
600,000
800,000
1,000,000
1,200,000
2015 2020 2025 2030 2035
Ener
gy (
MW
h)
Year
Projected MWh
Projected No MWD offset
Series2
* including MWD estimates
Status Quo
Based on 2010 UWMP Projections (average hydrologic conditions)
Based on ED5 goals (average hydrologic conditions)

LADWP – Power System Increasing Renewable Energy and Energy
Efficiency
20

Less Obvious Energy Savings In Operations
Filtration Media Data Mining and
Operational Intelligence
21
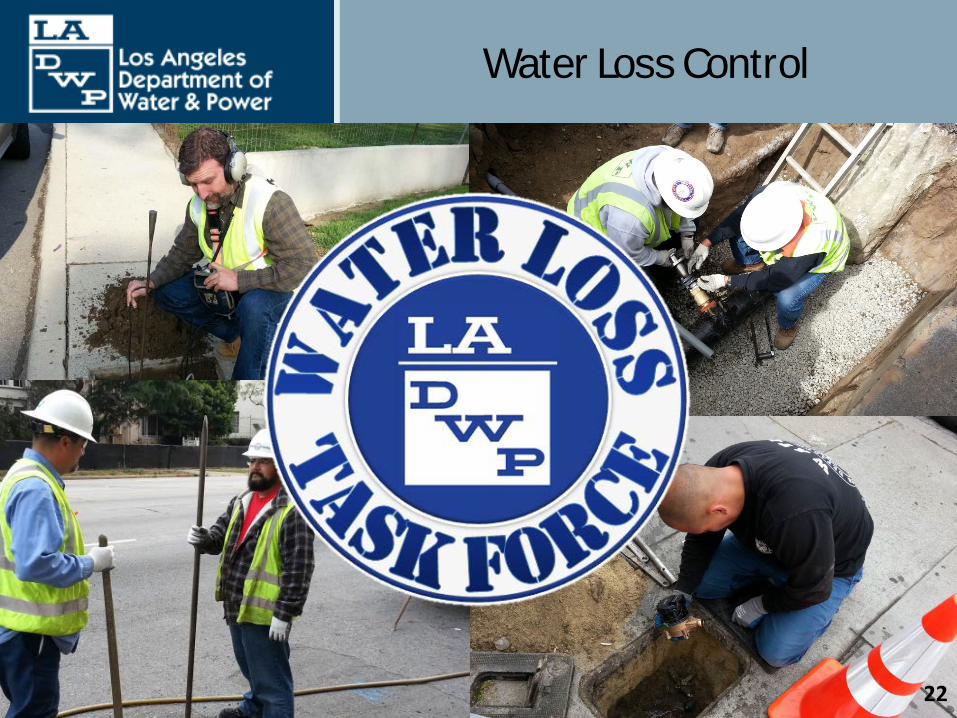
Water Loss Control
22

Remote Testing & Monitoring
23
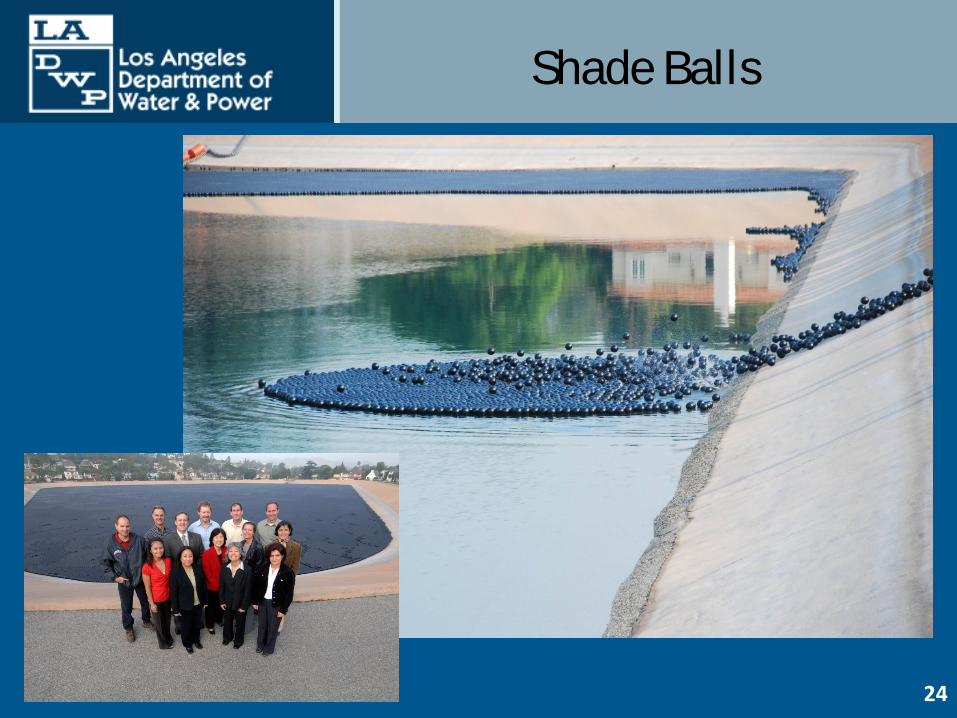
Shade Balls
24

Infrastructure Replacement and Upgrade
25

Conclusions
26


![Electron concentration and spectral intensity distribution in a ......Mohler] Spectral Intensity Distribution 851 where En is an average value. Since Ann3 is a constant for large values](https://img.dokumen.tips/doc/110x75/60754097ccc0000452147ea6/electron-concentration-and-spectral-intensity-distribution-in-a-mohler.jpg)