Embed Size (px)
Citation preview

Better-For-Who? Revisiting company promises on food marketing to children
Report written by Ameena Batada, Dr.P.H. and Margo G. Wootan, D.Sc., CSPI, with data collec‐tion and analysis by Lacey Arneson, MPH student at the University of Minnesota.
CSPI and the Nutrition Policy Project
The Center for Science in the Public Interest (CSPI) is a nonprofit organization based in Wash‐ington, D.C. Since 1971, CSPI has been working to improve the public’s health through its
work on nutrition, food safety, and alcohol issues. CSPI is supported primarily by the 900,000 subscribers to its Nutrition Action Healthletter and philanthropic foundations.
CSPI’s Nutrition Policy Project is working with concerned citizens, health professionals, govern‐ment officials and other nonprofit organizations to strengthen national, state, and local poli‐cies and programs to promote healthy eating and physical activity. Our goal is to help reduce the illnesses, disabilities, and deaths caused by diet– and inactivity‐related diseases and condi‐tions such as heart disease, cancer, high blood pressure, diabetes, and obesity. For more in‐formation on our current projects and other policies to promote healthy eating and physical
activity, visit <www.cspinet.org/nutritionpolicy>.
November 2009
For more information, model policies, and other materials, contact:
Margo G. Wootan, D.Sc. Center for Science in the Public Interest (CSPI)
Phone: 202‐777‐8352 Fax: 202‐265‐4954
Email: [email protected]
Better‐For‐Who? Revisiting Company Promises on Food Marketing to Children is available on line free of charge at <www.cspinet.org/betterforwho>

Better‐For‐Who? Key Findings The Foods
Products that companies identify as appropriate to market to children (approved products) met
each company's own standards. However, the majority (59%) of approved products did not
meet a single, third‐party nutrition standard.
The percentage of approved products that met nutrition standards varied across food product
types, from 0% of puddings, fruit‐flavored snacks, and sweet snacks to 73% of yogurts.
The percentage of foods that met CSPI's nutrition standards varied across companies, from 0% to
100%. The majority of approved products from Burger King, Nestlé, Dannon and ConAgra met
the standards, while the majority of products approved for marketing to kids by Pepsi, Kraft,
McDonald’s, General Mills, Kellogg, Unilever and Campbell failed to meet our nutrition
standards.
The Ads: from 2005 to 2009
On Nickelodeon, the most popular children’s television station, ads for foods of poor nutritional
quality decreased slightly, from about nine in ten (88%) to eight in ten (79%) food ads. The
decrease was not statistically significant.
While the percentage of ads for foods exceeding the recommended limits for total fat, saturated
plus trans fat, and sodium decreased, the percentage of ads for foods exceeding the
recommended limit for added sugars increased.
The number of ads for foods that exceeded two or more limits for problem nutrients dropped
from 29% of food ads in 2005 to 10% of food ads in 2009 (excluding brand ads).
One‐quarter of Nickelodeon’s TV food ads were from companies that do not participate in the
Council of Better Business Bureaus' Children's Food and Beverage Advertising Initiative (CFBAI).
Almost no ads from non‐CFBAI companies met CSPI's recommended nutrition standards for food
marketing to children, while 28% of ads from CFBAI companies met the standards.
1

Introduction In January 2006, the National Academies’ Institute of
Medicine (IOM) concluded that food marketing influences children’s food preferences,
requests, diets, and health.1 One of the IOM’s recommendations was that food and media
companies shift the mix of foods marketed to youth toward healthier foods within two years, or
Congress should act.
That fall, the food industry formed the Children’s Food and Beverage Advertising Initiative
(CFBAI), a self‐regulatory program administered by the Council of Better Business Bureaus
(CBBB). By June 2007, 10 companies, which together accounted for about 80% of the TV food
ad expenditures to youth, released individual pledges to address food marketing to children.
Since then, six more companies have joined the program.
Four companies (Coca‐Cola, Hershey’s, Mars, and Cadbury Adams) stated that they do not
advertise any products to children (according to the CBBB definition). The remaining
companies have nutrition standards for “better‐for‐you” foods that the companies apply to
their TV, print, radio, and Internet advertising, and use of licensed characters in advertising. All
companies agreed to limit elementary school advertising (though not all school food marketing)
and not to seek paid product placement in media aimed at children. Most pledges went into
effect in January 2008 and by January 2009, 15 company pledges were fully implemented.
The food companies’ marketing pledges vary in terms of the media they cover, how they define
which media are child‐directed, and the details of their nutrition standards. While there are
many similarities between company nutrition standards, there also are important differences.
What is considered “better‐for‐you” by one company may not be considered “better‐for‐you”
by another. The Center for Science in the Public Interest (CSPI) provides a summary of
company policies and nutrition standards at
www.cspinet.org/nutritionpolicy/decreasefoodmarketing. The CBBB also maintains a table
summarizing company nutrition standards2 and a list of pledge‐approved products.3
Now, nearly four years since the IOM released its recommendations, how healthy are the
products that companies market to children? The CBBB has been monitoring the CFBAI
primarily using company reports, and adherence to pledges is high.4 However, do nutrition
standards and pledge adherence translate to fewer ads for foods of poor nutritional quality?
To answer those questions, this study analyzed the nutritional quality of foods and beverages
that companies have approved for marketing to children, and tracked changes in the nutritional
quality of foods and beverages marketed to children over time.
2

How healthy are the products that companies market to children?
Between February and April, 2009, CSPI collected nutrition information for all flavors and
varieties of products that companies reported in their CFBAI pledges met their nutrition
standards for marketing to children (n=452).5 Nutrition information was collected from
company websites or, if unavailable on‐line, from product packaging found in a local grocery
store in Washington, D.C. (n=20 products).
We evaluated the nutritional quality of the pledge‐approved products using a set of nutrition
standards for food marketing to children developed by a panel of nutrition and health experts,6
which were adapted from the National Alliance for Nutrition and Activity’s (NANA) Model
School Wellness Policies on Physical Activity and Nutrition.7 The NANA standards are
supported by more than 50 health, nutrition, and education organizations and are based on key
nutrition recommendations from the Dietary Guidelines for Americans.8
Prepared Meals
8%
Crackers 6%
Peanut Butter/Cheese 5%
Pudding
1%
Cookies/Sweet Snacks 3%
Frozen Waffles/
French Toast 3%
Entrees/Pastas
/Soups 7%
Cereals
10%
Frozen Treats
16%
Fruit‐Flavored
Snacks
17%
Yogurt
24%
Types of Products Marketed to Children Figure 1: Categories of Foods
Of the 452 products approved by Marketed to Children
companies in the winter of 2009
to market to children, 391 were
foods and 61 were beverages.
The most common types of
foods were yogurt (24%), fruit‐
flavored snacks (17%), and
frozen treats (16%) (see Figure
1). The most common types of
approved beverages were juice
drinks (48%), 100% juices (31%),
and sports drinks (13%). None of
the approved products were
fruits or vegetables.
3
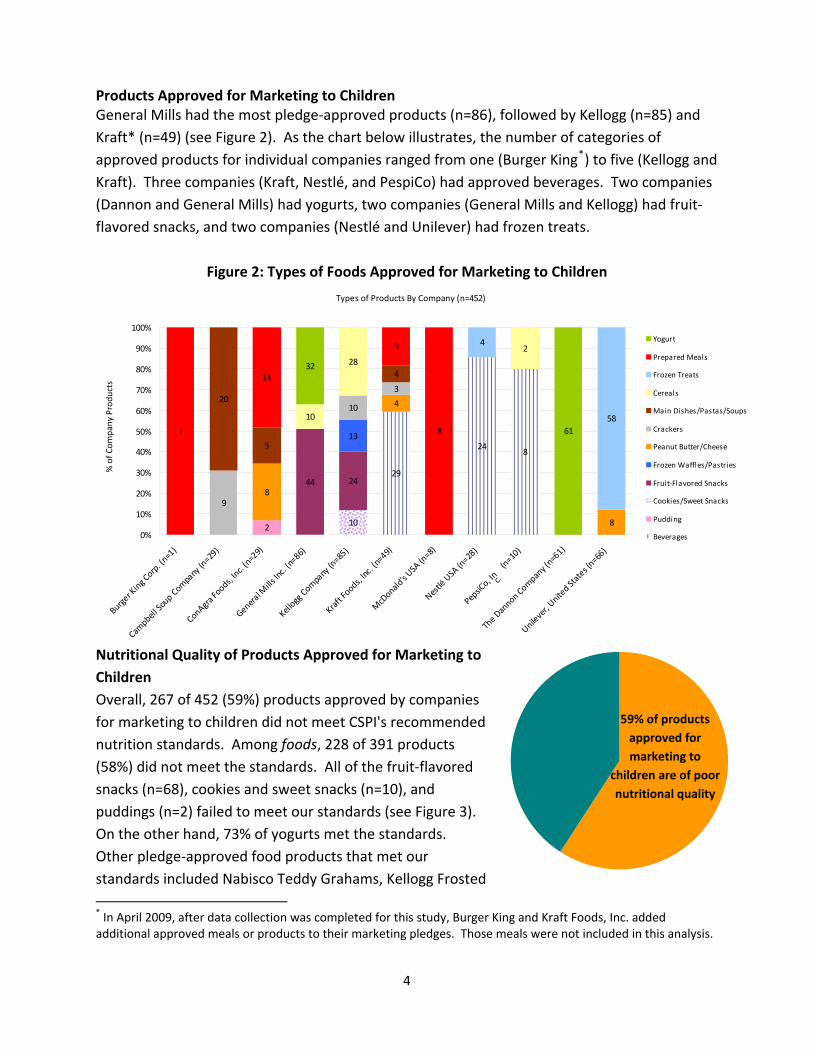
Products Approved for Marketing to Children General Mills had the most pledge‐approved products (n=86), followed by Kellogg (n=85) and
Kraft* (n=49) (see Figure 2). As the chart below illustrates, the number of categories of
approved products for individual companies ranged from one (Burger King*) to five (Kellogg and
Kraft). Three companies (Kraft, Nestlé, and PespiCo) had approved beverages. Two companies
(Dannon and General Mills) had yogurts, two companies (General Mills and Kellogg) had fruit‐
flavored snacks, and two companies (Nestlé and Unilever) had frozen treats.
Figure 2: Types of Foods Approved for Marketing to Children
Types of Products By Company (n=452)
29
248
210
44 24
13
8
4
8
9
10
320
5
4
10
28
24
58
1
14
9
8
32
61
0%
10%
20%
30%
40%
50%
60%
70%
80%
90%
100%
Burger King Corp. (n=1)
Campbell Soup Company (n=29)
ConAgra Foods, Inc. (n=29)
General Mills Inc. (n=86)
Kellogg Company (n=85)
Kraft Foods, Inc. (n=49)
McDonald's USA (n=8)
Nestlé USA (n=28)
PepsiCo, Inc. (n=10)
The Dannon Company (n=61)
Unilever, United States (n=66)
% of Company Products
Yogurt
Prepared Meals
Frozen Treats
Cereals
Main Dishes/Pastas/Soups
Crackers
Peanut Butter/Cheese
Frozen Waffles/Pastries
Fruit‐Flavored Snacks
Cookies/Sweet Snacks
Pudding
Beverages
Nutritional Quality of Products Approved for Marketing to
Children
Overall, 267 of 452 (59%) products approved by companies
for marketing to children did not meet CSPI's recommended
nutrition standards. Among foods, 228 of 391 products
(58%) did not meet the standards. All of the fruit‐flavored
snacks (n=68), cookies and sweet snacks (n=10), and
puddings (n=2) failed to meet our standards (see Figure 3).
On the other hand, 73% of yogurts met the standards.
59% of products
approved for
marketing to
children are of poor
nutritional quality
Other pledge‐approved food products that met our
standards included Nabisco Teddy Grahams, Kellogg Frosted
* In April 2009, after data collection was completed for this study, Burger King and Kraft Foods, Inc. added additional approved meals or products to their marketing pledges. Those meals were not included in this analysis.
4
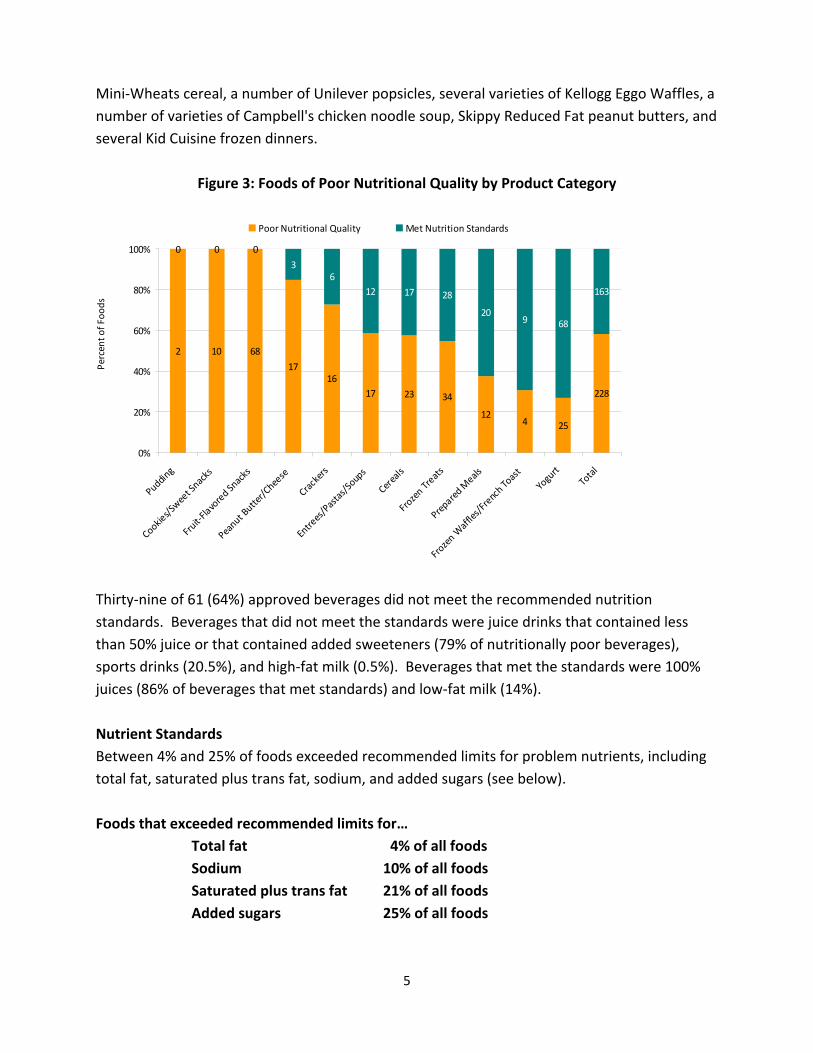
Mini‐Wheats cereal, a number of Unilever popsicles, several varieties of Kellogg Eggo Waffles, a
number of varieties of Campbell's chicken noodle soup, Skippy Reduced Fat peanut butters, and
several Kid Cuisine frozen dinners.
Figure 3: Foods of Poor Nutritional Quality by Product Category
Thirty‐nine of 61 (64%) approved beverages did not meet the recommended nutrition
standards. Beverages that did not meet the standards were juice drinks that contained less
than 50% juice or that contained added sweeteners (79% of nutritionally poor beverages),
sports drinks (20.5%), and high‐fat milk (0.5%). Beverages that met the standards were 100%
juices (86% of beverages that met standards) and low‐fat milk (14%).
2 10 68
1716
17 23 34
124 25
228
36
12 17 28
209 68
163
0 0 0
0%
20%
40%
60%
80%
100%
Pudding
Cookies/Sweet Snacks
Fruit‐Flavored Snacks
Peanut Butter/Cheese
Crackers
Entrees/Pastas/Soups
Cereals
Frozen Treats
Prepared Meals
Frozen Waffles/French Toast
Yogurt
Total
Percent of Fo
ods
Poor Nutritional Quality Met Nutrition Standards
Nutrient Standards
Between 4% and 25% of foods exceeded recommended limits for problem nutrients, including
total fat, saturated plus trans fat, sodium, and added sugars (see below).
Foods that exceeded recommended limits for…
Total fat 4% of all foods
Sodium 10% of all foods
Saturated plus trans fat 21% of all foods
Added sugars 25% of all foods
5
Most of the foods that met the standard for providing positive nutritional value did so because
they contained at least 10% of the DRI for a key vitamin or mineral (84% of foods). Few of the
pledge‐approved foods contained at least a half a serving of a fruit or vegetable (10% of foods)
or were whole grain (6% of foods).
Foods that met recommendations for…
Key vitamins and minerals 84% of all foods
Fruits and vegetables 10% of all foods
Whole grains 6% of all foods
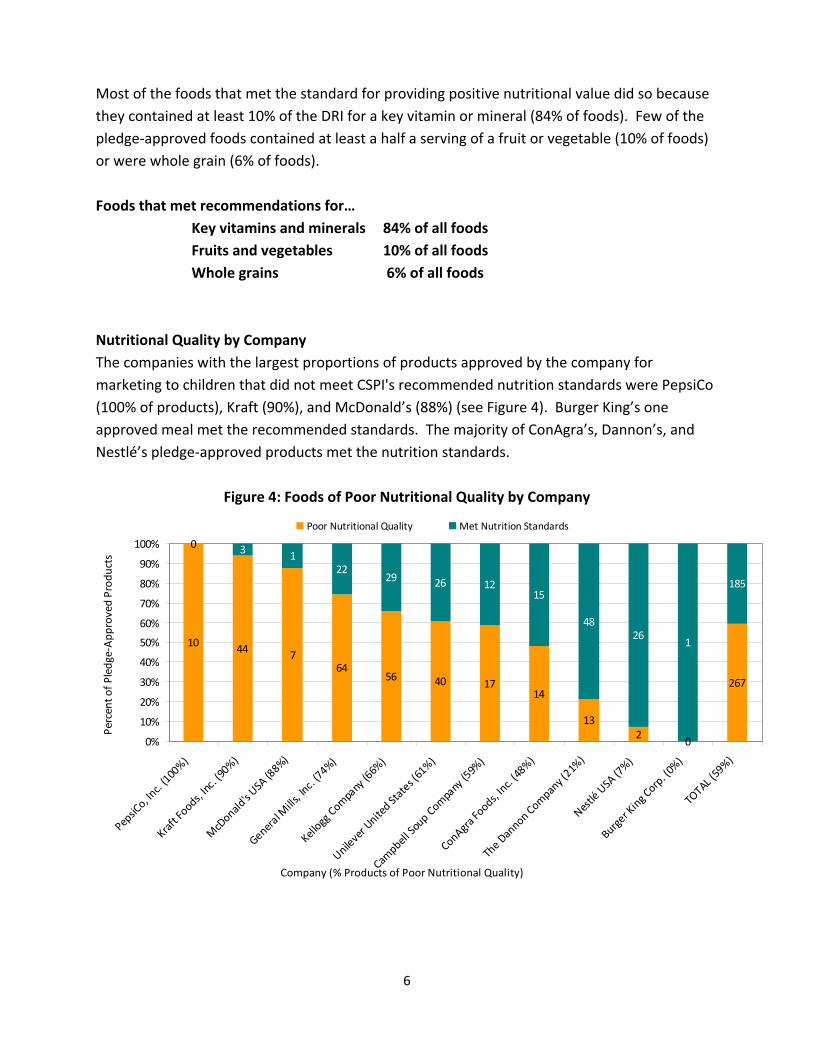
Nutritional Quality by Company
The companies with the largest proportions of products approved by the company for
marketing to children that did not meet CSPI's recommended nutrition standards were PepsiCo
(100% of products), Kraft (90%), and McDonald’s (88%) (see Figure 4). Burger King’s one
approved meal met the recommended standards. The majority of ConAgra’s, Dannon’s, and
Nestlé’s pledge‐approved products met the nutrition standards.
Figure 4: Foods of Poor Nutritional Quality by Company
107
6456 40 17
14
132
0
31
2229 26 12
15
4826
144
267
0
185
0%
10%
20%
30%
40%
50%
60%
70%
80%
90%
100%
PepsiCo, Inc. (100%)
Kraft Foods, Inc. (90%)
McDonald's USA (88%)
General Mills, Inc. (74%)
Kellogg Company (66%)
Unilever United States (61%)
Campbell Soup Company (59%)
ConAgra Foods, Inc. (48%)
The Dannon Company (21%)
Nestlé USA (7%)
Burger King Corp. (0%)
TOTAL (59%)
Company (% Products of Poor Nutritional Quality)
Percent of Pledge‐Approved Products
Poor Nutritional Quality Met Nutrition Standards
6

Overall, about six in ten products that companies deemed appropriate to market to children did
not meet CSPI's recommended nutrition standards for food marketing to children. Products
were often too high in added sugars, saturated fat, or sodium, and few contained significant
amounts of fruits, vegetables, or whole grains. Despite the industry’s pledges to improve the
balance of foods marketed to youth, foods and beverages of poor nutritional quality still make
up the majority of foods marketed to children. The findings do not reflect the frequency with
which foods of poor nutritional quality are marketed to children, however. That issue is
addressed in the second part of this report.
Have child‐directed TV ads for foods of poor nutritional quality decreased?
To determine whether the food‐advertising environment has improved, CSPI analyzed the
change in the nutritional quality of foods advertised on Nickelodeon television between 2005
and 2009. Nickelodeon is the most‐watched children’s television station in the United States.9
For each time point, we reviewed all food ads aired during a 28‐hour period over two days. We
then collected nutrition information for advertised products from food company websites and
analyzed the products’ nutritional quality using the nutrition standards described earlier in this
report.6
The total number of food ads during the 28 hours of television stayed fairly stable over the
years, with 168 food ads in 2005 and 161 food ads in 2009. In 2005, the most frequently
advertised foods were breakfast cereals (29% of food ads), fast‐food and other restaurants
(19%), and pastries (12%). In 2009, the most frequently advertised foods were fast‐food and
other restaurants (38%), breakfast cereal (30%), and yogurt (8%). The proportion of ads for
beverages increased from 1% of all food ads in 2005 to 3% in 2009. Brand ads, which focused
on a brand with little or no depictions of food, also increased, from about 10% of food ads in
2005 to 27% in 2009 (mostly for fast food).
Adherence to Company Nutrition Standards
During our first study of Nickelodeon advertising in 2005, only Kraft Foods had guidelines for
food marketing to children. In January 2009, 15 companies had CFBAI pledges for food
marketing to children.
In 2009, we found that 74% of Nickelodeon television food ads were by CFBAI‐participating
companies and 100% of those ads adhered to each company’s own nutrition standards. The
remaining 26% of food ads were by non‐CFBAI companies: Chuck E. Cheese’s (26 ads), Post
7
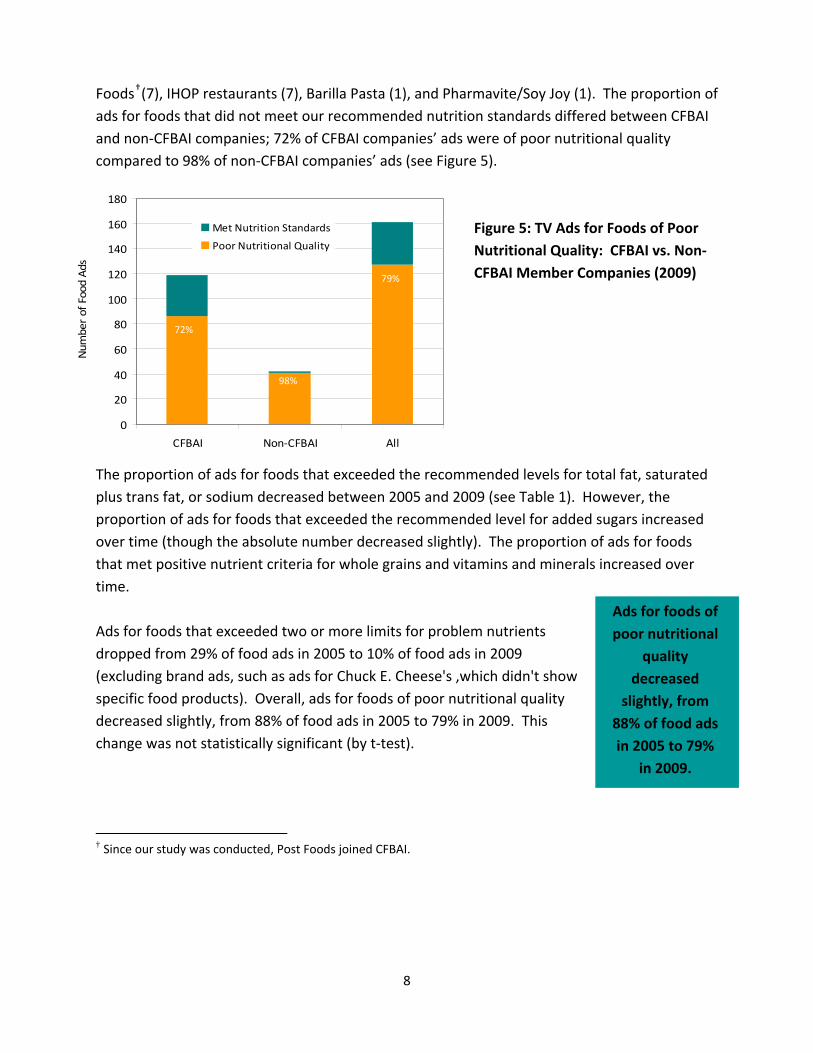
Foods†(7), IHOP restaurants (7), Barilla Pasta (1), and Pharmavite/Soy Joy (1). The proportion of
ads for foods that did not meet our recommended nutrition standards differed between CFBAI
and non‐CFBAI companies; 72% of CFBAI companies’ ads were of poor nutritional quality
compared to 98% of non‐CFBAI companies’ ads (see Figure 5).
0
20
40
60
80
100
120
140
160
180
CFBAI Non‐CFBAI All
Number of Food Ads
Met Nutrition Standards
Poor Nutritional Quality
Figure 5: TV Ads for Foods of Poor
Nutritional Quality: CFBAI vs. Non‐
CFBAI Member Companies (2009) 79%
72%
98%
The proportion of ads for foods that exceeded the recommended levels for total fat, saturated
plus trans fat, or sodium decreased between 2005 and 2009 (see Table 1). However, the
proportion of ads for foods that exceeded the recommended level for added sugars increased
over time (though the absolute number decreased slightly). The proportion of ads for foods
that met positive nutrient criteria for whole grains and vitamins and minerals increased over
time.
Ads for foods of
poor nutritional
quality
decreased
slightly, from
88% of food ads
in 2005 to 79%
in 2009.
Ads for foods that exceeded two or more limits for problem nutrients
dropped from 29% of food ads in 2005 to 10% of food ads in 2009
(excluding brand ads, such as ads for Chuck E. Cheese's ,which didn't show
specific food products). Overall, ads for foods of poor nutritional quality
decreased slightly, from 88% of food ads in 2005 to 79% in 2009. This
change was not statistically significant (by t‐test).
† Since our study was conducted, Post Foods joined CFBAI.
8

Table 1: Children’s Television Food Ads: Changes in Nutrient Content, 2005‐2009
# (%) Exceeding Recommendation # (%) Meeting Recommendation
Year Total Food Ads
Ads in Analysis*
Total Fat
Sat + Trans Fat
Sodium Sugars Whole Grains
Vitamins & Minerals
Fruit or Vegetable
2005 168 148 13 (9) 55 (37) 50 (34) 56 (38) 13 (9) 119 (80) 18 (12)
2009 161 112 0 (0) 14 (13) 17 (15) 52 (49) 37 (35) 102 (97) 13 (12)
% Change in # of Ads
‐4 ‐24 ‐100 ‐75
‐66 ‐7 +185 ‐14 ‐28
%‐Point Change
‐9 ‐24 ‐19 +11 +26 +17 0
*Only food ads are included in this table. The analysis excluded brand ads and beverage ads (which use a different set of nutrition standards than foods). The number of food ads in the analysis for a few categories was 105 in
2009, because nutrition information was not available for that nutrient category [those are noted with a ()].
7979%
It is important to note that this study assessed marketing in only one medium (television).
There are other media covered by CFBAI pledges (such as, print, radio, and Internet). However,
several other media, including product packaging, in‐store/restaurant displays, in‐school
marketing in middle and high schools, sponsorships, etc., are not covered by the CFBAI. 98%
72%
Better‐For‐Who? Key Recommendations 98%
Chuck E. Cheese’s, Perfetti van Melle (maker of Air Heads candy), IHOP restaurants, Topps Candy
(maker of Baby Bottle Pop candy), YUM! Brands (KFC, Taco Bell, Pizza Hut), and all other food
and beverage companies that market to children – through television or any other media –
should join the Children’s Food and Beverage Advertising Initiative (CFBAI).
The Council of Better Business Bureaus should revise its CFBAI guidelines to include a set of
nutrition standards, which all participating companies must comply with, such as those being
developed by the Interagency Working Group on Food Marketed to Children (see below).
Nickelodeon and other media companies should have comprehensive policies for marketing to
children that cover all their media and should air only ads aimed at children for foods that meet
strong nutrition standards.
9
During the four years since the Institute of Medicine released its report on food marketing to
children, the nutritional quality of foods advertised on children’s television has improved.
However, too many unhealthy foods are still marketed to children. In 2009, eight in ten
advertised foods during children’s programming on Nickelodeon were of poor nutritional
quality.
This study suggests that self‐regulation is having a modest, positive impact. However, as
currently practiced, it is not sufficient to address food marketing to children. One weakness is
that each company has its own nutrition standards for food marketing to children. While there
are a number of similarities among those nutrition standards, some companies have self‐
serving loopholes that let through too much marketing of foods of poor nutritional quality. For
example, McDonald’s has no sodium standard and several cereal manufacturers have weak
sugar standards. In addition, a number of companies that market food to children still have not
adopted policies or nutrition standards for marketing to children.
Currently, an Interagency Working Group on Food Marketed to Children, including
representatives from the Federal Trade Commission (FTC), the Centers for Disease Control and
Prevention (CDC), the Food and Drug Administration (FDA), and the U.S. Department of
Agriculture (USDA), is developing recommended nutrition standards for food marketing to
children. The report is due out in July 2010 and should provide a model for the CFBAI and
companies to adopt.
Given the high rates of childhood obesity and prevalence of poor nutrition among children, the
small magnitude of changes in the nutritional quality of foods marketed to children is
unacceptable.
In order for self‐regulation to result in more than incremental change, all food and media
companies that market to children should adopt a uniform set of strong nutrition standards and
apply them to their full range of marketing to youth. Without more significant progress, the
country will need to rely on government regulation rather than self‐regulation as the means to
address food marketing to children.
10
References
1 Institute of Medicine. Food Marketing to Children: Threat or Opportunity? Washington, D.C.: National Academies Press. 2006. 2 Children’s Food and Beverage Advertising Initiative. Children’s Food and Beverage Advertising Initiative: Synopsis of Participants’ Nutrition Guidelines. Washington, D.C.: Council of Better Business Bureaus. May 2009. Available at: http://www.bbb.org/us/storage/16/documents/May%20%202009%20Revised%20Chart%20Final.pdf. 3 Children’s Food and Beverage Advertising Initiative. Children’s Food and Beverage Advertising Initiative:
Food and Beverage Products that Meet Participants’ Approved Nutrition Standards. Washington, D.C.:
Council of Better Business Bureaus. August 2009. Available at:
http://centralohio.bbb.org/storage/0/Shared%20Documents/Aug_Product_List_final1.pdf. 4 Children’s Food and Beverage Advertising Initiative. The Children's Food and Beverage Advertising
Initiative in Action: A Report on Compliance and Implementation during 2008. Washington, D.C.: Council of
Better Business Bureaus. October 2009. Available at
http://www.bbb.org/us/storage/16/documents/finalbbbs.pdf.
5 Children’s Food and Beverage Advertising Initiative. BBB Children’s Food and Beverage Advertising
Initiative: Food and Beverage Products that Meet Participants’ Approved Nutrition Standards. Washington,
D.C.: Council of Better Business Bureaus. January 2009. 6 Center for Science in the Public Interest. Guidelines for Responsible Food Marketing to Children. Washington, D.C.: Center for Science in the Public Interest. 2006. Available at: http://www.cspinet.org/marketingguidelines.pdf. 7National Alliance for Nutrition and Activity. Model School Wellness Policies. Washington, D.C.: National
Alliance for Nutrition and Activity. 2005. Available at: http: http://schoolwellnesspolicies.org/. 8 U.S. Department of Agriculture and the U.S. Department of Health and Human Services. Dietary Guidelines for Americans. Washington, D.C.: U.S. Department of Health and Human Services. 2005. Available at: http://www.health.gov/dietaryguidelines/dga2005/document/default.htm. 9 Nielsen’s data. Reported on Viacom’s web site. Available at:
http://www.viacom.com/ourbrands/medianetworks/mtvnetworks/Pages/nickelodeon.aspx.
11