Embed Size (px)
Citation preview

Research Report DFE-RR172
Better communication research programme: 2nd interim report
Geoff Lindsay1, Julie Dockrell2, James Law3 Sue Roulstone4
1 CEDAR, University of Warwick 2 Institute of Education, University of London 3 University of Newcastle 4 University of West of England

This research report was commissioned before the new UK Government took office on 11 May 2010. As a result the content may not reflect current
Government policy and may make reference to the Department for Children, Schools and Families (DCSF) which has now been replaced by the Department
for Education (DFE).
The views expressed in this report are the authors’ and do not necessarily reflect those of the Department for Education.

The Research Team Core Team: Geoff Lindsay1, Julie Dockrell2. James Law3, and Sue Roulstone4,11
Specialists: Anna Vignoles5, Jenni Beecham6, Steve Strand1, and Tony Charman5
Co-authors: Alison Bailey7,8, Gillian Baird10, Ioanna Bakapoulou1, Susan Goodlad12, Helen
Hambly4, Rosemarie Hayhoe11, Charles Hulme7, Victoria Joffe9 , Elena Meschi5, John
Micklewright5 Vicky Slomins10, Margaret Snowling7, Sarah Spencer3, Susan E Stothard7,
Yvonne Wren11, Biao Zeng3
1 Centre for Educational Development, Appraisal and Research (CEDAR, University of
Warwick 2 Department of Psychology and Human Development, Institute of Education, University of
London 3School of Education, Communication and Language Sciences, University of Newcastle, UK 4 University of West of England, Bristol 5 Department of Quantitative Social Science, Institute of Education, University of London 6 Personal Social Services Research Unit (PSSRU), London School of Economics 7 University of York 8 City of York Local Authority and Centre for Reading and Language, University of York 9 City University, London 10 Guys Hospital 11 Frenchay Hospital, Bristol 12 Centre for Education and Industry, University of Warwick
2

CONTENTS Executive Summary
5
1. Introduction 13
2. Communication Supporting Classrooms Project Julie Dockrell, James Law, Ioanna Bakapoulou and Sarah Spencer
17
2.1 Aims of the Study 17 2.2. What we have done 18 2.3 What we have found 22 2.4 What we are doing next
23
3. A further investigation of pupils with Speech, Language and Communication Needs (SLCN) and Autism Spectrum Disorder (ASD) Elena Meschi, John Micklewright and Anna Vignoles
24
3.1 Aims of the Study 24 3.2 What we have done 25 3.3 What we have found 26 3.4 Policy implications
31
4. Interventions for children with speech, language and communication needs (SLCN) in England: A survey of speech and language therapists Geoff Lindsay, Yvonne Wren, Ioanna Bakapoulou, Susan Goodlad & Sue Roulstone
33
4.1 Aims of the Study 33 4.2 What we have done 33 4.3 What we have found 35 4.4 Discussion of findings 44 4.5 What we are doing next
45
5. Prospective longitudinal study – Phases 2 and 3Julie Dockrell, Geoff Lindsay, Olympia Palikara, Jessie Ricketts, and Tony Charman
47
5.1 Introduction 47 5.2 Methods 48 5.3 What we have done 51 5.4 What we are doing next
64
6. Language and Literacy Attainment of Pupils during Early Years and through KS2: Does teacher assessment at five provide a valid measure of children’s current and future educational attainments?Margaret Snowling, Charles Hulme, Alison M Bailey, Susan E Stothard, & Geoff Lindsay
66
6.1 Background 66 6.2 Aims of the Study 66 6.3 What we have done 67 6.4 Research Questions and Main Findings 68 6.5 Summary and Conclusions 73 6.6 Implications for Policy and Practice 74
3

7. Speech language and communication needs and behaviour
Julie Dockrell and Victoria Joffe (Study 1), and Gillian Baird (Study 2) and Vicky Slomins (Study 2)
76
7.1
Behaviour, emotional and social difficulties in secondary schools pupils with speech, language and communication needs
77
7.2 BESD and language difficulties in a clinical sample 90 7.3 Overall Summary
101
8. Preferred Outcomes: Online Survey of Parents’ ViewsSue Roulstone and Helen Hambly
103
8.1 Aims of the Study 103 8.2 What we have done 103 8.3 What we have found 104 8.4 Conclusions
106
9. Economic Effectiveness ProgrammeJennifer Beecham, James Law and Dr Biao Zeng
107
9.1 Aims of the project 107 9.2 What we have done 107 9.3 What we have found 108 9.4 Conclusions
114
10. Prospective cohort study of SLT services for young children who stammer in England Sue Roulstone and Rosemarie Hayhoe
115
10.1 Aim 115 10.2 Background 116 10.3 What we have done 116 10.4 Conclusions
118
References
119
Appendix 123
4

EXECUTIVE SUMMARY
The Better Communication Research Programme is part of the Better Communication
Action Plan, the government’s response to the Bercow Review1, published in 2008. The
aims of the BCRP are to provide:
• An understanding of the cost-effectiveness of different interventions used to support
children and young people with SLCN and the factors that influence their efficiency
including: locational issues (e.g. special school, integrated resource, mainstream);
pedagogic issues (e.g. specific programmes for specific needs); organisational
issues (e.g. nature and deployment of support services, use of data informed
developments); and employer base interaction issues (e.g. use of consultancy model
verses direct teaching/therapy).
• Identification of good practice and developing recommendations that can be
incorporated into guidance, future policy and commissioning frameworks to improve
services for children and young people with SLCN.
The BCRP focuses on children and young people with speech, language and
communication needs (SLCN). This is the term used by the Department for Education to
refer to pupils with primary language difficulties (as opposed to, for example, children with
language difficulties associated with hearing impairment). However, the Bercow Review
used this term in a broader, inclusive sense to cover children with all forms of speech,
language and communication needs from whatever cause. This issue is addressed in the
report.
This 2nd Interim Report provides information on the work of the BCRP that mainly took place
during the period July 2010 – July 2011. During this time we have built on the work in Year 1
and also undertaken new projects. The BCRP is designed so that the different strands will
provide complementary evidence wherever possible and that subsequent work will be
determined by the emerging evidence.
The report therefore provides a summary of the aims of each study, what was done and the
results so far. In some cases work is ongoing and will end in March 2012, in others the
project is now complete. The range of activities reported is wide and we essentially report
1 Bercow, J. (2008) A review of services for children and young people (0-19) with speech, language and communication needs. Nottingham: DCSF
5
separate projects. We will be pulling the different results together for the final report in spring
2012 when we will be integrating the results from the different projects.
Communication Supporting Classrooms
• The first stage of this study is complete. A Communication Supporting Classroom
Observation Checklist for Early Years and Key Stage 1 was devised following a
review of the research literature and piloted in 24 schools in reception and Years 1
and 2.
• The Checklist comprises three scales:
o Language Learning Environment
o Language Learning Opportunities
o Language Learning Interventions
• The Checklist has good reliability
o 83% agreement between raters for the Language Learning Environment
domain.
• In the next phase:
o The schools will be revisited to examine stability in these schools and new
schools will be visited to broaden the scope.
o Training will be provided to school staff in the use of the Checklist
o After training the staff will use the Checklist and its reliability when used by
front line staff (rather than researchers) will be examined.
Pupils with Speech Language and Communication Needs (SLCN) and Autism Spectrum Disorder (ASD): Prevalence and academic progress
• This study extends that reported in the 1st Interim Report, testing out the
implementation and meaning of earlier findings and broadening the scope to include
an ASD sample.
• The study utilised the national data sets: Pupil Level School Census (PLASC) and
the National Pupil Database.
• The analysis focused particularly on transition made by pupils into and out of different
categories of SEN and the factors associated with these.
• The findings include:
o The prevalence of pupils designated as having SLCN varies over time, with
the percentage of those at School Action Plus reducing over key stages 1 and
2.
6

o The pattern for pupils with ASD differs, showing a more consistent prevalence
across the ages, although rising gently to age 12 then reducing.
o Unlike SLCN, there is a consistently greater proportion of children with ASD
who have statements rather than support at School Action Plus (SAP).
o Being socially disadvantaged and having English as an Additional Language
were associated with pupils being identified as having SLCN, especially those
at SAP but this was not the case for those pupils with ASD.
o Low achievement was a risk factor for both groups, but more so for those with
SLCN.
o There was substantial movement during secondary school into and out of the
SLCN and ASD categories, with most movement occurring at transition
between primary and secondary school.
Of those with non-statemented SLCN (School Action Plus) at the start
of KS3, a quarter move into non-SEN, just under a fifth remain in the
non-statemented SLCN category and a further fifth move into another
type of non-statemented SEN.
The most common categories they move into are Moderate Learning
Difficulties (MLD) and Specific Learning Difficulties (SpLD).
o There is less movement for pupils with ASD
41% remain in this category at the end of Key Stage 3.
Those moving out of non-statemented ASD who moved into another
SEN category are most likely to move into Behavioural, Emotional and
Social Difficulties (BESD) and MLD.
For those initially with statement for ASD, the main moves out are into
MLD, closely followed by SLCN
• Those who entered secondary schools with SLCN and also English as an additional
language (EAL) were much more likely to move out of SLCN by age 14 years.
• There were also important associations between moving out of an SEN category and
school context, e.g.
o Pupils attending a higher achieving school are more likely to move from ASD
to non-SEN, but this does not apply to pupils with SLCN
o Attenders at a socio-economically deprived school (high percentage with
entitlement to a free school meal) are not more or less likely to make a
transition out of either SLCN or ASD into non-SEN.
7

A survey of Speech and Language Therapists
• A National survey of the use of interventions by speech and language therapists
(SLTs) working with children in England produced 576 responses.
• The main common patterns of interventions were
o With 5 – 7 year olds
o With primary language difficulties
o In mainstream schools
o But with a substantial range in all cases
• A total of 38 programmes were specified, the most common being: the Derbyshire
Language Scheme (65% SLTs), Makaton (58%), Nuffield-dyspraxia (47%), Core
Vocabulary (40%) and Hanen (39%).
• Eleven interaction activities were reported, the most common being phonological
awareness tasks (67%), barrier games (66%), audiology dissemination activities
(64%), audiology memory activities (62%) and narrative therapy (59%).
• Twenty six different principles/activities were reported, the most common being
modelling (96%), forced alternatives (84%), repetition (84%), visual approaches to
support language (83%), and reducing distractions (82%).
• Three quarters of SLTs delivered interventions regularly,
o 42% asking others (e.g. teachers, parents) to deliver it more frequently
between visits,
o 29% used this additional support less often.
• The most common frequency of delivery was once a week and the most common
length was 6 weeks or more (89%).
Prospective Longitudinal Study – Phases 2 and 3
Our sample comprises four groups of children, initially 6, 8, 10 or 12 years of age, namely:
those with specific language impairment (SLI), language impairment with low nonverbal
ability (LI low NV) autism spectrum disorder (ASD), and autism spectrum disorder with low
nonverbal ability (ASD low NV). We are investigating both similarities and differences in
these children’s needs and the ways in which schools address those needs.
• With respect to language:
o All four groups had depressed receptive and expressive language scores
o On average children with ASD performed better in areas of structural
language than children with SLI or LI low NV.
8

o There was a significant overlap between the groups, demonstrating the
variability within the groups and highlighting implications for teaching needs.
• With respect to literacy
o Children with ASD had scores for single word reading, reading
comprehension and spelling within the average range.
o Children with SLI and those with LI low NV had depressed scores on all three
literacy measures.
o The ASD and the ASD low NV groups outperformed the SLI and LI low NV
groups on both single word reading and spelling.
o Performance for reading comprehension was significantly higher for the ASD
groups than all other groups, who did not differ between themselves.
o In the writing task, children with LI low NV produced the fewest words and
significantly fewer than children with ASD.
• With respect to social communication
o The ASD group was significantly more impaired than the SLI and LI low NV
groups on measures of social interaction.
o The SLI group experienced significantly more difficulties in structural aspects
of language (speech syntax).
o The ASD group has significantly higher levels of social interaction deviance
than the SLI and SLI low NV groups.
Language and Literacy Attainment of Pupils during Early Years and through KS2
• The study examined whether teacher assessment at the end of the Early Years
Foundation Stage (aged 5 years), based on ongoing observation, provides a valid
measure of children’s current development and their educational attainment in future
years.
• Three cohorts of children in 50 primary schools were followed up over 3 years (N =
5378).
• There were correlations between the Communication Language and Literacy scales
of the Early Years Foundation Stage Profile and later reading and mathematics:
explaining about 50% of the differences between children.
• The study showed that teachers can make valid judgments and accurately monitor
their pupils’ progress in key reading skills.
• The risk factors for poor later educational attainment, also included gender (boys),
having English as an additional language and coming from a socioeconomically
disadvantaged background.
9

Speech, Language and Communication Needs and Behaviour
• Two studies were carried out to examine the relationship between SLCN and
behavioural, emotional and social difficulties
o A community, secondary school sample of 352 Year 7 pupils (age 12 years)
o A clinical sample of children who attended a specialist tertiary centre and had
been diagnosed with specific language impairment (SLI), autism spectrum
disorder (ASD) or ASD with language impairment, and their unaffected
siblings (total sample = 252).
• Both samples had significantly higher levels of BESD than a typically developing
population
• Language ability was generally not associated with behavioural difficulties in either
sample
• Behavioural difficulties were, by contrast, associated with low educational attainment.
• Children with ASD, whether or not they also had a language impairment, had higher
levels of BESD than those with SLI or the unaffected siblings.
• This pattern of relationships found in two very different samples suggests that the key
factors associated with behavioural difficulties are social communication (but not
structural language difficulties) and academic performance.
Parents’ Preferred Outcomes for their Children
• Ninety parents completed a survey to identify their priorities for their children who
ranged in ages from 4 months to 19 year;
• The children had a variety of difficulties including ASD (57%), learning difficulties
(44%), and expressive difficulties (40%); and attended a range of schools, including
mainstream (34%), special school (35%) and either an ASD (10%) or language (6%)
resource base.
• Over 90% of parents gave their priorities as independence, staying safe and
communication compared with only about a third specifying academic achievements.
• These results may reflect the sample characteristics but there was no difference
between parents of children with different types of difficulty in terms of their
prioritisation of independence and inclusion as important priorities.
• The study includes the need to assess and monitor these factors as well as
academic attainment if parents’ priorities for their children are to be respected.
10

Economic effectiveness Four stands of work have been developed. Interim findings are as follows:
• Comparison of service provision and social disadvantage for children with SLCN
across health and education sectors.
o The number of children identified with SLCN was higher in the education
system than the number of children referred for speech and language therapy
in the health system.
o The number of children with SLCN in primary but not secondary schools was
related to social disadvantage but use of NHS resources was related to social
disadvantage for both age ranges.
o The number of speech and language therapy staff was associated with the
level of SLCN in primary but not secondary schools.
• Review of the cost effectiveness literature related to provision for children with
primary speech and language difficulties.
o There is a dearth of studies: only five were identified and most compared
clinic-based and parent-administered interventions.
o It is important to include both education and health service costs where
applicable and to take account of the ‘costs’ of parental involvement.
• Estimating unit costs of speech and language therapy for children with primary
speech and language difficulties.
o Unit costs are commonly under-estimated, e.g. considering only salaries
rather than full costs.
o We identify four challenges to estimating unit costs and why such an
approach is important.
providing detailed descriptors
identifying the activities of the service and relevant unit of
measurement
estimating cost implications of all service elements identified
calculating the unit costs by totalling the costs of each service and
dividing this by the number of ‘units’ of interest.
• ‘Dosage’ and provision for children with SLCN: the relationship of effect size to
intensity duration and amount of intervention.
o We reanalysed the data from the 2003 Cochrane review
o Our conclusions are tentative at present; data from more studies are
necessary to confirm these indications, namely:
11

For interventions targeting phonology overall amount and intensity are
associated with effect size but duration is not, suggesting that
intensive interventions are likely to perform better than those of long
duration.
For improvements in syntax, the data suggest that duration is key;
longer, more drawn out interventions are more effective.
For improvements in vocabulary a third picture emerges from the data:
although longer duration brings better vocabulary outcomes, more
intensive intervention does not necessarily do so. This suggests that
regular short bursts of intervention over a longer period may be the
optimum model of service delivery for those aiming to promote
vocabulary development.
Prospective Study of SLT Services for Young Children who Stammer in England
• The study is just starting
• The difficulties of carrying out a complex study in a number of different health trusts
are explored
o Although the ethical approval was reasonably satisfactory, meeting Research
and Development Governance requirements was often problematic
• The experience so far suggests that there are major problems with the current
system which seriously weakens its fitness for purpose, reduces cost effectiveness
and efficiency of the research process and ultimately undermines the carrying out of
practice and policy relevant research.
Conclusions
This 2nd Interim Report provides a summary of work in progress and of completed work.
More detailed research reports will be produced over the next six months for each
project. In addition, a number of outputs will be produced with specific audiences and
purposes, for parents and young people with SLCN, policy makers, practitioners, and
commissioners.
12

1. INTRODUCTION
The 1st Interim Report was published in December 2010 and reported on the first phase of
the research programme. Five projects were described and their initial findings reported.
This 2nd Interim Report includes reports of the second phase of all five projects plus new
projects begun during 2010-11. In each case we present summary reports of the work to
date. In addition we have agreed with the Department for Education (DfE) to publish two
substantial reports of completed work, which is summarised here (see Sections 3 and 6).
Each section reports on a specific project. At the end of the BCRP (March 2012) we will
publish a final report which will comprise a thematic overview of results drawn from findings
across projects. The amount and detail of each section varies to reflect the stage of
development of the project and what was reported in the 1st Interim Report. Consequently,
Sections 3, 5 and 6 are more substantial.
Section 2 provides an interim report of the development of a checklist to identify
communication supportive classrooms. Based on a sound basis of research evidence, the
checklist has been piloted and will be further examined in the autumn 2011.
Anna Vignoles and her team have produced a second report based on the analysis of the
national education datasets (Pupil Level School Census and National Pupil Database). This
builds upon that reported earlier to investigate the transition made by pupils identified as
having SLCN or autism spectrum disorder (ASD) as they progress through the education
system. Their work explores the movement of pupils into and out of each classification, or
into another category of special educational needs (SEN) (e.g. moderate or specific learning
difficulties), or no longer to be considered to have SEN. A summary is provided in Section 3.
These movements are substantial and occur mainly at the transition from primary to
secondary school (key stage 2 to key stage 3). For example, of those who initially start
secondary school with non-statemented SLCN approximately one quarter move into the non-
SEN category, just under one fifth remain in the non-statemented SLCN category and a
further fifth move into another type of non-statemented SEN by key stage 3. There is less
movement, however, for those pupils identified as having ASD.
This study has also explored the relationship between school resourcing with movements for
pupils with SLCN or ASD and also the relationship with English as an Additional Language
13

(EAL): pupils who were identified as having SLCN on entry to secondary school, and also
had EAL, were much more likely to no longer have SLCN by 14 years than those who did
not have EAL. They tended to transfer out of SEN, into the non-SEN category, or to a lower
level of need.
In Section 4 we present the findings of a study of speech and language therapists’ practice.
This report builds on the interview study (1st Interim Report) to provide evidence from a
national survey of SLTs, focusing particularly on their interventions.
Section 5 presents more information from our prospective study of pupils with either primary
language difficulties (specific language impairment (SLI)) or autism spectrum disorder
(ASD). We are following children initially aged 6, 8, 10 and 12 over three years. In this
report, we present evidence of their language, literacy, social communication and socio-
emotional development. We also report on the support they are currently receiving in
schools. Central to this study is the examination of the distinctiveness or similarity of the
characteristics and needs of these groups of children and of the ways in which teachers then
try to meet those needs.
The study by Maggie Snowling and Charles Hulme and their team examined language and
literacy attainment during the Early Years Foundation Stage (EYFS) and key stage 1
(Section 6). Their focus concerns whether teacher assessment provides a valid assessment
of children’s current and future educational attainments. This study was commissioned not
only because of its intrinsic interest and importance but also because of the review of the
Early Years Foundation Stage (EYFS) led by Dame Clare Tickell and the recent interest in
early intervention exemplified by a number of reports addressing early intervention, e.g. two
from the review by Graham Allen2,3.
This report by Maggie Snowling and her colleagues is both important as a research study
and for what it contributes to the Government’s consideration of proposals for implementing
the recommendations of Tickell Review. The team show clearly that the EYFS Profile was
unnecessarily long and that a shorter version would be more appropriate. They also provide
strong evidence for the usefulness of a measure, focusing on language and literacy, and
show that language and literacy should be separate elements. We support the Tickell
2 Allen, G., (2011a), Early Intervention: The Next Steps; an independent report to Her Majesty’s Government, HM
Government, London 3 Allen, G., (2011b), Early Intervention: Smart Investment, Massive Savings. The Second Independent Report to
Her Majesty’s Government, HM Government, London
14

Review in arguing for a system of monitoring the progress of children through the Early
Years as a means of identifying those at risk of low educational attainment.
Early identification is important in order to ensure early intervention for children with
developmental language difficulties. Many areas in the UK have programmes of screening
combined with surveillance and monitoring over time, linked to intervention. This study
reinforces the importance of both rigorously validated measures and a holistic system rather
than a ‘one off’ screen. This is not about completing checklists for managerial and
accountability purposes. It is about supporting practitioners with well researched methods
and systems to optimise the support for young children.
Section 7 addresses the nature of behavioural, emotional and social difficulties (BESD)
experienced by children with SLCN. We know from earlier research that there is a great
prevalence of BESD among children with language difficulties but also that it is important to
examine the nature of these difficulties and how they change over time4. For example, peer
problems are a particular area for concern; hyperactivity is a concern with children at 8 years
but this reduces considerably as they become more mature. In this section we present the
findings from analyses of two different groups of children with SLCN, a mainstream
secondary school sample and a clinical sample to explore the issues. The main findings are
that both samples had significantly higher levels of behavioural difficulties than typically
developing children but these were not related to structural language, (vocabulary, syntax,
morphology etc.) but rather to social communication and educational attainment.
In Section 8 we report the final phase of our study of parents’ preferred outcomes for their
children. Importantly, we show that parents do not only stress academic outcomes:
independence, for example, is also valued.
Section 9 summarises our work on cost-effectiveness. The first stage was reported in
greater detail in our 1st Interim Report. We are now producing papers for publication in
journals to report the current work. However, we will also produce a further account in the
end of BCRP report next year.
Finally we report on the initial, setting up phase of a study of children who stammer (Section
10). Unfortunately, this was substantially delayed as a result of meeting the requirements of 4 Lindsay, G., Dockrell, J. & Strand, S. (2007). Longitudinal patterns of behaviour problems in children with specific speech and language difficulties: Child and contextual factors. British Journal of Educational Psychology, 77, 811-828.
15

the many different primary care trusts involved. This is a serious issue for this kind of
practice-based research. As a result, we are most grateful to the DfE for allowing this study
to continue to July 2012, beyond the March official end of the BCRP, so that it may be
completed properly.
We now enter the final months of the BCRP. As you will see from this report, we have a
number of studies continuing and due to end by March 2012, apart from the stammering
project which continues until July. We are also developing dissemination in conjunction with
The Communication Trust, the Royal College of Speech and Language Therapists, I CAN,
and Afasic. We will be presenting to the three regional Hello! conferences this autumn, as
part of the Year of Communication. We also hope to organise a conference to follow the
publication of the Final Report, around June 2012, based on the BCRP but also including
international experts.
16

2. COMMUNICATION SUPPORTING CLASSROOMS PROJECT Julie Dockrell, James Law, Ioanna Bakapoulou, and Sarah Spencer
2.1 Aims of the Study The growing number of children identified with Speech, Language and Communication
Needs (SLCN) has increased the demand on services, calling for a re-examination of the
ways in which speech, language and communication are supported for children across
health and education services. Although many children with difficulties continue to receive
individual assessment and intervention from speech and language therapists and language
specialist in schools, there is a move towards increasing the “communication friendliness” of
the classroom environment to provide quality first language learning environments. By
ensuring that classroom environments offer ‘quality first’ language learning opportunities, the
numbers of children identified with SLCN should be reduced and those referred to specialist
services should then be reduced to those who experience needs which do not respond to
good quality teaching. Such classroom environments should enhance the speaking and
listening skills of all children. These changes have involved the introduction of modifications
to classrooms and pedagogical techniques which are perceived to be of benefit to all
children irrespective of whether they have difficulties or not. The use of the term ‘friendly’
signals that staff in classrooms have put a range of specific processes in place which are
designed to support the development of communication skills.
The aim of this BCRP study is to capture evidence informed criteria which can be used to
identify communication supporting classrooms. The project has four objectives:
1. To review the evidence base underpinning elements thought to support
communication,
2. To identify key variables from the review and develop these into a Communication
Supporting Classrooms (CSC) framework, an observational checklist designed to
monitor classroom environments and learning spaces,
3. To test the extent it is possible to distinguish schools which purport to be
communication friendly and those which make no such claims,
4. To consider the possibility of developing such a framework into a training schedule.
17

2.2 What we have done
The project is designed in four phases. The first phase (February 2011) included a review
of all relevant published outputs related to supporting oral language so as to identify what is
already known about the concept of the communication supporting classroom. A two-stage
review model was used in order to identify appropriate literature. The first stage consisted of
identifying studies that met the review inclusion criteria (1. Study written in English; 2. Study
related to Foundation Stage and KS1 classroom practices; 3. Study is empirical and
evidence-based or a review of empirical studies). This narrowed the focus of the studies and
ensured that only relevant papers were reviewed. The second stage consisted of in-depth
review of selected studies in order to identify key elements and processes involved in
classroom environments which enhance language development. In addition to the literature
review, we also identified elements of supportive oral language practice highlighted in Ofsted
reports.
The second phase (March-May 2011) involved the development of an observational
checklist based on the evidence identified from the literature review (see section below on
Observation Checklist Development) and its piloting in a number of settings to ensure that it
would capture in a reliable way those resources, opportunities and practices which
contribute to the development of a language-rich environment for children. Pilot observation
sessions also included interviews with SENCOs about the checklist and school practices.
The third phase (June-July 2011) involved an empirical study collecting data from a range of
schools using the criteria identified in phases 1 and 2. Schools were visited during Summer
Term of the 2010-2011 academic year. The schools were identified through the Ofsted
reports, the Greenwich Speech and Language Therapy Service and through the charity
ICAN.
The fourth phase will repeat the observations in the autumn term of 2011-2012 academic
year to ascertain whether the initial observations were reliable and are capturing all aspects
of the classroom environment and the teaching and learning which occurs in these
classrooms. It is also anticipated that we will complete an evaluation, with pre and post
measures, of the Chance to Talk programme being used to train teachers to improve the
‘communication friendliness’ of their classroom in a number of school. We also plan to
provide training to school staff in using the Observation Checklist and examine the reliability
of school staff in completing it. Finally, more settings will be included in the main empirical
18
study; these are school settings which have either expressed interest in being involved in the
study or settings that have been identified through the charity ICAN.
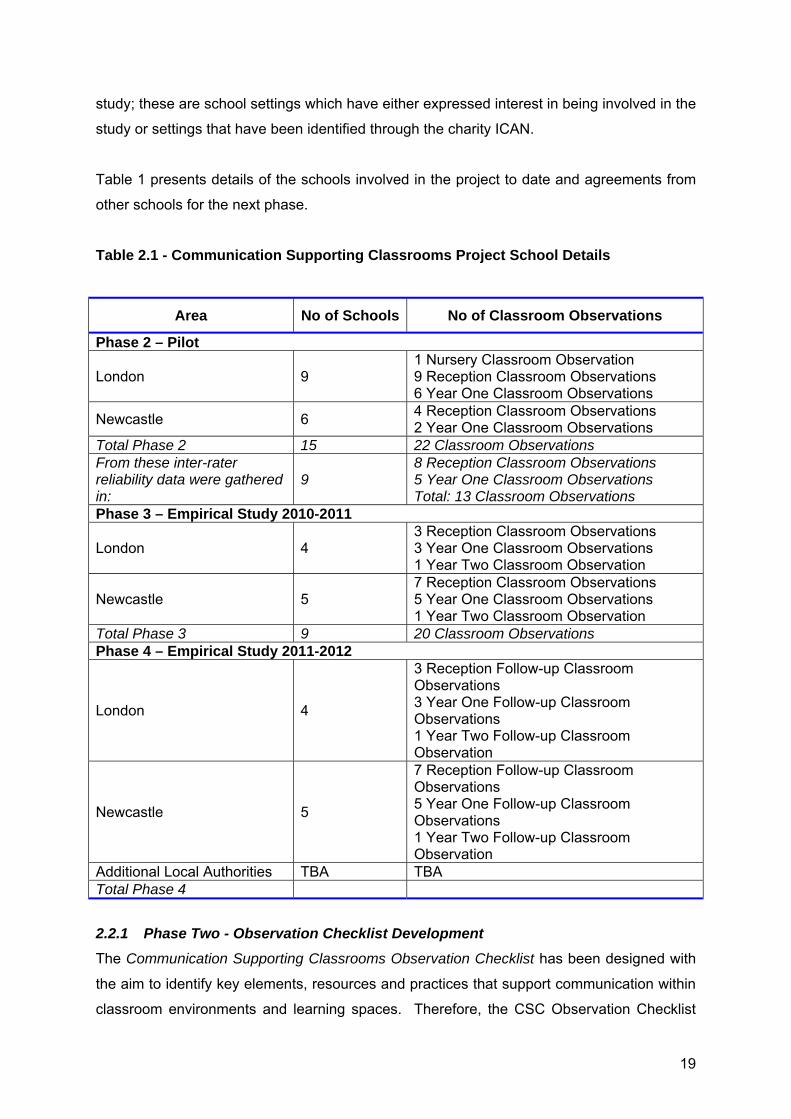
Table 1 presents details of the schools involved in the project to date and agreements from
other schools for the next phase.
Table 2.1 - Communication Supporting Classrooms Project School Details
Area No of Schools No of Classroom Observations
Phase 2 – Pilot
London 9 1 Nursery Classroom Observation 9 Reception Classroom Observations 6 Year One Classroom Observations
Newcastle 6 4 Reception Classroom Observations 2 Year One Classroom Observations
Total Phase 2 15 22 Classroom Observations From these inter-rater reliability data were gathered in:
9 8 Reception Classroom Observations 5 Year One Classroom Observations Total: 13 Classroom Observations
Phase 3 – Empirical Study 2010-2011
London 4 3 Reception Classroom Observations 3 Year One Classroom Observations 1 Year Two Classroom Observation
Newcastle 5 7 Reception Classroom Observations 5 Year One Classroom Observations 1 Year Two Classroom Observation
Total Phase 3 9 20 Classroom Observations Phase 4 – Empirical Study 2011-2012
London 4
3 Reception Follow-up Classroom Observations 3 Year One Follow-up Classroom Observations 1 Year Two Follow-up Classroom Observation
Newcastle 5
7 Reception Follow-up Classroom Observations 5 Year One Follow-up Classroom Observations 1 Year Two Follow-up Classroom Observation
Additional Local Authorities TBA TBA Total Phase 4
2.2.1 Phase Two - Observation Checklist Development
The Communication Supporting Classrooms Observation Checklist has been designed with
the aim to identify key elements, resources and practices that support communication within
classroom environments and learning spaces. Therefore, the CSC Observation Checklist
19

aims to provide schools with a profile of their strengths and, as appropriate, areas for
improvement. The CSC Observation Checklist is applicable in Reception, Year 1 and Year 2
but could also be used in early years settings. As an observation checklist, it is designed to
be used in an observation of a classroom or a learning space during a regular classroom
session. The average length of time necessary to collect a representative sample of
behaviour is one hour with an additional 20 minutes prior to the observation period to
become familiar with the classroom setting and available resources.
The CSC Observation Checklist is divided into three dimensions:
• Language Learning Environment: This dimension involves items related to the
physical environment and learning context
• Language Learning Opportunities: This dimension involves items related to the
structured opportunities that are present in the setting to support children’s language
development
• Language Learning Interactions: This dimension involves items related to the ways in
which adults in the setting talk with children
The CSC Observation Checklist includes elements which refer both to effective pedagogy,
teaching and learning as well as language specific aspects. Both good classroom
environments and effective pedagogy are seen as prerequisites for providing the appropriate
context to support oral language. There is a brief guidance document with the CSC
Observation Checklist which provides exemplars of the relevant categories.
The CSC Observation Checklist does not assess individual children and as such can provide
an indication only that the language information collected meets what would be seen as
good quality first practice and, as such, should capture a Tier 1 measure of a response to
intervention model for language and communication.
An expert advisory group was sent the CSC Observation Checklist, prior to piloting and
provided feedback on the content and presentation of the tool. The advisory group included
speech and language therapists, education staff and researchers. Their comments were
taken into account to further refine the checklist before piloting.
2.2.2 Phase Two - Pilot
From March to May 2011, the CSC Observation Checklist was piloted in a number of
settings. Initially, we tested the CSC Observation Checklist in a range of different schools in
order to refine it as a measurement tool, consider issues related to its use and develop a
20

guidance that would facilitate education staff into using it appropriately. In the second phase
of piloting, we examined issues of reliability of the checklist. Fifteen schools were visited in
the second phase of the study, and data were gathered in nine of them to establish inter-
rater reliability for each dimension of the CSC Observation Checklist both as per item as well
as for the overall ‘score’.
Selection of Settings
The schools involved in the second phase of the pilot were selected based on the following
criteria:
a) Exclusionary criteria – we excluded any schools with associated language unit
resources, specialised centres (e.g. ICAN), Dyslexia friendly schools or schools
under special measures (Ofsted),
b) Schools were chosen to reflect national averages for statements of SEN and
educational attainments.
2.2.3 Phases Three and Four – Empirical Study
The third and fourth phases involve an empirical study collecting data from a range of
schools using the criteria identified in phases 1 and 2.
- Nine schools were visited during Summer Term of the 2010-2011 academic year and
twenty classroom observations were conducted. The schools have been identified as
‘good practice’ schools through the Ofsted reports, the Greenwich Speech and
Language Therapy Service and through the charity ICAN.
- Repeated observations in the same twenty classrooms will be conducted in the
autumn term of 2011-2012 academic year to examine changes within classroom
environments and in order to ascertain whether the CSC Observation Checklist could
capture all aspects of the classroom environment and the teaching and learning
which occurs in these classrooms.
- In the Autumn Term of 2011-2012 academic year, training will be provided to school
staff in using the Observation Checklist to examine the reliability of school staff in
completing it.
- Finally, more settings will be included in the main empirical study; these are school
settings which have either expressed interest in being involved in the study or
settings that have been identified through the charity ICAN. Classroom observations
for these settings will take place at the beginning of the Autumn Term 2011 and
follow-up observations will take place at the end of the term before Christmas.
21

Observation Checklist Reliability and Differentiation of Schools
The classroom observations listed above were planned as a way of ensuring that the CSC
Observation Checklist is a reliable measurement of the communication environment but also
in order to test the extent it is possible to distinguish schools which purport to be
communication friendly and those which make no such claims. To that extent, observation
checklist reliability and differentiation of school practices will be established in the following
ways:
• Inter-rater reliability: As part of the pilot, inter-rater reliability was established for
each dimension of the CSC Observation Checklist both as per item as well as for the
overall ‘score’.
• Over time: As part of the empirical study, classroom observations will be repeated
from Summer Term 2011 to Autumn Term 2011 and for the new settings involved in
the study in September 2011, classroom observations will be repeated before and
after half-term (Autumn Term 2011) in order to examine features of the environment
that change.
• School v. Class: As part of the empirical study, observations took place in different
classes from the same school to address consistency in settings.
• Between Professionals: As part of the empirical study, following training of school
staff, classroom observations will be repeated by school SENCOs to examine
reliability between professionals.
2.3 What we have found
In Phase Two, 13 classroom observations were conducted with the aim of piloting the CSC
Observation Checklist. These revealed that inter-rater reliability for the CSC Observation
Checklist was consistently high, with greater than 83% agreement between raters for the
dimension of the Language Learning Environment being achieved for 12 of the 13
observations. This was also the case for the presence of Language Learning Opportunities
where agreement between raters was higher than 71% for 11 of the 13 observations and
Language Learning Interactions where agreement between raters was higher than 84% for
12 of the 13 observations. Reliability for the frequency of Language Learning Interactions
was lower but achieved acceptable levels for the majority of the observations. We are
currently considering ways of increasing the reliability of the checklist’s dimension of
Language Learning Interactions as these are seen as key to supporting the development of
22

language and communication. In Phase Three, twenty initial classroom observations were
conducted and these will be repeated in the Autumn Term 2011 to address stability in the
schools.
2.4 What we are doing next
1. Ranking the evidence. The CSC Observation Checklist is evidence informed. In
August 2011, the Senior Research Fellows working on the project will undertake an
additional task of scaling the evidence underpinning the CSC Observation Checklist
as per typical evidence based studies, and will subsequently highlight the items with
a strong evidence base as key features.
2. Phase 4 Follow-Up Observations. From September 2011 to December 2011, we will
return to each of the nine schools to repeat the observations in order to address
stability in the schools and the reliability of the CSC Observation Checklist.
3. Phase 4 New Schools. A number of new schools will be visited before half-term in
the Autumn Term 2011 to conduct classroom observations.
4. Phase 4 Follow-Up Observations of New Schools. We will return to the new schools
after half-term in the Autumn Term 2011 to repeat the observations conducted at the
beginning of the term.
5. Phase 4 Staff Training. We will provide training to school staff in appropriate use of
the CSC Observation Checklist.
6. Phase 4 School Staff Conducting Observations. Following training, school staff will
be asked to conduct observations in the same classrooms that the research team
has visited to ensure reliability of the tool used between professionals.
23

3. A FURTHER INVESTIGATION OF PUPILS WITH SPEECH, LANGUAGE AND COMMUNICATION NEEDS (SLCN) AND AUTISM SPECTRUM DISORDER (ASD) Elena Meschi, John Micklewright and Anna Vignoles
3.1 Aims of the Study We have carried out two studies of pupils with speech, language and communication needs.
This second study also includes pupils with Autism Spectrum Disorder (ASD). This section
summarises the second study, but also includes some material from the first study5. A full
report of this second study will be published in parallel with the Final Report in 2012.
In this report we consider the transitions made by children who have been identified by the
school system as having Speech, Language and Communication Needs (SLCN) or Autism
Spectrum Disorder (ASD) as they progress through the education system. Specifically, we
explore the following questions:
• How does the proportion of children identified as having SLCN vary over time and by
age?
• How does the proportion of children identified as having ASD vary over time and by
age?
• What are the characteristics of individuals who make transitions into and out of both
the SLCN and the ASD category of need during secondary school?
• How does having English as Additional Language relate to the likelihood of a child
having been identified as ever being SLCN, as well as the likelihood of them moving
out of the SLCN category?
• Do different types of schools have very different proportions of children identified as
having SLCN and ASD and do these pupils make different transitions in different
school contexts?
Key Findings
• Although clinical studies have generally not suggested that having SLCN is strongly
related to socio-economic background, we find that in the English school system, it is
5 Lindsay, G., Dockrell, J.E., Law, J., Roulstone, S., & Vignoles, A. (2010) Better communication research programme 1st interim report. London: DfE. http://publications.education.gov.uk/eOrderingDownload/DFE-RR070.pdf. The whole report is available on the BCRP website [add URL]
24

certainly the case that young people who are socially disadvantaged are much more
likely to be identified as having SLCN.
• We also found evidence of some conflation of Speech, Language and
Communication Needs and the needs associated with having English as an
additional language (EAL).
• Interestingly when pupils who initially had SLCN changed their category of primary
need in secondary school, they were most likely to be identified as having moderate
or specific learning difficulties NOT behavioural, emotional or social difficulties.
3.2 What we have done In this report we analyse the characteristics and SEN status of multiple cohorts of children.
We describe the characteristics of pupils who transition into and out of the SLCN and ASD
categories of SEN over time and by age. This will be of interest in itself and will also improve
our understanding of the relative achievement of these groups.
Methodological Approach Our previous research shows that the dynamic nature of the special educational needs of
pupils with SLCN and ASD is an important issue.
• At the age of 7 years, 3% of children have been identified as having Speech,
Language and Communication Needs (SLCN), whilst 0.8% have been identified as
having Autism Spectrum Disorder (ASD).
• Yet the proportion of pupils who have been identified as having these particular
special educational needs changes markedly with age.
• The proportion identified with SLCN falls to around 0.6% of 16 year olds and the
proportion with ASD increases to around 1% at the beginning of secondary school
and falls to 0.7% by age 16.
This report specifically investigates these transitions made by pupils into and out of different
categories of SEN (or indeed into and out of the no SEN category). We focus on a sample of
pupils who have at some point in time been identified as having either SCLN or ASD.
We use system wide English administrative data (the Pupil Level School Census: PLASC)
which tells us whether a student has been identified as having SLCN or ASD, (or any other
25

category of special educational needs) as well as providing us with other important
information on student and school characteristics.
We undertake multivariate analysis to determine the pupil level and school level factors that
are statistically associated with making a positive transition from the SLCN category into
another SEN category, such as a different primary special need, no special needs at all or a
lower level of special need.
Caveats Our data is administrative and collected for non research purposes6. This leads to some
limitations in the analysis. Most crucially, we lack clinical information on the needs of
children. We can therefore only determine whether the child has been identified as having
particular special educational needs by the school system and we acknowledge that it is
highly likely that some children with SLCN or ASD needs may not have had them identified
in our data.
3.3 What we have found
3.3.1 The prevalence and characteristics of those with SLCN/ASD
In our 1st Interim Report we reported that the prevalence of reported SLCN reduced with age
and that this occurred mainly during key stage 2 with a lower rate of decrease during key
stages 3 and 4. Furthermore, this reduction was essentially a function of fewer pupils at
school action plus: the prevalence of pupils with statements where SLCN was the primary
need was relatively stable across the age range (Figure 3.1).
In this report we extend our analysis further to include pupils with ASD (Figure 3.2) and to
examine the relationship between identification as having SLCN or ASD and several other
factors including having English as an additional language (EAL).
Prevalence rates over ages 7 – 16 years First we examine the patterns of prevalence by age. Figures 3.1 and 3.2 present these data
for pupils with SLCN and ASD respectively for ages 7-16 years. These distinguish 6 State schools in England are required to complete the School Census each term. This includes specifying whether a pupil has i) special educational needs with a statement or at School Action Plus, in which case the category of SEN for the primary need must be specified (e.g. SLCN or ASD); ii) special educational needs at School Action, which are unclassified, or iii) does not have SEN.
26

prevalence of pupils with a statement of special educational needs from those at the lower
level of School Action Plus, where support is provided from outside professional(s) but the
pupil has not been made the subject of a statement. For SLCN, as reported in the 1st Interim
Report, prevalence is just under 3 per cent of pupils at 7 years dropping to about 0.5 per
cent at 16 years whereas for ASD overall prevalence is much lower and remains relatively
stable at about 0.65 per cent.
Figure 3.1: Prevalence of SLCN across ages, by SEN status
Figure 3.2: Prevalence of ASD across ages, by SEN status
The prevalence rates also show very different characteristics. The rates for pupils with SLCN
at School Action Plus are much higher than those with statements at 7 years. However,
27

whereas the rate for pupils with statements remains stable, that for pupils with SLCN at
School Action Plus drops considerably between 7 and 12 years, before flattening. The
prevalence for pupils with ASD is very different in that, first there are consistently more
pupils with statements than at School Action Plus and second the School Action Plus
trajectory increases between 7 and 12 years before reducing; the prevalence for pupils with
statements is similar to that for the SLCN group, approximately flat with a small increase to
11-12 years and then a slight downward trend to 16 years.
Prevalence and social disadvantage and EAL
The likelihood of being identified as having SLCN or ASD differs amongst different types of
children.
• Young people who are socio-economically disadvantaged or who have English as an
additional language (EAL) are most at risk of being identified as having SLCN (at age
11, key stage 2). This is particularly true for non statemented SLCN. The risk of
having SLCN is not high however, even for these groups, since only 3% of the school
population are ever identified as having SLCN (at School Action Plus or with a
statement).
• Other research has indicated that some conditions that result in SLCN are not
socially graded, such as stammering. Yet in the school system, it is the case that the
likelihood of being identified as having SLCN is socially graded. This discrepancy
may therefore either reflect parents’ differing willingness to identify their child’s needs
or a tendency for schools to be more likely to identify SLCN needs in low SES
children (or both).
• By contrast, being socio-economically disadvantaged or having English as an
Additional Language are not major risk factors for occurring identified as having ASD
at key stage 2.
• Low achievement is a risk factor for both SLCN and ASD groups but pupils identified
as having SLCN are lower achieving as compared to those with ASD.
3.3.2 Movement into and out of categories of SEN
We found significant movement of pupils during secondary school into and out of the
categories of SLCN and ASD, with most movement occurring between primary and
secondary school (key stage 2 to 3).
28

• Of those who initially start secondary school with non-statemented SLCN,
approximately one quarter move into the non-SEN category, just under one fifth
remain in the non-statemented SLCN category and a further fifth move into another
type of non-statemented SEN by key stage 3.
• Hence many pupils move from the SLCN category of need into another type of SEN
category of need during secondary school. We found the most common categories
for pupils to move into were the categories of Moderate Learning Difficulties (MLD)
and Specific Learning Difficulties (SpLD).
We found less movement of pupils identified as having ASD. Those initially identified as
having non statemented ASD are more likely to remain in that category by key stage 3 than
was the case for pupils with SLCN.
• Of those who start secondary school identified as having ASD, 41% remain in this
category of need by the end of key stage 3.
• Those initially identified as having non-statemented ASD and who move to another
type of SEN category of need are most likely to move into Behavioural, Emotional
and Social Difficulties (BESD) and Moderate Learning Difficulties (MLD).
• For those who initially had a statement for ASD, the most common category to move
into is MLD, followed closely by SLCN.
Another striking result was that pupils who were identified as having SLCN on entry into
secondary school, and also had English as an Additional Language, were much more likely
to no longer have SLCN by age 14 than those who did not have EAL. Such pupils were
much more likely to make a positive transition during secondary school into either the non-
SEN category or to a lower level of need, namely unspecified school action SEN. Hence
some EAL pupils are identified as having SLCN in primary school but this apparent need
does not persist into secondary school. There are several possible factors at play here. This
could imply some confusion about the needs of children who have EAL in primary school,
some of whom may have been categorised as having SLCN (i.e. ‘a special educational
need’) when their primary need related to the fact that they have English as an Additional
Language. As they progress through the English speaking environment of school their use of
English improves sufficiently to access the academic curriculum without additional support.
Another possibility is that their needs change with age: whereas at KS1 and 2 oral language
is seen as a primary need, as the pupil moves through the school system the increasing
demands of the curriculum come into play
29

Perhaps unsurprisingly, we found that pupils who are succeeding at school and have higher
achievement are more likely to make a positive transition from SLCN or ASD into either no
special needs at all or unspecified school action SEN. Lower achieving pupils are by contrast
more likely to exit SLCN and ASD into another different type of SEN.
3.3.3 The School Context
We wanted to determine whether pupils at certain types of school had a higher chance of
making a positive transition during secondary school, moving out of the categories of SLCN
or ASD for example.
Children who are identified as having SLCN or ASD may however, enrol in particular types
of school. Certainly pupils with some special education needs may not have a genuine
choice of school and rather than pupils choosing a particular secondary school, it may be
that schools de facto select which pupils they admit.
Some but by no means all school characteristics were associated with statistically significant
differences in the likelihood of pupils making positive transitions during secondary school.
We focused particularly on the following school characteristics: a) total funding per pupil at
the school, b) SEN funding per child identified as having SEN at the school and c) pupil
achievement on entry into the school. We found that:
• Pupils identified as having SLCN and who attend better funded schools are not
more likely to make a positive transition out of SLCN, as compared to those
attending less well resourced schools.
• Pupils identified as having ASD and who attend better resourced schools are
slightly more likely to move out of SEN altogether or move to another category of
SEN as compared to those who remain in the ASD category.
• Counter intuitively, attending a school with a higher level of expenditure on SEN
is not associated with positive transitions. In fact pupils attending schools with
higher per capita expenditure on SEN are actually less likely to exit the
SLCN/ASD categories. This may mean that pupils who have major and persistent
SLCN/ASD are more likely to choose schools with higher levels of SEN funding
and such pupils are less likely to make a positive transition out of these
categories. Such a result could also suggest that schools with more funding for
SEN are more likely to identify children as having special educational needs: if
30

• Pupils attending higher achieving schools, with above average key stage 2 test
scores, are somewhat less likely to make a positive transition out of the SLCN
category. This may again mean that pupils with persistent SLCN who are less
likely to make a positive transition are also more likely to choose schools that
have higher achievement levels or, more likely, that such schools are more likely
to identify pupils as having SLCN.
• Pupils attending higher achieving schools are however, more likely to make a
positive transition from ASD to non-SEN. Attending a higher achieving school is
associated with being more likely to make a positive transition for ASD pupils but
not for pupils identified as having SLCN.
• Lastly, pupils in socio-economically deprived schools, with a larger proportion of
pupils eligible for free school meals (FSM) for example, are no more or less likely
to make positive transitions out of SLCN/ASD than those in socio-economically
advantaged schools.
3.4 Policy implications We shall be drawing together the policy implications from the BCRP in our final report; the
following are specific to the present project at this stage.
Pupils’ special educational needs, particularly in the case of SLCN, are quite dynamic and in
particular change during the course of secondary school. It is important that funding
decisions and indeed monitoring of pupils takes this fluidity of need into account.
Further research is needed into whether there is systematic misidentification of children’s
needs in primary school, specifically if those with English as an Additional Language often
have their needs mistakenly identified as SLCN. It could also be that their needs are
underestimated in secondary education.
In general terms, these administrative data can be effectively used to monitor common
transitions made by pupils who are initially identified as having SLCN or ASD. This will help
31

determine whether some common trajectories exist and hence enable better support for
such pupils to be devised.
We did not find a strong and systematic relationship between school quality (whether
measured by school funding levels, SEN funding or pupil achievement) and the likelihood of
individuals making positive transitions out of SLCN or ASD. This may be unsurprising given
the myriad factors that might influence the schools attended and transitions made by such
pupils.
32

4. INTERVENTIONS FOR CHILDREN WITH SPEECH, LANGUAGE AND COMMUNICATION NEEDS (SLCN) IN ENGLAND: A SURVEY OF SPEECH AND LANGUAGE THERAPISTS
Geoff Lindsay1, Yvonne Wren2, Ioanna Bakapoulou1, Susan Goodlad1 and Sue Roulstone2
1 University of Warwick, 2Frenchay Hospital, Bristol
4.1 Aims of the Study
This survey is part of a large project within the BCRP to examine ‘best practice’. This
comprises two parallel themes:
• A review of the research literature. The purpose of this stream was to identify the
evidence available for interventions for children and young people with primary
speech and language difficulties.
• A review of professional practice to explore intervention methods adopted by
practitioners and the evidence base for these approaches.
4.2 What we have done
In the 1st Interim Report7 we reported on the initial stages of both streams. With respect to
the second stream, we reported the interviews undertaken with managers from speech and
language therapy services and educational psychology services in 14 areas of England. In
this report we build upon the information produced and insights gained in Phase 1. We
present the results of a national survey of speech and language therapists (SLTs).
Design
We used a sequential two phase combined methods design. Phase 1 comprised interviews,
Phase 2 comprised an online survey. This report focuses mainly on the SLT survey: see the
1st Interim Report for the results from the interviews.
Methods
i) Interviews: Semi-structured interviews were conducted with 13 SLT and 10 school
psychological service managers from a 10% sample of local authorities/ health trusts, after 7 Lindsay, G., Dockrell, J.E., Law, J., Roulstone, S., & Vignoles, A. (2010) Better communication research programme 1st interim report. London: DfE. http://publications.education.gov.uk/eOrderingDownload/DFE-RR070.pdf
33

informed consent; average 90 minutes duration. We used main questions supported by
probes for further exploration, optimising both detailed, locally relevant responses and
consistent coverage of topics. The process was iterative; each interview was informed by
those beforehand.
ii) Survey: Analysis of the interviews identified key themes which were used to construct the
online questionnaire for SLTs working with children. The survey aimed to provide a profile of
practice and identify the range of interventions used. Distribution was facilitated by the Royal
College of Speech and Language Therapists.
iii) Participants: A total of 576 SLTs responded to the survey, 27 of whom were filtered out
as they did not work with children and young people, nor did their role involve training others
to work with children. A further 13 were excluded from the core questions; instead they were
routed to a section specifically designed for those involved only in training others to work
with children and young people with SLCN. Given the small number of respondents in this
category, their data will be analysed separately and presented in the final report.
iv) Procedure: The main method used in the survey was to ask SLTs to think of the three
most commonly used interventions and then to drill down, one at a time, to examine these in
detail. We explored use of published programmes, intervention activities, and
principles/approaches. We are able to cross reference findings by age and primary need of
the children for whom these are used. Other data include delivery (frequency and timescale),
the outcome data gathered and whether these were reported within their service, allowing
overall monitoring of outcomes and effectiveness. Hence the data relate to each SLT’s most
frequent practice.
v) Analysis
Thematic analysis of interviews was shaped initially by pre-determined categories,
developed as emergent themes were identified. Data from the questionnaires were analysed
descriptively using SPSS v18.
34

4.3 What we have found 4.3.1 Most common patterns of work:
Age: the most common age reported was 5-7 year old children (28% SLTs). Also, a total of
75% of SLTs reported their most common age ranges were within the broader 2-7 years
range (Table 4.1).
Table 4.1 Age of child with whom the SLT most frequently worked (% SLTs)
Age group n %
Under 2 yrs 17 3.2
2-3 yrs 114 21.3
4-5 yrs 133 24.8
5-7 yrs (Key stage 1) 152 28.4
7-11 yrs (Key stage 2) 75 14.0
11-14 yrs (Key stage 3) 38 7.1
15+ yrs (Key stage 5) 7 1.3
N = 536
Primary need: Primary SLCN with language as the primary difficulty was the most common
area reported (36%). Primary SLCN with speech as the primary area was reported by 19%
and Autism Spectrum Disorder (ASD) by 11.4% (Table 4.2)
35

Table 4.2 Primary need with which the SLT most frequently worked (% SLTs)
SEN category n %
Primary Speech Language and Communication needs with language as the primary difficulty
193 36.0
Primary Speech Language and Communication needs with speech as the primary difficulty
104 19.4
Autism Spectrum Disorder
61 11.4
Severe Learning Difficulties
39 7.3
Specific Learning Difficulties (e.g. dyslexia, dyspraxia)
31 5.8
Primary Speech Language and Communication needs with communication /interaction as the primary difficulty
30 5.6
Moderate Learning Difficulties
27 5.0
Profound and Multiple Learning Difficulties
17 3.2
Hearing Impairment
13 2.4
Physical Difficulties
9 1.7
Behavioural, Emotional and Social Difficulties
8 1.5
Multi-Sensory Impairment
4 0.7
N = 536
Main setting: Mainstream schools were reported most frequently (35%) followed by
community clinics (17%) and special schools (12%) (Table 4.3).
36

Table 4.3 The setting in which the SLT most frequently worked
Setting n %
Children’s centre 32 6.0
Pre-school/nursery 35 6.5
Community clinic 91 17.0
Mainstream school 190 35.4
Child development centre 23 4.3
Resource base 38 7.1
Special school 66 12.3
Home and Leisure clubs 29 5.4
Specialist assessment centre 12 2.2
Independent practice 7 1.3
Language resource base, specialist
language unit
3 .6
Mainstream 2 .4
Setting other than listed 8 1.5
N = 536
When respondents chose ‘Setting other than those listed’, they were asked to specify the
setting. This generated 54 comments, almost half of them (22) mentioned working from
home (either the child’s or practitioner’s). Where possible the comments were re-coded into
the categories listed, leaving only 8 unclassified.
Prevalence of interventions
We explored the use of published programmes, intervention activities and principles or
approaches to intervention that SLTs use most often. We report here the percentages for
‘sometimes’ + ‘frequently’. The order of this combined prevalence closely matched that for
‘frequently’ alone.
Programmes: A total of 38 programmes were specified. These include a mixture of
those which comprise a published kit including a manual and others based on published
papers in journals. The most frequently reported programmes used were:
• Derbyshire Language Scheme (65% SLTs)
• Makaton (58%),
37

• Nuffield –dyspraxia (47%)
• Core Vocabulary (40%) and
• Hanen (39%)
A full list of the programmes is provided in Appendix A1, Table A1.
Service developed programmes: In addition 126 programmes were specified that the
SLTs reported as having been developed by the service (or another service). Over a quarter
of respondents (28%) reported using these. In addition, a further 163 ‘Other published
programmes’ were also mentioned but with no specification by name.
Intervention activities: Eleven different intervention activities were used by the
SLTs.(see Appendix A2 for details) The main methods were:
• Phonological awareness tasks (67%)
• Barrier games (66%)
• Auditory discrimination activities (64%)
• Auditory memory activities (62%)
• Narrative therapy (59%).
When asked to specify other intervention activities frequently used, 133 other activities were
mentioned.
Principles/approaches: A total of 26 different principles/activities were specified. These
included broad approaches such as creating a language rich environment and differentiating
the curriculum; general approaches such as use of signing and total communication; and
more specific methods such as the use of forced alternatives. Overall, the most commonly
used were:
• Modelling (95%)
• Forced alternatives (84%)
• Repetition (84%)
• Visual approaches to support language (83%)
• Reducing distractions (82%)
A full list of principles and approaches is provided in Appendix A3.
38

4.3.3 Prevalence of interventions by main types of SLCN
Prevalence varied for children with different primary SLCN; the most commonly used
programmes for children with primary language difficulties, primary speech difficulties and
ASD are presented in Table 4.4.
Table 4.4 . Most commonly used programmes (% SLTs)
Primary Language n=193
Primary speech n=104
ASD n=61
Derbyshire Language Scheme
75 51 57
Nuffield – dyspraxia
72
Makaton
58 51 59
Hanen
45
Core Vocabulary
44
Language for Thinking
43
Colourful Semantics
42
Social Stories
71
Metaphon
41
Picture Exchange Communication System
72
Intensive Interaction 61
4.3.4 Intervention delivery
Model:
• 22% SLTs reported that they personally deliver the intervention most frequently but
ask others to carry out follow up activities
• 42% SLTs deliver it most regularly but others deliver it more frequently between visits
• 29% SLTs deliver it occasionally for the purpose of demonstrating to other(s) how
they should deliver the intervention on a more frequent basis
• 6% SLTs reported that others deliver it following SLT advice.
Frequency: The most common frequency of delivery of an intervention by the SLT was
weekly (48% SLTs), about four to five times more than SLTs who reported the next most
39

common frequencies of once every 6 weeks (12%), once a fortnight (10%) and 2-3 times a
week (10%) – see Table 4.5. (See Appendix A4 for more details).
Table 4.5 Frequency of delivery of intervention (% SLTs)
Frequency of delivery n %
Throughout the day 32 6.4%
Once a day 5 1.0%
Two or three times a week 49 9.8%
Once a week 238 47.5%
Once a fortnight 50 10.0%
Once a month 41 8.2%
Once a term (6 weeks) 58 11.6%
Once a double term (3 months) 23 4.6%
Less than once a double term 5 1.0%
N = 501
Timescale: The timescale over which interventions are delivered varied between SLTs.
However, as shown in Figure 4.1, six weeks or more was most likely for the large majority
(89%) of the sample: 34% carried out an intervention for 6 weeks; 25% for 3 months and
almost a third of SLTs (30%) carried out interventions lasting a year or more.
Figure 4.2 Length of time for the delivery of intervention
40

4.3.5 Support for interventions Those who indicated that they received support delivering interventions were asked who
would usually provide the support. Responses in Table 4.6 show that it is usually provided
by a teaching assistant (45%) or a parent (34%).
Table 4.6 Person providing support for the SLT for the intervention (% SLTs)
Supported by: n %
Parent 180 34.0
Teacher 59 11.1
Nursery nurse 32 6.0
Teaching assistant 238 44.9
Other 21 4.0
N = 530 The frequency of support varies in Table 4.7, but is most commonly provided throughout the
day (41%), or two/ three times a week (34%).
Table 4.7 Frequency of support (% SLTs)
Frequency of support n %
Throughout the day 215 40.8
Once a day 78 14.8
Two or three times a week 181 34.3
Once a week 43 8.2
Once a fortnight 2 0.4
Once a month 3 0.6
Once a term (6 weeks) 4 0.8
Once a double term (3
months)
0 0.0
Less than once a double term 1 0.2
N = 527
4.3.6 Outcome data
Measures of broad outcomes: When undertaking their most frequently used
intervention, the most common broad outcome measures used (% SLTs) were clinical
judgement (89%) or the opinions of other practitioners, e.g. teachers, or the parents (75%)
41

(respondents were invited to select all that were applicable) – see Table 4.8. Just under half
reported using criterion based measures such as checklists or standardised (norm
referenced) tests, with 12% reporting the use of curriculum based assessments (e.g. SATs).
Table 4.8 Measures of broad outcomes used by SLTs
Method of measurement n %
Clinical judgment 479 89.4
School or nursery staff/parent opinion 404 75.4
Criterion based measures (e.g. checklists) 258 48.1
Standardised (norm referenced) tests 252 47.0
Curriculum based assessments (e.g. SATs) 62 11.6
N = 536
Broad based outcomes: Improved communication skills was the most commonly reported
target outcome for SLTs (78%) when using the interventions that they used most frequently,
followed by improved language skills (70%), as shown in Table 4.9. (Respondents were
invited to select all that were applicable.)
Table 4.9 Frequency of broad based outcomes
Target outcome n %
Improved communication skills 417 77.8
Improved language skills 375 70.0
Improved speech sound skills 184 34.3
Improved fluency 58 10.8
Other 298 55.6
N = 536
Specific outcomes: We also asked for details of specific outcomes that the SLTs used.
Again, respondents were invited to select all that were applicable. The most frequently
reported outcomes for each domain were as follows.
• Communication: attention and listening skills (76%), communication skills e.g. use of
non-verbal cues, initiating (74%)
• Language: expressive language (90%), understanding of language (90%),
• Speech sound system: intelligibility (90%), phonological awareness (73%)
42
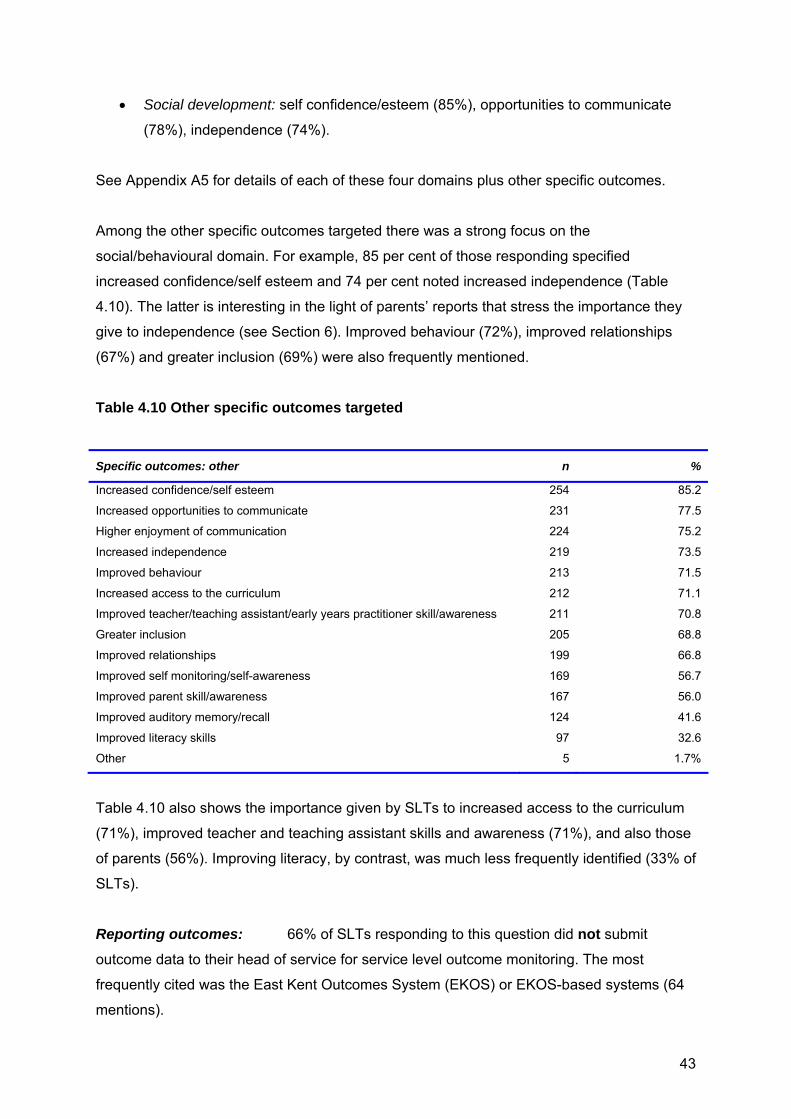
• Social development: self confidence/esteem (85%), opportunities to communicate
(78%), independence (74%).
See Appendix A5 for details of each of these four domains plus other specific outcomes.
Among the other specific outcomes targeted there was a strong focus on the
social/behavioural domain. For example, 85 per cent of those responding specified
increased confidence/self esteem and 74 per cent noted increased independence (Table
4.10). The latter is interesting in the light of parents’ reports that stress the importance they
give to independence (see Section 6). Improved behaviour (72%), improved relationships
(67%) and greater inclusion (69%) were also frequently mentioned.
Table 4.10 Other specific outcomes targeted
Specific outcomes: other n %
Increased confidence/self esteem 254 85.2
Increased opportunities to communicate 231 77.5
Higher enjoyment of communication 224 75.2
Increased independence 219 73.5
Improved behaviour 213 71.5
Increased access to the curriculum 212 71.1
Improved teacher/teaching assistant/early years practitioner skill/awareness 211 70.8
Greater inclusion 205 68.8
Improved relationships 199 66.8
Improved self monitoring/self-awareness 169 56.7
Improved parent skill/awareness 167 56.0
Improved auditory memory/recall 124 41.6
Improved literacy skills 97 32.6
Other 5 1.7%
Table 4.10 also shows the importance given by SLTs to increased access to the curriculum
(71%), improved teacher and teaching assistant skills and awareness (71%), and also those
of parents (56%). Improving literacy, by contrast, was much less frequently identified (33% of
SLTs).
Reporting outcomes: 66% of SLTs responding to this question did not submit
outcome data to their head of service for service level outcome monitoring. The most
frequently cited was the East Kent Outcomes System (EKOS) or EKOS-based systems (64
mentions).
43

4.4 Discussion of findings Speech and language therapists working with children engage with a wide range of young
people with respect to age and type of SLCN although individual SLTs have more specific
focus. The most common work reported was with children 2-11 years, especially 4-7 years,
with primary language and/or speech difficulties but there is a wide range of practice; e.g.
children with ASD, specific learning difficulties (primarily literacy/dyslexia) and those with
moderate learning difficulties.
There are some with evidence, for example the Picture Exchange Communication System
(PECS) and Hanen, Early Language Parent Programme, which have strong evidence of
efficacy with specified participants, including randomized control trials but as indicated by
part 1 of this study (Lindsay et al, 2010) the evidence from others is more limited. For
example we consider the evidence for the Derbyshire Language Scheme ‘indicative’. On the
other hand, there is a much stronger evidence base for specific activities, principles and
approaches e.g. modelling techniques for expressive language and behavioural techniques
for improving phonological awareness.
This reflects the patch nature of research evidence rather than shortcomings by SLTs. The
evidence from the interview phase, along with the proliferation of locally developed
programmes, suggests that practitioners are adapting and developing programmes to suit
local needs. This may be because, in the absence of strongly evidence based programmes
that have proven applicability to local populations, practitioners are responding positively
with adaptations based on experience. However, this raises an important issue concerning
practice and research. Firstly, it suggests that those programmes that have been evaluated
need to make explicit the features that are critical to their success and should therefore be
retained in any adaptation. Secondly, when developing new programmes, practitioners
should attempt to identify the principles and approaches contained within their locally based
interventions that have an extant evidence base. Thirdly, it also suggests that evaluations of
interventions should be clear about the contexts. Pawson (2006, p.32)8 remarks that where
interventions are applied in complex contexts, ‘leakage’ occurs to the original effectiveness
and one cannot therefore assume that it remains an evidence based intervention.
However, the interview evidence suggests also that SLTs adopt consciously an approach
that is driven by professional judgement of more specific elements of intervention
8 Pawson, R. (2006). Evidence-based policy: a realistic perspective. London: Sage Publications
44

approaches to adopt, rather than which (if any) programme as a whole is appropriate. Our
review of the evidence base for these is firmer and consequently provides a stronger
foundation for this approach9.
SLTs also use clinical judgement and seek informal outcome evaluation (from
parents/teachers); less than 50 per cent reported using objective, standardized or criterion
referenced measures to assess outcomes and two thirds of those responding did not submit
data to the head of service, limiting service level monitoring and planning. This relates to
judgements of the suitability of objective measures for assessing progress and outcomes of
the children and young people with whom SLTs work. However, this approach also limits the
collection of more objective data that could indicate effectiveness.
4.4.1 Implications
There is a professional obligation to practise using evidence-based methods and a political
climate in England that is starting to stress outcomes as drivers of service commissioning –
‘payment by results’ is also returning. The results of this large scale survey raise important
questions about practice, including:
• Is the lack of evidence for programmes acceptable? Should there be more use of
well designed programmes or is this not the way forward? If programmes are
favoured then systematic research of their validity, effectiveness and usefulness is a
priority.
• Or should the focus be on the evidence of intervention activities and approaches? In
this case, the issue concerns the professional practice of implementing well validated
approaches. Studies of training and implementation are priorities here.
4.5 What we are doing next
The interventions identified in the survey are being related to the evidence from our analysis
of the research literature and those reported by educationists. Together these will be used to
produce a resource for practitioners by the end of the BCRP. We are also preparing a
journal paper for publication, providing more information from the survey. We were fortunate
to have the support of the National Association of Professionals Working with Language
Impaired Children (NAPLIC) to try to survey that community but the response rate was too 9 Lindsay, G., Dockrell, J.E., Law, J., Roulstone, S., & Vignoles, A. (2010) Better communication research programme 1st interim report. London: DfE. http://publications.education.gov.uk/eOrderingDownload/DFE-RR070.pdf Law et al (in press)
45

low to report findings. We will explore the possibility of a survey of educationists using a
different access route.
46

5. PROSPECTIVE LONGITUDINAL STUDY – PHASES 2 AND 3 Julie Dockrell, Geoff Lindsay, Olympia Palikara, Jessie Ricketts, and Tony Charman 5.1 Introduction
Children with speech, language and communication needs (SLCN) often encounter
academic, emotional and behavioural difficulties that pose a challenge to the professionals
working with them (Bercow, 2008). This stream of the Better Communication Research
Programme, the prospective study, is concerned with students identified as having either
primary language difficulties which we refer to as specific language impairment (SLI) or
autism spectrum disorder (ASD) who are being educated in mainstream provision in
England.
The term Speech Language and Communication Needs (SLCN) is used in two different
ways. The Bercow Review used SLCN as an inclusive term to cover all children with speech,
language and communication needs including those with primary difficulties with speech,
language and communication and those whose needs are secondary to another
developmental factor such as hearing impairment or cognitive impairment. The term specific
language impairment (SLI) has typically been applied to the first group (or specific speech
and language difficulties: SSLD in the UK). These children are defined as having a primary
language difficulty which is not associated with any other developmental difficulty including
autism, hearing impairment or other neuro-developmental impairment (Bishop 1997;
Leonard, 1998)
From a theoretical point of view, there is increasing interest in comparing the profiles of
children with SLI and ASD, and the potential overlap between the two groups has been a
matter of recent debate10. In practice, educational provision is increasingly made within
mainstream schools, in some cases within specialist provision within schools, including
language units and resource bases. However, professionals in England have argued that
students with ASD have increasingly occupied (‘taken over’) specialist provision intended for
students with SLI11.
Additionally, professionals differ with respect to adherence to a diagnostic compared with a
needs-based approach to assessment and provision12. In the educational system
10 Williams et al., (2008) 11 Dockrell, Lindsay, Letchford, & Mackie, (2006) 12 Dockrell et al., (2006)
47

classification of students’ additional learning needs aims to identify specific service
requirements and addresses individual children’s needs within the school context13.
Diagnostic approaches argue for a firmer relationship between identified ‘conditions’ and
interventions, with the implicit corollary of different interventions (including placements) for
these two groups. However, the usefulness of the diagnostic approach is dependent on the
validity of the separation of needs between the students.
Recent evidence has indicated a lack of internal consistency within the SLI diagnosis,
including identification of different subgroups within SLI and also a lack of evidence of their
consistency14. The functional importance of the ‘specific’ nature (relative to general cognitive
ability) as a distinguishing feature has also been questioned15. Furthermore, ASD is, by
definition, based on a tri-axial framework of developmental characteristics (social interaction,
imagination, communication), as a consequence of which students will be characterised by a
wide variety of different combinations of strengths and impairments along the three
dimensions. These factors raise important conceptual and research issues but they also
pose important challenges to the education (and health) systems in terms of appropriate
provision.
What we have done We report on the first two years of the three year prospective study of students identified as
having either SLI or ASD, designed to explore the characteristics, needs and provision made
to meet those needs. We build upon the 1st Interim Report which described the screening
and sample selection phase.
5.2 Methods
Design: The study utilises a cross-sequential design, allowing both longitudinal and cross-
sectional comparisons.
Choice of local authorities (LAs): Five LAs were identified on the basis of their match to
national profiles of pupils with special educational needs generally, and autism spectrum
difficulties and speech language and communication needs in particular. In addition the
authorities performed at national averages for English and Math for their student populations
as a whole.
13 Florian et al., 2006; McLaughlin et al., (2006). 14 Conti-Ramsden & Botting, (1999) 15 Tomblin & Zhang, (2006)
48

Choice of schools: Schools were identified on the basis of being mainstream settings and
agreeing to participate in the longitudinal study. Two hundred -ten schools were initially
identified in the five LAs that have been participating in the study. The final number of
schools agreeing to participate in the study was 74.
Participants
Screening
Children were identified who were aged 6, 8, 10, and 12 years, attending mainstream
provision and had been identified as having either SLCN or ASD as their primary need,
according to their school16. All spoke English as a first language and had no history of
hearing impairment or uncorrected eyesight. The design was to identify 25 pupils at each
age with SLI and 25 with ASD (expected N = 200). Because we know from other research in
the BCRP that pupils identified as having SLCN by schools include children who do not meet
the SLI criteria, we screened potential participants. The inclusion criteria for the study were:
• SLI and ASD groups: Nonverbal ability in average range or above, as
measured by the Matrices subtest from the British Ability Scales II (Elliott et
al., 1997)
• SLI group only: expressive language – (Recalling Sentences from the Clinical
Evaluation of Language Fundamentals : CELF-4; Semel & Wiig, 2006) below
average range (< -1SD) or receptive language (Recalling Sentences from
the CELF 4)- below average range (< -1SD).
A detailed description of the sampling process is provided in the flow chart below (Figure 1).
16 The Pupil Level School Census (PLASC) requires schools to identify and notify the Department for Education (DfE) of pupils with special educational needs. The category Speech, Language and Communication Needs as a primary need is comparable to specific language impairment (SLI) and there is a separate category of autism spectrum disorder (ASD).
49

SLIN=119
Identification of mainstream schools in 5 Local Authorities: N= 210
Children excluded (1⁰ need not Speech & Language or ASD) N= 16
74 schools recruitedIdentification of children with SLCN by
schools N=338
Individual screening to identify children and form groups with:
SLI N= 216ASD N= 106
Identified
Total
N=271
Written
consent
given by
parents
Total N=171
Phase 2
Total
N=170
Children excluded:N=7 EALN=6 hearing impairmentN=31 from SpLCN group due to high languageN= 7 other
School contacted but did not respond/agree: N= 136 Schools
ASDN=76
Attrition: N=1 (SpLCN) left country
SLIN=74
ASDN=51
SLIN=73
ASDN=51
Guidance from SLT and EP teams on which schools to target on basis of number of pupils with SLCN
Screening criteria for groups:ASD: 1⁰ need=ASD, NV ability ≈averageSpLCN: 1⁰ need=speech and language, NV ability ≈average, language < average on CELF recall sentences OR CELF word classesLow NV: 1⁰ need=ASD or speech and language, NV ability <average
Attrition: No/no response from parents N=100
FLOW DIAGRAM OF PARTICIPANTS
LI Low NVN=51
ASD Low NVN=25
ASD Low NVN=16
LI Low NVN=30
LI Low NVN=30
ASD Low NVN=16
Figure 5.1: Flow chart of participants for screening and phase 2 of the prospective study
50

It should be noted that the screening phase resulted in the emergence of two additional
groups of students. These all had ASD or language and communication needs as a primary
need but non-verbal ability below our research criterion. These two groups were included in
the study not only for methodological reasons but also in order to allow the investigation of
these children’s needs and developmental trajectories. As a result the four groups are:
specific language impairment(SLI); autism spectrum disorder (ASD); language impairment
with low non-verbal ability (LI low NV); ASD with low nonverbal ability (ASL low NV).
Phase 2
Of the 271 participants initially identified, opt in parental consent was given for 171 of the
children. These students were further assessed for the second phase of the project (N =
171). At this stage, 125 of the participants were attending mainstream provision, 31 were
educated in specialist provision in mainstream schools for pupils with language difficulties
and 15 in mainstream schools with ASD provision. Table 1 below provides a breakdown of
the participants by age group, gender and diagnostic group.
Table 5.1: Breakdown of participants per age group and diagnostic group
Diagnostic Groups AGE GROUPS
SLI ASD LI low NV ASD Low NV
5-6 years 27 6 5 2 7-8 years 16 14 9 6 9-10 years 14 10 5 3 11-12 years 17 21 11 5 Total 74 51 30 16
5.3 What we have done During the second phase of the study data were collected from:
• Pupils: were assessed individually on a range of language, literacy, other cognitive
measures and self-report questionnaires of socio-emotional development.
• Teachers: completed a questionnaire regarding curriculum differentiation and the
strategies and special programmes used in the classroom to support and better
meet children’s learning needs.
• SENCOs: completed a questionnaire asking them to specify the amount of support
provided to the participants by school staff and other professionals.
51

• Classrooms: The pupils were observed in the classroom for 30 minutes during
English lessons.
• Parents: completed questionnaires concerning their different aspects of their
children’s social communication skills. Additionally, telephone interviews were
conducted with parents asking them their insight on a range of issues including
their children’s strengths and needs, and their satisfaction with the support their
children were receiving.
Table 5.2 presents an overview of the measures used at screening and phase 2.
Table 5.2: Overview of domains assessed and measures completed by children, teachers, SENCOs and parents during the first two phases of the prospective study
Domain Measures Completed by Phase of the study
Language TROG Children Phase 2 BPVS Children Phase 2 CELF –II-UK Children Screening
Phase 2 Literacy YARC Children Phase 2 TOWRE Children Phase 2 Spelling BAS Children Phase 2 Writing Children Phase 2 Non-verbal ability Matrices BAS Children Screening WASI Matrices Children Phase 2 Socio-emotional development
KIDscreen Children Phase 2
Behaviour SDQ Teachers Phase 2 Social communication
SRS Parents Phase 2
SCQ Parents Phase 2 CCC-2 Parents phase 2 Classroom support and behaviour
Classroom observation
Researchers Phase 2
Strategies and curriculum differentiation
Teacher questionnaire
Teachers Phase 2
Support in school SENCO questionnaire
SENCOs Phase 2
The following sections compare our four groups with respect to pupils’ needs on key
measures of language, literacy, social communication and socio-emotional development.
52

5.3.1 Language
The pupils were assessed on a range of standardised and age-appropriate measures,
tapping different aspects of language. We report on pupils’ performance on three tests: the
British Picture Vocabulary Scale (BPVS-3)17 the Test for Reception of Grammar (TROG-E)18
and the Clinical Evaluation of Language Fundamentals (CELF-4)19.
One-way ANOVAs controlling for age were carried out to explore whether the groups
differed. Where a significant overall group difference was found Bonferroni post hoc tests
(pairwise comparisons) were carried out to see which groups differed. These findings are
presented in Figures 5.2 and 5.3.
As Figure 5.2 shows all groups performed poorly on these measures. In addition there was a
significant main effect for the measure of vocabulary understanding (BPVS)20. Children with
ASD performed significantly better than the other three groups of participants, who did not
differ from each other. In contrast for the TROG there were no significant group differences.
Composite expressive and receptive language measures are presented in Figure 5.3. In
terms of expressive language the ASD group performed significantly better from the other
three groups of participants who did not differ from each other. The CELF receptive
language measure provided a more complex picture as in the previous analysis the
participants in the ASD group performed significantly better than the other three groups.
However for this receptive language index score the LI low NV group scored the poorest and
these scores were significantly worse than the SLI group.
17 Dunn et al., (2009), 18 Bishop, 2005) 19 Semel & Wiig, 2006) 20 The full analyses will be reported in the Technical Report for the Prospective Longitudinal Study, to be published with the Final; Report of the BCRP
53

Figure 5.2: Group comparisons for receptive vocabulary and grammar controlled for age of assessment: BPVS and TROG
Figure 5.3: Group differences on CELF expressive and receptive scales controlled for age of assessment These analyses suggest that on average the participants in the ASD group are performing
better on language measures that the other groups. However, as figure 5.4 shows these
average differences mask a significant degree of overlap between the groups.
54

Figure 5.4 Correlation matrix between expressive and receptive scores on the CELF with individual markers by group.
Summary of findings
• All groups of participants presented with depressed scores on receptive and expressive language
• On average participants with ASD performed better in areas of structural language than children with SLI, LI low NV and ASD Low NV.
• One only participant with SLI or LI low NV performed (just) within the average range for expressive language ability
• There was significant overlap between the groups demonstrating the significant variability within the groups
55

Literacy skills
Reading comprehension was measured by the York Assessment of Reading for
Comprehension (YARC; Snowling et al., 2009), single word reading accuracy was measured
by the Single Word Reading Test (included in the YARC) and spelling by the British Ability
Scales Spelling measure (BAS Spelling, Elliot et al., 1997).
The ASD group obtained significantly higher scores than the SLI and the LI Low NV groups
on measures of single word reading and reading comprehension (Figure 5.4). The mean
score for the ASD group was in the average range for all three measures whereas both the
SLI group and the LI low NV group showed depressed performance. For single word reading
and single word spelling both ASD groups scored significantly higher than the groups
identified with primary language needs. In contrast for reading comprehension the ASD
group scored significantly higher than all the other three groups. The ASD group also
produced significantly more words in their written texts than the SLI group and the low
nonverbal group but not the ASD low NV.
Figure 5.4: Group comparisons of mean SWRT, YARC reading comprehension and spelling
56

Social communication
Summary of findings
• Scores for the ASD group were within the average range for single word reading, reading comprehension and spelling
• Pupils with SLI and those with LI low NV had depressed scores on all the literacy measures
• The ASD group and the ASD Low NV outperformed the SLI and the LI Low NV in both single word reading and spelling.
• Performance for reading comprehension was significantly higher for the ASD group compared with all other groups, who did not differ between themselves
• In the writing task participants with LI low NV produced the fewest words and produced significantly fewer words than participants with ASD.
Social communication
Parents of 120 participants (45 parents of children with SLI; 43 parents of children with ASD;
23 with LI Low NV; 9 ASD with Low NV) completed questionnaires examining different
aspects of social interaction and communication: the Social Responsiveness Scale (SRS;
Constantino & Gruber, 2005) and the Social Communication Questionnaire (SCQ; Rutter,
Bailey, & Lord, 2003), measures used to assess ASD symptoms, and the Children’s
Communication Checklist (CCC-2; Bishop, 2003). Here we report data from the SRS and the
CCC-2.
The SRS comprises five different subscales: social awareness, social cognition, social
communication, the social motivation and autism mannerisms. Additionally, a total score is
calculated. Higher scores indicate impairment and T-scores higher than 60 indicate clinically
significant difficulties.
The CCC-2 comprises 70 multiple choice items divided into ten scales and aims to screen
for children who may experience language impairment and to identify difficulties with
57

pragmatic skills in children with language and communication problems. Low scores indicate
greater difficulties.
Social Responsiveness Scale (SRS). Both the ASD and the ASD low NV groups had significantly higher mean standard scores on
the total SRS than the language impaired groups ( ASD M = 66; ASD low NV M= 71; SLI M
= 57; LI low NV M = 56). As shown in Figure 5.5, the ASD and the ASD Low NV groups
showed greater levels of difficulties on all subscales of the SRS compared to the SLI and the
LI Low NV groups. On all the subscales participants with ASD (ASD and ASD low NV) had
significantly higher scores than the language impaired groups.
Figure 5.5: Profile of the Social Responsiveness Scale (SRS) raw scores for the four cohorts controlled for age Note. High scores indicate greater levels of impairment;
Child Communication Checklist (CCC-2): Analyses of covariance, with age as the covariate, were conducted on the CCC-2 subscales.
There was no overall significant difference between the four groups for the general
communication index. However, there were main effects for speech (F (3, 85) = 4.149, p =
.009), syntax (F (3,84) = 5.223, p = .002) and social interaction deviance (F (3,83) = 14.11, p
< .001). There were two patterns of results. First, the SLI group had significantly greater
levels of difficulty than the ASD group with both speech (p = .009) and syntax (p = .001).
Second, the ASD group had significantly more difficulties, showing higher levels of social
interaction deviance, than both the SLI group (p < .001) and the LI low NV group (p = .001)
and more difficulties on the Interests scale than the SLI group (p = .025). No other group
58

comparisons were significant. Figure 5.6 presents the results from the Social Interaction
Deviance scale as an example.
Figure 5.6: Profile on the Child Communication Checklist (CCC-2) Social Interaction Deviance Scales (raw scores) Note: Social interaction deviance composite: >8 indicates SLI, <0 pragmatic language impairment or ASD
Summary of findings
• The ASD group was significantly more impaired than the SLI and LI low NV groups on measures of social interaction .
• The SLI group experienced significantly more difficulties in structural aspects of language (speech, syntax). The ASD group had significantly higher levels of social interaction deviance than the SLI and LI low NV
groups.
59

5.3.2 Socio-emotional development
Pupils also completed a self-report measure of subjective health and well-being, the 52 KID-
screen (Ravens-Sieberer & the KIDSCREEN group, 2005). This questionnaire comprises 52
items assessing different aspects of quality of life (well being) including physical Well-being,
psychological well-being, moods and emotions, self-perception, autonomy, parent relations
and home life, social support and peers, school environment, social acceptance (bullying),
and financial resources.
A general trend was that children in all four groups expressed positive views about their well-
being when compared to the norms where 50 is the mean (see Figure 5.7).
There were significant group effects on all measures except bullying with the SLI group
generally showing higher mean scores than the ASD group indicating greater well being.
Four of these differences were highly significant: autonomy p = .001; parent relations and
home life, p < .001, financial resources p = .001; peer relations p = .022.
Generally the LI low NV group had similar scores to the SLI group. However, there were
significant differences between these two groups for moods and emotions (p = .001) and self
perceptions (p = .001), in both cases the SLI group had worse levels of well being.
There was no significant difference between the ASD and ASD low NV groups on any scale
of the KIDscreen.
The LI low NV group had significantly better well-being scores compared with the ASD group
on scales: moods and emotions (p = .003), self perceptions (p < .001), autonomy (p = .003)
and parent relations and home life (p < .001).
60

Figure 5.7: Profile on subscales of the KID-screen
Figure 5.8: Profile on subscales of the KID-screen 5.3.3 Support in schools
There is limited previous research examining the support and differentiation of the curriculum
for children with SLCN (.i.e. for our SLI and SLI low NV groups) and ASD. During the second
phase of the prospective study we had the opportunity to gain information about support in
classrooms from both teachers and special educational needs coordinators (SENCOs).
Teachers completed questionnaires related to curriculum differentiation and use of
61

classroom strategies designed to facilitate children’s learning. Additionally, SENCOs
provided us with valuable information related to the support the students were receiving from
school staff and external professionals.
Strategies used by classroom teachers
Firstly, teachers were asked about curriculum differentiation. Eighty per cent of teachers
reported that they differentiated the curriculum for the pupils. Furthermore, it was reported
that the curriculum was differentiated for 92% of the participants for literacy. No differences
were found concerning differentiation in relation to children’s educational placement.
The next set of questions related to how the curriculum was differentiated for the specific
pupils. Teachers were asked to report their use of 11 different strategies, derived from what
is known about effective practice and special needs pedagogy (Norwich & Lewis, 2005). As
can be seen in Figure 5.10 below, the most reported strategies were providing task related
feedback and the use of extended feedback. The least reported strategies were the use of
checklists and spacing short work periods with breaks.
62

Figure 5.10: Strategies used by classroom teachers’ to support children’s learning
The teachers were also asked whether they were using any special programmes to support
pupils’ learning. As Figure 5.11 shows below, there was very little evidence of use of special
programmes, as the majority of the teachers (78%) reported that they never used special
programmes in the classrooms.
63

Figure 5.11: Use of special programmes by classroom teachers. 5.4 What we are doing next
Observation data During the second year of the prospective study classroom observations of 30 minutes were
conducted during English lessons. This component of the prospective study was designed to
address the gap in our knowledge of classroom processes for pupils with SLCN and ASD.
The aim of the observation schedule was to provide a unique data set examining the
learning contexts and teacher pedagogy during literacy instruction. Literacy instruction was
identified as a key area of risk for many of the pupils and an area where we would predict
differentiation.
A total of 156 observations were conducted. The classroom observations gave us a novel
insight into the ways pupils were supported during literacy and how they responded to
lessons. The rich data gathered from the classroom observations are currently being
analysed.
Final round of assessment
In the last phase of this study we will capture transition from primary to secondary school for
the 25% of the sample who will be making this move. Data will be collected from pupils and
teachers. For the teachers we will consider differentiation and support and aspect s of
children’s social communication skills to complement the data collected in earlier phases of
the study. At this point we will also collect additional pupil data by further assessing the
strengths and needs of the pupils who have been participating in the study. We will repeat
64

language, literacy, non-verbal and health-related quality of life measures used in previous
stages of the study in order to obtain a better understanding of children’s needs over time .
65

6. LANGUAGE AND LITERACY ATTAINMENT OF PUPILS DURING EARLY YEARS AND THROUGH KS2: DOES TEACHER ASSESSMENT AT FIVE PROVIDE A VALID MEASURE OF CHILDREN’S CURRENT AND FUTURE EDUCATIONAL ATTAINMENTS?21
Margaret Snowling, Charles Hulme, Alison M Bailey, Susan E Stothard, and Geoff Lindsay
6.1 Background
It is well-established that language skills are amongst the best predictors of educational
success. Consistent with this, findings from a population-based longitudinal study of parents
and children in the UK indicate that language development at the age of two years predicts
children’s performance on entering primary school.22 Moreover, children who enter school
with poorly developed speech and language are at risk of literacy difficulties23 and
educational underachievement is common in such children.24,25 Whatever the origin of
children’s problems with language and communication, the poor educational attainment of
children with language learning difficulties is an important concern for educational policy.
The research to be reported here addresses the question of whether teacher assessment
and monitoring could be used to identify children with language difficulties in need of early
interventions.
6.2 Aims of the Study
The overarching aim of this study was to investigate whether teacher assessment at the end
of the Early Years Foundation Stage (EYFS) around 5 years, based on ongoing observation,
provides a valid measure of children’s current development and their educational
attainments in future years. In addition, the study investigated which factors, both within the
child and within the environment, place a child at risk of language and literacy difficulties?
21 A full version of this study is being published in parallel with this 2nd Interim Report 22 Roulstone et al. (2011) 23 Stothard et al. (1998) 24 Conti-Ramsden et al. (2009) 25 Dockrell et al. (2011)
66

6.3 What we have done
To address the research questions we used data from three cohorts of children entering all
50 maintained primary schools26 within one local authority in a 3-year period from September
2006 to July 2009. We followed the progress of all of these children in acquiring literacy
skills with data available on pupil progress through the ‘Phonic Phases’ (validated as good
measures of attainment in separate studies27).
Cohort 1 (entering September 2006) was assessed against the FSP; longitudinal data
include end of National Curriculum levels at the statutory end of KS1 assessment, and
language and literacy data from a representative sample followed up in Year 3 during March
2011.
Cohorts 2 and 3 (entering 2007 and 2008 respectively) were assessed on the EYFSP which
replaced the FSP. Data are available for Cohort 2 for two years and Cohort 3 for one year.
Summary data for these three cohorts are shown in Table 6.1 below.
Table 6.1: Cohort contextual information
Cohort
Entry to
Reception
year
N
% Male Mean age at T3
(months)
%
Free School Meals
%
SEN register
% EAL
1 2006-7 1781 51 64.7 10.0 11.3 5.3
2 2007-8 1849 52 64.5 10.7 16.2 5.6
3 2008-9 1748 52 64.3 10.2 5.8 5.1
Notes: T3 = end of first year in school; SEN: special educational needs; EAL: English as an Additional Language
The percentage of children with EAL was low for the LA in this period, as compared with the
national average of 16% of children with EAL in primary schools (DFE, 2007). Similarly, the
percentage of children eligible for Free School Meals is somewhat lower than the national
average ( 17%).
26 Excluding one special school 27 Snowling et al., (2009); Snowling et al., (2011)
67

6.4 Research Questions and Main Findings 6.4.1. Does a child’s language development as measured against the Foundation
Stage Profile (FSP)/Early Years Foundation Stage Profile (EYFSP)28 correlate with
performance on objective language tests administered during Early Years?
To assess this question, we correlated children’s scores on the EYFSP with their scores on
‘Language Link’, a normed language assessment battery (see www.speechlink.co.uk )
administered at school entry. The test consists of 50 items and provides a reliable measure
of receptive language (understanding).
The correlation between the Language Link total score and the EYFSP score was .62. This
is shown in Figure 6.1 below. The correlation between the Language Link total and the
Communication, Language and Literacy Scale was .63.
2040
6080
100
120
EY
FSP
Tot
al S
core
10 20 30 40 50Langage Link Total Score
early years foundation stage total points Fitted values
Figure 6.1. Relationship between language at school entry and EYFSP score at end of Reception year
In summary, the Early Years Foundation Stage Profile Total score was predicted by the Language Link Total Score recorded some nine months earlier, shortly after school
28 The Early Years Foundation Stage (EYFS) replaced the Foundation Stage (FS) in September 2008. http://nationalstrategies.standards.dcsf.gov.uk/node/83972
68

entry. It can be concluded that the EYFSP provides a valid measure of understanding of
spoken language.
6.4.2. Do the scales of the Early Years Foundation Stage Profile provide measures of
the abilities they purport to assess?
We collected pupils’ data from the Early Years Foundation Stage Profile (EYFSP) from the
cohort of 1658 children entering 38 schools in September 2009. The EYFSP (as used at the
time) comprised 13 scales within 6 areas of learning with a total of 117 items. Each point
was rated as true (achieved) or false (not achieved). On each scale, scale points 4-8 are the
early learning goals and scale point 9 describes the attainment of a child who has achieved
scale points 1-8 and is working consistently beyond early learning goals.
The analyses of data from a whole cohort on the EYFS allowed consideration of: (1) How
well each item of the profile taps what it purports to measure (i.e., do all the items in one
scale tap the same underlying ability)? (2) Whether the scales are independent from one
another (e.g., does the Communication, Language and Literacy Scale test something
different from the Problem Solving, Reasoning and Numeracy Scale, as it is supposed to
do)?
We used data modelling following an iterative process to find the best fit to the assessment
data. The best fit was a model with 6 factors: Language, Literacy, Mathematics, Social,
Physical and Creative Development. In terms of the EYFSP, this means that there was
validation for six of the scales (the scales are not independent of each other). The
Language scale correlates very strongly with all of the other scales, suggesting it is a fundamental ability associated with progress in all other domains of development. In
addition, there were very strong correlations between the Literacy and Mathematics scales
and each of these factors correlated strongly though to a lesser degree with Social, Physical
and Creative Development.
6.4.3. Does the Early Years Foundation Stage Profile predict future progress in
language and literacy as measured by school-based assessments? Which scales are
the best predictors of educational attainments?
We used data from the EYFSP for Cohorts 1 and 2, and from Phonic Phases assessments
as predictors of subsequent performance. As outcomes we used data from the end of Key
Stage 1 statutory assessment when pupils are assessed in Reading, Writing and
Mathematics. We also validated the findings using Phonic Phases as outcomes. At the
69

time of data collection, the implementation of phonics teaching in York schools (after Rose,
2006) included systematic assessment of basic phonic skills on a regular basis during the
first 3 years of instruction (Phonic Phases). The current data set included ratings of phonics
progression from each term during the first 3 years in school; here data were used from the
third term in Reception (Phonics-R) and the third term in Year 1 (Phonics-Y1).
There were moderate to strong correlations between EYFSP scores and KS1 attainments
(see Table 6.2 below).
Table 6.2. Correlations between EYFSP scores for Personal, Social & Emotional Development (PSE-total); Communication, Language and Literacy (CLL-total), Problem solving, reasoning and numeracy (MAT-Total) and the Total Profile score (FSP-total) and attainments in KS1 two years later.
Personal,
Social and
Emotional
Communication,
Language and
Literacy
Problem
solving,
reasoning and
numeracy
FSP-total
KS1Reading .47 .71 .66 .51
KS1Writing .48 .69 .63 .49
KS1Mathematics .46 .66 .65 .48
It can be seen that neither the Total score nor the score for Personal, Social & Emotional
Development correlated well with later attainments. There were strong correlations between the Communication Language and Literacy and the Problem solving,
reasoning and numeracy scales and later Literacy and Mathematics attainments. The
highest correlations were between CLL-total and both Reading and Writing at the end of KS1
(see Figure 2 below) but there was still about 50% variability in attainment unexplained.
70

Figure 6.2. Relationship between EYFSP –Communication, Language and Literacy score (CCL-total) at end of Reception year and KS1 Attainments in Reading Note: 1: working towards level 1, 2: level 1, 3: level 2c, 4: Level 2b, 5: level 2a, 6: level 3 To consider which of the Communication Language and Literacy scale scores was the best
predictor of later outcome, we next conducted correlations between these and KS1
attainments (see Table 6.3).
Table 6.3 Correlations between Communication Language and Literacy scales, Phonic Assessments and KS1 attainments two years later.
Language for
communication
and thinking
Linking
letters
and
sounds
Reading Writing Phonics-
R
Phonics-
Y1
KS1Reading .52 .69 .66 .68 .61 .73
KS1Writing .51 .66 .63 .67 .60 .71
KS1Mathematics .48 .64 .62 .64 .59 .66
Both CLL-reading and CLL-writing correlated strongly with attainments not only in Literacy but almost as much in Mathematics. The ratings on the scale ‘Language for
Communication and Thinking’ correlated moderately with later attainments but the
lower correlations are to be expected since the KS1 attainment tests focus on written and
not spoken language so there is a more direct link with earlier literacy-related skills.
As an alternative to the EYFSP scores, we examined how well teacher ratings of children’s
progress in phonics at the end of reception (Phonics-R) and the end of year 1 (Phonics-Y1)
71

predicted their subsequent attainments in KS1 Reading, Writing and Mathematics. Ratings of progress in phonics were strong correlates of reading and writing attainments;
correlations with Mathematics were weaker.
Thus, for predicting attainments at the end of KS1 from ratings made at the end of Early
Years (Reception class), the best measures appear to be CLL-total and Phonics progress
during the first three terms of formal reading instruction (Phonics-R).
6.4.4. Does the Early Years Foundation Stage Profile predict future progress in
language, literacy and numeracy, as measured by objective tests in year 3?
A sample of children from Cohort 2 was assessed in year 3 on a battery of measures to
assess language, literacy and numeracy skills. The sample was recruited from 10 schools
which were selected randomly, and should be representative of schools in the authority. The
tests given included measure of Receptive Vocabulary, Listening comprehension, Reading,
Spelling and Arithmetic.
The key question was how well performance in these skill areas is predicted by EYFSP
scores recorded three years later. We focused on the total score and the score for
Communication, Language and Literacy (CLL). The score for Communication, Language
and Literacy showed moderate correlations with measures of reading, spelling and reading
comprehension, and somewhat weaker correlations with arithmetic, vocabulary and listening
comprehension in Year 3. It was a slightly better predictor of later attainments than the
EYFSP total score. It was also a marginally better predictor than the rating of children’s
progression in phonics at the same stage.
A final question concerned how much variability in children’s literacy outcomes in year 3 can
be predicted from combinations of predictor variables. Ratings of Communication,
Language and Literacy predicted 34% of the variance in children’s year 3 attainments;
the prediction was much better if phonics progress at the end of year 1 was also included in
the model which then accounted for 47% of the variance.
6.4.5. In what ways do children making slow progress through Early Years and KS1
differ from typically achieving children on the Early Years Foundation Stage Profile?
For this set of analyses, we defined ‘slow progress’ as either working towards Level 1 (W) or
at Level 1 in the Key Stage 1 Reading assessment. As predictors we examined the
following child factors: Gender, Mother Tongue (EAL or not), Eligibility for free school meals
(FSM) and Deprivation Rank obtained from postcodes (IDACI).
72

According to the available data, 360 children had attainments below the national expectation
(10.8% of the sample), 2049 children were performing at the expected level (61.2% of the
sample). To investigate what differentiated the children who were progressing slowly from
the typically developing children, these two subgroups were compared. The comparisons
were made retrospectively examining performance on the EYFSP, in phonics progress and
on demographic variables. Children performing at above Level 2 (at Level 3) were excluded
from these analyses.
The data showed that children who attain below the nationally expected level in Reading at the end of KS1 are typically characterized by delayed development of Communication, Language and Literacy as indicated by their standing against the
EYFSP. Moreover, their progress in phonics was poor at the end of Reception class and at
the end of Year 1.
Turning to demographic data, more of the low attainers were boys, more were eligible for free school meals and more had English as an additional language as compared to
those who were typically developing29. Some 64.5% of the low attainers were known to their
schools as having SEN and 7% had statements. These data should be interpreted
cautiously because SEN data were not collected concurrently but a year earlier (in Year 1) at
a time when many schools may not yet have recorded children about whom they had
concerns. Furthermore, some of these children may have been receiving support to address
their additional needs.
6.5 Summary and Conclusions
• Teachers can make valid judgments of children’s development in language and literacy
and can accurately monitor their pupils’ progress in key reading skills.
• Children deemed by their teachers to be developing slowly after one year in school
typically perform below national expectations in KS1 assessments.
• Groups most at risk of difficulties are boys, children with EAL and those who are eligible
for free school meals. Demographic variables (Gender, Mother Tongue, Eligibility for
Free School Meals and deprivation) accounted for differences between children in
Communication, Language and Literacy as measured by the EYFSP. Each has an
independent effect. 29 See also Section 3.3.2 for evidence of the relationship between SLCN and EAL at the stage of secondary education.
73

• Early identification of children’s additional needs is important and key elements of
development can be assessed at age five. Children who attained below the nationally
expected level in Reading at the end of KS1 were already developing slowly at the end
of Early Years and their progress in phonics was poor both at the end of reception class
and at the end of year 1. Slow developers were typically characterized by delayed
development of Communication, Language and Literacy.
• The best predictors of educational success are measures of language, communication
and literacy. Between 45 and 51% of the differences between children in Key Stage 1
attainments can be accounted for by teachers’ ratings of their Communication, Language
and Literacy at the end of Early Years on the EYFSP.
• Of the EYFSP areas of learning, Communication, Language and Literacy is the best
predictor of later attainment at KS1 and in year 3 not only in literacy but also in
mathematics.
• Ratings of progress in phonics were also strong predictors of reading and writing
attainments; correlations with mathematics were weaker.
• The current findings are in line with the proposal to reduce the number of items on the
EYFSP from 69 to 17, and to split the Communication, Language and Literacy scale into
‘Language and Communication’ and ‘Literacy’.
6.6 Implications for Policy and Practice
The present study shows that teachers, when appropriately trained, can make valid
judgments of children’s development in language and literacy when guided by a well
validated, reliable measure, such as the EYFSP. In addition, teachers can accurately
monitor their pupils’ progress in key reading skills without the need for formal tests (see also
Snowling et al., 2011). Such ratings provide a valid screen for reading difficulties/dyslexia.
These findings make clear that a revised form of the EYFSP could be used to support
monitoring and early identification of difficulties with language and communication. However,
it is important to highlight that the present findings suggest a tool based on the EYFSP can
be expected to account for around 50% of the differences between children. Hence, a
substantial number of children will ‘fall through the net’ if the tool is used as a ‘one off’ screen
so additional checks on progress must therefore be made at regular intervals. It follows that
early identification should comprise a system of formative assessment that builds on and
extends teachers’ understanding of language and communication, informed and enhanced
by the use of a valid and reliable tool to support teachers’ assessments.
74

The findings also are in line with the proposal that the EYFSP should be shortened and
modified to capture individual differences between children in foundation skills including
language and early literacy.
Together the findings underline government priorities viewing Early Years as providing a
critical foundation for learning. They also provide evidence relevant to the Government’s
consideration of proposals for the revision of the Early Years Foundation Stage Framework
in the Tickell Review30. Thus, early identification of children’s additional needs is important;
key elements of development can be assessed at age five; assessments at the end of Early
Years can be used to identify children who are at risk of educational difficulties; and the best
predictors of educational success are measures of language, communication and literacy.
This proposal does not imply that there is a need for large scale record keeping. Rather, the
judicious choice of the key behaviours to assess, guided by an evidence-base such as the
one provided here, could streamline the process and reduce work load. Moreover this does
not preclude the inclusion of items that monitor behaviours which do not predict attainment
but may be linked with well-being (such as aspects of physical development).
School systems need to be aware that social disadvantage has its impact very early in
schooling. Children from the most disadvantaged backgrounds may need additional support
in Early Years to ensure a secure foundation for language and literacy development.
Screening at the point of school entry should be considered in areas of high need. Children
at risk of underachievement should have their additional needs recorded in a timely fashion,
and early and effective intervention put in place, as recommended by the Tickell Review.
30 http://www.education.gov.uk/tickellreview. The Government’s consultation on the Tickell Review’s proposals ended 30 September 2011.
75

7. SPEECH LANGUAGE AND COMMUNICATION NEEDS AND BEHAVIOUR Julie Dockrell1,2, ,Victoria Joffe1 , Gillian Baird2 and Vicky Slomins2 1 Study 1, 2 Study 2 It is now well established that children with language impairment are more likely to
experience behavioural difficulties than children without such problems31. Prevalence rates
of about 35-50 per cent have been identified, (Lindsay et al., van Daal et al.) However, the
research evidence shows important variations in relation to the type of behavioural difficulty;
the type of language difficulty; and the effect of other factors including, literacy and the
respondent who completes the questionnaire. Relationships between language and
behaviour also vary according to age and the measure used to establish the difficulties
experienced by the children.
The research evidence therefore indicates that, in general, children with developmental
language difficulties are at greater risk than typically developing children of having
behavioural, emotional and social difficulties (BESD) but the pattern is complex and
relationships with language not always evident. Such data raise questions about the
causality of the relationships between language and behaviour. As part of the BCRP we
aimed to elucidate these issues by examining behaviour difficulties in two different groups of
children with SLCN – a cohort of pupils attending a mainstream secondary setting (Study 1)
and children attending a tertiary diagnostic centre (Study 2). In both cases parents had
completed the strengths and difficulties questionnaire (Goodman, 1997). Study 1 analyses
data from a group of year 7 secondary school pupils who scored average or below average
in year 6 on the Key Stage (KS) 2 English standard assessment test (SAT). In addition, for
this mainstream sample, teachers and pupils had completed the questionnaire and had been
identified with SLCN in year 7 for a language intervention study (Joffe, 2011). Study 2
analysed data collected from parents of children being seen at a tertiary hospital setting and
their siblings.
31 Beitchman et al., (1996); Fujiki, Brinton & Clark, (2002); Katelaars, Cuperus, Jansonius, & Verhoeven (2010); Lindsay, Dockrell & Strand, (2007); Tomblin, Zhang, Buckwalter, & Catts, (2000); van Daal, Verhoeven & van Balkom, (2007)
76

The interim report provides details of the initial analyses of these two cohorts with
summaries of the implications from the individual studies. In both studies levels of difficulty
are presented and relationships between language and BESD considered. The final section
raises questions about the importance of further understanding the relationships between
language, academic achievement and BESD.
7.1 Behaviour, emotional and social difficulties in secondary school pupils with speech, language and communication needs
This project explored the extent to which pupils with SLCN were reported to experience
higher levels of BESD compared to a normative sample; whether there were differences
between pupils, parents and teachers in reported levels of BESD and whether there were
any statistically significant relationships between BESD and verbal and non-verbal ability,
educational attainment, socio-economic status (SES) and gender.
7.1.1 Procedure
The data are cross sectional and come from a larger intervention study, which explores the
behaviour, emotional and social functioning (BESD) of a cohort of year 7 pupils who scored
average (4A-4C) or below average (≤ 3A) on key stage 2 English SAT in year 6 and were
identified in year 7 with designated SLCN as defined by pupil level census data (PLASC).
Teachers were asked to refer pupils who had scored low or below average in the KS 2
English SAT and/or any pupils they were concerned were experiencing academic difficulties
in year 7 or appeared to have language difficulties. Pupils were assessed in school over 4
sessions of approximately 40 minutes.
7.1.2 Materials
Non-verbal ability was assessed with the Wechsler Intelligence Scale for Children (3rd
Edition, Wechsler, 1991) WISC111 (picture completion, picture arrangement, coding, block
design subtests), and verbal abilities assessed with the following language assessments:
British Picture Vocabulary Scale II (BPVS Dunn et al., 1997), two subtests of the Clinical
Evaluation of Language Fundamentals-4 (CELF4: Wiig & Semmel,2006) (formulated
sentences - FS, recalling sentences - RS), four subtests of the Test of Word Knowledge
(TOWK: Secord & Wiig, 1992) [Receptive Vocabulary (RV), Expressive Vocabulary (EV),
Multiple Contexts (MC), Figurative Usage (FU)] and the Expression, Reception and Recall of
Narrative Instrument (ERRNI: Bishop, 2004). BESD was explored using Goodman’s
77

strengths and difficulties questionnaire (SDQ) – self, parent and teacher versions (Goodman,
1997). A measure of SES was taken using maternal educational level.
7.1.3 Description of the Participants
A total of 352 year 7 pupils [aged 12;08 years (SD = 4 months) from 21 mainstream
secondary schools across two outer London boroughs took part in the study. Table 7.1
provides information of the sample with respect to gender, level of attainment in their key
stage 2 English national assessment in year 6, mother’s highest level of qualifications, SEN
status, and also indicates that none was currently seeing a speech and language therapist.
The pupils with average scores (4A-4B) on their English test in year 6 were included in the
study as they had been referred by their teachers as having difficulties with language.
Table 7.1: The participants
Percentage
Gender 63% males (n = 222) and 37% females (n 130)
Key stage 2 English in year 6 7% scored level 4A-B (average)
34% scored level 4C (low average)
59% scored 3A or below (below average)
3% data unavailable
Mother’s education 11% university level qualifications
55% school or college level qualification
13% no formal qualifications
Statement of special
educational needs
3.4%
Currently seeing a speech and
language therapist
0%
Non-verbal ability scores (Table 7.2) and language scores (Table 7.3) are presented as Z
scores to allow comparison across measures. These have a mean of zero and a standard
deviation (SD) of one. Participants scored within the lower part of the average range (i.e.
about -1 SD) on all non-verbal subtests of the WISC111 and obtained a prorated
performance IQ score of 84.7 (SD = 14.2) Performance on the different language measures
varied. Participants scored within the average range on measures of narrative ability
including storytelling, story recall and story comprehension (ERRNI) and in the
understanding of vocabulary (BPVS and TOWK-RV), although receptive vocabulary was just
78

within the average range and different from the other measures. In contrast, they scored
more than one standard deviation below the mean (< -1 SD) on all other language
assessments including expression of single words (TOWK-EV), the understanding of
multiple meanings (TOWK-MC) and figurative language (TOWK-FU) and the formulation and
repetition of sentences (CELF-FS; CELF-RS). See Table 7.2 for language scores. As such,
participants tended to experience difficulties with the structural aspects of language rather
than with communicative skills, as measured in the tests used.
Table 7.2: Non-verbal Abilities of Participants
Non-verbal Performance Subtests of the Wechsler Intelligence Scale for Children (WISC111)
z scoresi (SD)
Picture Completion -.59 (.85)
Block Design -.95 (1.0)
Picture Arrangement -.84 (1.1)
Coding -.50 (.94)
Overall Performance IQ -1.0 (.94)
Table 7.3: Language Abilities of Participants
Language Measures Z scores 32 (SD)
British Picture Vocabulary Scale (BPVS-II)
-.99 (.82)
Initial Story Tell: Expression, Reception and Recall of Narrative Instrument (ERRNI)
-.30 (.88)
Story Recall: ERRNI
-.23 (.88)
Comprehension: ERRNI
-.15 (1.1)
Formulated Sentences (FS) subtest of Clinical Evaluation of Language Fundamentals (CELF-4)
- 1.3 (1.0)
Recalling Sentences (RS) subtest of CELF-4
-1.2 (.92)
Receptive Vocabulary subtest of Test of Word Knowledge (TOWK)
-.82 (.74)
Expressive Vocabulary (EV) subtest of TOWK
- 1.4 (.57)
Multiple Contexts (MC) subtest of TOWK
-1.2 (.71)
Figurative Usage (FU) subtest of TOWK -1.2 (.64)
32 Z scores Mean, of 0. SD=1
79

7.1.2 Results
7.1. 2.1Behaviour, Emotional and Social Functioning of Participants
Student (self) Reported SDQ
A series of one sample t-tests showed that this group reported significantly more behaviour,
social and emotional difficulties (BESD), as measured by the total difficulties score (TD) of
the SDQ than the normative sample33 [t (337) = 11.507, p <.001; Cohen’s d = 0.6534]. This
was true for all subscales of the SDQ. The pupils also reported to significantly lower levels of
prosocial behaviours than the normative sample, and reported that their difficulties had a
significant impact on their everyday life. These data are presented in Table 7.4.
Table 7.4: Responses on Strengths and Difficulties Questionnaire (SDQ) – Student report
SDQ responses Group Mean (SD)
Goodman’s normative sample2 Mean (SD) N = 4228
t value Cohen’s d (Effect size)
Total Difficulties N (total number of participants) = 338
13.89 (5.7)
10.3 (5.2) 11.51*** 0.65
Emotional symptoms N = 341
3.70 (2.3) 2.8 (2.1) 7.07*** 0.40
Conduct problems N = 344
3.19 (2.0) 2.2 (1.7) 8.93*** 0.53
Hyperactivity N = 344
4.95 (2.3) 3.8 (2.2) 9.09*** 0.51
Peer problems N = 344
2.10 (1.9) 1.5 (1.4) 5.88*** 0.35
Prosocial N = 344
7.47 (1.8) 8.0 (1.7) - 5.35*** - 0.30
Impact Subtest N = 341
.99 (1.5) 0.2 (0.8) 9.16*** 0.65
*** p <.001 in all cases
Note: > 0.2 is a small effect, > 0.5 is medium and > 0.8 is large
33 Normative data accessed from the SDQ website (http://www.sdqinfo.org/). 34 For Cohen’s d > 0.2 is a small effect, > 0.5 is medium and > 0.8 is large
80

Parent Reported SDQ
Parents of the participants reported their children to have significantly more behavioural,
emotional and social difficulties, as measured by the total difficulties score of the SDQ than
the normative sample [t (206) = 9.703, p < .001; Cohen’s d = 0.67]. Higher levels of
difficulties were reported for emotional functioning, conduct, hyperactivity and peer
relationships than the normative sample and these difficulties were reported to have a
significant impact on their children’s lives. Parents did not however identify any differences in
the number of prosocial behaviours displayed by their children and those of the normative
group. These data are reported in Table 7.5.
Table 7.5: Responses on SDQ – Parent report
SDQ responses Mean (SD)
Goodman’s normative sample Mean (SD)
t Cohen’s d
Total Difficulties N = 207
12.08 (5.7)
8.2 (5.8) 9.70*** 0.67
Emotional Symptoms N = 221
2.97 (2.3) 1.9 (2.0) 6.92*** 0.49
Conduct Problems N = 222
2.08 (1.8) 1.5 (1.7) 4.66*** 0.33
Hyperactivity Subtest N = 220
4.93 (2.7) 3.2 (2.6) 9.32*** 0.65
Peer Problems N = 221
2.06 (1.78)
1.5 (1.7) 4.65*** 0.32
Prosocial Subtest N = 224
8.56 (1.80)
8.6 (1.6) -.35 NS - 0.02
Impact Score N = 216
1.13 (1.7) 0.4 (1.2) 6.03*** 0.49
*** p <.001, NS = not significant
Note: > 0.2 is a small effect, > 0.5 is medium and > 0.8 is large
Teacher Reported SDQ
A series of one sample t-tests revealed that teachers, similarly to the pupils and parents,
reported the group to have significantly more behaviour, emotional and social difficulties, as
81

measured by the TD score of the SDQ than the normative sample [t (185) = 9.008, p < .001;
Cohen’s d = 0.70]. The teachers reported the pupils to have significantly more difficulties in
all the subcomponents of the SDQ, including the prosocial subscale. These data are
reported in Table 7.6.
Table 7.6: Responses on SDQ – Teacher report
SDQ responses Mean (SD)
Goodman’s normative sample Mean (SD)
T value Cohen’s d
Total Difficulties N = 186
10.95 (7.0)
6.3 (6.1) 9.01*** 0.70
Emotional Symptoms N = 221
2.10 (2.2) 1.3 (1.9) 5.21*** 0.38
Conduct Problems N = 211
1.94 (2.2) 0.9 (1.7) 6.77*** 0.52
Hyperactivity N = 229
4.75 (3.0) 2.6 (2.7) 10.66*** 0.75
Peer Problems N = 218
2.32 (2.1) 1.4 (1.8) 6.47*** 0.47
Prosocial Subtest N = 206
5.84 (2.4) 7.1 (2.4) - 7.44*** -0.52
Impact Score N = 226
.77 (1.3) 0.4 (1.0) 4.19*** 0.31
*** p <.001
Note: > 0.2 is a small effect, > .0.5 is medium and > 0.8 is large
7.1.2.2. Agreement across student, parent and teacher raters on behaviour, emotional and social functioning
Where ratings were available from all three raters for the same pupils a series of mixed
ANOVAs were computed. Results of these analyses are reported in Table 7.7. Significant
differences were found in the total difficulties reported, and in the emotional, conduct and
prosocial subscales but not hyperactivity, peer relations or impact (see Table 7.7). Pairwise
comparisons with Bonferroni correction showed the t differences across the three groups of
respondents for:
82

• Total Difficulties: Pupils reported significantly more total difficulties than their parents (p
= .012) and teachers (p = .001). No significant differences were found between the
parent and teachers’ reports.
• Emotional Subscale: Pupils (p = .001) and parents (p = .005) reported significantly more
difficulties with emotional functioning than the teachers. There were no significant
differences between pupils and parents.
• Conduct Subscale: Pupils reported significantly more difficulties with conduct than both
their parents (p = .001) and teachers (p = .001). There were no differences between
teachers and parents.
• Prosocial Subscale: Teachers identified significantly less prosocial behaviours than both
pupils (p = .001) and parents (p = .001). Parents report more prosocial behaviours than
both teachers and pupils (p = .001).
Table 7.7: Comparisons in responses on the SDQ across the three raters
SDQ subscales Student Mean (SD)
Parent Mean (SD)
Teacher Mean (SD)
F Effect Size: Partial Eta Squared
Total Difficulties N = 115
14.12 (5.8)
12.19 (5.7)
11.05 (6.7)
10.398*** .084
Emotional Symptoms N = 142
3.68 (2.5)
3.13 (2.4)
2.29 (2.4) 15.404*** .098
Conduct Problems N = 139
3.29 (1.9)
2.15 (1.8)
1.79 (2.0) 31.229*** .185
Hyperactivity N = 146
4.86 (2.2)
4.91 (2.6)
4.86 (3.0) .026NS -
Peer Problems N = 141
1.88 (1.8)
1.97 (1.7)
2.23 (2.0) 1.602 NS -
Prosocial Subtest N = 133
7.57 (1.8)
8.68 (1.7)
6.06 (2.3) 70.408*** .348
Impact Score N = 137
.77 (1.4) 1.09 (1.6)
.82 (1.4) 2.206 NS -
*** p <.001, NS = not significant
Note: > 0.1 is a small effect, > .0.3 is medium and > .0.5 is large35
35 These values differ from previous tables as a different measure of effect size (partial eta squared) is applicable; however, the descriptors of magnitude are equivalent for both effect size measures
83

7.1.2.3 Differences in performance on the SDQ as a function of non-verbal ability
In order to explore the relationship between non-verbal ability and BESD, the group were
divided into those with average (non-verbal IQ = ≥ 85) and below average (non-verbal IQ <
85) performance IQ as measured by the WISC111. As shown in Table 7.8 independent t-
tests showed no significant differences in total difficulties on the SDQ across all three raters.
Pupils with lower performance IQ did not have greater levels of BESD than their peers with
higher performance IQs.
Table 7.8: Differences in SDQ responses of pupils with average and below average performance IQ
SDQ – Total Difficulties (TD)
Pupils with average or above average performance IQ Mean (SD)
Pupils with below average performance IQ Mean (SD)
t Cohen’s d (Effect Size):
Student-completed
13.7 (5.7) 14.0 (5.7) .46 NS -
Parent-completed
11.6 (5.4) 12.4 (5.9) 1.01 NS -
Teacher-completed
11.2 (7.1) 10.6 (6.9) -.52 NS -
NS = not significant
7.1.2.4 Differences in performance on the SDQ as a function of language ability
In order to explore the relationship between language ability and BESD, we looked at both
expressive language ability, as measured by the combined scores of the recalling sentences
and formulating sentences subtests of the CELF4, as well as receptive vocabulary, as
measured by the BPVS. Separate analyses were undertaken with the group divided first into
average and below average expressive language ability and second, average and below
average receptive vocabulary. As is typically used in research to identify children with
specific language difficulties 1.5 SD below the mean (that is -1.5 SD) was used to identify
those pupils with significant language problems.
A similar pattern of results emerged when dividing the group according to expressive and
receptive language ability. Pupils with low expressive language ability on the CELF4
reported having greater total difficulties on the SDQ than pupils with average language
abilities. These differences were not found on the parent or teacher-reported SDQ (see
Table 7.9). Similarly, pupils with low receptive vocabulary on the BPVS reported having
greater total difficulties on the SDQ than pupils with average language abilities. Again, these
84

differences were not found on the parent or teacher-reported SDQ (see Table 7.10). Thus it
is only with the student-reported SDQ where participants with lower receptive or expressive
language are reported to have greater BESD than their peers with better language abilities.
However in all cases the effect sizes are small.
Table 7.9: Differences in SDQ responses of pupils with average and below average expressive language ability (CELF4-FS+CELF-RS)
SDQ Total Difficulties
(TD)
Pupils with average expressive language Mean (SD)
Pupils with below average expressive language Mean (SD)
t
Cohen’s d (Effect Size):
Student-completed
13.3 (5.3) 14.8 (6.2) 2.22* * - 0.25
Parent-completed
11.95 (5.4) 12.3 (6.2) .53 NS -
Teacher-completed
10.9 (6.9) 10.7 (7.3) -.20 NS -
** p <.01; NS = not significant
Note: > 0.2 is a small effect, > 0.5 is medium and > 0.8 is large
Table 7.10: Differences in SDQ responses of pupils with average and below average receptive vocabulary (BPVS)
SDQ Total Difficulties (TD)
Pupils with average receptive vocabulary Mean (SD)
Pupils with below average receptive vocabulary Mean (SD)
t Cohen’s d (Effect Size):
Student-completed
13.3 (5.4) 15.2 (6.1) 2.59** - 0.32
Parent-completed
12.1 (5.7) 11.5 (5.3) - .60 -
Teacher-completed
10.6 (7.1) 12.0 (6.8) 1.14 -
* * p <.01, NS = not significant
Note: > 0.2 is a small effect, > 0.5 is medium and > 0.8 is large
85

7.1.2.5. Differences in performance on the SDQ as a function of educational attainment Differences in BESD were also explored in relation to academic attainment, that is between
pupils who scored average (4A-4C) and those scoring below average (< 3A) on an
educational attainment test (English Key Stage 2 SAT). These data are reported in Table
7.11. Pupils scoring below average on this school test were found to have greater BESD
than those scoring average on both the self- and teacher-reported SDQ. A similar pattern
was evident for the parent-completed SDQ although this difference was not significant .
Table 7.11: Differences in SDQ responses of pupils with average and below average educational attainment
SDQ – Total Difficulties (TD)
Pupils with average educational Performance Mean (SD)
Pupils with below average educational performance Mean (SD)
t Cohen’s d (Effect Size):
Student-completed
12.3 (4.6) 14.7 (6.1) 4.041*** - 0.44
Parent-completed
11.3 (5.2) 12.6 (6.0) 1.653 NS -
Teacher-completed
9.0 (6.2) 12.2 (7.2) 3.043*** - 0.46
*** p <.001, NS = not significant
Note: > 0.2 is a small effect, > 0.5 is medium and > 0.8 is large
7.1.2.6. Differences in performance on the SDQ as a function of gender
Gender differences were examined and these data are reported in Table 7.12. No
differences were found across the three raters.
Table 7.12: Differences in SDQ responses of male versus female pupils
SDQ – Total Difficulties (TD)
Male Mean (SD) Female Mean (SD) t
Student-completed
13.4 (5.4) 14.6 (6.2) -1.819
Parent-completed
12.1 (5.6) 11.98 (5.9) .204
Teacher-completed
11.5 (7.0) 9.9 (7.0) 1.512
Note: All t-scores non-significant
86

7.1.2.7 Differences in performance on the SDQ as a function of socio-economic status
(maternal educational level)
One way ANOVAs were used to explore any differences in SDQ total difficulties in pupils
whose mothers’ educational levels were at university level, college level, or had no formal
qualifications. Significant differences were found on the self [F (2; 262) = 3.499, p = .032]
and teacher-reported [F (2; 154) = 3.613, p = .029] SDQ. Post hoc comparisons revealed
that on both the student- and teacher-rated questionnaire, pupils whose mothers had no
qualifications showed greater BESD than those who had college qualifications (p = .022 and
p = .026 respectively) as well as compared with those who had university qualifications (p =
.006 and p = .019 respectively). There were no significant differences found on the parent-
reported SDQ [F (2; 193) = 2.309, p = .102] (see Table 7.13).
Table 7.13: Differences in SDQ responses of pupils whose mothers differed in levels of education
SDQ – Total Difficulties (TD)
Pupils with mothers with no qualifications Mean (SD)
Pupils with mothers with college education Mean SD)
Pupils with mothers with university qualifications Mean (SD)
F
Student-completed
15.6 (5.0) 13.3 (6.1) 12.6 (4.5) 2.262*
Parent-completed
14.0 (6.0) 11.8 (5.4) 11.2 (7.2) 2.309NS
Teacher-completed
13.3 (7.1) 10.2 (6.6) 8.7 (6.0) 3.613*
* p <.05, NS = not significant
7.1.2.8 Relationship between SDQ and non-verbal performance, language ability and
educational attainment
Two-tailed Pearson correlations were used to explore the relationship between the SDQ total
difficulties score of the student-, parent- and teacher-reported SDQ and performance IQ
(WISC111), educational attainment (scores on the national English test) and receptive
(BPVS) and expressive language ability. Two measures of expressive language ability were
used in the correlational matrix, the average combined score of the CELF-FS and CELF-RS
and the average combined score of the three expressive TOWK subtests (TOWK-EV,
TOWK-MC and TOWK-FU). After correcting for multiple correlations (Bonferonni) the only
correlations which were significant, of the 15 computed, were between the student-reported
87

SDQ and educational attainment (p = .001) and between the student-reported SDQ and
receptive vocabulary as measured by the BPVS (p = .002).
7.1.3 Conclusions and Implications
The results of this study show that pupils with moderate SLCN have greater BESD than a
normative sample as reported by themselves, their parents and teachers. These reported
BESD were found in a non clinical sample of year 7 pupils in mainstream secondary schools
who were not receiving any speech and language therapy support. However, it is important
to note that apart from the teacher rating of prosocial behaviour none of the scores fell into
the clinical range of the 10 per cent scoring in the highest 10% abnormal range (Goodman et
al., 2000) and teacher ratings of prosocial behaviour was in the borderline range. Despite
this however, the difficulties experienced by the pupils were significant enough for all raters
to report these difficulties as having a significant impact on the young people’s lives.
Differences were found across the three raters with pupils identifying greater BESD than
their teachers and parents. Pupils and their parents identified more difficulties with emotional
functioning than teachers, and pupils identified more problems with conduct than both their
parents and teachers. Parents reported more prosocial behaviours than both pupils and
teachers with teachers reporting the least amount of prosocial behaviour. These significant
differences, found across the three raters, could be explained by differences in the way the
pupils behave in different settings (for example school versus home) or by differences in the
perceptions and experiences of the raters (for example, different expectations of parents and
teachers).
The finding that pupils reported the greatest number of BESD may reflect a greater
awareness of and sensitivity to their own behaviour, how they relate to others, and their
social and emotional functioning.
The finding that pupils, parents and teachers all pointed to the fact that the pupils’ difficulties
were having a significant impact on their daily lives is an indicator that these pupils require
additional support. The differences across the three raters emphasise the importance of
obtaining information from multiple sources in order to get a more complete and coherent
picture of a child’s behaviour, social and emotional functioning.
There were no significant differences in student, parent or teacher-rated SDQ (overall total
difficulties score) between pupils with average versus below average performance IQ and
88

between male versus female pupils. Differences were found between pupils whose mothers
had no formal education and those with a college education and university education, and
these differences were evident on the self- and teacher rated questionnaire. Participants with
mothers with lower levels of education were at greater risk for experiencing higher levels of
BESD as indicated by the SDQ.
Many studies have shown that coming from a lower SES background is associated with
increased levels of behaviour problems. Data from the BCRP (Vignoles et al has shown that
lower levels of SES are associated with increased levels of SLCN. The relationships
between language and communication, disadvantage and BESD needs to be considered
more systematically to identify causal relationships.
A difference was also found in behaviour, emotional and social functioning (BESD) in pupils
with average versus below average expressive language and receptive vocabulary. In
separate analyses, pupils with average expressive language and those with average
receptive vocabulary reported less total difficulties than pupils with below average
expressive language and receptive vocabulary. These differences were not found with the
parent or teacher-rated SDQ.
Overall there were few significant relationships between the ratings on the SDQ and other
measures. There were no significant correlations found between BESD and performance IQ.
The only language correlations to remain significant after Bonferroni correction were those
between the student-reported SDQ and the BPVS. In general associations between BESD
and language were weak or non-significant. The strongest difference in BESD was evident
between pupils scoring average or below average on an English educational attainment test
with pupils scoring below average showing a greater number of BESDs than those scoring in
the average range on both the student and teacher-rated SDQ.
These results suggest that level of academic attainment may be more important in increased
levels of BESD than structural measures of language or non-verbal ability. Other studies,
where associations between language and BESD have been reported also have found weak
relationships with language apart from measures of receptive language with emotional
functioning (Conti-Ramsden and Botting, 2008) and with friendships (Durkin and Conti-
Ramsden, 2007). The importance of receptive language is also relevant in these data as the
most robust association with BESD in this study was the BPVS, a measure of receptive
vocabulary. This may indicate that pupils with problems in understanding language may be
89

particularly vulnerable to experiencing BESD but these need to be investigated further with
the necessary controls for academic attainments and SES included.
7.2 BESD and language difficulties in a clinical sample
Study 2 reports parent completed SDQ data from a sample of young people derived from an
existing study of language and genetics. Participants were all patients at a specialist tertiary
paediatric centre and diagnosed with SLI, ASD or ASD with a language impairment: the
clinic sample in the current study. For comparative purposes data were also available from
their unaffected siblings providing within family comparison data.
7.2.1 The participants
Eighty seven families (252 children) where one or more children, aged between 6 and 16
years 11 months, had language impairment (LI) as defined below were recruited for a study
of genetic factors involved in LI. Families were recruited through local clinicians, specialist
language schools and by advertising through the Association for All Speech Impaired
Children (Afasic). Ethical approval was granted for the study by the Guy’s Research Ethics
Committee and informed consent given by parents and, where appropriate, children.
Children were screened with the parent completed Social Communication Questionnaire
(SCQ). Information from local assessments was obtained. Blood tests for karyotype (number
and appearance of chromosomes) were carried out to exclude all children with known
genetic disorders.
Children were excluded from SLI status if they had a karyotype abnormality; active epilepsy;
an adverse obstetric/postnatal history e.g. neonatal encephalopathy; sensory neural hearing
loss; autism; partial or complete visual loss; any structural lesion contributing to speech
difficulty; performance IQ < 80; English was not the family language; or they were in care.
A diagnosis of autism spectrum disorder (ASD) was assigned on the basis of previous
multidisciplinary assessment, SCQ score, family history interview (FHI) and clinical
assessment by clinicians.
7.2.2 Assessments
The following assessments were carried out on all eligible children (see assessments
section of Baird et al. for references for specific tests):
90

• Clinical Evaluation of Language Fundamentals (CELF) 3rd Edition UK or Pre-school
CELF UK.
• Edinburgh Articulation Test (EAT).
• Wechsler Intelligence Scale for Children-III (WISC-III) including the digit span subtest.
The latter is a composite of forwards and backwards digit recall.
• Wechsler Objective Reading Dimensions (WORDUK) provides measures of reading
decoding (basic (word) reading), reading comprehension, and spelling.
• Children’s Non-Word Repetition test (CNRep) scored as correct or not correct.
• SCQ Social Communication Questionnaire
For the principal analysis, LI was defined categorically and children classified into three
groups on the basis of a current (C-LI) or past (P-LI) language problem, or never having had
a language problem (N-LI). C-LI was defined as a score >1.5 standard deviations (SD)
below the mean for the child’s chronological age on CELF expressive, receptive or total
score, and a performance IQ (PIQ) on the WISC/WPPSI >80. P-LI was defined as a current
CELF receptive and/or expressive or total scores and PIQ ≥80 but language milestone delay
in single words (>24 months) and/or phrases (>33 months), evidence of previous LI as
defined above and/or a problem with articulation at 5 years such that the child was
unintelligible to most people. All children in P-LI and C-LI groups had been referred to
speech and language therapy (SLT). N-LI was defined on the basis of no history of language
delay or unintelligibility, no current language impairment and PIQ >80. Every family included
in the study had one or more children with either a C-LI or P-LI and a sibling from any
classification group.
A dimensional measure of language impairment was also calculated using the difference
between PIQ and the total CELF score. Both the CELF and WISC have a mean of 100 and
standard deviation of 15; a score of 0 indicates no discrepancy; a positive score indicates
better PIQ than language and vice versa. Because the categorical definition of LI is arbitrary
and language development is influenced by general ability, we sought to use an approach
that allowed us to consider language impairment discrepant from IQ as a continuous
variable, which potentially has more power.
91

7.2.3 BESD measure and participant profiles
Parents completed the Strengths and Difficulties Questionnaire for a subgroup of children
attending the hospital (clinic sample) (N= 52) and their siblings (N =90). This report contains
the analysis of the SDQ data for the selected clinic sample and their siblings.
Psychometric assessments considered for the analyses included standard scores on
receptive, expressive and total language score on the CELF, performance IQ, reading
decoding and comprehension, spelling , WOND reasoning and numerical .
All the clinic sample experienced language and/ or communication difficulties. In addition
significant numbers of siblings experienced problems language or communication difficulties.
Participants in the full sample were therefore assigned to one of four groups based on
psychometric assessments and clinical diagnosis for autism: unaffected sibs, specific
language impairment (SLI), autism spectrum disorder (ASD), or autism spectrum disorder
and language impairment (ASD+LI). Overall both the ASD group and the unimpaired siblings
performed within the average range and did not differ significantly from each other on the
standardised measures, In contrast both the SLI and the ASD + LI group performed poorly
on the standardised measures and, typically significantly lower than both the unaffected sibs
and the ASD group. Clinical data on ASD status were also available
7.2.4 Sample characteristics
Parent SDQ data were available for 142 participants (92 males and 50 females), of these 50
children had been identified as the clinic sample and 92 as siblings. Clinic sample children
with and without SDQ data were compared on all psychometric measures. There were no
significant differences between the groups on age, expressive language, word reading,
spelling, numerical operations and reasoning. Participants with completed SDQ
questionnaires scored significantly lower on assessments reflecting receptive language,
reading comprehension, IQ and numerical operations.
Comparisons were also made across a range of relevant categorical variables. Participants
with SDQ questionnaires did not differ from those without questionnaires on evidence of
presence of autism or Pervasive Developmental Disorder (PDD) (X2 (1, n = 78) = .313, ns),
gender (X2 (1, n = 78) = .997, ns) or language delay at 34 months (X2 (1, n = 78, = .012).
92

Clinic sample children and sibs with a clinical diagnosis of ASD were identified and language
was examined for evidence of language impairment. Participants with SDQ scores included
the original clinic sample children (n = 50) and their siblings (n = 92). Some of the clinic
sample children were diagnosed with autism and some sibs were diagnosed with language
impairments or autism. For subsequent analyses, therefore, the full sample of 142 children
was divided into four groups: Unaffected siblings (n = 53), children with a diagnosis of
specific language impairment (n = 49), children with a diagnosis of autism (n = 18) and
children with language impairments and autism (n = 22). The means (SDs) of all measures
is presented in Table 7.14.
Table 7.14 Means and standard deviations for the four groups on the standardised language, literacy and ability measures.
Group Unaffected
sibs
SLI ASD ASD+LI Post hoc
Mean SD Mean SD Mean SD Mean SD (significant)
Receptive Language 99.7 10.1 72.6 10.6 97.2 13.1 65.8 11.4 F (3,131) =
78.531***
Expressive Language 90.8 11.2 64.5 9.8 90.3 11.7 64.0 9.9 F (3,131) =
68.379***
Total Language 94.8 9.9 67.0 9.1 93.5 10.8 63.7 9.4 F (3,131) =
96.379***
Performance IQ 105.8 14.4 94.6 15.4 102.3 10.2 92.7 22.0 F (3,128) =
5.287**
Word Basic Reading 95.7 13.4 82.5 14.0 95.3 11.1 77.6 12.7 F (3,111) =
12.230***
Spelling 98.7 13.9 81.9 14.3 98.6 13.9 78.8 13.6 F (3,111) =
15.441***
Reading
comprehension
89.8 11.8 76.1 12.3 88.2 11.6 73.2 11.8 F (3,103) =
12.752***
WOND Reasoning 102.2 13.0 86.4 11.3 85.6 12.7 78.9 7.2 F (3,106) =
21.831***
WOND numerical
operations
100.8 13.8 86.7 11.2 93.8 16.0 81.6 8.4 F (3,107) =
13.221***
*** p < .001, ** p < .01
The groups differed on all the psychometric measures. These differences were highly
significant (p < .0005) in all cases except performance IQ where p = .002. Bonferroni post
93

hoc comparisons revealed that in all cases the unaffected sib and the ASD groups did not
differ (all p's > .05). In contrast the SLI group performed significantly lower on all language
and literacy measures than the unaffected siblings and the ASD group (all p’s < .007), but
only the unaffected sibs for performance IQ, WOND reasoning and WOND numerical
operations. The SLI group did not differ significantly on any language, literacy or reasoning
measure from the ASD+LI group.
The ASD + LI differed from their unaffected sibs and the ASD group on all language
measures (all p’s < .0005) literacy measures (all p’s < .002), WOND reasoning (p’s < .0005)
and WOND numerical (Unimpaired sibs p < .0005, ASD p = .041) but for performance IQ the
ASD+LI group differed only from unimpaired sibs (p = .01).
Overall both the ASD group and the unimpaired siblings performed within the average range
and did not differ significantly from each other on the standardised measures, In contrast
both the ASD and the ASD+LI group performed poorly on the standardised measures and,
typically significantly lower than both the unaffected sibs and the ASD group.
7.2.5 Strengths and Difficulties questionnaire
7.2.5.1 Scores
Table 7.15 presents the means and standard deviations of the four groups on the SDQ with
age related normative comparisons accessed from the SDQ website
(http://www.sdqinfo.org). Comparisons were made between the population’s means and the
scores for the unaffected sibs. There were no significant differences on the total score and
the scales for emotional symptoms, conduct problems, hyperactivity, and prosocial (all t's
<1.0). However unaffected sibs had significantly higher scores on the peer problems scale (t
= -3.349, df = 53, p = .001) indicating greater levels of difficulties in this area.
The four groups differed significantly on all scales except conduct problems: Conduct
problems [F(3, 142) = .472, ns], Emotional symptoms [F(3, 142) = 4.426, p = .005, partial
eta squared =.09], Hyperactivity [F(3, 142) = 3.078, p = 0.03, partial eta squared =.06], Peer
problems [F(3, 142) = 10.665, p <.0005, partial eta squared =.19], Prosocial scale [F(3, 142)
= 5.772, p = 0.001, partial eta squared =.11], Total difficulties [F(3, 142) = 8.444, p < .0005,
partial eta squared =.16].
Bonferroni post hoc comparisons revealed two patterns of differences between the groups.
The first pattern was evident for the total SDQ, emotional difficulties and the prosocial scale.
94

The mean scores for the ASD group were significantly different from that of the unaffected
sibs (p’s < .001) and the SLI group (p’s < .03), indicating greater problems but the ASD+LI
group did not differ significantly from any group. In the second pattern, unaffected sibs and
the SLI groups did not differ significantly from each other and both groups scored
significantly lower, indicating fewer difficulties than the ASD group for hyperactivity and
peer problems score (p’s < .01 for hyperactivity p’s< .0005 for peer problems) and the
ASD+LI group (p = .03 hyperactivity, p =.003 peer problems).
Table 7.15 Strengths and Difficulties scales Means (standard deviations)
SDQ Scale Norms Unaffected sibs SLI ASD ASD+LI
M 1.9 1.8 2.5 3.7 2.7 Emotional symptoms
SD 2 1.7 2.2 2.2 2.1
M 1.6 1.4 1.5 1.6 1.9 Conduct problems
SD 1.7 1.6 1.5 1.3 1.7
M 3.5 3.4 4.2 4.9 4.6 Hyperactivity
SD 2.6 2.1 2.2 2.5 1.9
M 1.5 2.5 2.7 5 4.6 Peer Problems=
SD 1.7 2.1 2 2.5 1.7
M 8.6 8.5 8.2 6.4 7.5 Prosocial scale
SD 1.6 1.9 1.6 3.2 1.8
M 8.4 9.1 10.8 15.2 13.7 Total difficulties
SD 5.8 5.4 5.3 4.6 4.5
There was also a significant difference between the groups on Impact (F(3, 137) = 5.831, p =
0.001, partial eta squared =.12). Bonferroni comparisons Indicated that the ASD+LI group
differed significantly from both the unaffected sibs (p < .0005) and the SLI group (p =.007)
but not the ASD group. The ASD group were reported to experience the greater levels of
difficulties from the unaffected sibs (p =.04) but not the other two groups.
95

Figure 7.1 Means and standard deviations for impact
7.2.5.2 Risk categories
Participants’ scores were classified into three risk categories as recommended by Goodman:
80 % normal, 10% borderline, 10% abnormal. As Table 7.16 shows for all subscales, the
ASD group had a higher proportion of participants in the abnormal category. There were no
significant differences in the distributions for the prosocial ( X2 = 11.332, df = 6 ns), conduct
problems ( X2 = 4.870, df = 6, ns) and hyperactivity scales ( X2 = 7.056, df = 6, ns). In
contrast there were significant differences for the distributions in both peer difficulties ( X2 =
22.332, df = 6, p = .001) and emotional difficulties (X2 = 16.481, df = 6, p = .01), where both
the ASD and ASD+LI groups had high numbers of cases in the abnormal category.
96

Table 7.16 Percentage of cases in SDQ risk categories by subscale
Scales Unaffected sibs SLI ASD ASD+LI
Prosocial Normal 94.3 95.9 72.2 86.4
Borderline 1.9 2.0 5.6 4.5
Abnormal 3.8 2.0 22.2 9.1
Peer difficulties Normal 52.8 46.9 11.1 18.2
Borderline 9.4 18.4 5.6 9.1
Abnormal 37.7 34.7 83.3 72.7
Conduct problems Normal 81.1 79.6 72.2 63.6
Borderline 11.3 10.2 22.2 18.2
Abnormal 7.5 10.2 5.6 18.2
Emotional symptoms Normal 79.2 79.6 50.0 54.5
Borderline 11.3 2.0 11.1 22.7
Abnormal 9.4 18.4 38.9 22.7
Hyperactivity Normal 86.8 77.6 66.7 81.8
Borderline 7.5 4.1 5.6 4.5
Abnormal 5.7 18.4 27.8 13.6
As shown in Figure 7.2 the groups also differed in the risk categories assigned for the total
SDQ ( X2 = 18.509, df = 6, p = .005) with both the ASD and the ASD+LI group showing
greater numbers of cases in the abnormal category.
Figure 2 Risk categories for the four groups for total SDQ score
97

7.2.5.3 SDQ, language, attainments and ability
The relationships of both the SDQ total score and impact score with language, ability and
attainment measures were examined. A regression analysis examined the added variance to
the impact score after controlling for participants’ SDQ scores.
Correlations
Correlations are presented in Table 7.16. A Bonferroni correction of .005 was used. The
SDQ total difficulties score and the SDQ impact score were highly positively correlated. As
expected there were also large and significant positive correlations between the
standardised measures. There were, however, no significant correlations between the SDQ
total score and any of the standardised measures. In contrast the SDQ impact scale was
significantly negatively correlated with all language and attainment scores apart from WOND
reasoning.
98

Table 7.16 Correlations between SDQ total score, SDQ impact and psychometric measures
1 2 3 4 5 6 7 8 9 10
1.SDQ impact
2.SDQ Total difficulties
.477**
3. Receptive Language
-.369** -.211
4.Expressive Language
-.254* -.187 .826**
5. Total Language
-.307** -.209 .954** .952**
6.PIQ -.259* -.172 .454** .435** .455**
7. Word Basic Reading
-.336** -.203 .621** .631** .656** .427**
8.Spelling -.288* -.175 .671** .644** .684** .446** .879**
9. Reading comprehension
-.313* -.139 .617** .609** .633** .403** .730** .662**
10. WOND Reasoning
-.117 -.009 .189 .110 .154 .071 .723** .735** .561**
11. WOND numerical operations
-.294* -.263 .635** .627** .662** .494** .694** .695** .584** .106
p < .05, ** p < .01, *** p < .001
7.2.6 Regression analyses
Step wise regression analyses were computed to examine the variance to be accounted for
in the SDQ impact score by non-verbal and language ability. The SDQ total score was
included first in the model. Given the significant relationships between diagnostic category
and SDQ, diagnostic category was included in the model, followed by performance IQ (non-
verbal ability) and receptive language (language measure with the highest correlation with
impact). A significant model included SDQ total and receptive language. Receptive
language entered as the last step resulted in an R2 change of .03. As Table 7.18 shows
neither non-verbal ability nor diagnostic category was significant in the model (F (4, 122) =
13.996, p. < .0005, Adj R2 =.30).
99

Table 7.18 Regression table for SDQ impact score
Model Variable B Beta t
1 SDQ Total difficulties
.158 .467 5.805***
2 SDQ Total difficulties
.129 .381 4.620***
Diagnostic category
.445 .255 3.090**
3 SDQ Total difficulties
.125 .369 4.506***
Diagnostic category
.397 .228 2.742**
Performance IQ
-.016 -.144 -1.824
4 SDQ Total difficulties
.124 .366 4.537***
Diagnostic category
.238 .136 1.476
Performance IQ
-.008 -.071 -0.834
Receptive Language Score -.021 -.209 -2.150*
p < .05, ** p < .01, *** p < .001
7.2.6 Conclusions
Two patterns of difference were evident between the four groups on the SDQ subscales,
total score and impact. In pattern 1 the ASD group had significantly worse scores that the
unaffected sibs and the SLI group and in pattern 2 both the ASD and ASD+LI group had
significantly worse scores than the unaffected sibs and SLI groups. Overall ASD was the key
differential factor in poor scores on the SDQ. Risk categories were also computed and in all
cases the ASD and the ASD+LI group had greater numbers of cases in the abnormal
category.
Correlations between the SDQ total difficulties and impact scores with the psychometric
measures revealed no significant association between the SDQ total score and any of the
psychometric measures. In contrast there were large and significant correlations between
the psychometric measures and impact.
Using SDQ impact as the dependent variable and SDQ total score as the autoregressor
showed additional added variance was accounted for only by receptive language.
100

7.3 Overall Summary: These two studies, using different identification techniques and sample characteristics, point
to a number of ways to further our understanding about the relationships between BESD and
language in older pupils. Both cohorts focussed on participants experiencing language
difficulties and both studies show increased levels of BESD in the participants. However,
neither study finds language levels to be a major correlate with behaviour problems. Since
the level of language severity varies across the studies, with participants in Study 1, in
general, experiencing milder levels of structural language problems than those in Study 2,
together the results suggest that problems with structural language at this point in
development do not impact on reported levels of BESD.
In contrast academic attainment was important in both studies. Study 1 identified the
importance of academic attainments and their relation to impact of behavioural difficulties
and the large and significant negative correlation in Study 2 between impact and word
reading would support this conclusion. There is a need to examine further the relationship
between BESD and educational attainment, controlling for SES and ASD, to identify the
ways in which educational attainment impacts on BESD in secondary school-aged pupils.
Such analyses are important as this will allow practitioners to identify appropriate support
mechanisms and interventions for the relevant risk populations.
A major and important difference between the two studies is the level of BESD reported. In
Study 1, the at risk population cohort, identified raised levels of problems but these
problems do not enter the clinical range of those scoring in the highest 10% abnormal range
(Goodman et al., 2000). In marked contrast in Study 2, the clinical cohort had, peer
difficulties, emotional difficulties and hyperactivity significant numbers of participants in the
10% clinical range; this was true for participants with SLI, ASD and ASD+LI alike. It is
important to note also that, in Study 2, both ASD and ASD+LI status presented a significant
risk factor particularly in the area of peer problems, with 83% and 73% respectively falling in
the abnormal range.
Study 2 showed that significantly greater problems were reported for participants with ASD
rather than those with language impairment and highlighted the importance of impact as
opposed to actual levels of BESD. The increased level for participants with ASD suggests
that the dimensions of language related to social communication and language
understanding are central to increased levels of BESD. Given that populations with language
difficulties and ASD may overlap on these dimensions (see Section 5, the prospective study)
101
it becomes increasing important to consider performance in these areas. Together these
studies highlight the need to consider both social communication and academic performance
as important factors in increased levels of BESD. Moreover, they suggest that interventions
designed to reduce levels of BESD in populations of pupils with SLCN should focus, not on
structural dimensions of language, but on social interaction and communication. Given the
reports of the high level of impact of BESD in Study 1 interventions should not be restricted
to clinical populations alone.
The fact that different respondents report different levels of BESD in the same child is not
new and to be expected given the different contexts in which children and young people
function (Lindsay, Dockrell & Strand, 2007). Study 1 is unique in also including self reports of
large numbers of pupils with SLCN and highlights the young people’s own concerns in this
area. Importantly no differences between raters on the impact score were evident suggesting
that despite differences in reported levels of problems across contexts the difficulties were
affecting functioning. Impact was also the scale that related to language and literacy
measures in Study 2. Examining the features of the impact scale and the ways in which
these features are specific to language and communication requires further examination.
There has been increasing concern about levels of BESD in children experiencing SLCN.
These two studies demonstrate that there is no simple correlation between these two
dimensions in school age pupils. Rather they highlight the complex interplay between social
communication, SES and academic performance and levels of behaviour emotional and
social difficulties.
102

8. PREFERRED OUTCOMES: ONLINE SURVEY OF PARENTS’ VIEWS Sue Roulstone and Helen Hambly
8.1 Aims of the study The overall aim of the ‘preferred outcomes’ project is to improve the mechanisms for
evaluating outcomes so that they take account of outcomes valued by children and young
people with speech, language and communication impairment and their families. In the first
interim report, we reported on the qualitative investigation of the perspectives of children and
their parents. This study is a quantitative component which sought views from a wider range
of parents. The specific objectives were to:
(i) investigate hierarchy in outcomes that parents value for their children with SLCN
(ii) explore differences in parents’ priorities depending on the nature of their child’s
difficulties.
(iii) explore appropriate timescales for setting goals
8.2 What we have done Findings from the parent focus groups informed the development of an online questionnaire.
Links to the questionnaire were then distributed by national and local support groups and
contacts in special schools via email; details of the survey were also posted on the
programme website, with links from the websites of national and local parent groups and
third sector organisations.
Parents were asked to indicate the age of their child and the nature of their child’s
impairment. They were then asked to rate on a scale of 1 to 5 the importance of various
outcomes that had been identified by parents in the focus groups. Parents were also asked
about their children’s next steps and the timescales they find useful for goal setting with their
children.
Descriptive data are provided on the frequency of parents’ priorities, the relative priority that
they give to different areas of their children’s lives. Differences between parents who had
children with different impairments were explored using inferential statistical methods. Text
responses from parents about the next goals for their children were coded and/or
summarised thematically.
103

8.3 What we have found 8.3.1 Participants
Ninety parents completed the survey. Respondents’ children ranged between 4 months and
18;11 years, mean age 10;4 years. 27.8% were girls and 72.2% were boys. Parents
described their children as having a variety of SLCN with the majority of children having
more than one difficulty or diagnosis. Most common SLCN included autism spectrum
disorder (ASD, 57%), learning difficulties (44%), expressive difficulties (40%).
Parents’ children were educated in a variety of ways (see Table 6.1).
Table 8.1 Type of school attendance by parents’ children
% of sample
Special Schools 34.8
Mainstream 33.7
ASD Resource base 10.1
Home Educated 10.1
Language Resource Base 5.6
Pre-school 5.6
8.3.2 Parents’ priorities
Parents most frequently rated independence, staying safe and improving communication as
important or very important outcomes for their children. In contrast, only 34% of parents
rated academic achievements as important or very important (see Figure 6.1).
104

Figure 8.1: Percentage of parents rating as important or very important
Some differences were found between parents in their priorities for their child which were
associated with their child’s difficulties. For example “Coping with change” was rated as
important more frequently by parents of children with ASD (F (1,88) = 5.58, p= 0.02) than for
other groups. “Academic achievements” were rated as important less frequently by
parents of children with learning difficulties (F (1,88) = 7.56, p < 0.01) than for other groups.
There were no impairment specific differences in parents’ importance ratings for
independence, inclusion and other school achievements. There were no significant
differences between parents in their priority ratings that were related to the age or sex of
their child.
8.3.3 Parent’s views on ‘next steps’ for their children
Parents were asked about the next three steps that they wished for their child to achieve.
These were coded and counted. A quarter (23.3%) did not answer the question, but from the
remaining respondents across all ‘next steps’ the most frequent goals were related to
socialising with others, mentioned by 37.8% of 90 parents; general communication of needs
or thoughts (27.8%); specific speech related goals (26.7%) and independence (24.4%).
Other frequent goals included dealing with emotions, such as coping, self esteem and being
happy (14.4%) and developing confidence in various areas, including speaking, socialising
and life skills (12.2%). A number of other next steps were mentioned, such as transition
from one school to another or from school to employment, getting help from speech and
language therapists, achieving something that their child wished to achieve, being more
aware of others needs and wants, understanding money and getting a boy or girl friend.
105

8.4 Conclusions Independence and inclusion were valued as important outcomes for their children by the
majority of parents, irrespective of the nature of their child’s difficulties. Staying safe,
communication skills, friendships and social confidence were also very important outcomes
for their children according to most parents. Whilst communication skills are routinely
evaluated within intervention studies and services, independence, inclusion, staying safe,
friendships and social confidence are not. Conversely, academic achievements are often
evaluated, but these were relatively less important to parents than other outcomes. The
sample of parents included a relatively high number of parents with children with ASD and
complex needs. Therefore there may be more emphasis on aspirations of parents for
socialising with others and independence within this sample – it is difficult to know how
representative it is of children with SLCN in general. Nonetheless, when responses were
explored between parents of children of different ages and with different diagnoses, there
were no differences in their relative ratings of independence and inclusion suggesting that
positive outcomes in these aspects of their children’s lives are valued by most parents
irrespective of the nature of their child’s difficulties. Interventions and evaluation frameworks
should take into consideration these more functional outcomes that are valued by parents.
106

9. ECONOMIC EFFECTIVENESS PROGRAMME
Jennifer Beecham, James Law and Dr Biao Zeng
9.1 Aims of the project The overarching aim of this work stream of the Better Communication Research Programme
(BCRP) was to extend the use of health and social care economics theory and methods in
SLCN research so research findings could better inform commissioners and providers. This
aim was broken down into two broad objectives:
• To ensure that a baseline of information on methods and approaches is in place to
inform future cost and cost-effectiveness evaluations of SLCN interventions.
• To provide some early indications of the associations between costs, inputs and
outputs, including exploring the potential of national datasets.
Building on the previous two objectives, a third was:-
• To help ensure that studies commissioned or undertaken within the Better
Communications Programme would be designed and implemented in such a way
that facilitated good quality cost and cost-effectiveness evaluations.
9.2 What we have done
The team has developed four strands of work feeding into the objectives listed above. Each
plays a part in improving the availability of information and in improving knowledge about the
way SLCN health and social care resources are used at both the macro- (national) and
micro- (intervention/user) levels. Although relatively discrete at present, these findings will be
further integrated into other elements of the Better Communication Research Programme as
they come together.
107

9.3 What we have found
9.3.1 Project 1
A comparison of service provision and social disadvantage for children with SLCN
across health and education sectors
Much of the work within this aspect of the BCRP has focused on the micro-level but we have
also undertaken to try to pull together routinely-collected national level data from both
education and health systems to look at the extent to which reported rates of SLCN vary
across the country and the extent to which they can be predicted by socio-economic
indicators. For many years one of the outstanding issues associated with SLCN is the
funding for speech and language therapy services. These are commonly funded through the
NHS but are delivered to many children through local authorities and specifically schools.
The education data have been explored in detail in Section 3 but the issue of how many
children are identified in the two services has never previously been addressed.
Our study combined educational data and NHS data accessed through the relevant open
access websites36,37. These data are reported at the local authority level, the level at which it
is possible to read across from the different database. The former include the number of
pupils and the number of those with SLCN in primary and secondary schools across
England on school action plus or with statements of educational need38. This analysis draws
upon essentially the same dataset as that used by Meschi, Micklewright and Vignoles
(Section 3) but the data are aggregated to LA level, as stated above. It is both narrower in its
application in the sense that it takes a much more restricted set of variables and broader in
the sense that it links the educational data across to NHS datasets, something that has yet
to be achieved in this field. The NHS source, by contrast, provides data on the number of
initial speech and language therapy contacts, the number of speech and language therapists
in post in a given authority and the amount of spend per child. Although it is possible to
obtain data on the age range of the new contacts it was not possible to obtain information
from NHS sources for example on SLTs working specifically with children or on the spend
36 Department of Education.(2011). Table 23: State-funded primary schools: Number and percentage of pupils with statements of special educational needs (SEN) or at School Action Plus by type of need, by local authority area and region, England, January 2011. 37 NHS Information Centre. (2005,2007,2009). 38 http://www.education.gov.uk/rsgateway/DB/SFR/s001007/index.shtml (accessed July,2011) Department of Education. (2011).Table 9a: State-Funded Primary schools: Number of pupils by age as at 31 August 2010, by Local Authority Area and region. Department of Education. (2011).Table 9b:State-Funded Secondary schools: Number of pupils by age as at 31 August 2010, by Local Authority Area and region. http://www.education.gov.uk/rsgateway/DB/SFR/s001012/index.shtml (accessed July,2011)
108

specifically on SLT for children. There are a variety of reasons for this reflecting the way that
services are funded and audited.
We were interested in the extent to which service use and provision reflected social
disadvantage. For the latter we then drew on the Income Deprivation Affecting Children
Index (IDACI)39 in each local authority. The IDACI is specifically aimed at identifying social
disadvantage as it refers to children and young people. It is expressed as the proportion of
all children aged 0-15 living in income deprived families. We also include two additional
datasets namely spending per child in the NHS40, and number of speech and language
therapy staff41, 42 . To match the data from different resources to identical geographic zones,
we converted them to local authority level employing software called GeoConvert
(http://geoconvert.mimas.ac.uk/) available from the University of Manchester’s MIMAS
centre43.
The proportions of children being identified differed in the two systems, generally showing
higher figures within the education system: for example, the primary SLCN prevalence
(2.3%44) is higher than the percentage (1.4%) of 5-9 years children who look for SLT service
in the NHS. Both are notably lower than would be anticipated from most sources of
prevalence data in the field reflecting the shortfall between assessed levels of need identified
by formal assessment and need reported by teachers or reflected in referrals to services.
The number of pupils with SLCN in primary schools, but not secondary schools, was
associated with social disadvantage, which is reflected by IDACI. The IDACI remains
correlated to the use of NHS resources and to initial NHS contact numbers of both 5-9 years
and 10-15 years olds. Interestingly the number of children identified in secondary school is
correlated with the number of NHS referrals but the same is not true for those in primary
school. The number of SLT staff is associated with SLCN numbers in primary but not 39 Department of Communities and Local Government. (2011). Indices of Deprivation 2010: The Income Deprivation Affecting Children Index and the Income Deprivation Affecting Older People Index. http://www.communities.gov.uk/publications/corporate/statistics/indices2010 (accessedJuly,2011 ) 40 Children’s Service Mapping. (2008). Total spend and budget. http://www.childrensmapping.org.uk/tables/profile-7/table-2125/struc-pct/year-2008/ (accessedJuly,2011) 41 NHS. (2005).Table 7: NHS speech and language therapy service. http://www.ic.nhs.uk/statistics-and-data-collections/hospital-care/outpatients/nhs-speech-and-language-therapy:-summary-information-for-2004-05-england (accessed in July,2011 ). 42 NHS Information Centre. (2009). NHS hospital and community health services: Qualified Speech & language Therapy staff (provided by NHS IC following email contact). 43 http://geoconvert.mimas.ac.uk/ 44 It is important to note that this figure is derived for the age range five to eleven years rather than seven years the time point used by in a rather different way from the 3 % figure cited by Meschi, Micklewright and Vignoles (p.24 above) to derive their 3% figure.
109

secondary school. Finally, both the per-child NHS spend and the number of SLT staff are
significantly correlated with the IDACI. This indicates that, even accounting for population
size, more SLTs and higher NHS spending are invested in more socially disadvantaged
areas. We anticipate submitting this paper to a peer-reviewed journal in due course.
Such analyses begin to describe the current picture of SLCN resource allocation and identify
associations at the area level (local authority or health trust area); we can ‘explain’ variation
between areas. However, there is much variation within areas both in terms of the number
and needs of the children and the types and intensity of supports offered. It is at this level –
and in the context of resource scarcity – that local studies of provision and interventions can
be helpful in adding to the body of knowledge that decision-makers draw on when
commissioning or providing services.
To date, our work at this level has focused on topics that will help commissioners, service
managers and clinicians better support children with SLCN. We have sought to ensure we
do not ‘re-invent the wheel’ but start by understanding what research can already tell us. By
pulling together existing research findings and best economic evaluation practice we have
begun to develop ideas around applying economics techniques to SLCN research and
disseminate knowledge to SLCN researchers.
9.3.2 Project 2
A review of the cost effectiveness literature related to provision for children with
primary speech and language difficulties
Our first task was to undertake a review of the current ‘state of play’ in cost-effectiveness
evaluation in the UK research and the resulting paper has been accepted by an academic
journal that is commonly read by SLTs and their managers45.
Our initial work46 for the Bercow Review47 had identified a paucity of literature and the rare
application of economic principles in intervention studies and we hoped that the wider search 45 Law, Zeng, Lindsay, Beecham, (in press). "The cost-effectiveness of interventions for children with Speech Language and Communication Needs (SLCN): A review using the Drummond and Jefferson (1996) "Referee's Checklist""The International Journal of Language and Communication Disorders. 46 Lindsay, G., Dockrell, J.E., Desforges, M., Law, J., & Peacey, N. (2010) Meeting the needs of children with speech, language and communication difficulties. International Journal of Language and Communication Disorders. 45, 448-460. 47 Bercow, J. (2008) The Bercow Report A Review of Services for Children and Young People (0–19) with Speech, Language and Communication Needs. Nottingham: DCSF.
110

and investigation allowed within the Better Communication Research Programme would
reveal a better grounding. We then went on to carry out a formal review of available cost
effectiveness studies using high quality methodological standards, specifically a checklist
more commonly applied in adult health care economic evaluations48. All of the five studies
included in the final review focussed on young (2-11 years) children and most compared
clinic-based and parent-administered interventions. One of the key issues derived from the
studies was the “perspective” from which the services were costed. Some cost only in terms
of one specific service (health or education), others consider the parental costs
(transport/loss of earnings etc). Others attempt to adopt a ‘societal perspective’, capturing all
the costs involved.
The studies provided variable levels of detail on the key elements needed but few provided
sufficient details of costs to draw comparisons across studies. Only two of the studies
attempted to bring together costs and effectiveness data. The studies point to the
importance of home-based and indirect intervention and, in many cases, emphasise the
parental perspective and in particular the extent to which parental involvement in an
intervention should be costed. Predictably if it is not, interventions often appear much more
cost effective than if they are.
There is a need for intervention studies to include a cost dimension based on readily
comparable methods of establishing unit costs49 and for greater use to be made of cost-
effectiveness analysis more generally. Our overall conclusion from this work was that the
methods of cost-effectiveness analysis as used in health care are well-developed and highly
suitable for use in evaluating SLCN interventions. However, our review showed that there
were some basic techniques that, to date, were not undertaken consistently across studies,
and did not follow best practice. Examples that we hope to address are the estimation of unit
costs, the perspective to employ, and the analytic techniques available to link costs and
outcomes.
48 Drummond, M.F., & Jefferson, T.O. (1996). Guidelines for authors and peer reviewers of economic submissions to the BMJ. BMJ ,313,275-283. 49 Beecham, J. (2000). Unit costs – not exactly child’s play. Canterbury: Department of Health Dartington Social Research Unit and Personal Social Services Research Unit, University of Kent.
111

9.3.3 Project 3
Estimating unit costs of speech and language therapy for children with primary
speech and language difficulties
Unit costs underpin any cost evaluation. Our review of relevant research papers found that
these are commonly underestimated, perhaps considering only salaries rather than the full
cost of providing a SLT or particular intervention. Moreover, while evaluations often show in
some detail the impact of interventions (perhaps the improvement in a particular area of
speech), they rarely are so detailed in terms of describing the inputs (such as staff time or
use of buildings and equipment) that are employed to generate the good outcomes. Building
on economic theory and a long-running programme of unit costs calculation at the Personal Social Services Research Unit (PSSRU), we have set out the various challenges in
estimating unit costs, and the reasons why such an approach is important.
We found that there were four challenges relating to the level of detail about the therapists,
the participants, the scope of activities, and parents.
• Detailed descriptions are an important pre-curser to estimating costs.
• Further stages are to identify the activities of the service and a relevant unit of
measurement, (perhaps an hour of working time or number of patient contacts per
week),
• to estimate the cost implications of all service elements identified at the descriptive
stage,
• and finally to calculate the unit cost by totalling the costs of each service element and
dividing this by the number of ‘units’ of interest.
Different assumptions made about any of these elements had a marked effect on the cost of
the intervention. Nationally-applicable unit cost data for speech and language therapists can
be used as a reference point, but sufficient descriptive data about delivery and receipt of the
intervention are key to accuracy. This paper has now been submitted for publication50.
50 Beecham, J., Law, J., Zeng, B. & Lindsay, G. The costs of speech, language and communication interventions for children – submitted.
112

9.3.4 Project 4
Dosage and the provision for children with SLCN: the relationship of effect size to
intensity, duration and amount of intervention
Our final piece of work this year has been to try and explore whether there is a ‘dosage
effect’ in SLCN interventions. This is an important question. On the one hand too many SLT
sessions, that is, more sessions than are required to generate the optimum positive change
in SLC abilities (outcome), is likely to be a waste of scarce resources. On the other hand, too
few sessions might mean that any positive benefits that do occur are not maintained as the
child grows up; again a waste of resources. This attempt to capture “how much” intervention
is needed has similar policy resonances to those associated with the Improving Access to
Psychological Therapies initiatives51 a programme of “talking therapies” designed to
promote health and wellbeing in children and young people in England52.
To address this issue we have re-analysed data from the 2003 Cochrane review53 which
provides the most robust available intervention data. To focus the analysis we looked at
three different types of outcomes namely phonology, syntax and vocabulary. We then plotted
intensity, duration and amount of the intervention against the reported effect size achieved
by the intervention.
Of necessity our conclusions are tentative at this stage but it does look as if the different
intervention focus leads to a different relationship between dosage and effect size. Thus:
• For intervention targeting phonology overall amount and intensity are associated with
effect size but duration is not, suggesting that intensive interventions are likely to
perform better than those of long duration.
• By contrast, for improvements in syntax, the data seem to suggest that duration is
key; longer, more drawn out interventions are more effective.
• And finally for improvements in vocabulary a third picture emerges from the data,
suggesting that, although longer duration brings better vocabulary outcomes, more
51 www.iapt.nhs.uk 52 Department of Health (2011) Talking therapies: A four-year plan of action: A supporting document to No health without mental health: A cross-government mental health outcomes strategy for people of all ages London: Department of Health. 53 Law J, Garrett Z, & Nye C. (2003). Speech and language therapy interventions for children with primary speech and language delay or disorder (Cochrane Review). In: Reviews 2003, Issue 3. Art. No.: CD004110. DOI: 10.1002/14651858.CD004110.
113

intensive intervention does not necessarily do so. This suggests that regular short
bursts of intervention over a longer period may be the optimum model of service
delivery for those aiming to promote vocabulary development.
These findings remain provisional as this stage and as we confirm our findings we hope to
identify whether there is an optimum level of intervention beyond which any additional
benefits are marginal. Again, we anticipate submitting this paper to a peer-reviewed journal
in due course.
9.4 Conclusions
Thus the work to date has taken a ‘pincer-like’ approach to understanding allocation of
resources through exploration of the national picture by integrating and analysing routinely-
collected data, and by examining local service provision through existing evaluations.
Dissemination of this information is key to a wider understanding of how resources are
allocated currently, and identifying ways allocation can be improved.
Outstanding tasks for next year include completing the analysis and the publication
programme described above. We plan to provide a simple guide for those interested in
carrying out local cost audits. We are also proposing to extend this work by looking at cost
data collected in other parts of the BCRP such as within the prospective study and the
stammering intervention sub-project, both referred to elsewhere in this interim report.
114

10. PROSPECTIVE COHORT STUDY OF SLT SERVICES FOR YOUNG CHILDREN
WHO STAMMER IN ENGLAND Sue Roulstone and Rosemarie Hayhoe
10.1 Aim This research aims to determine the outcomes of the treatment that young children who
stammer (CWS) receive in community clinics and to determine the factors that impact upon
treatment implementation and outcome.
We report on progress to date. This has raised important questions about the research
governance systems for multi-site research
10.2 Background Stuttering is a low-incidence impairment so the numbers of children being referred to any
particular service are relatively low. Provision for these children varies between and within
services. Services vary in the interventions offered and even within a particular type of
intervention, there will be variation in how it is delivered: for example, services vary in the
number of therapists who are trained to use the Lidcombe Program (LP), and very few use
this program exclusively; evidence suggests that therapists do not use the LP as set out in
the manual. Furthermore, services vary in the level of expertise offered. For example, some
services identify one or more therapists who service the majority of the stammering
workload, thus building experience and expertise in the intervention techniques; in other
services, children who stammer are seen by their local therapist who may or may not have
specific training in any particular approach. Research into the differing approaches has so
far produced strong54 evidence only for the LP; other approaches have only indicative
evidence to date.
Given these differences between therapists and services, it was felt that a comparative
study, of one service with another, would be invalid or impossible to design. However, a
cohort study, with sufficient power to take account of the variation, would be able to
investigate associations between service variation, child variation (in age and severity for
example) and outcomes.
54 Lindsay, et al (2010), Section 2
115

10.3 What we have done 10.3.1 Design
This is a prospective cohort study with pre and post-intervention measures and information
on the intervention received and on child and family variables. A target recruitment of 200
children was established in order to provide sufficient power for analysis of explanatory
variables. A minimum of 10 departments were needed to obtain necessary numbers of
children within the study time-frame. Departments were recruited via British Stammering
Association networks and Royal College of Speech & Language Therapists managers’
networks.
The aim was to establish at least 10 departments with a range of services for children who
stammer, a range of expertise, with low and high referral rates and populations with diverse
demographic characteristics. The original protocol required a six month follow-up. However,
because of various delays (see below), this has been amended to a four month follow-up
period. Although not ideal, this period of time for children under the age of seven years still
provides valid and useful data on the impact of any intervention offered.
10.3.2 Participants
• Children aged up to 6:11 years at the beginning of treatment with a consensus diagnosis
of stammering between parent and SLT.
• Speech and language therapists in the general community (NHS clinics), including trusts
with both low and high referral rates in order to account for possible association of high
referring areas, specialist facilities and outcomes.
10.3.3 Progress to date
Set-up period
Organisation of the study, obtaining the necessary approvals and recruitment of the study
has been problematic at every stage. In summary, the difficulties have included:
116

R&D governance processes
• Some R&D departments have seen the design of the study as unproblematic and
have approved the study within a couple of months.
• Some see the study as unproblematic but because of staff changes or illness have
misplaced or delayed the study.
• Some departments have required changes to the study design which has in turn
required us to return to the ethics committee for approval of amendments.
SLT issues
• In some instances the recruitment process set out in our protocol was not seen to be
viable by local departments, thus requiring changes to protocol and to the related
documentation for the study which then required ethical approval before seeking
local R&D approval.
• Local management changes were placing such a strain on local SLTs that one
department has withdrawn despite their initial enthusiasm to be involved and the
completion of the lengthy R&D approval process. Four additional recruited Trusts are
undergoing major structural & management changes which have increased non-
clinical workload and had a negative impact upon staff morale. These departments
wish to contribute to the study and are hopeful that by early September staff will be
able to resume their usual level of clinical activity and so recruit children to the study.
• SLTs who are engaged in the study are not experienced researchers and therefore
not used to the process of identifying children for studies or in recruiting them.
Working through the issues related to a study therefore requires time and support.
Data protection issues
The study requires sending digitised language samples to our team at the University of the
West of England (UWE). There were varying levels of scrutiny in terms of the questions and
requirements related to this process, despite the fact that the samples are anonymised and
approved by parents before they are sent (a process approved by the ethics committee).
We are collaborating with a research group in Canada in order to use a new assessment
that investigates children’s functional communication. As part of the agreement, we will be
sending copies of this anonymised data (agreed by parents in their consent sheet and
117

approved as such by ethics) to the Canadian research group. Some data protection groups
were not happy that data was being transmitted out of the country.
Recruitment
By the end of July:
• 16 Trusts expressed an interest
• 12 Trusts agreed to participate in the study, and R&D approval was obtained
• 36 therapists within those Trusts agreed to participate
• 11 therapists had recruited children to the study
• 29 children had been recruited.
10.4 Conclusions In conclusion, the research process has highlighted the difficulties of working with a low
incidence group that is managed in a wide variety of ways across the country. It has further
highlighted the vagaries of the current system for the governance of multi-site research. The
research team have worked successfully with the Research Offices and Ethics Committee to
resolve each issue. We are now in a position to complete recruitment and with a short
extension could also complete the follow-up of these children.
A recent study of children who stammer in the Avon Longitudinal Study of Parents and
Children demonstrated that those children whose stammer persists to the age of eight
present with significantly more difficulties in areas of friendships and bullying. Furthermore,
their academic achievements were also lower than their non-affected peers (Hayhoe et al, in
preparation). This study, which looks at children who stammer up to the age of 7 years could
therefore provide important information about that would increase our understanding of the
variation in outcome and therefore indicate ways to improve outcomes for these children.
118

REFERENCES Allen, G., (2011a). Early intervention: The next steps: An independent report to Her
Majesty’s Government. HM Government. London: Cabinet Office.
Allen, G., (2011b). Early intervention: Smart investment, massive savings. The second
independent report to Her Majesty’s Government. London: HM Government Cabinet
Office
Baird, G., Dworzynski, K., Slonims, V., & Simonoff, E. (2010). Memory impairment in
children with language impairment. Developmental Medicine and Child Neurology,
52 (6), 535-540.
Beecham, J. (2000). Unit costs – not exactly child’s play. Canterbury: Department of Health
Dartington Social Research Unit and Personal Social Services Research Unit,
University of Kent.
Beecham, J., Law, J., Zeng, B. & Lindsay, G. (submitted). The costs of speech, language
and communication interventions for children.
Beitchman, J.H., Wilson, B., Brownlie, E.B., Inglis, A., & Lancee, W. (1996). Long-term
consistency in speech/language profiles II: Behavioral, emotional and social
outcomes. Journal of the American Academy of Child and Adolescent Psychiatry, 35,
815-825.
Bercow, J. (2008). The Bercow report: A review of services for children and. young people
(0–19) with speech, language and communication needs. London: DCSF. Retrieved
from http://www.dcsf.gov.uk/bercowreview/docs/7771-DCSF-BERCOW.PDF
Bishop, D.V.M. (1997). Uncommon understanding: Development and disorders of language
comprehension in children. Hove: Psychology Press.
Bishop, D.V.M. (2003). The Children’s Communication Checklist, version 2. Pearson
Assessment, London.
Bishop, D.V.M. (2004). Expression, Reception and Recall of Narrative Instrument (ERRNI).
Pearson Assessment, London.
Bishop, D.V. M. (2005). Test for Reception of Grammar – Electronic. The Psychological
Corporation Limited: London.
Clegg, J. and Ginsborg, J. (2006.) Language and Social Disadvantage. Chichester: John
Wiley and Sons Limited.
Constantino, J.N., & Gruber, C.P. (2005). The Social Responsiveness Scale Manual. Los
Angeles: Western Psychological Services.
Constantino, J.N, et al. (2009). Developmental course of autism social impairment in males,
Development and Psychopathology, 21, 127-138
119

Conti-Ramsden, H., & Botting, N. (1999) Classification of children with specific language
impairment: longitudinal considerations. Journal of Speech, Language and Hearing
Research, 42, 1195-1204.
Conti-Ramsden, G., and Botting, N. (2008). Emotional health in adolescents with and without
a history of specific language impairment (SLI). Journal of Child Psychology and
Psychiatry, 49, 5 pp 516–525.
Conti-Ramsden, G.M., Durkin, K., Simkin Z., Knox, E. (2009). Specific language impairment
and school outcomes. I: identifying and explaining variability at the end of compulsory
education. International Journal of Language and Communication Disorders, 44, 15-
35.
Department of Health (2011). Talking therapies: A four-year plan of action: A supporting
document to No health without mental health: A cross-government mental health
outcomes strategy for people of all ages. London: Department of Health.
Dockrell, J.E., Lindsay, G., Letchford, B., & Mackie, C. (2006). Educational provision for
children with specific speech and language difficulties: perspectives of speech and
language therapy service managers. International Journal of Language and
Communication Disorders, 41(4), 423-440.
Drummond, M.F., & Jefferson, T.O. (1996). Guidelines for authors and peer reviewers of
economic submissions to the BMJ. British Medical Journal, 313, 275-283.
Dunn, L. M., Dunn, D. M., Sewell, J., Styles, B., Brzyska, B., Shamsan, S., & Burge, B.
(2009). The British Picture Vocabulary Scale: Third Edition. GL Assessment Limited,
London.
Dunn, D.M., Dunn, L.M., Whetton, C., and Burley, L. (1997). British Picture Vocabulary Scale
(2nd Edition). Windsor, UK. NFER-Nelson.
Durkin, K. and Conti-Ramsden, G. (2007). Language, social behavior, and the quality of
friendships in adolescents with and without a history of specific language impairment.
Child Development, 78, 5, 1441 – 1457.
Elliot, C. D., Smith, P., & McCulloch, K. (1997). British Ability Scales. NFER-NELSON
Publishing Company: Berkshire.
Expert Review of Pharmacoeconomics & Outcomes Research, 5 (3), 353-364.
Florian, L., Hollenweger, J., Simeonsson, R. J., Wedell, K., Riddell, S., Terzi, L., et al.
(2006). Cross-cultural perspectives on the classification of children with disabilities:
Part I. Issues in the classification of children with disabilities. Journal of Special
Education, 40(1), 36-45.
Fujiki, M., Brinton, B., & Clarke, D. (2002). Emotion regulation in children with specific
language impairment. Language Speech and Hearing Services in School, 33, 102-
111.
120

Goodman, R. (1997) The Strengths and Difficulties Questionnaire: A research note. Journal
of Child Psychology and Psychiatry, vol. 38, pp. 581-586.
Goodman, R. Ford, T., Simmons, H. Gatward, R. and Meltzer, H. (2000). Using the
Strengths and Difficulties Questionnaire (SDQ) to screen for child psychiatric disorders
in a community sample. British Journal of Psychiatry, 177, pp. 534-539.
Joffe, V.L. (2011). Narrative intervention programme. Milton Keynes: Speechmark Publishers.
Katelaars, M.P., Cuperus, J., Jansonius, K., & Verhoeven, L. (2010). Pragmatic language
impairment and associated behavioural problems. International Journal of Language
and Communication Disorders, 45, 204-214.
Law J, Garrett Z, & Nye C. (2003). Speech and language therapy interventions for children
with primary speech and language delay or disorder (Cochrane Review). In: Reviews
2003, Issue 3. Art. No.: CD004110. DOI: 10.1002/14651858.CD004110.
Law, J, Zeng, B. Lindsay, G. Beecham, J. (in press). The cost-effectiveness of interventions
for children with Speech Language and Communication Needs (SLCN): A review
using the Drummond and Jefferson (1996) "Referee's Checklist". International
Journal of Language and Communication Disorders.
Leonard, L. (1998). Children with specific language impairments. Cambridge, MA: MIT
Press.
Lindsay, G., Dockrell, J.E., Desforges, M., Law, J., & Peacey, N. (2010) Meeting the needs
of children with speech, language and communication difficulties. International
Journal of Language and Communication Disorders. 45, 448-460.
Lindsay, G., Dockrell, J.E., Law, J., Roulstone, S., & Vignoles, A. (2010) Better
communication research programme 1st interim report. London: DfE.
http://publications.education.gov.uk/eOrderingDownload/DFE-RR070.pdf
Lindsay, G., Dockrell, J. & Strand, S. (2007). Longitudinal patterns of behaviour problems in
children with specific speech and language difficulties: Child and contextual factors.
British Journal of Educational Psychology, 77, 811-828.
McLaughlin, M. J., Dyson, A., Nagle, K., Thurlow, M., Rouse, M., Hardman, M., et al. (2006).
Cross-cultural perspectives on the classification of children with disabilities: Part II.
Implementing classification systems in schools. [Article]. Journal of Special
Education, 40(1), 46-58.
Pawson, R. (2006). Evidence-based policy: a realistic perspective. London: Sage
Publications
Ravens-Sieberer, U., Gosch, A., Rajmil, L., Erhart, M., Bruil, J., Duer, W., Auquier, P.,
Power, M., Abel, T., Czemy, L., Mazur, J., Czimbalmos, A., Tountas, Y., Hagquist,
C., Kilroe, J. and the European KIDSCREEN Group. (2005). KIDSCREEN-52 quality-
of-life measure for children and adolescents.
121

Roulstone, S., Law, J., Rush, R., Clegg, J. & Peters, T. (2011). The role of language in
children’s early educational outcomes. Research Brief. DFE-RB 134, ISBN 978-1-
84775-945-0
Rutter, M., Bailey, A. & Lord, C. (2003). SCQ: The Social Communication Questionnaire.
Western Psychological Services, Los Angeles
Secord, W. and Wiig, E.H. (1992). Test of Word Knowledge. San Antonio, TX. Psychological
Corporation.
Semel, E., Wiig, E.H., and Secord, W. (2004). The Clinical Evaluation of Language
Fundamentals-Fourth Edition. San Antonio, TX. Psychological Corporation.
Snowling, M.J., Duff, F., Petrou, A., Schiffeldrin, J. & Bailey, A.M. (2011) Identification of
children at risk for dyslexia: The validity of teacher judgements using ‘Phonic Phases’.
Journal of Research in Reading, 43, 157–170 DOI: 10.1111/j.1467-
9817.2011.01492.x
Snowling, M. J., Stothard, S. E., Clarke, P., Bowyer-Crane, C., Harrington, A., Truelove, E.,
Nation, K., & Hulme, C. (2009). York Assessment of Reading for Comprehension. GL
Assessment: London.
Stothard, S.E., Snowling, M.J., Bishop, D.V.M., Chipchase, B. & Kaplan, C. (1998).
Language impaired pre-schoolers: A follow-up in adolescence. Journal of Speech,
Language and Hearing Research, 41, 407-418.
Tomblin, B.J., & Zhang, X. (2006). The dimensionality of language ability in school-age
children. Journal of Speech, Language, and Hearing Research, 49, 1193-1208.
Tomblin, J.B., Zhang, X., Buckwalter, P., & Catts, H. (2000).The association of reading
disability, behavioural disorders, and language impairment among second-grade
children. Journal of Child Psychology and Psychiatry, 41, 473-482.
Van Daal, J., Verhoeven, L. & van Balkom, H. (2007). Behaviour problems in children with
language impairment. Journal of Child Psychology and Psychiatry, 48, 1139-1147.
Wechsler, D. (1991). The Wechsler intelligence scale for children—third edition. San
Antonio, TX: The Psychological Corporation.
Wiig, E. H., & Semel, E. M. (2006). Clinical Evaluation of Language Fundamentals (fourth
edition). Pearson Assessment, London.
Williams, D., Botting, N., & Boucher, J. (2008). Language in Autism and Specific Language
Impairment: Where Are the Links? Psychological Bulletin, 134(6), 944-963. doi:
10.1037/0013743
122

Appendix 1 Interventions for children with SLCN in England: A survey of speech and language therapist: Additional information
A1 Published programmes
Table A1. shows the frequency of use of the listed published programmes . The question
asked individuals to indicate which of the listed programmes with a child aged (age group
most frequently worked with), with a special educational need (most frequently worked with)
in a particular setting (the most frequently worked in). Respondents were asked to select all
that applied.
123

Table A1. Frequency of use of all programmes identified by SLTs
Published programmes used Use rarely %
Use sometimes
%
Use frequently
%
Combined sometimes /frequently
% Derbyshire Language Scheme 9.3 27.4 37.9 65Makaton 11.0 23.5 35.1 58PECS - Picture Exchange Communication System
16.4 23.7 15.1 49
Nuffield 12.5 27.8 19.0 47Core Vocabulary 9.5 23.5 17.0 40Hanen 12.7 18.8 20.9 39Social Stories (Carole Grey) 14.4 23.9 14.7 39Colourful Semantics 13.2 23.7 12.9 36Language for Thinking 13.1 15.7 15.7 31Becky Shanks Narrative packs 13.6 16.8 14.6 31Talkabout (Alex Kelly) 15.9 20.0 10.8 31Other published programme 12.5 12.1 17.9 30Intensive Interaction 14.4 16.8 14.4 30Service developed programme 8.0 7.1 20.9 28Socially Speaking 14.6 20.1 7.6 27Social Use of Language Programme 16.2 19.8 7.3 27Cued Speech 18.5 17.9 8.0 26Living Language 20.3 16.6 6.0 23TEACCH - Treatment and Education of Autistic and related Communication handicapped Children
16.2 13.1 9.3 22
Metaphon 18.8 14.2 5.8 20Comic Strip Conversations (Carole Grey) 15.9 15.5 4.5 20Signalong 14.6 7.1 7.6 14Circle of Friends 17.7 12.3 1.1 13Time to Talk 16.6 8.6 4.1 12Lidcombe Program 18.5 7.5 4.1 11Visualise and Verbalise 18.7 6.3 3.9 10Swindon Dysfluency pack 17.7 5.0 2.2 7Teaching Talking 18.8 4.1 1.9 6Talking Partners 16.4 4.7 1.3 6Language Land 16.8 3.4 1.7 5Bobath approach 18.5 4.3 0.7 5BLAST - Boosting Language Auditory Skills and Talking
17.9 1.3 1.7 3
POPAT - Programme of Phonological Awareness Training
17.9 1.7 1.7 3
Language Link 17.9 2.1 1.1 3Spirals 18.5 3.0 0.6 3Susan Myers Bumpy speech 17.5 2.6 0.4 3ABA - Applied Behaviour Analysis 20.0 3.7 0.2 3Speech Link 18.1 1.5 0.6 2Talk to your Bump 18.3 1.3 0.4 2PEEP - Peers Early Education Partnership 17.2 1.9 0.2 2N=536
When asked to specify ‘other published programmes’, 162 comments were made. Likewise,
there were 126 specified service developed programmes.
124

A2 Intervention activities
Table A2 below shows the frequency of use of intervention activities. The question asked
individuals to indicate their use of the listed interventions with a child aged (age group most
frequently worked with), with a special educational need (most frequently worked with) in a
particular setting (the most frequently worked in). Respondents were asked to select all that
applied.
Table A2 Frequency of use of intervention activities Intervention Activities Use
rarely %
Use sometimes
%
Use frequently
% Auditory discrimination activities 4.9 21.3 42.7
Phonological awareness tasks 5.0 25.6 41.4
Minimal pair discrimination or production 7.1 21.1 36.6
Barrier games 6.2 31.5 34.5
Auditory memory activities 6.9 30.8 31.2
Narrative therapy 8.4 31.5 27.1
Traditional articulation activities 8.8 22.6 25.4
Rhyme awareness activities 9.7 29.7 24.3
Other intervention activities 6.9 11.4 20.3
Cued articulation 16.4 20.7 13.1
Auditory bombardment/focused auditory stimulation 12.5 19.6 10.4
N=536
When asked to specify other intervention activities frequently used, 133 other activities were
reported.
125

A3 Principles or approaches
Table A3 shows the frequency of use of the following principles or approaches. The question
asked individuals to indicate their use of the listed principles/approaches with a child aged
(age group most frequently worked with), with a special educational need (most frequently
worked with) in a particular setting (the most frequently worked in). Respondents were asked
to select all that applied. Frequencies are shown in Table A3 below.
Table A3 Frequency of use of principles or approaches
Principles or Approaches Use rarely % Use sometimes %
Use frequently
% Modelling 0.4 8.0 86.8
Creating a language rich environment 1.7 10.1 71.8
Repetition 1.5 13.4 70.5
Visual approaches to support language 2.2 15.3 67.9
Providing feedback 1.7 12.5 67.0
Forced alternatives 2.8 18.1 66.0
Waiting for response 1.3 13.1 66.0
Commenting 1.9 15.5 65.3
Reducing distractions 1.7 20.1 62.1
Reducing questions 2.1 19.2 62.1
Differentiating the curriculum 3.2 13.4 58.2
Extending 1.9 14.6 57.8
Using key words 2.6 19.4 57.6
Visual timetables 4.5 26.7 53.0
Signing 9.1 28.4 44.4
Use of symbols 7.5 27.2 41.2
Chunking 6.3 17.4 41.0
Total communication 5.6 18.3 34.7
Increasing awareness of errors 7.5 25.9 32.3
Parent child interaction (PCI) 11.8 20.1 31.9
Using objects of references 14.7 25.0 25.7
Use of alternative and augmentative communication
12.5 25.6 25.4
Task management boards 11.2 21.6 16.8
Workstations 13.8 17.4 13.6
Other principle or strategy used in intervention
3.0 3.4 8.2
Use of British Sign Language 20.3 5.0 3.9
N=536
126

A4 Frequency of delivery SLTs were asked to indicate how frequently they would personally usually deliver the
intervention they used the most with a child aged (age group most frequently worked with),
with a special educational need (most frequently worked with) in a particular setting (the
most frequently worked in). Respondents were asked to select one only (Table A4).
Table A4 Frequency of delivery of intervention
Frequency of delivery %
Throughout the day 6.4
Once a day 1.0
Two or three times a week 9.8
Once a week 47.5
Once a fortnight 10.0
Once a month 8.2
Once a term (6 weeks) 11.6
Once a double term (3 months) 4.6
Less than once a double term 1.0
N=501
127

A5 Specific outcomes Respondents were asked what specific outcomes they were targeting for the broad based
outcomes they had previously identified. Please note that this question only appeared for the
broad based outcome/s which individuals had selected previously, therefore the sample
base varies for each question. Percentages are based on the number of respondents these
questions were posed to (N), after question routing and filtering.
Among the most frequently reported specific outcomes for communication is the improved
use of communication skills and improved attention and listening skills, identified by around
three-quarters of respondents (Table A5).
Table A5 Specific outcomes targeted for Communication
Specific outcomes: Communication %
Improved attention and listening skills 75.6
Improved use of communication skills (e.g. non-verbal clues,
initiating)
74.1
Improved social skills 54.3
Improved parent/child interaction 48.4
Provision of a means of communication 43.2
Improved pre-verbal skills 35.8
Improved inference/verbal reasoning skills 29.1
Other 3.7
N=405
Note: Respondents could choose one or more outcomes
Improved understanding of language, and improved expressive language were specific
outcomes identified by 90% of responding SLTs. Extended vocabulary was another likely
outcome, which just under three-quarters of this sample identified (Table A6).
Table A6 Specific outcomes targeted for Language
Specific outcomes: Language %
Improved expressive language 90.3 Improved understanding of language 90.1 Extended vocabulary 73.7 Improved narrative skills 42.2 Improved word finding 40.1 Other 3.0 N=372
128

129
Note: Respondents could choose one or more outcomes The most commonly reported specific outcome for speech sound system was increased
intelligibility (90%). Improved phonological awareness/speech processing skills and change
in speech sound system were also frequently identified, as was consistency of speech
production (Table A7).
Table A7 Specific outcomes targeted for Speech Sound system
Specific outcomes: Speech sound system %
Increased intelligibility 90.0
Change in speech sound system 73.3
Improved phonological awareness or speech processing skills 72.8
Consistency of speech production 70.6
Improved oro-motor skills 35.6
Other 1.1
N=180 Note: Respondents could choose one or more outcomes
Almost three-quarters of responding SLTs reported increased participation in all activities
involving verbal communication (Table A8).
Table A8 Specific outcomes targeted for Fluency
Specific outcomes: Fluency %
Increased participation in all activities involving verbal communication 77.8
Decreased frequency of stuttering 55.6
Reduced severity of stuttering 53.3
Awareness of fluency 51.1
Other 6.7
N=45 Note: Respondents could choose one or more outcomes i All Z scores have a mean of ) and a standard deviation of 1

Ref: DFE-RR172
ISBN: 978-1-78105-029-3
© CEDAR, University of Warwick
November 2011