Embed Size (px)
Citation preview

Better Buildings Data and Summary Report 2014 Building Technologies Office Peer Review
Dale Hoffmeyer, [email protected] DOE/EERE/BTO

Project Summary
Timeline: Start date: Oct. 2010
Planned end date: September 2014
Key Milestones
1. BBNP Summary of Reported Data
2. BBNP Data Release
3. BBNP Energy Savings Analysis Report
Budget: Total DOE $ to date: $2,845,000 (for data tasks) Total future DOE $: 0 Using funds from the American Recovery and Reinvestment Act (ARRA) and annual appropriations, the Better Buildings Neighborhood Program provided $508 million in one-time grants to states and localities in 2010.
Target Market/Audience:
Residential Energy Efficiency Program Researchers and Program Managers
Key Partners:
41 BBNP Grantees
National Renewable Energy Lab (NREL)
Navigant Consulting
Booz Allen Hamilton
Project Goal: Collect data from organizations awarded financial assistance (i.e. BBNP grantees) to test energy upgrade business models and improve building energy efficiency across the country. Use data to:
1) Populate the Buildings Performance Database (BPD),
2) Track grantee progress,
3) Evaluate impact, and
4) Identify successful strategies.
2

Purpose and Objectives
Problem Statement: More data is needed to understand the effectiveness of upgrade strategies and program models that reduce building energy use. More empirical data supporting effective strategies is foundational to the development of a self-sustaining building energy upgrade market.* Target Market and Audience: Researchers, program administrators, building contractors, and investors, that want to reduce building energy use, are interested in effective strategies, supported by data, to help them make program design, business model and investment decisions.
Impact of Project: • Programmatic data from 41 grantees across multiple states implementing diverse program
strategies over 2½ years
– 75,000+ Residential Single-Family Building records
– 9,600+ Residential Multi-family Unit records
– 800+ Residential Multi-family Building records
– 3,500+ Commercial Building records
• 21,000+ records with some energy consumption data, including about 5000 with 12 months of energy consumption before and after the upgrade.
• 12,000+ records with loans * SEE Action Residential Retrofit Working Group Roadmap for the Home Energy Upgrade Market http://www1.eere.energy.gov/seeaction/pdfs/retrofit_energyupgradesroadmap.pdf 3

Approach
Approach: Collect program and building data from grantees to contribute to a national Building Performance Database (BPD), measure progress, evaluate impact and identify successful strategies.
Identify where empirical data can validate the effectiveness of program design, driving demand, financing, and workforce development strategies.
Hypothesis: Demonstrating a variety of upgrades and program strategies can achieve energy savings will support more investment in energy efficiency.
Key Issues: • Funding Opportunity Announcement (FOA) issued before data collection requirements. • Real world programs are not randomized control trials. • Data collection underestimated diversity of strategies tested by grantees.
• Data collection system was delayed and underestimated data quality challenges.
Distinctive Characteristics: • FOA scope was multi-sector • Grantees were state and local governments • Data collection and analysis effort of this size had not been attempted before by DOE
4

What Data Was Reported?
Programmatic Data by Quarter
• BBNP Spending and Leverage Expenditures (Other federal and non-federal)
• Number of Assessments
• Number of Trained and Certified Workers
• Job Hours Worked
• Total Program Energy Savings
Building Data by Upgrade Project
• Building Information (e.g. zip code, building type, floor area, year built, occupancy)
• Invoiced Cost, Incentives (assessment and upgrade), and Loan amount
• Auditor, contractor, and professionals certifications
• Job Hours Worked (assessment and upgrade)
• Upgrades Installed (e.g. Attic Insulation, Water Heater, Air Sealing, Heat Pump, Boiler, etc.)
• Audit software and method of predicting energy savings
• Estimated Savings (assessment and upgrade)
• Monthly Energy Consumption
5

Data Quality
Information was reported by grantees using DOE reporting forms and processes. Steps were taken to verify data quality, but 100% accuracy cannot be ensured.
Three potential types of errors in data • Non-response—data that is not available, not applicable, or not
reported.
• Incorrect Response—data that is incorrect because the requested information was not understood; there was a lack of attention to detail; or information was intentionally misrepresented.
• Processing Errors—data that is incorrect because of errors introduced when processing reports (e.g. loading data into database or
querying database to extract data).
6

-
Buildings Data Completeness
Percentage of Building Records with Data
Audit Invoiced Costs: 52%
Method of Prediction: 52%
Technician Certification: 53%
Estimated Pre Upgraded Energy Consumption: 56%
Estimated Electricity Savings (kWh): 70%
Upgrade Hours Worked: 71%
Year Constructed: 72%
Floor Area: 77%
Assessment Hours Worked: 82%
Upgrade Invoiced Cost: 83%
Estimated Annual Cost Savings: 88%
Estimated Positive Energy Savings: 93%
Completion Date: 98%
6% Energy Consumption (12-months before and after upgrade)
Installed Upgrades (1 or more): 70%
0% 10% 20% 30% 40% 50% 60% 70% 80% 90% 100%
7

Project Integration and Collaboration
Project Integration: • Grantees submitted reports to web portal (or XML web service) • Data used by grants management team to identify grantees needing technical assistance. • Emailed grantees reporting issues, data health report, and summary data following each
quarterly report submissions. • Reporting check-in calls with grantees Dec. 2012 – Jan. 2013 and Sept.-Oct. 2013 to
review reporting issues and answer questions. • Data provided to evaluation team used for process and impact evaluations.
Partners, Subcontractors, and Collaborators: 41 BBNP Grantees, NREL (data queries and analysis), Navigant Consulting (grantee communications and report processing), Booz Allen Hamilton (data system development and maintenance)
Communications: • Multiple webinars for 41 grantees about reporting process. • Quarterly tables of grantee metrics for internal progress tracking • Presented preliminary data at grantee meeting May 2013 • Webinar on Measuring Outcomes and Using Benchmarks Aug. 2013 • Webinar for grantees on the Summary of Reported Data reports Feb. 2014 •
updates and address questions. Emails and calls with grants management team and evaluation team as needed to provide
8

9
BBNP Independent Evaluation
Evaluation Team: Research Into Action, Nexant, Evergreen Economics, and NMR Group
– Kick-off Meeting January 2012 ($4M budget not BTO funding)
• Preliminary Process and Market Evaluation
– Completed Spring 2013
• Preliminary Energy Savings Impact Evaluation
– Completed Fall 2013
• Final Process and Market Evaluation
– Report Anticipated Late 2014
• Final Energy Savings Impact Evaluation
– Report Anticipated Early 2015
• !dditional “Lessons Learned” Research Questions
– Anticipated 2015

Original ͞Lessons Learned͟ Research QuestionsResearch questions were divided to match performer resources. NREL Evaluation Team
1 Which program delivery models improve performance metrics?
2 What (funding) partnerships have grantees leveraged?
3 Which marketing tactics have been the most successful?
4 Did timing of a marketing campaign impact interest in the program?
5 Did using a trusted messenger approach correlate with higher program interest?
6 Did limited time offers, competitions, and other deadlines motivate customers to complete upgrades in shorter time periods or invest in a certain level of energy savings?
7 Has the use of social media affected program metrics?
8 Is there a correlation between financial incentives for the customer and program metrics?
9 Is there a correlation between financial incentives for the contractor and program metrics?
10 Which financial incentives (see slide 11) help programs achieve better program metrics?
11 Does contractor sales training correlate with program metrics?
12 What impact does contractor technical training have on program metrics?
13 What impact does contractor certification have on program metrics?
14 Did programs that actively listened to their contractors have better results?
15 Which energy savings estimation method have been the most consistent and accurate in predicting actual energy savings?
16 What improvements or combination of improvements are most common?
17 What is the distribution of energy cost savings for homes with the same improvements?
18 What improvements or combination of improvements contribute to better program metrics?
10

11
Replace with
current graph
Single-Family Home Upgraded Invoiced Cost Example
Data can be segmented
by region or climate.

12
Replace with current graph
Single-family Home Estimated Cost Savings Example
Data can be segmented
by region or climate.

BBNP Summary of Reported Data
• 1 program summary and 41 recipient summaries not an evaluation of the BBNP program.
not the grantees’ final technical report.
• Brief narrative to provide context Consistent Structure
– Funding Synopsis
– Program Design Synopsis
– Driving Demand Synopsis
– Financing Synopsis
– Workforce Development Synopsis
– Energy Savings Synopsis
• Consistent graphs and tables
Residential
Single-Family
Residential
Multi-Family
Units
Commercial
Buildings
Industrial
Buildings
Agricultural
Buildings
Assessments 138,323 84,476 7,323 36 276
Upgrades 74,690 21,330 3,547 15 163
13

-
Estimated Energy Saving/Upgrade
Commonwealth of MA (SEP)
VDMME, VA (SEP)
WDC, WA (SEP)
State of Nevada (SEP)
Austin, TX
Town of Bedford, NY
Boulder County, CO
Camden, NJ
Chicago Metro Agency for Planning
Greater Cincinnati Energy Alliance
Connecticut Innovations, Inc.
CSG, Bainbridge Island, WA
Eagle County, CO
Fayette County, PA
Greensboro, NC
Indianapolis, IN
Kansas City, MO
Los Angeles County, CA
State of Maine
State of Maryland
State of Michigan
State of Missouri
State of New Hampshire
NYSERDA
Omaha, NE
Philadelphia, PA
Phoenix, AZ
Portland, OR
San Antonio, TX
ADECA, AL (SEP)
Santa Barbara County, CA
Seattle, WA
Southeast Energy Efficiency Alliance
St. Lucie County, FL
Town of University Park, MD
Rutland, VT
Wisconsin Energy Efficiency Project
BBNP Average
Lifetime Energy Savings per Upgrade (MMBtu) Single-Family Homes
• Different program design approaches • Different mix of EE
measures • Different building types and
customer segments. • Different methods for
estimating savings
Single Family Homes Min/.321 MMBtu/upgrade Max 1785 MMBtu/upgrade
- 200 400 600 800 1,000 1,200 1,400 1,600 1,800 2,000
MMBtu
14

15
𝐿𝐸𝑆𝑟 = 𝐸𝑠𝑣𝑔𝑠,𝑟 × 𝐿𝑟
𝐿𝑟𝑒𝑠 × 𝐸𝑠𝑣𝑔𝑠,𝑟𝑒𝑠 + 𝐿𝑐𝑜𝑚 × 𝐸𝑠𝑣𝑔𝑠,𝑐𝑜𝑚 𝐿𝑟 =
𝐸𝑠𝑣𝑔𝑠,𝑟𝑒𝑠 + 𝐸𝑠𝑣𝑔𝑠,𝑐𝑜𝑚
4 𝑖=1 𝐶𝑛𝑡𝑖×𝐸𝑠𝑣𝑔𝑠,𝑖×𝐿𝑖 =𝐿𝑟𝑒𝑠 4 𝑖=1 𝐶𝑛𝑡𝑖×𝐸𝑠𝑣𝑔𝑠,𝑖
Analysis of Upgrades and Energy Savings Lifetime Energy Savings Calculation
The Lifetime Energy Savings, LES, is the total source energy savings over the expected life of the installed efficiency upgrades, expressed in MMBTU. An LES value is calculated for each grant recipient as follows:
where,
𝐿𝐸𝑆𝑟 is the Lifetime Energy Savings for grant recipient r
Esvgs,r is the total estimated annual energy savings for all projects reported by the recipient (MMBtu/yr)
𝐿𝑟 is the project weighted lifetime of the efficiency upgrades reported by a recipient, expressed in years and calculated as follows:
where,
𝐿𝑟𝑒𝑠 is the energy-savings-weighted lifetime of the residential efficiency upgrades installed for a recipient
Esvgs,res is the total estimated annual energy savings in MMBtu for all residential upgrades reported by the grant recipient
𝐿𝑐𝑜𝑚 is the project-count-weighted lifetime of the commercial efficiency upgrades installed for a recipient
Esvgs,res is the total estimated annual energy savings in MMBtu for all commercial upgrades reported by the grant recipient
𝐿𝑟𝑒𝑠 is calculated as follows:
where,
i is the type category of efficiency upgrades installed as shown in
Cnti is the number of energy efficiency upgrades of type i installed by a recipient
Esvgs,i is the assumed annual energy savings in MMBtu for each energy efficiency upgrade of type i as shown in the table A (next slide).
Li is the assumed lifetime in years for energy efficiency upgrades of type i as shown in the table A (next slide).
16
4 𝑗=1
=𝐿𝑐𝑜𝑚 4 𝐶𝑛𝑡𝑗𝑗=1
𝐶𝑛𝑡𝑗 × 𝐿𝑗
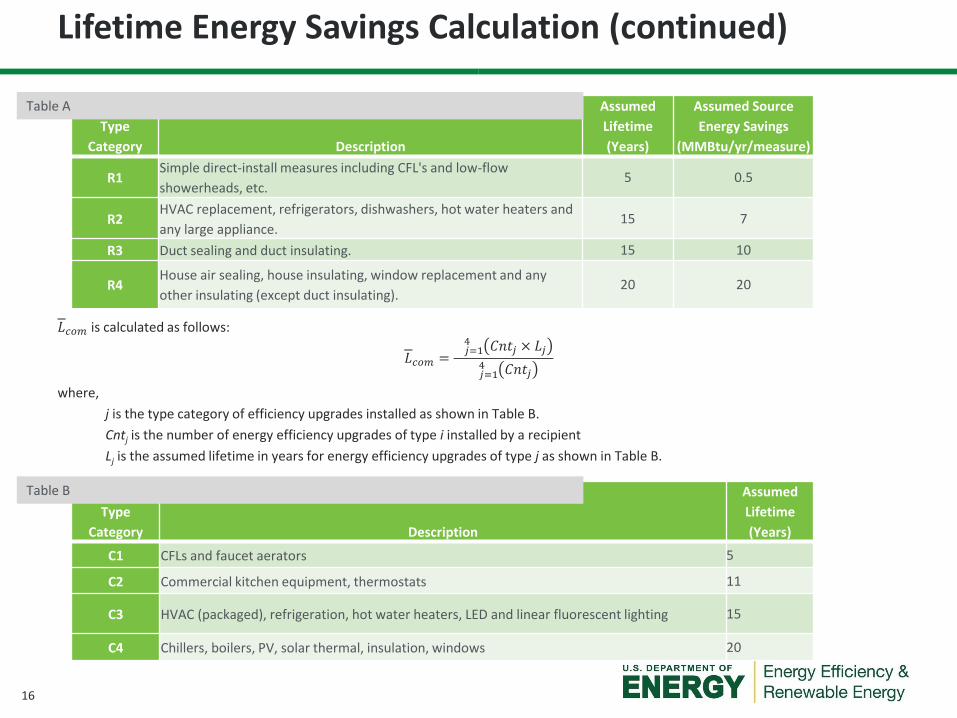
. Residential Project Energy Upgrade Categories, Lifetimes and Energy Savings Assumed Assumed Source
Type Lifetime Energy Savings
Category Description (Years) (MMBtu/yr/measure)
R1 Simple direct-install measures including CFL's and low-flow
showerheads, etc. 5 0.5
R2 HVAC replacement, refrigerators, dishwashers, hot water heaters and
any large appliance. 15 7
R3 Duct sealing and duct insulating. 15 10
R4 House air sealing, house insulating, window replacement and any
other insulating (except duct insulating). 20 20
. Commercial Project Energy Upgrade Categories and Lifetimes Assumed
Type Lifetime
Category Description (Years)
C1 CFLs and faucet aerators 5
C2 Commercial kitchen equipment, thermostats 11
C3 HVAC (packaged), refrigeration, hot water heaters, LED and linear fluorescent lighting 15
C4 Chillers, boilers, PV, solar thermal, insulation, windows 20
Lifetime Energy Savings Calculation (continued)
Table A
𝐿𝑐𝑜𝑚 is calculated as follows:
where,
j is the type category of efficiency upgrades installed as shown in Table B.
Cntj is the number of energy efficiency upgrades of type i installed by a recipient
Lj is the assumed lifetime in years for energy efficiency upgrades of type j as shown in Table B.
Table B

Upgrades and Energy Savings Analysis Report
Analysis of single-family residential projects performed by NREL; analysis questions include:
• What is average lag time between an audit and an upgrade?
• Across all projects, how many of each measure type were installed?
• What methods of prediction were used and how frequently?
• What is the distribution of annual energy savings for homes with particular improvements and combinations of improvements?
• What individual improvements or combinations of improvements are correlated to better program performance?
• For homes with sufficient PRE/POST utility data, how do estimated energy savings compare to utility-bill-calculated savings?
17

Plan to Anonymize Building Data To Protect Privacy
• Replace the project id with a new unique id (not used by the grantee)
• Replace zip code with State
• Add noise to building square footage and top-coding and bottom coding for outliers (e.g. any building with a square footage > 5000 will be reported as 5000)
• Replace year built with decade built
• Add noise to loan amount and invoiced cost
• Replace audit, upgrade and loan date with month and year
• Remove service provider names (electric, natural gas, contractors)
• Remove loan details such as customer income, customer FICO score, customer debt, and customer home valuation
• Exclude agricultural and industrial projects and any project with renewable energy systems from public release due to small sample size
• Convert monthly energy usage histories to a normalized (relative to TMY3 weather data) annual energy consumption before and after the building upgrade completion date
18
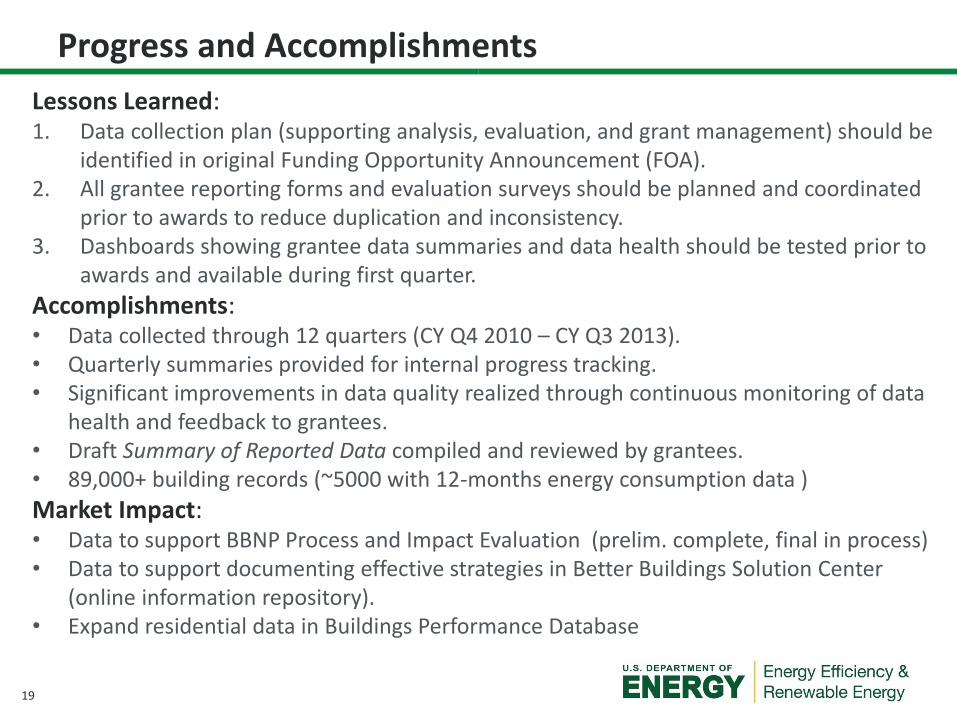
Progress and Accomplishments
Lessons Learned: 1. Data collection plan (supporting analysis, evaluation, and grant management) should be
identified in original Funding Opportunity Announcement (FOA). 2. All grantee reporting forms and evaluation surveys should be planned and coordinated
prior to awards to reduce duplication and inconsistency. 3. Dashboards showing grantee data summaries and data health should be tested prior to
awards and available during first quarter.
Accomplishments: • Data collected through 12 quarters (CY Q4 2010 – CY Q3 2013). • Quarterly summaries provided for internal progress tracking. • Significant improvements in data quality realized through continuous monitoring of data
health and feedback to grantees. • Draft Summary of Reported Data compiled and reviewed by grantees. • 89,000+ building records (~5000 with 12-months energy consumption data )
Market Impact: • Data to support BBNP Process and Impact Evaluation (prelim. complete, final in process) • Data to support documenting effective strategies in Better Buildings Solution Center
(online information repository). • Expand residential data in Buildings Performance Database
19

Next Steps and Future Plans
(April) • Anonymize Building Upgrade Project Data to protect privacy
• Grantee Project Summary Files
• Draft Upgrades and Energy Savings Analysis Report (May – June) • Release Summary of Reported Data and Data Files
• BBNP Website and /or OpenEI
• Stakeholder Webinar on Summary of Reported Data • Add buildings data to the Building Performance Database
• Estimate that up to 15,000 records may meet criteria
• Calls with Evaluation Team to answer questions about data • Developing Residential Guide for Benchmarking Program Progress
• Plan to include example benchmarks based on BBNP data • Stakeholder comment period and pilot testing
20

REFERENCE SLIDES
21
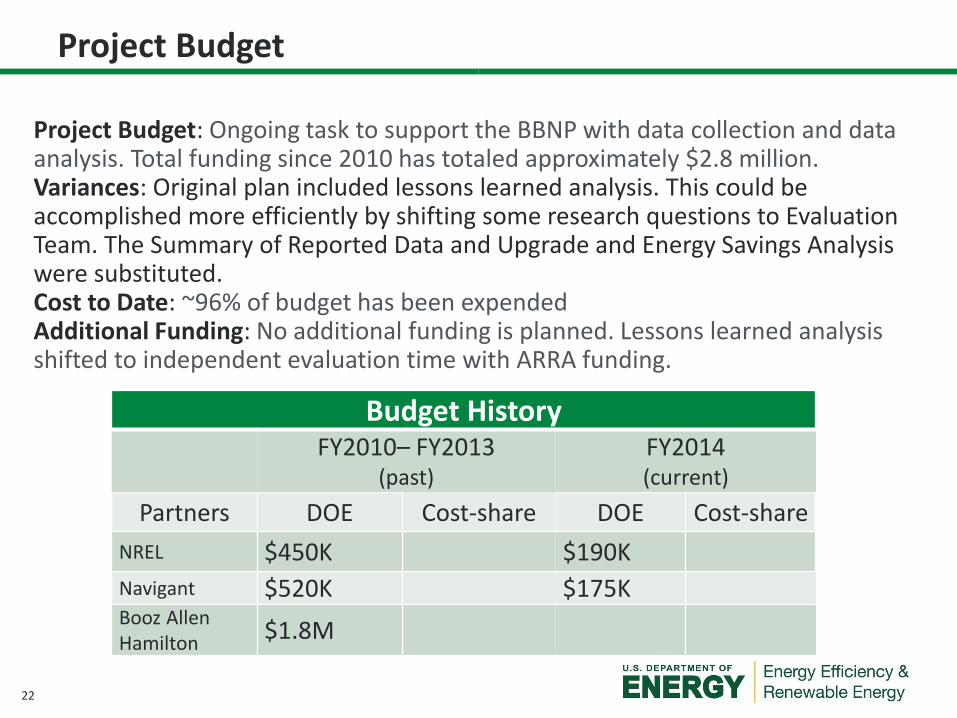
Budget History
FY2010– FY2013 FY2014 (past) (current)
Partners DOE Cost-share DOE Cost-share
NREL $450K $190K
Navigant $520K $175K Booz Allen
Hamilton $1.8M
Project Budget
Project Budget: Ongoing task to support the BBNP with data collection and data analysis. Total funding since 2010 has totaled approximately $2.8 million. Variances: Original plan included lessons learned analysis. This could be accomplished more efficiently by shifting some research questions to Evaluation Team. The Summary of Reported Data and Upgrade and Energy Savings Analysis were substituted. Cost to Date: ~96% of budget has been expended Additional Funding: No additional funding is planned. Lessons learned analysis shifted to independent evaluation time with ARRA funding.
22

Project Plan and Schedule
Project Schedule
Project Start: April 2010
Projected End: June 2014
Task
FY
20
09
FY
20
10
FY
20
11
FY
20
12
Q1
(O
ct-
De
c)
Q2
(Ja
n-
Ma
r)
Q3
(A
pr-
Jun
)
Q4
(Ju
l-S
ep
)
Q1
(O
ct-
De
c)
Q2
(Ja
n-
Ma
r)
Q3
(A
pr-
Jun
)
Q4
(Ju
l-S
ep
)
Past WorkBBNP FOA Releases
BBNP EECBG and SEP Awards
Reporting Requirements and BB Information System
BBNP Quarterly Summary Data
Grantee Dashboards and Project Summary Files
BBNP Lessons Learned Report (shifted research questions)
Current/Future Work
Revised Quarterly Summary Data
Decommission BB Information System
BBNP Summary of Reported Data
BBNP Data Release
BBNP Energy Savings Analysis Report
Add BBNP data to BPD
Develop Guide for Benchmarking Residential Program Progress
Completed Work
Active Task (in progress work)
Milestone/Deliverable (Originally Planned) use for missed milestones
Milestone/Deliverable (Actual) use when met on time
FY2013 FY2014
Collect data from organizations awarded financial assistance (i.e. BBNP grantees) to test energy upgrade business models and improve building energy efficiency across the country. Use data to: 1) Populate the Buildings Performance Database (BPD), Track grantee progress, Evaluate impact, and Identify successful strategies.
23