Embed Size (px)
Citation preview

BET Module 4
Managing and Mitigating Impacts
Facilitator Notes
February 2012

2 January 2012
All content is based on WBCSD material and publically available reports.
BET curriculum and structure was designed by
The structure and content development of BET was governed by an Advisory Committee
consisting of WBCSD member companies and Regional Network partners, NGOs, UN and
academic institutions.
Business Ecosystems Training – Contributors

3 February 2012
BET Module 4: Managing and Mitigating Impacts
Facilitators‟ guide: how it works
This Facilitators‟ guide is set up to
provide all the information needed to
present the BET course – Module 4:
Managing and Mitigating Impacts to a
group of delegates
The contents of the guide are:
Introduction to the course and course
timetable
Facilitator‟s notes
Within the facilitator‟s notes, there are
three different types of information
provided.
1) Session overview and timeline
Overview of each section and suggested
times for delivering the session
2) Facilitators‟ notes
Facilitators‟ notes – shown on left hand
side of each page, these include:
Detailed notes as to how to run the
session, including how long to spend
on each slide
Background notes
Crib notes for the facilitator to
present from

4 February 2012
BET Module 4: Managing and Mitigating Impacts
Facilitators‟ guide: how it works (cont.)
3) Media/activity/handout guidance
Media/activity/handout guidance – shown
on the right hand side of each page,
these include:
A copy of the PowerPoint slide the
delegates are seeing as you present
Guidelines as to how to run group
sessions and exercises
Further information
For more information about BET, please
refer to the BET Implementation Guide
A separate glossary document is
provided for this module
A separate Frequently Asked
Questions (FAQs) document is also
provided for this course

5 February 2012
BET Module 4: Managing and mitigating impacts
Introduction to the course
Audience
The audience will have an environmental and sustainability background, but a background in environmental economics is not necessary. Delegates could include:
Sustainability managers
CSR managers
EHS managers
Lifecycle analysis professionals
Operations managers, or
Those with a background of integration social performance and investment
Please note this list is not exhaustive.
This module is suitable for participants
who have completed modules 1, 2 and 3.
It provides an introduction to the different
policy mechanisms that may be used to
address their ecosystems impact.
The course may be conducted as internal
training or an external course for
delegates from a number of companies,
therefore this module will be an
opportunity for delegates to understand
how different companies or departments
are currently accounting for biodiversity
and ecosystem services.

6 February 2012
BET Module 4: Managing and mitigating impacts
Introduction to the course (cont.)
Key Topics
Key topics for module 4 include:
An introduction to mitigation
concepts, along with case studies
and walkthroughs
A review of some international and
local legislation
A review of case studies applying
compensatory and offsetting
frameworks
Learning Objectives
By the end of this module, delegates will
be able to:
Define key policies and policy
mechanisms for addressing and
mitigating environmental impact, as
well as enhancing business practice
for better management
Identify the business case for managing
and mitigating impacts
Apply the mitigation hierarchy i.e.,
develop ideas on how their company
can mitigate, offset and provide
compensation for their impacts
Identify how regulatory frameworks and
policy mechanisms relate to a
delegate‟s employer through action
planning

7 February 2012
BET Module 4: Managing and mitigating impacts
Introduction to the course (cont.)
Pre-work
Training pre-work: Instructions should
specify that delegates will be
required to write a half a page on
where they are currently affected by
environmental legislation in their
work, and any challenges they are
facing in this area. This will be part of
a knowledge sharing session
Delegate binders distributed on arrival
at the course
All delegates will be given the links to
course material and references for
further research
Additional handouts are provided
throughout the module, these are
located in the Annex for this pack
The Facilitators Notes should NOT
be made available to the delegates in
soft copy
Facilitators
Two facilitators will be used
throughout the training. These should
include one specialist with a
background in environmental /
sustainability and the other with a
background in learning and
development
Presenting and facilitating will be
shared between both

8 February 2012
Time Duration (mins) Session Facilitator
10-40 Session 1: Icebreaker and introduction
20 Session 2: Basic concepts
10 Session 3: Introduction to policy trends
45 Session 4: Case study example: applying the mitigation hierarchy
30 Coffee break
10 Session 5: Knowledge check
40 Session 6: Compensation and offsetting
25 Session 7: Reporting and Indicators
20 Session 8: Policy framework
15 Session 9: Knowledge share
10-25 Session 10: Wrap up
BET Module 4: Managing and mitigating impacts
Timetable
Key: Presentation
Exercise

9 February 2012
Session 1: Icebreaker and Introduction
Time guidelines
Time guidelines Time
Introduction 10-40 minutes
Session objective
To establish delegates‟ level of knowledge, skills to be acquired, and
identify learners‟ needs. To allow the delegates to be introduced to each
other.
Session overview
The primary focus of this session should be giving delegates a warm
welcome and ensuring that they feel at ease.
This session allows the course facilitators to introduce themselves and
give delegates an overview of their career history.
Delegates can also introduce themselves to each other as part of an
icebreaker exercise.
It also explains the structure, content and objectives of the course.
Session format
This session will be run by the two course facilitators – it is your
opportunity to make the delegates feel welcome and at ease and to start
interactions with other course delegates.
Handouts
Delegates‟ course material desk pack – hardcopies will be laid out on
delegate desks in advance of their arrival at the course. This pack
contains copies of all of the slides used throughout this course together
with relevant handout materials required for each session.
A glossary of terms used during the module will also be available in the
course material desk pack.

10 February 2012
Facilitators‟ notes Media/activity/handout guidance
Slide 1: 1 minute
Welcome delegates to the BET course
Slide 2: 1 minute (instructions displayed during the exercise)
Tell delegates that the course has been developed by the WBCSD in
collaboration with KPMG and an advisory committee made up of several
WBCSD member companies, Regional Network partners, academic and
UN institutions and NGOs.
[Optional, depending on training structure: Facilitator to vary use of
these introductions and icebreaker exercises depending on
audience/module structure – exercise can be skipped if module 4 is
being delivered directly after a previous module. Facilitator should
use the day 1 and 2 recaps and interactive slide as appropriate.]
Slide 3/4: <1 minute
Instructions:
Tell delegates that, since you will be working together closely over the next
few hours, you would like to start the course by providing them with an
opportunity to quickly learn more about each other.
This session is to be run by both facilitators, with both taking part in the
icebreaker and introducing themselves.
Session 1
Icebreaker and Introduction
Session 1
Icebreaker and Introduction
[Option 1]
Module 4: Managing and Mitigating Impacts
Session 1
Introduction
[Option 2]
Module 4: Managing and Mitigating Impacts

11 February 2012
Facilitators‟ notes Media/activity/handout guidance
Slides 5-7: 10-15 minutes (depending on number of delegates)
Icebreaker (Facilitator to vary the use of these activities in accordance
with the mix of delegates)
[Option 1 slide 5: Interactive]
Module facilitator will put delegates into pairs, who are then given
5 minutes to discuss the following three questions:
Current scope of work
Knowledge of how to measure ecosystem impact; and
What they want out of the course
Delegates then report back to the group, introducing their partner using
the information they have learned.
[Option 2 slide 6: Catch the Ball]
Throw a soft ball to one of the delegates who then introduces themselves
by answering the three questions below:
Current scope of work
Knowledge of how to measure ecosystem impact; and
What they want out of the course
The delegate then throws the ball to someone else (who has not yet
answered).
[Option 3 slide 7: What would delegate like to get out of this module]
Ask delegates what they would like to get out of this course specifically
Instructions:
The facilitator will take note of expectations and specific learning
objectives, including indicators/measures on a flip chart. This will be
referenced throughout the day and items checked off. It could also be
referred back to at the end of the day ensuring that the training has
addressed the expectations and needs of the delegates.
5January 2012
Icebreaker
[Option 1]
Catch the ball!!!
6January 2012
Icebreaker and introduction
[Option 2]
a) Your current role and scope of work
b) Your knowledge of ecosystems
c) What you want to learn from the course and Module 1
5 minutes
7January 2012
Icebreaker and introduction (cont.)
[Option 3]
Please discuss:
What do you hope to learn from module 3?
5 minutes
Session 1
Icebreaker and Introduction

12 February 2012
Facilitators‟ notes Media/activity/handout guidance
Slide 8: 1 minute
Background
Facilitator to explain where Module 4 sits within the broader training
course.
Facilitator to talk through this slide, introducing this and earlier topics, i.e.
Modules 1, 2 and 3.
Module 4 of this course is the last of four modules covering specific topics,
including:
Module 1: Understanding the links between ecosystems and
business;
Module 2: Measuring and assessing impacts and dependencies;
Module 3: Introduction to ecosystem services valuation; and
Module 4: Managing and mitigating impacts.
The modules are independent of each other and can be taken
independently or in succession. This training is designed to be facilitator
led but the material is available on the WBCSD website, and is therefore
accessible to individual learners. This module includes a recap of Modules
1, 2 and 3.
This module is an introduction to different sorts of policy and intervention
mechanisms – the module will also cover an introduction to a number of
policy frameworks currently in place.
Session 1
Icebreaker and Introduction (cont.)
10January 2012
Where does Module 4 sit within the broader
training available?
Module 1:
Understanding the links
between ecosystem
services and business
Module 2:
Measuring and
assessing impacts and
dependencies
Module 3:
Introduction to valuing
ecosystem services
Module 4:
Managing and mitigating
impacts

13 February 2012
Facilitators‟ notes Media/activity/handout guidance
Slide 9: 5 minutes + 5 minutes Q+A [optional]
Recap Module 1
[Optional, depending on training structure: if modules are being
prepared in one block then no need for recaps]
Instructions
Facilitator to recap specific concepts from module 1, including definitions
of:
Biodiversity
Ecosystems, and
Ecosystem services, i.e. Provisioning, regulating, cultural and
supporting
This module looks more closely at how these concepts are relevant in the
context of companies managing and mitigating their impacts.
Definitions
Biodiversity: is the variability among living organisms within species,
between species, and between ecosystems. It is this genetic variability
(phenotype, genotype and environment) which gives organisms within
ecosystems the ability to respond to stress. By having a range of
organisms adapted to thrive in different circumstances, the ecosystem is
more resilient.
Ecosystem: a dynamic complex of plant, animal, and micro-organism
communities and their nonliving environment interacting as a functional
unit. Examples of ecosystems include deserts, coral reefs, wetlands, rain
forests, boreal forests, grasslands, urban parks, and cultivated farmlands.
Ecosystems can be relatively undisturbed by people, such as virgin rain
forests, or can be modified by human activity, such as farms.
Ecosystem services: sometimes called „environmental services‟ or
„ecological services„ – are the benefits that people obtain from
ecosystems. Examples include freshwater, timber, climate regulation,
protection from natural hazards, erosion control, and recreation.
Session 1
Icebreaker and Introduction (cont.)
11January 2012
Module 1 – Recap [optional module re-cap]
Understand the basics
Drivers for change and business impacts and dependencies
Links with sustainability
Business case for action
Policy and regulatory frameworks

14 February 2012
Facilitators‟ notes Media/activity/handout guidance
Slide 9: 5 minutes + 5 minutes Q+A [optional] (cont.)
Recap Module 1
[Optional, depending on training structure: if modules are being
prepared in one block then no need for recaps]
Instructions
Facilitator to ask delegates:
The main challenges facing business were described in Module 1: can
anybody name them?
Answers
Water scarcity
Climate change
Habitat change
Biodiversity loss and invasive species
Overexploitation of the ocean
Nutrient overloading leading to pollution
Can anyone name the drivers of these changes?
Answers
Population growth
Lifestyle changes
Governance issues
Finally, we looked at the business case for action, can anyone tell me
some of the risks associated with ecosystem dependency?
Answers
Operational (e.g. Increased scarcity and cost of raw materials)
Regulatory and legal (e.g. Public policies like taxes and moratoria on
extractive activities)
Reputational (e.g. Relationships and image from media and NGOs)
Market and product (e.g. Consumer preferences)
Financing (e.g. Availability of capital)
Session 1
Icebreaker and Introduction (cont.)
11January 2012
Module 1 – Recap [optional module re-cap]
Understand the basics
Drivers for change and business impacts and dependencies
Links with sustainability
Business case for action
Policy and regulatory frameworks

15 February 2012
Facilitators‟ notes Media/activity/handout guidance
Slide 10: 5 minutes + 5 minutes Q+A [optional]
Recap Module 2
[Optional, depending on training structure: if modules are being
prepared in one block then no need for recaps]
Instructions
Facilitator to recap specific concepts, including:
Footprinting concepts (carbon, water, environmental)
Ecological change versus changes of relevance to business
Facilitator to ask delegates: in Module 2, we looked at the business case
for measuring and assessment, can anyone remember some of the main
benefits for businesses?
Answers include:
Effective communication of information
More informed decisions
Risk identification and management, resulting in decreased
vulnerability to risk
Cost savings
Competitive advantage
Improved relationships with stakeholders, including regulators,
investors, and shareholders
Streamlined permitting processes
Customer retention
Facilitator to remind delegates of some of the relevant tools for
measuring and assessing, including:
Ecosystem Services Review (ESR): a structured methodology that
allows managers proactively develop strategies to manage business
risks and opportunities arising from their company‟s dependence and
impact on ecosystems
Global Water Tool
GHG protocol
WBCSD Measuring Impact Framework
Other relevant tools from Module 2
Session 1
Icebreaker and Introduction (cont.)
12January 2012
Module 2 – Recap [optional module re-cap]
Understand the basics
Policy and regulatory frameworks
The business case for action
Introduction to Ecosystem Services Review (ESR)
Introduction to tools, frameworks and methodologies

16 February 2012
Facilitators‟ notes Media/activity/handout guidance
Slide 11: 5 minutes + 5 minutes Q+A [optional]
Recap Module 3
[Optional, depending on training structure: if modules are being
prepared in one block then no need for recaps]
Instructions
Facilitator to recap specific concepts, including:
Public versus private goods
Total Economic Value (TEV)
The evolution of ecosystems service frameworks
Screening and planning for valuation
Ask delegates, can anyone remember the reasons that a business might
conduct corporate ecosystem valuation?
Answers include:
Improving business decision making
Capturing and pricing new income streams
Saving costs
Reducing taxes
Sustaining revenues
Revaluating assets
Investigating new goods and services
Assessing liability and compensation
Measuring company and share value
Reporting performance
There are two stages of CEV – can anyone remember/describe how they
breakdown into different steps?
Answers include:
Stage 1: Screening
Stage 2: Scoping, Planning, Valuation, Application, Embedding
Session 1
Icebreaker and Introduction (cont.)
13January 2012
Module 3 – Recap [optional module re-cap]
Understand the basics
Policy and regulatory frameworks
The business case for action
Introduction to Corporate Ecosystem Valuation (CEV)
CEV screening and supporting tools and methodologies

17 February 2012
Facilitators‟ notes Media/activity/handout guidance
Slide 12: 2 minutes
Objectives
The facilitator will describe the objectives of this training module and
provide linkages between these and the learning objectives described by
the delegates.
Slide 13 < 1 minute
Agenda
The facilitator will briefly go through the agenda for the sections that will be
covered in this training module and provide linkages with the above
objectives and the learning objectives described by the delegates.
Slide 14 < 1 minute
The facilitator will leave the course timetable displayed throughout the
course as a poster
Slides 15-16: 1 minute
The facilitator will run through a few high impact examples of companies
addressing this issue and where commitments have been made.
Examples that show how companies are addressing issues of
compensation, no net loss and supply chain management.
Source: Communicating and implementing TEEB for Business:
A proposal for action-research , Joshua Bishop, IUCN (Dec 2010)
http://www.povertyenvironment.net/files/IUCN%20-
%20Implementing%20TEEB%20for%20Business%20-%20public.pdf
Session 1
Icebreaker and Introduction (cont.)
1January 2012
Module 4 – Objectives
By the end of the module, delegates should be able to:
1. Define key policy mechanisms for addressing and mitigating
environmental impact, and enhancing business practice for better
management.
2. Identify the business case for managing and mitigating impacts.
3. Apply the mitigation hierarchy, i.e. develop ideas on how their company
can use offsetting and compensation.
4. Identify how regulatory frameworks and policy mechanisms relate to
delegates‟ employers through action planning.

18 February 2012
Session 1
Icebreaker and Introduction (cont.)
Facilitators‟ notes Media/activity/handout guidance
Slide 17: 1 minute
Source:
WBCSD, Connecting the dots (2005), Slide 61
http://www.wbcsd.org/pages/edocument/edocumentdetails.aspx?id=23
(link to connecting the dots at the bottom of the page).
Instructions
Facilitator to set the scene following on from the quotes of commitment by
briefly summarising this background text.
Background
Rather than thinking of ecosystem services as having little or no economic
value, we should think of them as being an important asset, source of
natural capital or element of the basic infrastructure that is required for
production, consumption, trade and investment, so that we can reap the
payoffs that this natural infrastructure gives.
Business should think of ecosystems as:
Valuable assets and natural capital
Ultimately as elements of the basic infrastructure that supports
production, consumption, trade and investment
Conventional definitions of infrastructure often omit natural ecosystems,
yet there are large payoffs to valuing and investing in ecosystems as
economic infrastructure.
This module explores how companies can manage and mitigate their
impacts on ecosystems to help maximise the value of natural capital. This
begins with a summary of basic concepts in the next session.
18January 2012
Ecosystems as an economic part of
infrastructure
Business should think of
ecosystems as:
Valuable assets and natural
capital
Elements of basic infrastructure
Supporting production,
consumption, trade and
investment
Conventional definitions of
infrastructure often omit natural
ecosystems.
It pays to value and invest in
ecosystems as economic
infrastructure.
Source: WBCSD, Connecting the dots

19 February 2012
Session 2: Basic Concepts
Time guidelines
Time guidelines Time
Basic Concepts – presentation 20 minutes
Session objective
Audience to understand the benefits to business of managing their
impacts on society.
Session overview
The primary focus of this session should be to provide delegates with
the base language and terminology they will use for the rest of the
module.
It will allow delegates to learn the basic concepts or clarify/strengthen
any previous knowledge.
Session format
This session will be run by one course facilitator, who will talk through
key concepts and definitions with delegates.
Handouts
Delegates course material desk pack – hardcopies will be laid out on
delegate desks in advance of their arrival at the course. This pack
contains copies of all of the slides used throughout this course together
with relevant handout materials required for each session.
A glossary of terms used during the module will also be available in the
course material desk pack.

20 February 2012
Session 2
Basic Concepts
Facilitators‟ notes Media/activity/handout guidance
Slide 18: <1 minute
Slides 19-20: 3 minutes
Sources:
WBCSD, CEV helpdesk presentation (July 2011), (WBCSD Members only.
Accessible at:
http://www.wbcsd.org/Pages/EDocument/EDocumentDetails.aspx?ID=137
52&NoSearchContextKey=true )
Business and Biodiversity Offset Program (BBOP), http://bbop.forest-
trends.org/site/misc/Slide1.ppt
Instructions
Facilitator to talk through the key concepts and terminology, supported by
the background notes below. This provides the basic foundation that
delegates will need for the other sessions throughout the module. The
facilitator can introduce the session using the following language:
„We are now going to look at key concepts you'll need throughout this
module‟
The background notes are required reading for the facilitator, but are not
intended to be used as a script. The facilitator should review the material
in advance and tailor the amount of information provided to the audience.
Background
Mitigation hierarchy – This is a set of steps taken to reduce and alleviate
residual environmental harm as much as possible, through mitigation,
reduction, restoration, and avoidance. Offsetting and compensation are
the last two steps of the hierarchy when all other steps have been taken
(see later session).
Biodiversity offsets – There are numerous approaches to what are
broadly termed „biodiversity offsets‟; some with strict and complex criteria
others based on simple quantity metrics (e.g. area of land or number of
breeding pairs).
The Business and Biodiversity Offsets Programme (BBOP) definition:
“Measurable conservation outcomes resulting from actions designed to
compensate for significant residual adverse biodiversity impacts arising
from project development and persisting after appropriate prevention
and mitigation measures have been implemented.”
“The goal of biodiversity offsets is to achieve no net loss and preferably a
net gain of biodiversity on the ground with respect to species composition,
habitat structure, ecosystem function and people‟s use and cultural values
associated with biodiversity.”
Q&A: Ask the audience if they know any other terms for biodiversity
offsetting
Answers: conservation credits/habitat, species or conservation banking
Session 2
Basic Concepts
Module 4: Managing and Mitigating Impacts

21 February 2012
Session 2
Basic Concepts (cont.)
Facilitators‟ notes Media/activity/handout guidance
Slide 20: 3 minutes (cont.)
Sources: BBOP – Within The Mitigation Hierarchy
http://bbop.forest-trends.org/site/misc/Slide1.ppt
http://bbop.forest-trends.org/offsets.php
Background (cont.)
Currently the world is witnessing an unprecedented loss of biodiversity in
ecosystems around the globe. Some 10-30% of all mammal, bird, and
amphibian species are threatened with extinction.
A major cause of this loss is the destruction of natural habitats by
developments in the agriculture, forestry, oil and gas, mining, transport,
and construction sectors, among others. At the same time, countries rely
on these developments for economic growth and for products, services,
and jobs.
A growing number of companies, governments and NGOs are now aware
that biodiversity offsets could achieve more, better and higher priority
conservation and livelihood outcomes.
Biodiversity offsets not only rehabilitate sites but also address the
company's full impact on biodiversity at the landscape scale. Biodiversity
offsets can also support sustainable livelihoods by addressing the
underlying causes of biodiversity loss and can assist companies to
manage their risks, liabilities and costs.
Source: BBOP for WBCSD Information Call on biodiversity offsets
(Oct2011) (WBCSD Members only. Accessible at:
http://www.wbcsd.org/Pages/EDocument/EDocumentDetails.aspx?ID=137
49&NoSearchContextKey=true)
Three different types of offsets:
Individual offset
Aggregated offset
Conservation bank
Background (cont.)
Each offset must demonstrate additional, measurable conservation
outcomes. While appropriate offset activities will vary from site to site, a
range of different land (and marine) management interventions could
typically be involved in biodiversity offsets.
Types of offset activities
Developers should pursue biodiversity offsets only at the end of the
mitigation hierarchy, after they have reduced and alleviated residual
environmental harm as much as possible. Biodiversity offsets can be used
to compensate for the residual impact to biodiversity that cannot be
mitigated onsite and therefore balance the impact of the project.

22 February 2012
Session 2
Basic Concepts (cont.)
Facilitators‟ notes Media/activity/handout guidance
Slide 21: 1 minute (cont.)
Sources: Madsen et al, Ecosystem Marketplace (June 2011)
http://www.forest-trends.org/documents/files/doc_2848.pdf
Background on biodiversity markets
45 compensatory mitigation programs (banks and offsets) and 27 in
development.
Numerous individual offset sites, over 1,100 banks.
Global annual market size min. US$ 2.4-4.0 billion. Likely much more
(80% of programs not transparent enough to estimate market size).
Conservation impact: >187,000 hectares annually.
North America dominates: US$ 2.0-3.4 bn. >15,000 ha annually.
0.5m ha cumulatively.
US mitigation banking still increasing: 1,044 active and sold-out
wetland, stream and conservation banks.
Europe: Germany: banking. UK, France, Sweden : initial steps.
Africa: South Africa state and national level under development.
Asia: Vietnam, Japan, Mongolia.
Australia & NZ: Several states (NSW, Victoria, Northern Territories,
Queensland, Western Australia). New Zealand underway.

23 February 2012
Session 2
Basic Concepts (cont.)
Facilitators‟ notes Media/activity/handout guidance
Slide 22: 1 minute (cont.)
Sources: BBOP – Within The Mitigation Hierarchy
http://bbop.forest-trends.org/site/misc/Slide1.ppt
http://bbop.forest-trends.org/offsets.php
Example of an offset activity:
“Australia – BushBroker: The clearing of native vegetation in the State
of Victoria is regulated under the Victorian Planning and Environment Act
of 1987. In 2006, the Victorian Government introduced the BushBroker
scheme, which requires that clearing of native vegetation be compensated
by an appropriate offset.
Permit applicants can source these offsets through the BushBroker
register. Offsets are gains in native vegetation extent and/or condition that
are permanently protected and linked to a particular clearing site.
Applicants can either generate offsets on their own property or purchase
these offsets as native vegetation credits from third party providers. To
date, over $4 million worth of trades have been facilitated by the
programme. (Note: in 2011 it represented $34 millions)
The system also allows the „banking‟ of credits for future use. For instance,
a construction company could donate land for the conservation reserve
system and register the resulting credits for future offset use. The major
revenue generation opportunity for business is through the generation of
native vegetation credits through improved land management, re-
vegetation of previously cleared areas, and protection of existing stands of
trees. This relatively low-cost process can generate significant additional
income from land that might otherwise have low commercial value.
Average prices for credits under the BushBroker scheme have ranged
from AUD $42,000 to $157,000 per hectare.”
Source: TEEB for Business, Chapter 5 page 17 (Updated figures)
http://www.teebweb.org/LinkClick.aspx?fileticket=EY1cJCTSe2U%3D&tabi
d=1021&language=en-US

24 February 2012
Facilitators‟ notes Media/activity/handout guidance
Slide 23: 3 minutes
Source:
WBCSD, Connecting the dots (2005), Slide 76
http://www.wbcsd.org/pages/edocument/edocumentdetails.aspx?id=23
(link to connecting the dots at the bottom of the page).
WBCSD, CEV helpdesk presentation (Jun 2011) (WBCSD Members only:
http://www.wbcsd.org/Pages/EDocument/EDocumentDetails.aspx?ID=137
53&NoSearchContextKey=true )
Instructions:
Facilitator to continue introducing the key concepts and terminology
presented in the slide, supported by background information.
Payments for Ecosystem Services (PES) – “PES can be defined as
voluntary transactions where a well-defined ecosystem service (ES) (or
land-use likely to secure that service) is „bought‟ by at least one ES buyer
from at least one ES provider, if and only if the ES provider secures ES
provision (conditionality)”.
Quote source: TEEB for National and International Policy Makers,
Chapter 5, page 6
http://www.teebweb.org/LinkClick.aspx?fileticket=vYOqLxi7aOg%3d&tabid
=1019&language=en-US
Linking beneficiaries with providers of services to directly incentivise
behavioural change. In its strictest terms PES is:
A voluntary transaction
A well-defined environmental service, or land-use likely to deliver that
service
A service is „bought‟ by at least one buyer
From at least one provider
Conditional on the provider securing continued provision
Direct payments include buying and selling the delivery of specific
ecosystem services or, more commonly, payments for maintaining or
adopting land uses that are thought to provide such ecosystem services.
Governments in several countries have developed subsidies and tax
incentives to encourage resource conservation. For example, payment for
watershed protection: conserving natural forests in watersheds and
reducing pollutant loads in run-off from upland areas can be a cost-
effective means of providing reliable supplies of clean water for
hydroelectric power generation, irrigation, industrial, domestic and
recreational uses.
Key messages
PES can help mitigation or management of risks where
dependencies on ecosystem services are identified
PES can provide opportunities for new revenue streams if
businesses identify where they are providing ecosystem service
benefits to others
Proactive engagement in PES-like schemes can help to avoid
unforeseen costs of regulation
22January 2012
Payments for Ecosystem Services (PES)
Key messages
PES can help mitigation or management of risks where dependencies
on ecosystem services are identified
PES can provide opportunities for new revenue streams if businesses
identify where they are providing ecosystem service benefits to others
Proactive engagement in PES-like schemes can help to avoid
unforeseen costs of regulation
Session 2
Basic Concepts (cont.)

25 February 2012
Session 2
Basic Concepts (cont.)
Facilitators‟ notes Media/activity/handout guidance
Slide 24: 3 minutes
Source:
BBOP, Introduction to Payments for Ecosystem Services. A Reference
Book for Uganda, p21 http://www.forest-
trends.org/documents/files/doc_2438.pdf
Instructions:
Facilitator to talk through example of a payment for ecosystem services.
Background:
The Equitable Payments for Watershed Services Program (EPWS) –
Tanzania
“CARE International in Tanzania, in partnership with the World Wildlife
Fund (WWF), the International Institute for Environment and Development
(IIED), and the Poverty Reduction & Environmental Management Program
(PREM) initiated a new project in 2006, Equitable Payment for Water
Services (EPWS). The program is based in the Uluguru and East
Usambara mountains, focusing on Ruvu and Sigi River basins, which are
the major sources of water to the cities of Dar es Salaam and Tanga,
respectively. The City of Dar es Salaam provides water to some four
million inhabitants and roughly 80 percent of industries. The public water
utility, Dar es Salaam Water Supply and Sewerage Corporation
(DAWASCO), currently spends nearly US$2 million per year in water
treatment costs due to increased sediment load in the Ruvu river, which
feeds the city.
The Equitable Payments for Watershed Services (EPWS) program aims to
improve the quality and flow of water for downstream users by
compensating upstream farmers to engage in various land-use practices
to control soil erosion. This is typically brought on by unsustainable
farmland expansion and irrigation practices, deforestation and illegal
mining activities in river systems and within forest reserves. The project
aims to establish long-term financial investment in modifying land use to
conserve and improve watersheds for reliable flow and quality of water.
The project will also establish a compensation mechanism that recognizes
the needs and priorities of marginalized and poor people, and to improve
quality of life of communities through substantial benefits to the rural poor
hence contributing to poverty reduction. As of 2008, DAWASCO and the
Coca-Cola Company had enrolled more than 450 farmers.”

26 February 2012
Session 2
Basic Concepts (cont.)
Facilitators‟ notes Media/activity/handout guidance
Slide 25: 1 minute
Source: BBOP Glossary http://bbop.forest-
trends.org/guidelines/glossary.pdf
Instructions:
Facilitator to talk through the concept of compensatory measures.
Background:
Compensation: “Generally, compensation is a recompense for some loss
or service, and is something which constitutes an equivalent to make good
the lack or variation of something else. It can involve something (such as
money) given or received as payment or reparation (as for a service or
loss or injury). Specifically, in terms of biodiversity, compensation involves
measures to restore, create, enhance, or avoid loss or degradation of a
community type, in order to compensate for residual impacts on it and/or
its associated species.”

27 February 2012
Session 2
Basic Concepts (cont.)
Facilitators‟ notes Media/activity/handout guidance
Slide 26: <1 minute
Source: Green Development Initiative – http://gdi.earthmind.net/
Instructions:
Facilitator to talk through the concept of the Green Development Initiative
(GDI), and Green Development Mechanism (GDM). These two initiatives
are good examples of multilateral action to manage/mitigate impacts on
ecosystems
„Innovative international finance for biodiversity‟
This initiative began in 2009 with the aim to raise interest and support for
further discussion and development of a Green Development Initiative
(GDI) by the 10th Conference of the Parties of the Convention on
Biological Diversity (CBD) which took place in October 2010 in Nagoya,
Japan.
Note: Originally call the Green Development Mechanism (GDM)
renamed to Green Development Initiative (GDI) (October 2011)
The GDI is an international response to the 10th Conference of the Parties
of the Convention on Biological Diversity (CBD COP10), particularly with
respect to the strategies for resource mobilisation and business
engagement. It aims to establish an international green development
certification scheme for land management.

28 February 2012
Session 2
Basic Concepts (cont.)
Facilitators‟ notes Media/activity/handout guidance
Slide 27: 5 minutes for examples
Sources: WBCSD, Sustainable Procurement of Wood and Paper-based
Products Guide and Resource Kit (2011) Available from:
http://www.wbcsd.org/Pages/EDocument/EDocumentDetails.aspx?ID=183
IFC:
http://www.ifc.org/ifcext/footprint.nsf/Content/Environment_Procurement
Instructions:
Facilitator to talk through the key terminology to audience.
Background:
Sustainable procurement is the process by which organizations buy
supplies and services taking into consideration the best value for money
and the environmental and social aspects that the product/service has
over its whole life cycle (Environmentally and Socially Responsible
Procurement Working Group, 2007).
Beyond the immediate and obvious consequences of their purchases,
concerned consumers, retailers, investors, communities and other groups
want to know how their buying decisions impact the environment and
forest-based communities. They also want to know whether the products
they buy are produced sustainably. Will buying them today adversely
affect the availability of similar products or environmental values for future
generations?
Facilitator to walk through one/two of the following examples
Belgian Government Procurement Policy: The Policy is applicable to
wood-derived products, except paper. The Policy is compulsory for all
entities of the federal government, and it focuses on wood from
sustainably harvested timbers.
Belgian Government Procurement Policy (cont.): The definition
includes provisions related to traceability, legality, and specific
requirements for sustainable forest management certification systems.
German Government Procurement Policy: Procurement policy for wood
and wood products only from verifiably legal and Sustainable Forest
Materials (SFM).
25January 2012
Procurement policies (managing supply chain)
Sustainable procurement is the process by which organizations buy
supplies and services taking into consideration the best value for money
and the environmental and social aspects that the product/service has over
its whole life cycle.
Some examples:
Belgian Government Procurement Policy
German Procurement Policy
Greenpeace‟s Responsible Procurement Policy
International Finance Corporation (IFC) Procurement Policy
Kimberly-Clark
Sompo Japan
Unilever

29 February 2012
Session 2
Basic Concepts (cont.)
Facilitators‟ notes [Media/activity/handout guidance]
Slide 27: 5 minutes (cont.)
Sources: WBCSD, Sustainable Procurement of Wood and Paper-based
Products Guide and Resource Kit (2011) Available from:
http://www.wbcsd.org/Pages/EDocument/EDocumentDetails.aspx?ID=183
IFC:
http://www.ifc.org/ifcext/footprint.nsf/Content/Environment_Procurement
Greenpeace‟s Responsible Procurement Policy: Provides advice and
assistance to solid-wood retailers devising and implementing a responsible
procurement policy using Greenpeace‟s Timber Standard. The Timber
Standard is a benchmark and it outlines a step-wise transition towards
buying products that are sustainable. Sustainable products are defined as
FSC-certified and/or are made of 100% recycled materials.
International Finance Corporation (IFC) Procurement Policy:
“IFC's goal is to choose environmentally and socially responsible products
and services for our daily operations. This not only improves our footprint,
but sends an important message to our suppliers.
Certain vendors, including the suppliers to our headquarters in
Washington, DC, of food services, office supplies, and travel, are selected
by the Corporate Procurement Unit of the World Bank Group. The World
Bank Group is committed to corporate responsibility, and therefore
evaluates vendors' commitments to fair wages and benefits, safety,
environmental programs, and diversity of its supply chain.”
[Customize: Either the appropriate national strategy should be added
as an example, if one is available and/or the company‟s current
procurement policy]
Kimberly-Clark: developed a Guide for Suppliers, which covers:
Working with Kimberly-Clark
Commitment to Ethical Business Practices
Safety and Health
Environmental Stewardship: “To help achieve our vision we look to
do business with suppliers whose environmental programs are
compatible to our own, and who can provide us with products and
solutions that move us closer to our goals.”
Source: Kimberly-Clark, Guide for Suppliers (2012)
http://www.cms.kimberly-
clark.com/umbracoimages/UmbracoFileMedia/Guide_For_Suppliers_umbr
acoFile.pdf
Sompo and Unilever examples will be discussed in session 8.
25January 2012
Procurement policies (managing supply chain)
Sustainable procurement is the process by which organizations buy
supplies and services taking into consideration the best value for money
and the environmental and social aspects that the product/service has over
its whole life cycle.
Some examples:
Belgian Government Procurement Policy
German Procurement Policy
Greenpeace‟s Responsible Procurement Policy
International Finance Corporation (IFC) Procurement Policy
Kimberly-Clark
Sompo Japan
Unilever

30 February 2012
Session 2
Basic Concepts (cont.)
Facilitators‟ notes Media/activity/handout guidance
Slide 28: 2 minutes
Source: WBCSD, CEV helpdesk call (Sept 2011) (WBCSD Members only
:http://www.wbcsd.org/Pages/EDocument/EDocumentDetails.aspx?ID=13
750&NoSearchContextKey=true)
Instructions
Facilitator to talk through the concept of „a „green economy‟ and green
growth‟ from the WBCSD perspective
Interactive: option for a quick Q & A with delegates, i.e., what are
your views on a green economy, what would it include? Facilitator to
note answers on a flip chart before moving to explain the WBCSD
perspective.
Background
Green Economy was been identified as primary theme for the Rio+20
Conference, and the prevailing definition is from UNEP:
“A Green Economy is one that results in improved human well-being and
social equity, while significantly reducing environmental and ecological
scarcities.”
WBCSD‟s perspective is outlined:
“A planet of around 9 billion people, all living well – with enough food,
clean water, sanitation, shelter, mobility, education and health to make for
wellness – within the limits of what this small, fragile planet can supply and
renew, every day.”
...which could be interpreted as a target state for Green Growth – a „Green
Prosperity”
Green Growth:
The prevailing definition of Green Growth comes from the OECD:
“Green Growth means fostering economic growth and development,
while ensuring that natural assets continue to provide the resources
and environmental services on which our well-being relies. To do this, it
must catalyse investment and innovation which will underpin sustained
growth and give rise to new economic opportunities.”
The facilitator should highlight that Green Growth builds on the concept of
sustainable development, but the emphasis is more on the environmental
aspect as opposed to the social.

31 February 2012
Session 2
Basic Concepts (cont.)
Facilitators‟ notes Media/activity/handout guidance
Slide 29: <1 minute
Source: WBCSD, CEV helpdesk call (Sept 2011) (WBCSD Members only
:http://www.wbcsd.org/Pages/EDocument/EDocumentDetails.aspx?ID=13
750&NoSearchContextKey=true)
Instructions:
Facilitator to talk through the 5 dimensions of green growth, as outlined by
PwC and WWF.
Dimensions of green growth
PwC and WWF have identified five dimensions to green growth.
“Economic growth is important for social development and prosperity
and must be considered in conjunction with other environmental and
social factors, and business activities.
Social development and poverty alleviation is a central objective of
green growth, and is highly correlated with economic growth and
environmental quality.
Biodiversity and ecosystem services provide valuable contributions to
economic growth and human welfare but are often omitted from
decision making. Green growth seeks to address these market
failures.
Climate change resilience is about adapting to the physical impacts
of a changing climate.
Greenhouse gas emissions need to be limited to contribute to global
and national efforts to mitigate climate change and minimise future
adverse impacts on local and international society.”
Source: Road Map for a green economy in the heart of Borneo. A scoping
study (2011), PwC and WWF.
Economic growth must be decoupled from carbon emissions and the
degradation and depletion of ecosystems and biodiversity and be resilient
to the changing climate. Growth must also strengthen communities and
help to address problems of social development and poverty alleviation.
Underlying the concept of green growth is the need to recognize and
quantify the value of natural capital so that short-term economic activity
is not incorrectly valued over long-term investments
Most economies fail to value the services that nature provides such as
carbon sinks, water and air purification, flood protection and pollination. As
a consequence, the world‟s „natural capital‟ is being consumed faster than
it can be restored. This reduces its availability to support economic activity
and increases society‟s exposure to natural disasters and climate change.

32 February 2012
Optional Session 3: Introduction to policy trends
Time guidelines
Time guidelines Time
Introduction to broader policy trends and examples of
regulations
10 minutes
Session objective
To give delegates a simple overview of the process of addressing global
environmental concerns.
Session overview
The session will be presentation based. The session will use the
examples of international conventions to walk through how decisions
from an international perspective can filter through to impact on
companies.
Session format
This session will be run by one course facilitator, who will talk through
key concepts and definitions with delegates.
Handouts
Delegates course material desk pack – hardcopies will be laid out on
delegate desks in advance of their arrival at the course. This pack
contains copies of all of the slides used throughout this course together
with relevant handout materials required for each session.
A glossary of terms used during the module will also be available in the
course material desk pack.

33 February 2012
Session 3
Introduction to policy trends
Facilitators‟ notes Media/activity/handout guidance
Slide 30: <1 minute
In this session, delegates will be introduced to the policy background
general trends and processes by which issues are passed into
legislation (and thus impact on businesses), with specific regard to
biodiversity and ecosystem based policies.
Slide 31: 2 minutes
Long history of environmental policy
A. Option: ask delegates to guess the year the UK introduced
their first water policy – 1388 UK water pollution policy. This
was one of the earliest environmental policies. Please refer to:
http://www.environmentlaw.org.uk/rte.asp?id=108
B. 1973 EU Action Programme on Environment. Please refer to:
http://www.environmentlaw.org.uk/rte.asp?id=108
The limits to growth (1972)
Limits to Growth is a study about the future of our planet. It involved
designing a computing model which took into account the relations
between various global developments and produced computer
simulations for alternative scenarios. Part of the modelling were different
amounts of possibly available resources, different levels of agricultural
productivity, birth control or environmental protection.
Source: Club of Rome, http://www.clubofrome.org/?p=326
Session 3
Introduction to Policy Trends
[Optional session]
Module 4: Managing and Mitigating Impacts

34 February 2012
Session 3
Introduction to policy trends
Facilitators‟ notes Media/activity/handout guidance
Slide 31: 2 minutes (cont.)
Brundtland Report (1987): original
Source: United Nations,
http://www.un.org/esa/sustdev/csd/csd15/media/backgrounder_brundtland
Updated 20 years on, the Brundtland Report defined sustainable
development and called for increased international cooperation.
Conventions, treaties, protocols, agreements…
Over 250 multilateral environmental agreements exist – slide 3 shows just
a few as examples.
The Earth Summit (1992) – start of „The Rio Process‟
http://www.un.org/geninfo/bp/enviro.html
Slide 32: <1 minute
Instructions
Facilitator to show some of the policies that have been put in place since
the Rio Earth Summit.
[Customize 1: Facilitator to choose either the EU Environmental
Liability Directive or the Convention on Biological Diversity as
examples of a policy trend from issue recognition to mitigation,
depending on audience.]
[Customize 2: Facilitator can also use any other relevant legislation
to illustrate this section, E.g. for a US audience: Natural Resource
Damage Assessment example from the US EPA. More information at:
http://www.epa.gov/superfund/programs/nrd/nrda2.htm]

35 February 2012
Session 3
Introduction to policy trends
Facilitators‟ notes Media/activity/handout guidance
Slides 33-34: 3 minutes
Instructions:
Facilitator to discuss the EU Environmental Liability Directive as an
example of how issues are mitigated on an international policy level.
Source: European Commission
http://ec.europa.eu/environment/legal/liability/index.htm
Issue recognition:
“There are currently many contaminated sites in the [EU] Community,
posing significant health risks, and the loss of biodiversity has
dramatically accelerated over the last decades. Failure to act could
result in increased site contamination and greater loss of biodiversity in
the future.”
International response:
EU Environmental Liability Directive (ELD): the Directive's main
objective is to prevent and remedy "environmental damage".
Environmental damage is defined as damage to protected species and
habitats (nature), damage to water and damage to soil. The liable party
is in principle the "operator", i.e. the one (natural or legal person) who
carries out an occupational activity. The operator, who carries out
certain dangerous activities as listed in the Directive, is strictly liable
(without fault) for the environmental damage he/she causes.
Environmental damage also includes damage caused by airborne
elements as far as they cause damage to water, land or protected
species or natural habitats used.
National response:
All EU member states were given 3 years to transpose the Directive into
domestic laws. The process was delayed by several years, the transposition
of ELD was completed by the last member state in 2010, but the Directive is
already having an impact, with some 50 cases documented in Europe.
Impact on Industry:
By invoking the „polluter pays‟ principle, the directive has an impact on
various industries: “The prevention and remedying of environmental damage
should be implemented through the furtherance of the „polluter pays'
principle, as indicated in the Treaty and in line with the principle of
sustainable development. The fundamental principle of this Directive should
therefore be that an operator whose activity has caused the environmental
damage or the imminent threat of such damage is to be held financially
liable, in order to induce operators to adopt measures and develop practices
to minimise the risks of environmental damage so that their exposure to
financial liabilities is reduced.”
Mitigation of this issue is ongoing.
31January 2012
Background to ecosystem policy (cont.)
The Earth Summit (1992)
Agenda 21
Framework
Convention on
Climate Change
(FCCC)
Convention on
Biological
Diversity (CBD)
Statement of Principles on
the Management and
Conservation of the World‟s
Forests
Ramsar Convention
(Wetlands)
1971
Montreal Protocol
(Ozone depletion)
1987
Basel Convention
(Hazardous Waste)
1989
Rotterdam Convention
(Hazardous Chemicals)
1998
Stockholm Convention
(Persistent Organic Pollutants)
2001
EU Environmental Liability Directive
(2004)
+ IPCC + IPBES
Other significant multi-lateral environmental agreements:

36 February 2012
Session 3
Introduction to policy trends (cont.)
Facilitators‟ notes Media/activity/handout guidance
Slide 35: 1 minute
Sources: United Nations
http://www.un.org/geninfo/bp/envirp2.html
WBCSD, Responding to the Biodiversity Challenge: Business
contributions to the Convention on Biological Diversity (2010) [online].
Available from:
http://www.wbcsd.org/web/nagoya/RespondingtotheBiodiversityChalleng
e.pdf
Instructions:
Facilitator to refer to source and present the Convention on Biological
Diversity and its three objectives, briefly mentioning the headline and
Aichi targets.
Background:
The Convention on Biological Diversity (CBD) states that the ecosystem
approach is a strategy for the integrated management of land, water,
and living resources that promotes conservation and sustainable use in
an equitable way. This approach recognizes that humans, with their
cultural diversity, are an integral component of many ecosystems.
In order to implement the ecosystem approach, decision-makers need to
understand the multiple effects on an ecosystem of any management or
policy change. By way of analogy, decision-makers would not make a
decision about financial policy in a country without examining the
condition of the economic system, since information on the economy of
a single sector such as manufacturing would be insufficient. The same
need to examine the consequences of changes for multiple sectors
applies to ecosystems.
For instance, subsidies for fertilizer use may increase food production, but
sound decisions also require information on whether the potential reduction
in the harvests of downstream fisheries as a result of water quality
degradation from the fertilizer runoff might outweigh those benefits.
37 February 2012
Session 3
Introduction to policy trends (cont.)
Facilitators‟ notes Media/activity/handout guidance
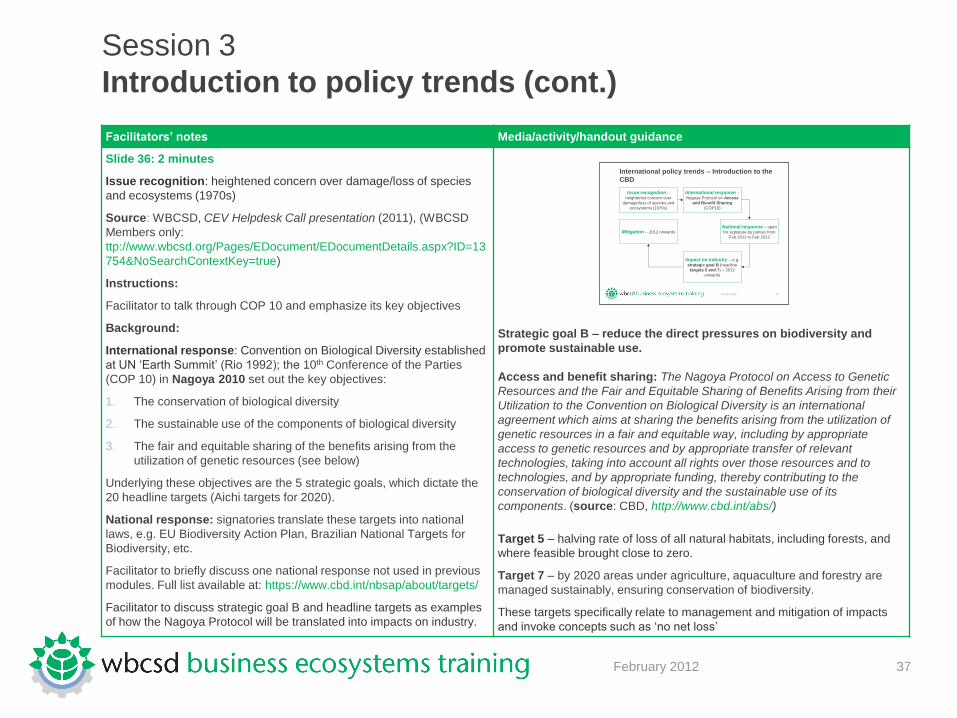
Slide 36: 2 minutes
Issue recognition: heightened concern over damage/loss of species
and ecosystems (1970s)
Source: WBCSD, CEV Helpdesk Call presentation (2011), (WBCSD
Members only:
ttp://www.wbcsd.org/Pages/EDocument/EDocumentDetails.aspx?ID=13
754&NoSearchContextKey=true)
Instructions:
Facilitator to talk through COP 10 and emphasize its key objectives
Background:
International response: Convention on Biological Diversity established
at UN „Earth Summit‟ (Rio 1992); the 10th Conference of the Parties
(COP 10) in Nagoya 2010 set out the key objectives:
1. The conservation of biological diversity
2. The sustainable use of the components of biological diversity
3. The fair and equitable sharing of the benefits arising from the
utilization of genetic resources (see below)
Underlying these objectives are the 5 strategic goals, which dictate the
20 headline targets (Aichi targets for 2020).
National response: signatories translate these targets into national
laws, e.g. EU Biodiversity Action Plan, Brazilian National Targets for
Biodiversity, etc.
Facilitator to briefly discuss one national response not used in previous
modules. Full list available at: https://www.cbd.int/nbsap/about/targets/
Facilitator to discuss strategic goal B and headline targets as examples
of how the Nagoya Protocol will be translated into impacts on industry.
Strategic goal B – reduce the direct pressures on biodiversity and
promote sustainable use.
Access and benefit sharing: The Nagoya Protocol on Access to Genetic
Resources and the Fair and Equitable Sharing of Benefits Arising from their
Utilization to the Convention on Biological Diversity is an international
agreement which aims at sharing the benefits arising from the utilization of
genetic resources in a fair and equitable way, including by appropriate
access to genetic resources and by appropriate transfer of relevant
technologies, taking into account all rights over those resources and to
technologies, and by appropriate funding, thereby contributing to the
conservation of biological diversity and the sustainable use of its
components. (source: CBD, http://www.cbd.int/abs/)
Target 5 – halving rate of loss of all natural habitats, including forests, and
where feasible brought close to zero.
Target 7 – by 2020 areas under agriculture, aquaculture and forestry are
managed sustainably, ensuring conservation of biodiversity.
These targets specifically relate to management and mitigation of impacts
and invoke concepts such as „no net loss‟
34January 2012
International policy trends – Introduction to the
CBD
Issue recognition –heightened concern over
damage/loss of species and
ecosystems (1970s)
International response –Nagoya Protocol on Access
and Benefit Sharing
(COP10)
National response – open
for signature by parties from
Feb 2011 to Feb 2012
Impact on industry – e.g.
strategic goal B (headline
targets 5 and 7) – 2012
onwards
Mitigation – 2012 onwards

38 February 2012
Session 3
Introduction to policy trends (cont.)
Facilitators‟ notes Media/activity/handout guidance
Slide 36: 2 minutes (cont.)
Issue recognition: heightened concern over damage/loss of species
and ecosystems (1970s)
National response example:
[Customization: Facilitators to customize this part using the
relevant country examples introduced in the State of Biodiversity
Markets Report publication. ]
Japan: “A 2010 report by Japan‟s Central Environmental Council called
for better tracking of new types of biodiversity conservation measures
including biodiversity offsets. Following this recommendation, the
Ministry of Environment Japan began investigations into overseas
biodiversity compensation schemes in 2010.Under Japan‟s existing
national Environmental Impact Assessment Law (enacted in 1997),
impact mitigation measures may include avoidance, reduction, and
compensation. Several compensation examples exist to date but most of
these are not full-scale biodiversity offsets as implemented in many
countries”
Source: Madsen, Becca; Carroll, Nathaniel; Moore Brands, Kelly; 2011.
State of Biodiversity Markets Report: Offset and Compensation
Programs Worldwide. p29-30. Available at:
http://www.ecosystemmarketplace. com/documents/acrobat/sbdmr.pdf
Impact on Industry: impact on industry will be more clear post-2012.
Mitigation: most national responses will be implemented post-2012.
34January 2012
International policy trends – Introduction to the
CBD
Issue recognition –heightened concern over
damage/loss of species and
ecosystems (1970s)
International response –Nagoya Protocol on Access
and Benefit Sharing
(COP10)
National response – open
for signature by parties from
Feb 2011 to Feb 2012
Impact on industry – e.g.
strategic goal B (headline
targets 5 and 7) – 2012
onwards
Mitigation – 2012 onwards

39 February 2012
Session 3
Introduction to policy trends (cont.)
Facilitators‟ notes Media/activity/handout guidance
Slide 37: <1 minute
Instructions:
Facilitator to recap what has been covered in the module so far.

40 February 2012
Session 4: Applying the Mitigation Hierarchy
Time guidelines
Time guidelines Time
Applying the mitigation hierarchy – case study 45 minutes
Session objective
Delegates to take part in an exercise to apply the mitigation hierarchy.
Session overview
Delegates are given a thorough introduction to the mitigation hierarchy
through a presentation and case study walk through. The second part of
the session is an exercise requiring delegates to apply the mitigation
hierarchy to a particular case study example.
Session format
This session will be run by one course facilitator, who will talk through
key concepts and definitions with delegates.
Handouts
Delegates course material desk pack – hardcopies will be laid out on
delegate desks in advance of their arrival at the course. This pack
contains copies of all of the slides used throughout this course together
with relevant handout materials required for each session.
A glossary of terms used during the module will also be available in the
course material desk pack.

41 February 2012
Session 4
Applying the Mitigation Hierarchy – case study (cont.)
Facilitators‟ notes Media/activity/handout guidance
Case Study (Net Positive impact anecdotal example) and Interactive
Group Activity
Slide 38: <1 minute
Facilitator to state session objective, (i.e. to take part in an exercise to
apply a key concept introduced earlier in the module, the Mitigation
Hierarchy).
Slide 39: 2 minutes
Interactive
Ask the delegates to define Net Positive Impact (NPI) [if not covered
in Introduction and Icebreaker session – if so then refer back]
Facilitator to discuss the definition and various names for No Net Loss
(NNL) and NPI
NNL: “No net loss is defined as the point at which project-related impacts
on biodiversity are balanced by measures taken to avoid and minimize the
project‟s impacts, to undertake on-site restoration and finally to offset
significant residual impacts, if any, on an appropriate geographic scale
(e.g., local, landscape-level, national, regional).”
„Net gains‟: “Net gains are additional conservation outcomes that can be
achieved for the biodiversity values for which the critical habitat was
designated. Net gains may be achieved through the development of a
biodiversity offset and/or through programs that can be implemented in
situ (on-the-ground) to enhance habitat, and protect and conserve
biodiversity.”
Source: IFC Performance Standard 6
http://www1.ifc.org/wps/wcm/connect/bff0a28049a790d6b835faa8c6a8312
a/PS6_English_2012.pdf?MOD=AJPERES
Net positive impact (as defined in TEEB through the Rio Tinto
example): Ensuring, where possible, that the company‟s actions have
positive effects on biodiversity features and their values that not only
balance but are broadly accepted to outweigh the inevitable negative
effects of the physical disturbances and impacts associated with the
company‟s operations.
Source: TEEB for business, Chapter 4 page 11
http://www.teebweb.org/LinkClick.aspx?fileticket=tcneop1kys4%3d&tabid=
1021&language=en-US
41January 2012
„No Net Loss‟
No Net loss at regional level = there is no overall decline in hectares of
habitat within a region
Some business‟s have taken this one stage further by aiming for a Net
Positive Impact (e.g. across their operations or for all new
developments)
Loss of habitat
in one area
Restoration or protection
of more/better habitat in
another area
42 February 2012
Session 4
Applying the Mitigation Hierarchy – case study (cont.)
Facilitators‟ notes Media/activity/handout guidance
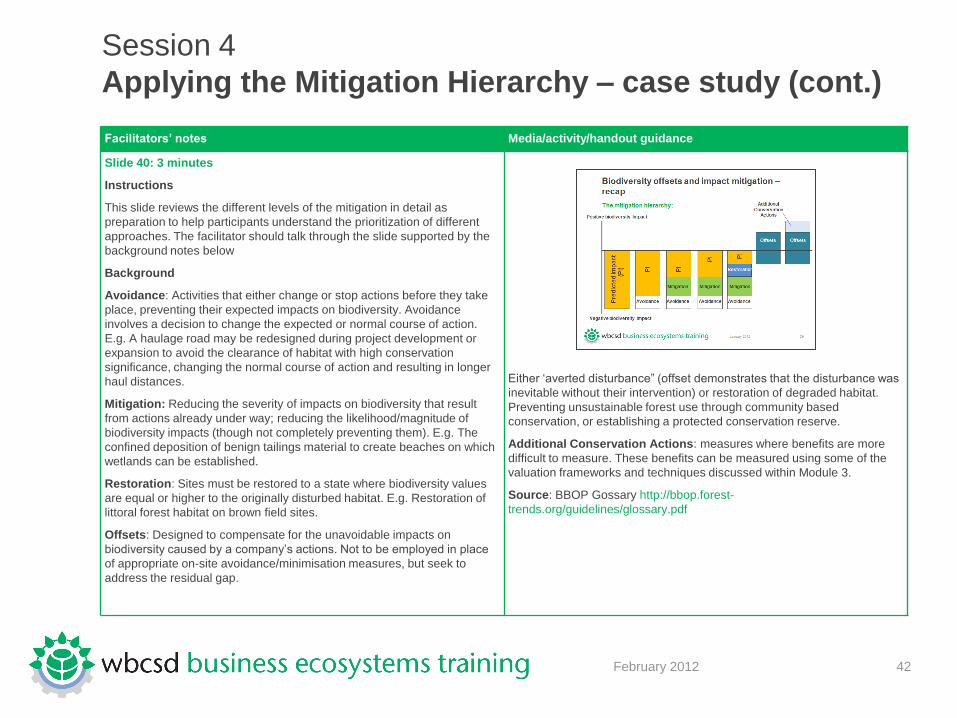
Slide 40: 3 minutes
Instructions
This slide reviews the different levels of the mitigation in detail as
preparation to help participants understand the prioritization of different
approaches. The facilitator should talk through the slide supported by the
background notes below
Background
Avoidance: Activities that either change or stop actions before they take
place, preventing their expected impacts on biodiversity. Avoidance
involves a decision to change the expected or normal course of action.
E.g. A haulage road may be redesigned during project development or
expansion to avoid the clearance of habitat with high conservation
significance, changing the normal course of action and resulting in longer
haul distances.
Mitigation: Reducing the severity of impacts on biodiversity that result
from actions already under way; reducing the likelihood/magnitude of
biodiversity impacts (though not completely preventing them). E.g. The
confined deposition of benign tailings material to create beaches on which
wetlands can be established.
Restoration: Sites must be restored to a state where biodiversity values
are equal or higher to the originally disturbed habitat. E.g. Restoration of
littoral forest habitat on brown field sites.
Offsets: Designed to compensate for the unavoidable impacts on
biodiversity caused by a company‟s actions. Not to be employed in place
of appropriate on-site avoidance/minimisation measures, but seek to
address the residual gap.
Either „averted disturbance” (offset demonstrates that the disturbance was
inevitable without their intervention) or restoration of degraded habitat.
Preventing unsustainable forest use through community based
conservation, or establishing a protected conservation reserve.
Additional Conservation Actions: measures where benefits are more
difficult to measure. These benefits can be measured using some of the
valuation frameworks and techniques discussed within Module 3.
Source: BBOP Gossary http://bbop.forest-
trends.org/guidelines/glossary.pdf

43 February 2012
Session 4
Applying the Mitigation Hierarchy – case study
Facilitators‟ notes Media/activity/handout guidance
Session 5 – Applying the Mitigation Hierarchy: Case Study
Case Study (Net Positive impact anecdotal example) and Interactive
Group Activity
Slide 41 1 minute
Case study: Rio Tinto
Sources:
WBCSD, Effective Biodiversity and Ecosystem Policy and Regulation
(2010)
http://www.wbcsd.org/Pages/EDocument/EDocumentDetails.aspx?ID=21&
NoSearchContextKey=true
Rio Tinto and Biodiversity (2008)
http://www.riotinto.com/documents/ReportsPublications/RTBidoversitystrat
egyfinal.pdf
British-Australian multinational mining and resources company.
Rio Tinto‟s goal is to have a „net positive impact‟ (NPI) on
biodiversity. Their strategy was launched in 2004 at the IUCN World
Conservation Congress in Bangkok.
They find that “biodiversity can present opportunities to build
business value – opportunities to build better relationships with our
stakeholders, understand emerging ecosystem services markets and
achieve our sustainable development goals”.
To achieve NPI, they first need to reduce their impacts on
„biodiversity values‟ through applying the mitigation hierarchy.
42January 2012
Case Study: Rio Tinto
Rio Tinto‟s long-term goal is to have a Net Positive Impact on
biodiversity
Positive actions outweigh inevitable negative effects associated with
mining and mineral processing by using:
Mitigation hierarchy (avoid, mitigate, restore)
Offsets and other conservation actions

44 February 2012
Session 4
Applying the Mitigation Hierarchy – case study (cont.)
Facilitators‟ notes Media/activity/handout guidance
Slide 39: 2 minutes
Sources:
WBCSD, Effective Biodiversity and Ecosystem Policy and Regulation
(2010)
http://www.wbcsd.org/Pages/EDocument/EDocumentDetails.aspx?ID=21&
NoSearchContextKey=true
Rio Tinto and Biodiversity (2008)
http://www.riotinto.com/documents/ReportsPublications/RTBidoversitystrat
egyfinal.pdf
Instructions:
Facilitator to discuss Rio Tinto‟s approach and commitments
Background:
In Rio Tinto‟s biodiversity strategy each of its operations must be able to:
Identify important biological values on and off site at the species,
habitat and ecosystem service level.
Understand what impacts mining activities and infrastructure have
on these features.
Plan.Have a plan to mitigate the impact (considering the mitigation
hierarchy).
Rio Tinto have their own biodiversity action planning (BAP) tool to
complete these steps in a standardised way. The guidance for the BAP
was developed in partnership with Fauna & Flora International (FFI)
through trials at four Rio Tinto sites with different needs, complexity and
resources to ensure robustness: Rössing, Namibia; Palabora, South
Africa; QIT Madagascar Minerals (QMM), Madagascar; and, Corumbá,
Brazil.
43January 2012
Rio Tinto‟s Goals
Source: WBCSD, Effective Biodiversity and Ecosystem Policy and Regulation

45 February 2012
Session 4
Applying the Mitigation Hierarchy – case study (cont.)
Facilitators‟ notes Media/activity/handout guidance
Case Study (Net Positive impact anecdotal example) and Interactive
Group Activity
Slide 42: 2 minutes (continued)
Case study: Rio Tinto‟s commitments
Sources:
WBCSD, Effective Biodiversity and Ecosystem Policy and Regulation
(2010)
http://www.wbcsd.org/Pages/EDocument/EDocumentDetails.aspx?ID=21&
NoSearchContextKey=true
Rio Tinto and Biodiversity (2008)
http://www.riotinto.com/documents/ReportsPublications/RTBidoversitystrat
egyfinal.pdf
This slide outlines Rio Tinto‟s priorities in relation to biodiversity, stated as:
The identification of biodiversity values impacted by their activities
The prevention, minimisation, and mitigation of biodiversity risks
throughout the business cycle
Responsible stewardship of the land they manage
The identification and pursuit of biodiversity conservation
opportunities
The involvement of communities and other constituencies in their
management of biodiversity issues
Rio Tinto‟s Goal:
To have a “net positive impact (NPI) on biodiversity by minimising the
negative impacts of our activities and by making appropriate
contributions to conservation in the regions in which we operate”.
Image source: BBOP
http://bbop.forest-trends.org/guidelines/overview.pdf
43January 2012
Rio Tinto‟s Goals
Source: WBCSD, Effective Biodiversity and Ecosystem Policy and Regulation

46 February 2012
Session 4
Applying the Mitigation Hierarchy – case study (cont.)
Facilitators‟ notes Media/activity/handout guidance
Slide 43-48: 35 minutes
Objective: delegates to take part in an exercise to apply the mitigation
hierarchy
Source: WBCSD, Responding to the Biodiversity Challenge (2010)
http://www.wbcsd.org/Pages/EDocument/EDocumentDetails.aspx?ID=22&
NoSearchContextKey=true
Instructions
Facilitator to go through the Suncor case study
Facilitator to describe the case study context and the objective for the
exercise (3 minutes). A handout including the mitigation hierarchy and
summarizing the key points will be handed out to delegates.
Facilitator to ask for a quick hands up to see who has had to put
conservation measures in place for their company (2 minutes – facilitator
to note down the number)
Facilitator to put delegates into groups of 4-5
Delegates will be given 20 minutes in their groups to discuss:
1. The ecosystem services impacted in the case study example
2. Based on the information available the approach they would use to
minimise impacts
Facilitator to collect feedback from each group as it is shared with the
group, with key points summarised on a flip chart (5-10 minutes). The
facilitator may wish to run through the company‟s actual response and
results, depending on audience.
44January 2012
Case study exercise – Suncor Energy
The issue
A reclamation objective
Canada‟s largest integrated energy company
Leader in oil sands production.
Complementary operations in refining and marketing, natural gas
production and conventional oil production.
Oil sands activities in Alberta, in the Canadian boreal forest
Company is committed to:
returning all lands disturbed by mining operations to a state as
close to pre-disturbance conditions as possible
Reclamation is a regulatory requirement and a key stakeholder
expectation
45January 2012
Group exercise: flipchart layout
Ecosystems Services
Impacted?
Approach?
46January 2012
Feedback...
47January 2012
Case study exercise – Suncor Energy
The response
A methodology based on constant research and innovation
Before constructing a new mine or facility, Suncor develops a
reclamation plan with local stakeholders and government regulators
Plans include land preparation and reclamation with respect to land
impacted by the in-situ operations as well
Reclamation plans are approved by Alberta government, with several
distinct components:
Transformation of oil sands tailings ponds into solid material that can
support ecosystem services;
Re-vegetation so that reclaimed landscape can support vegetation
and wildlife.
48January 2012
Case study exercise – Suncor Energy
The results
Pond 1
First surface reclamation of former oil sands tailings pond, “Pond 1”
Ultimately plan to transform the 220-hectare pond, established in the
1960s, into a mixed wood forest and a small wetland
Reclamation began in 2007 (ongoing)
Over 150,000 trees were planted on the site in the first 6 months of 2010
alone
Suncor became the first oil sands company to have a tailings pond with
a trafficable surface with reclamation underway
By combining innovative reclamation and stakeholder consultations, the
company aims to increase its “social license” to operate.

47 February 2012
Session 4
Applying the Mitigation Hierarchy – case study (cont.)
Facilitators‟ notes Media/activity/handout guidance
Slide 49: <1 minute
Instructions:
Facilitator to recap what has been covered in the module so far.

48 February 2012
Coffee break
30 minutes

49 February 2012
Session 5: Knowledge check
Time guidelines
Time guidelines Time
Knowledge check – activity 10 minutes
Session objective
Reinforce the explicit or implicit learning of the course, and provide an
overview of the learning gaps in the group.
Session overview
The session reminds the delegates of the module so far, followed up by
a quick quiz of key concepts and terminology.
Session format
This session will be run by one course facilitator, who will talk through
key concepts and definitions with delegates.
Handouts
Delegates course material desk pack – hardcopies will be laid out on
delegate desks in advance of their arrival at the course. This pack
contains copies of all of the slides used throughout this course together
with relevant handout materials required for each session.
A glossary of terms used during the module will also be available in the
course material desk pack.

50 February 2012
Session 5
Knowledge check
Facilitators‟ notes Media/activity/handout guidance
Slide 51: 1 minute
Objective: Knowledge check
Total time for exercise: 10 minutes
Instructions:
Facilitator to quickly review the key knowledge gained through the
previous sessions (slide 2). Then move to the next slide (3).
Note to facilitator: do not stop to explain a specific concept, only list the
sessions and the overall objective of each one. Gaps in knowledge should
be identified after the delegates have responded to the „knowledge check‟
questions.

51 February 2012
Facilitators‟ notes Media/activity/handout
Slide 52: 8 minutes
Objective: Knowledge check
Instructions:
Facilitator will explain to delegates the purpose and approach used within
the session. They will be asked a series of questions and asked to write
down their answers individually and discuss with the group during debrief.
1. Delegates will have a couple of minutes to answer the questions on a
piece of paper
2. Facilitator to ask delegates to provide their answer
3. Facilitator will debrief and answer questions from delegates
Answers: The facilitator should explore different types of answers and
respond to question from delegates below.
Guidance on how to respond if delegates have not achieved their
learning objectives
If there is time revisit specific points and definitions in session 2,
Revisit one specific case study
Point delegates to the references in their pack which include sources
of further reading
Questions:
1. What is the difference between offsetting and payments for
ecosystem services?
2. What are the levels of the mitigation hierarchy?
[Option: to run the session as a catch the ball activity, i.e., the person
in the audience that catches the ball attempts the answer]
Session 5
Knowledge check (cont.)
38January 2012
Interactive
Key concepts
Do you know...

52 February 2012
Session 6
Time guidelines
Time guidelines Time
Compensation and offsetting 40 minutes
Session objective
Delegates to consider how compensation works and the options for
offsetting.
Session overview
Delegates are given a thorough introduction to offsetting and its
challenges through a presentation. The delegates will also take part in a
group case study exercise.
Session format
This session will be run by one course facilitator, who will talk through
key concepts and definitions with delegates.
Handouts
Delegates course material desk pack – hardcopies will be laid out on
delegate desks in advance of their arrival at the course. This pack
contains copies of all of the slides used throughout this course together
with relevant handout materials required for each session.
A glossary of terms used during the module will also be available in the
course material desk pack.
Handouts for the case study showing context and options.

53 February 2012
Session 6
Compensation and offsetting
Facilitators‟ notes Media/activity/handout guidance
Slide 53: < 1 minute
Instructions
Facilitator to state the objective of the session
Slide 54: 2 minutes
Source: session 2
Instructions
Q&A: Facilitator to ask the audience for an explanation of offsetting
Following audience participation, facilitator to reveal the definition used
within the basic concepts session.
The Business and Biodiversity Offsets Programme (BBOP) definition:
“Measurable conservation outcomes resulting from actions designed to
compensate for significant residual adverse biodiversity impacts arising
from project development and persisting after appropriate prevention
and mitigation measures have been implemented.
The goal of biodiversity offsets is to achieve no net loss and preferably a
net gain of biodiversity on the ground with respect to species composition,
habitat structure, ecosystem function and people‟s use and cultural values
associated with biodiversity.”
NOTE: Participants tend to forget the new conceptual ESR framework
in this section, remind them that social compensation does not add
to an offset.
Session 6
Compensation and Offsetting
Module 4: Managing and Mitigating Impacts
51January 2012
Offsetting
Can anyone give me an explanation of offsetting?
1. The Business and Biodiversity Offsets Programme (BBOP) definition:
“Measurable conservation outcomes resulting from actions designed to
compensate for significant residual adverse biodiversity impacts arising
from project development and persisting after appropriate prevention
and mitigation measures have been implemented.
The goal of biodiversity offsets is to achieve no net loss and preferably a
net gain of biodiversity on the ground with respect to species
composition, habitat structure, ecosystem function and people‟s use and
cultural values associated with biodiversity.”

54 February 2012
Session 6
Compensation and offsetting (cont.)
Facilitators‟ notes Media/activity/handout guidance
Slide 55: 2 minutes
Source: WBCSD, CEV Helpdesk Call (Jul 2011) (WBCSD Members only:
http://www.wbcsd.org/Pages/EDocument/EDocumentDetails.aspx?ID=137
52&NoSearchContextKey=true)
Instructions
Facilitator to talk though the following slide showing an extremely simple
example of how offsetting works.
Example:
A developer impacts one hectare of natural habitat, but pays a third party
to protect or restore more than one hectare. (Credits can also be defined
by other quantities and qualities e.g. breeding pairs, ecosystem services,
habitat quality).
Conservation bank: “A conservation bank is a parcel of land managed for
its conservation values. In exchange for permanently protecting the land,
the bank owner is allowed to sell credits to parties who need them to
satisfy legal requirements for compensating environmental impacts of
development projects. (See Carroll et al. 2008)”
Source: BBOP Glossary http://bbop.forest-
trends.org/guidelines/glossary.pdf
Important to make distinction between biodiversity „offsets‟ (the units) and
biodiversity „banking‟ (collated offsets – usually ex ante)
Offsets vs. Compensation (according to BBOP definitions)
A biodiversity offset is:
Designed to achieve “no net loss” or “net gain‟
Meets BBOP Principles and draft Standard
Compensatory conservation do not meet the BBOP principles when they:
The conservation actions were not planned to achieve no net loss.
The residual losses of biodiversity caused by the project and gains
achievable by the offset are not quantified.
No mechanism for long term implementation has been established.
It is impossible to offset the impacts (for instance, because they are
too severe or pre-impact data are lacking, so it is impossible to know
what was lost as a result of the project).
The compensation is through payment for training, capacity building,
research or other outcomes that will not result in measurable
conservation outcomes on the ground.
Sources:
Conference call on biodiversity offsets, BBOP for WBCSD (3 Oct 2011)
(WBCSD members only:
http://www.wbcsd.org/Pages/EDocument/EDocumentDetails.aspx?ID=137
49&NoSearchContextKey=true)
BBOP, Standard on Biodiversity Offsets. (2012), http://bbop.forest-
trends.org/guidelines/Standard.pdf
52January 2012
What is biodiversity offsetting?
1 Hectare
Credit
1 Hectare
Credit
1 Hectare
Credit
1 Hectare
Credit
1 Hectare
Credit
1 Hectare
Credit
1 Hectare
Credit
1 Hectare
Credit
1 Hectare
Credit
Biodiversity offset
1
Hectare
Natural habitat
Development project
Source: WBCSD, CEV help desk July 2011

55 February 2012
Session 6
Compensation and offsetting (cont.)
Facilitators‟ notes Media/activity/handout guidance
Slides 56-57: 2 minutes
Sources:
BBOP Standard on Biodiversity Offsets (Jan 2012) http://bbop.forest-
trends.org/guidelines/Standard.pdf
IFC Performance Standard 6 (Jan 2012),
http://www1.ifc.org/wps/wcm/connect/bff0a28049a790d6b835faa8c6a8312
a/PS6_English_2012.pdf?MOD=AJPERES
Instructions
Facilitator to talk though the following slide, explaining briefly the basic
principles of the BBOP standard on biodiversity offsets and requirements
of the IFC Performance Standard 6.
Background
BBOP Standard on Biodiversity Offsets
“[The] standard on biodiversity offsets, [is] intended to help determine
whether an offset has been designed and subsequently implemented in
accordance with the BBOP Principles. BBOP agreed its ten Principles in
2009, and this standard is presented as a hierarchy of Principles, Criteria
and Indicators (PCI): an architecture similar to that used in a number of
other standards, such as the Forest Stewardship Council, the Marine
Stewardship Council, the Roundtable for Sustainable Palm Oil, Round
Table on Responsible Soy, and others.
„Principles‟ are interpreted as the fundamental statements about a desired
outcome. „Criteria‟ are the conditions that need to be met in order to
comply with a Principle. „Indicators‟ are the measurable states which allow
the assessment of whether or not a particular Criterion has been met. “
IFC Performance Standard 6:
“The Performance Standards are directed towards clients, providing
guidance on how to identify risks and impacts, and are designed to help
avoid, mitigate, and manage risks and impacts as a way of doing business
in a sustainable way, including stakeholder engagement and disclosure
obligations of the client in relation to project-level activities. In the case of
its direct investments (including project and corporate finance provided
through financial intermediaries), IFC requires its clients to apply the
Performance Standards to manage environmental and social risks and
impacts so that development opportunities are enhanced. IFC uses the
Sustainability Framework along with other strategies, policies, and
initiatives to direct the business activities of the Corporation in order to
achieve its overall development objectives. The Performance Standards
may also be applied by other financial institutions.”

56 February 2012
Session 6
Compensation and offsetting (cont.)
Facilitators‟ notes Media/activity/handout guidance
Slide 57: 2 minutes
Sources:
IFC Performance Standard 6 (Jan 2012),
http://www1.ifc.org/wps/wcm/connect/bff0a28049a790d6b835faa8c6a8312
a/PS6_English_2012.pdf?MOD=AJPERES
Background (cont.)
IFC Performance Standard 6 (con.). Extracts related to the mitigation
hierarchy and offsetting
“7. As a matter of priority, the client should seek to avoid impacts on
biodiversity and ecosystem services. When avoidance of impacts is not
possible, measures to minimize impacts and restore biodiversity and
ecosystem services should be implemented. Given the complexity in
predicting project impacts on biodiversity and ecosystem services over the
long term, the client should adopt a practice of adaptive management in
which the implementation of mitigation and management measures are
responsive to changing conditions and the results of monitoring throughout
the project‟s lifecycle. “
“10. For the protection and conservation of biodiversity, the mitigation
hierarchy includes biodiversity offsets, which may be considered only after
appropriate avoidance, minimization, and restoration measures have been
applied. A biodiversity offset should be designed and implemented to
achieve measurable conservation outcomes that can reasonably be
expected to result in no net loss and preferably a net gain of biodiversity;
however, a net gain is required in critical habitats. The design of a
biodiversity offset must adhere to the “like-for-like or better” principle and
must be carried out in alignment with best available information and
current practices. When a client is considering the development of an
offset as part of the mitigation strategy, external experts with knowledge in
offset design and implementation must be involved.”
“12. This Performance Standard applies to those areas of modified habitat
that include significant biodiversity value, as determined by the risks and
impacts identification process required in Performance Standard 1. The
client should minimize impacts on such biodiversity and implement
mitigation measures as appropriate.”
“15. In areas of natural habitat, mitigation measures will be designed to
achieve no net loss9 of biodiversity where feasible.”
Note regarding “like for like or better”:
“The principle of “like-for-like or better” indicates that biodiversity offsets
must be designed to conserve the same biodiversity values that are being
impacted by the project (an “in-kind” offset). In certain situations, however,
areas of biodiversity to be impacted by the project may be neither a
national nor a local priority, and there may be other areas of biodiversity
with like values that are a higher priority for conservation and sustainable
use and under imminent threat or need of protection or effective
management. In these situations, it may be appropriate to consider an
“out-of-kind” offset that involves “trading up” (i.e., where the offset targets
biodiversity of higher priority than that affected by the project) that will, for
critical habitats, meet the requirements of paragraph 17 of this
Performance Standard.”

57 February 2012
Session 6
Compensation and offsetting (cont.)
Facilitators‟ notes Media/activity/handout guidance
Slide 58: 3 minutes
Sources: WBCSD, CEV Helpdesk Call (Jul 2011) (WBCSD Members
only:
http://www.wbcsd.org/Pages/EDocument/EDocumentDetails.aspx?ID=137
52&NoSearchContextKey=true)
Notes taken from “State of Biodiversity Markets Report: Offset and
Compensation Programs Worldwide“
http://www.ecosystemmarketplace.com/documents/acrobat/sbdmr.pdf
Instructions:
Facilitator to talk though the drivers for offsetting.
Background:
Regulatory compliance setting
“The government sets a limit on the impact to a species or habitat and
then allows the market to resolve the cost of offsetting impacts above the
limit or „cap.‟ For example, in the United States (US), the Endangered
Species Act limits harm to federally-listed endangered species and
requires a mitigation hierarchy: first avoidance, then minimization of harm,
and finally mitigation for impacts to species. Mitigation obligations could be
fulfilled by purchasing a credit from a private conservation bank that has
restored and/or managed or preserved habitat for the species ...
Governments may also require mitigation on a case-by-case basis, as
regulated by Environmental Impact Assessment (EIA) or other regulations
integrated in planning Permissions.”
Source: Regulatory compliance continued notes taken from
http://www.csc.noaa.gov/coastal/economics/habitatequ.htm
Further legal protections in the US include:
The National Oceanic and Atmospheric Administration (NOAA) acts as a
federal trustee for natural resources under the following
Acts: Comprehensive Environmental Response,
Compensation, and Liability Act (CERCLA)
National Marine Sanctuaries Act 1990 Oil Pollution Control Act.
Example: the US Clean Water Act (CWA)
Passed in 1972, the Act introduced „wetland permits‟ to encourage
protection of wetland resources through market-based means. This is
considered one of the most „mature‟ offset frameworks, having been in
place since the 1970s. The objective is to offset adverse impacts to
wetlands through compensatory mitigation that replaces wetland functions
and values. Federal guidance on wetland mitigation banking was issued in
1995, which was superseded by new regulatory standards, introduced in
2008 by the EPA/US Corps, promoting NO NET LOSS and improved
wetland restoration and protection – [Source: http://bbop.forest-
trends.org/guidelines/odh-appendicies.pdf]

58 February 2012
Session 6
Compensation and offsetting (cont.)
Facilitators‟ notes Media/activity/handout guidance
Slide 58: 3 minutes (cont.)
Source: WBCSD, CEV Helpdesk Call (Jul 2011) (WBCSD Members only:
http://www.wbcsd.org/Pages/EDocument/EDocumentDetails.aspx?ID=137
52&NoSearchContextKey=true),
Notes taken from “State of Biodiversity Markets Report: Offset and
Compensation Programs Worldwide“
http://www.ecosystemmarketplace.com/documents/acrobat/sbdmr.pdf
Examples of policy/regulation as driver (from Ecosystem Marketplace) :
Facilitator to describe 1 or 2 of these examples (refer to “Ecosystem
Marketplace” source for more examples), but mention that other relevant
frameworks will be discussed in later sessions.
USA: Biodiversity offsets and compensation programs are well-developed
in North America, particularly with the United States wetland and species
compensation programs. North America hosts the most mitigation banks of
any region in the world. Programs are driven by national, state, and/or
regional policy. Species banks have been developed in many states, led
by California, with the goal of recovering endangered species. The banks
transform endangered species from liabilities to assets. Species bank
market worth as much as $370 million a year, protecting around 75,000
acres.
Germany: well-developed biodiversity compensation system. The Impact
Mitigation Regulations (IMRs) is a mandatory, precautionary law to ensure
“no net loss”, by avoiding damage and implementing restoration and
replacement compensation for unavoidable impacts.
All Australian/New Zealand offsets are compliance-based, mostly
determined on a case-by-case basis during planning processes.
Developers or business/industry purchase offsets from government to
compensate for impacts on biodiversity. Example: New South Wales
Biobanking is a state program driven by regulatory requirements to offset
impacts from urban development. Only officially live since 2009. Credit
prices ranged from AUD $2,563 (2010) to AUD $8,000 (2011). The total
value of credits transferred in 2010 was AUD $1,555,741 (or US
$1,498,614, in 2010 dollars).

59 February 2012
Session 6
Compensation and offsetting (cont.)
Facilitators‟ notes” Media/activity/handout guidance
Slide 58: 3 minutes (cont.)
Sources: WBCSD, CEV Helpdesk Call (Jul 2011) (WBCSD Members
only:
http://www.wbcsd.org/Pages/EDocument/EDocumentDetails.aspx?ID=137
52&NoSearchContextKey=true)
Notes taken from “State of Biodiversity Markets Report: Offset and
Compensation Programs Worldwide“
http://www.ecosystemmarketplace.com/documents/acrobat/sbdmr.pdf
Access to Finance
One example is the International Finance Corporation (IFC) Performance
Standards. IFC requires its clients to apply the Performance Standards to
manage environmental and social risks and impacts so that development
opportunities are enhanced. Performance Standard 6 is on “Biodiversity
Conservation and Sustainable Management of Living Natural Resources “,
and states that:
“As a matter of priority, the client should seek to avoid impacts on
biodiversity and ecosystem services. When avoidance of impacts is not
possible, measures to minimize impacts and restore biodiversity and
ecosystem services should be implemented. Given the complexity in
predicting project impacts on biodiversity and ecosystem services over the
long term, the client should adopt a practice of adaptive management in
which the implementation of mitigation and management measures are
responsive to changing conditions and the results of monitoring throughout
the project‟s lifecycle. “
Source: IFC Performance Standard 6 (Jan 2012),
http://www1.ifc.org/wps/wcm/connect/bff0a28049a790d6b835faa8c6a8312
a/PS6_English_2012.pdf?MOD=AJPERES
Government-mediated payments
“Government-mediated payments can also be a driver of biodiversity
goods and services. The government (and/or a non-profit organization)
acts as a sole „buyer‟ when it fulfils public demand for biodiversity goods
and services by purchasing land or conservation easements or creating
payment programs for biodiversity stewardship activities. For example, a
partnership between the non-profit organizations World Wildlife
Foundation (WWF) and Fondo Mexicano para la Conservación de la
Naturaleza established a Monarch Butterfly Conservation Fund to pay
local landowners for butterfly habitat conservation.”
„Voluntary‟ markets
“„Voluntary‟ markets have a variety of drivers from ethics and philanthropy
to profit and consumption motives. Examples include: certified biodiversity-
friendly products, donations for biodiversity conservation or research,
positive public relations, ecotourism and recreation, and others.”

60 February 2012
Session 6
Compensation and offsetting (cont.)
Facilitators‟ notes Media/activity/handout guidance
Slide 59: 2 minutes
Source: BBOP, Business, Biodiversity Offsets and BBOP. An overview
(2008) http://bbop.forest-trends.org/guidelines/overview.pdf
Instructions:
Facilitator to talk through the key challenges for biodiversity offset
development, as outlined in BBOP. Facilitator should be selective as to
which to focus on.
Background:
The following list of challenges have been extracted from the Business
and Biodiversity Program (BBOP) „s Business, Biodiversity Offsets and
BBOP. An overview. publication. BBOP Phase 2 is aiming to tackle these
different challenges (For more information, please refer to the detailed
description in the publication).
“Trade offs: Decisions on project approvals – including decisions whether
to proceed with a project (the so called „Go/No-Go‟ decision) and the
conditions attached to projects – always involve trade offs between areas
of cost or impact and areas of benefit or gain. In practice, however,
challenges arise through different perceptions of acceptable trade offs
among companies, government agencies, conservationists, and local
communities involved in complex decision-making processes. BBOP‟s
intention is to propose a set of practical methodologies to account for
biodiversity value and for conservation actions that include options to
compensate for loss of biodiversity through an offset. The vision is that
biodiversity values are systematically accounted for alongside other
environmental, social and economic impacts – both positive and negative
– in the context of development projects, and that the option of a
biodiversity offset is considered as one possible management action to
achieve the goal of no net loss or preferably a net gain of biodiversity.”
“Risk management and assurance of outcomes: There has been little
societal debate and as yet limited societal agreement on the fundamental
issue of how the cost of managing risks of biodiversity loss from projects
should be shared among different stakeholders, including the risk that
biodiversity offsets fail to achieve no net loss of biodiversity. There are
many different perspectives on key questions such as whether and how
offset planners should use multipliers, time discounting, conservation
banks, adaptive management systems, and other means to account for
and insure against the uncertainty that offset goals will be achieved within
a defined time frame. As with all actions planned and taken by society
through its decision-making processes, the conservation outcomes from
biodiversity offsets can never be guaranteed with 100 percent certainty.
Even if an offset is designed using the best available science and
predictive models, unanticipated factors arising during the course of the
implementation of the development project and biodiversity offset might
hamper progress towards achieving no net loss of biodiversity. The BBOP
principles endorse an adaptive management approach to dealing with
deviations from expected results.“

61 February 2012
Session 6
Compensation and offsetting (cont.)
Facilitators‟ notes Media/activity/handout guidance
Slide 59: 2 minutes (cont.)
“Indigenous peoples‟ rights: The circumstances under which indigenous
peoples have the right to „free, prior and informed consent‟ (FPIC) are
addressed under instruments such as the 2007 UN Declaration on the
Rights of Indigenous Peoples. The scope of FPIC – and how it is
translated into national law and also applied voluntarily by businesses and
NGOs – is an emerging field that remains the subject of debate. BBOP
guidance and other publications are not intended to replace or duplicate
existing expertise or forums related to the FPIC issue.“
“Boundaries of acceptable impacts: The BBOP principles reflect
consensus that certain development impacts should be considered
inappropriate for biodiversity offsets due to considerations of the
irreplaceability or vulnerability of the biodiversity concerned. Perhaps most
obviously, the extinction of a species cannot be offset, and „no net loss‟
outcomes cannot be achieved for some other types of severe impact.
However, broadly accepted guidance has yet to be developed on how the
thresholds of impacts that can be offset should be determined and used in
practice.”
“Availability of land and marine areas for offsets: Although making an
offset does not always depend on a developer securing a new site,
locating a specific unmanaged or poorly managed area that can be
managed better to pursue conservation targets and objectives does
facilitate the offset process. A challenge facing developers in many
countries is the availability of land for offset activities over which they have
influence and for which there is clear land tenure.”
“Scientific uncertainty and data gaps: High quality data on components
of biodiversity and associated threats are important to the design of
biodiversity offsets. However, available biodiversity information is often
incomplete, or the scale of the information available too coarse. A
sustained public and private sector research commitment to address key
areas of scientific uncertainty and to fill data gaps will be essential to the
long-term success of biodiversity offsets as a conservation tool.”

62 February 2012
Session 6
Compensation and offsetting (cont.)
Facilitators‟ notes Media/activity/handout guidance
Slide 59: 2 minutes (cont.)
“Multiple definitions and methods regarding „no net loss‟ and lack of
a common currency for quantifying biodiversity loss and gain: More
than 100 different methodologies are currently used around the world to
quantify the loss and gain of species, natural habitats and ecosystem
services. Numerous laws and public policies explicitly promote or require
„no net loss‟ or „net gain‟, but rarely provide clarity on how the term should
be interpreted and applied in the field. From the variety of methodologies
available, no common currency has emerged as the most appropriate to
quantify and compare loss and gain of biodiversity. Different approaches
may be appropriate for determining no net loss in different settings. In
addition, the scope of biodiversity loss and gain to be quantified is often
unclear. Further piloting and analysis on various metrics in a range of
practical settings will be necessary to broaden the limited experience to
date and to formulate consistent guidance on methods for design and
implementation of biodiversity offsets in line with the BBOP principles. “
“Multiple benefit offsets: Biodiversity offsets are one of several voluntary
schemes and practices emerging in the field of payment for environmental
services that include carbon offsets and water offsets. Arguments for
designing offsets that can deliver multiple benefits for communities,
conservation and economies through the provision of livelihoods, the
preservation of important biodiversity and maintaining ecological
processes and services at a single site are compelling.”
“Capacity: For biodiversity offsets to be a norm of best environmental
practice at development sites, a greater capacity than is currently present
will be needed in government and civil society organisations to oversee,
support and approve well designed, sustainable offset activities. In
particular, environmental and social impact assessment (ESIAs)
processes are rarely designed to accommodate biodiversity offsets and
officials reviewing ESIAs are poorly informed about biodiversity offsets, if
they are aware of the concept at all.”

63 February 2012
Session 6
Compensation and offsetting (cont.)
Facilitators‟ notes Media/activity/handout guidance
Slide 60: 2 minutes
Source: BBOP, Principles on Biodiversity Offsets
http://bbop.forest-trends.org/guidelines/principles.pdf
Instructions:
Facilitator to talk though the challenges of offsetting, e.g.,
“We have defined what offsetting is and looked at the challenges of
environmental remediation in general, here we concentrate on the specific
issues associated with offsetting.”
Background: Quotes from BBOP
“Limits to what can be offset: There are situations where residual
impacts cannot be fully compensated for by a biodiversity offset
because of the irreplaceability or vulnerability of the biodiversity
affected.”
“Offsetting is widely debated and in some cases contested e.g. „licence to
trash‟ and reduction in local access to ecosystem services. This reinforces
the need for appropriate consultation and consent from government,
NGOs, communities and the private sector before offsets are planned.”
“Consensus and use of transparent, objective currencies for biodiversity
„area and quality of natural habitat‟ e.g. US Wetland Mitigation Banking
uses acres, BBOP uses „Habitat Hectares‟ approach.”
“Adherence to the principal of „Like-for-like-or-better‟ e.g. offsets must hold
same or very similar ecological characteristics to impact site.”
“Formal recognition of community rights to natural resources in the design
of biodiversity offsets. Incorporation of access rights to biodiversity offsets
for communities to participate in sustainable extractive and economic
activity.”
“Restoration offsets may fail to achieve „ecological equivalency‟ and
conservation offsets may not provide sufficient protection against
degradation. Offset design requires input and partnership with ecologists
and local experts along with a sufficient „buffer‟ against offset failure e.g. at
least 3 hectares „offset‟ for every hectare impacted.”

64 February 2012
Session 6
Compensation and offsetting (cont.)
Facilitators‟ notes Media/activity/handout guidance
Slides 61-63: 3 minutes
Source: WBCSD, Responding to the Biodiversity Challenge (2010),
http://www.wbcsd.org/Pages/EDocument/EDocumentDetails.aspx?ID=22&
NoSearchContextKey=true
Compensation case study – EDP
Instructions
Facilitator to walk through the EDP case study as an example of where
compensation has been used.
The issue
The environmental impact of invoicing
EDP – Energias de Portugal, an electrical utility company, distributes
around 34 million paper invoices per year in Portugal, a quantity that has
non-negligible environmental impacts. To mitigate these impacts, EDP has
first committed to reduce the number of invoices mailed out every month.
In 2007, it started to promote on-line invoice services, and by the end of
2009, more than 500.000 clients had joined the initiative. The company
was willing to go further and to compensate all the impacts resulting from
its paper invoicing process, through an innovative environmental
compensation methodology.
The response
Life Cycle Assessment methodology to assess impacts on
ecosystems
The approach, called “Zero Impact” has been developed at the Lisbon
school of engineering – Instituto Superior Técnico. It goes beyond the
offset of CO2 emissions in voluntary markets (already common worldwide),
as it aims to quantify and cover all negative environmental externalities of
the life cycle of paper invoices.
The software used for this Life Cycle Assessment (Sigma Pro 6.0)
accounts for the resources, energy and equipment used for generating
invoices (paper, plastic and printing process), as well as for invoices
delivery (fuel).
The compensation initiative consists mostly in agro-forestry good
practices, which are implemented in rural areas. The approach is as
follows:
1. Compensation of environmental impacts is carried out in the same
ecosystem service category and, whenever possible, in the same
location.
2. When not possible, compensation is carried out in another
ecosystem service category.
The compensation initiatives cover most of the impacts on ecosystem
services, as for example: water used for paper production, or soil
protection provided by the agro-forestry good practices implemented in the
vicinity of EDP‟s activities.
The remaining negative impacts not covered by the agro-forestry initiative
are compensated through the CO2 markets, representing approximately
1120 tons of CO2 credits

65 February 2012
Session 6
Compensation and offsetting (cont.)
Facilitators‟ notes Media/activity/handout guidance
Slides 61-63: 3 minutes (cont.)
The results
Ecosystem services approach at the basis of success
The methodology used has proved to have clear biodiversity conservation
results. Compensation activities included not only 9.800 m3/year of water
savings through irrigation process optimization, 585 ha of agriculture best
practice use, but also incorporated biodiversity conservation projects such
as soil nest protection (691 ha) or protection of riverbed vegetation (2,1
km). It also helped reinforce relations with stakeholders and in particular
local communities.
Its first implementation was a success and has led to its extension for
another 3 years, allowing EDP to evaluate the perspective of making this
approach a new business opportunity in the future by using biodiversity
market mechanisms.

66 February 2012
Session 6
Compensation and offsetting (cont.)
Facilitators‟ notes Media/activity/handout guidance
Slides 64-67: 20 minutes
Instructions
Total time for exercise: 20 minutes
Facilitator to split delegates into small groups of 4-5, asking them to move
seats to sit together.
Facilitator to explain the objectives of the exercise and run through the
materials provided.
Materials handouts of:
Context summary sheet
Description of different management options
Case study example: Extraction project in Africa
Instructions
Facilitator to explain the instructions to the group, highlighting that they
have 10 minutes to read the case study (handouts to be distributed) and
consider the following questions:
1. List services impacted in the case study
2. Pick from the management options available to you and give your
reasons for your choice
Each group will be asked to have one member give feedback on the
results of the discussion to the Facilitator and the wider group – 10
minutes.
Following the exercise the delegates should be referred to the BBOP web
site where some examples of „real‟ case studies are available
The Facilitator will be on hand throughout to help answer questions and
facilitate discussion. Slide 65 should be left on the projector throughout the
discussion.
61January 2012
Feedback...

67 February 2012
Session 7
Reporting and Indicators
Time guidelines Time
Reporting and indicators – presentation 20 mins
Session objective
Introduce the business case for internal and external reporting, through
examples.
Session overview
This session will familiarize the audience with the different examples that
cover indicators and reporting for biodiversity.
Session format
This session will be run by one course facilitator, who will talk through
key concepts and definitions with delegates.
Handouts
Participants course material desk pack – hardcopies will be laid out on
participant desks in advance of their arrival at the course. This pack
contains copies of all of the slides used throughout this course together
with relevant handout materials required for each session.
A glossary of terms used during the module will also be available in the
course material desk pack.

68 February 2012
Session 7
Reporting and Indicators (cont.)
Facilitators‟ notes Media/activity/handout guidance
Slide 68: <1 minute
Instructions
Facilitator to recap what has been covered in the module so far.
Slide 69: <1 minute
Instructions:
Facilitator to state the objective of the session, i.e., Introduce the business
case for internal and external reporting, through examples.
Session 7
Reporting and Indicators
Module 4: Managing and Mitigating Impacts

69 February 2012
Session 7
Reporting and Indicators (cont.)
Facilitators‟ notes Media/activity/handout guidance
Slide 70: 2 minutes
Source:
WBCSD, Guide to Corporate Ecosystem Valuation (long and detailed
presentation). Available from
:http://www.wbcsd.org/web/ecosystems/RTSummaries/PPT/WBCSD_CEV
_long_final.ppt
Instructions:
Facilitator to briefly explain other available frameworks to report and
measure biodiversity and ecosystem services
Background:
There are numerous monetary-based analytical approaches for corporate
decision-making. Accounting processes range from financial and
management accounting, which assess costs and benefits that have a
direct financial implication for a company‟s bottom line for external and
internal uses respectively, to full (environmental) cost accounting,
which recognizes all costs and benefits associated with an activity,
including economic, environmental, health and social costs.
In addition, numerous non-monetary decision-making approaches are also
adopted. Increasingly, the outputs of CEVs are being linked to these
approaches too. Examples include company reporting, which provides
annual financial and sustainability updates to shareholders.
Environmental Management Systems are internal frameworks designed
to manage a company‟s environmental impacts.
65January 2012
Additional reporting frameworks
Business analytical approaches: Monetary
Financial accounting
Management accounting
Full (environmental) cost accounting
Business analytical approaches: Sustainability non-monetary
Company reporting
Environmental management systems

70 February 2012
Session 7
Reporting and Indicators (cont.)
Facilitators‟ notes Media/activity/handout guidance
Slide 71: 2 minutes
Source: all information is publicly available
TEEB for Business Chapter 3
http://www.teebweb.org/LinkClick.aspx?fileticket=26aoFB8xrwU%3d&tabid
=1021&language=en-US
Instructions:
Facilitator will explain to the audience some common issues with
biodiversity reporting. The facilitator will then introduce the concept of
integrated reporting and full environmental cost accounting.
Background:
“Whilst few organisations in the public or private sectors report
comprehensively (or at all) on biodiversity and/or ecosystems in their
annual report and accounts, a few more do so in separate annual
sustainability or corporate responsibility reports. Here, unlike in financial
reporting, there are no mandated standards that all companies or
organisations must follow.
Increasingly, many stakeholders are exploring how to integrate financial
and non-financial information in a single report that provides a balanced
and meaningful picture of a company. Early examples from companies
such as Natura and Telefonica are based around providing annual reports
and CSR/sustainability reports as a single package.
Some companies produce these as paired documents and others as a
single volume. Alongside the pioneering efforts of individual companies,
other networks and standards bodies are also exploring how to promote
more integrated reporting. With respect to Biodiversity and ecosystem
services (BES), the challenges are based around how to manage and
track information within a company and how to ensure that the economic
values of BES are properly reflected at a level of detail that can influence
corporate financial analysis.”
Full (environmental) cost accounting:
An accounting approach that recognizes all costs and benefits associated
with an activity, including economic, environmental, health and social
costs. The assessment sometimes only includes internal costs and
benefits, but it can also include externality costs and benefits too (either
monetized or non-monetized).
NOTE: for a more in depth understanding of reporting and
management systems relating to ecosystem services, facilitators can
also refer to the latest publication from WRI on the topic: Nature in
Performance: Initial Recommendations for Integrating Ecosystem
Services into Business Performance Systems (2011).

71 February 2012
Session 7
Reporting and Indicators (cont.)
Facilitators‟ notes Media/activity/handout guidance
Slide 72: 2 minutes
Source: all information is publicly available and taken from
GRI portal, available from: http://www.globalreporting.org
Instructions
Facilitator will explain the Global Reporting Initiative (GRI) indicators and
the work done by GRI regarding new indicators. Also, facilitator will
introduce the work done by companies to link Net Positive Impacts and
impact indicators.
Background:
“The Global Reporting Initiative (GRI) is a network-based organization
that produces a comprehensive sustainability reporting framework that is
widely used around the world. GRI is committed to the Framework‟s
continuous improvement and application worldwide. GRI‟s core goals
include the mainstreaming of disclosure on environmental, social and
governance performance.”
“GRI's Reporting Framework is developed through a consensus-seeking,
multi-stakeholder process. Delegates are drawn from global business, civil
society, labor, academic and professional institutions.”
“The Sustainability Reporting Framework provides guidance on how
organizations can disclose their sustainability performance. It consists of
the Sustainability Reporting Guidelines, Sector Supplements and the
Technical Protocol – Applying the Report Content Principles.”
“The Framework is applicable to organizations of any size or type, from
any sector or geographic region, and has been used by thousands of
organizations worldwide as the basis for producing their sustainability
reports.”
NOTE: Facilitator to highlight the fact that the details of this
framework and the biodiversity/ecosystem indicators are contingent
on the release of the GRI G4 guidelines, currently in development.
67January 2012
Global Report Initiative (GRI)
GRI is a network-based organization that produces a comprehensive
sustainability reporting framework:
Widely used around the world.
Developed through a consensus-seeking, multi-stakeholder process.
Participants are drawn from global business, civil society, labour,
academic and professional institutions.
GRI‟s core goals include the mainstreaming of disclosure on
environmental, social and governance performance.

72 February 2012
Session 7
Reporting and Indicators (cont.)
Facilitators‟ notes Media/activity/handout guidance
Slide 73: 3 minutes
Source: all information is publicly available and taken from
GRI portal, available from: http://www.globalreporting.org
Instructions facilitator to introduce the sustainability reporting framework
and it‟s guidelines.
Background
“The Sustainability Reporting Framework provides guidance on how
organizations can disclose their sustainability performance. It consists of
the Sustainability Reporting Guidelines, Sector Supplements and the
Technical Protocol – Applying the Report Content Principles.”
“The Framework is applicable to organizations of any size or type, from
any sector or geographic region, and has been used by thousands of
organizations worldwide as the basis for producing their sustainability
reports.”
The Sustainability Reporting Guidelines
“The Guidelines are the foundation of the Framework and are now in their
third generation (G3). They feature Performance Indicators and
Management Disclosures that organizations can adopt voluntarily, flexibly
and incrementally, enabling them to be transparent about their
performance in key sustainability areas.”
“The G3.1 Guidelines are the latest and most complete version of GRI's
G3 Sustainability Reporting Guidelines. These Guidelines are based
on G3 but contain expanded guidance on local community impacts, human
rights and gender. While G3-based reports are still valid, GRI recommends
that reporters use G3.1, the most comprehensive reporting guidance
available today.”
GR3.1 Guidelines can be accessed at:
https://www.globalreporting.org/reporting/latest-guidelines/g3-1-
guidelines/Pages/default.aspx
Sector Supplements
“Sector Supplements are tailored versions of the Sustainability Reporting
Guidelines that cover sector specific issues.”
Sector supplements can be accessed at:
https://www.globalreporting.org/reporting/sector-
guidance/Pages/default.aspx
The Technical Protocol
“The Technical Protocol – Applying the Report Content Principles,
provides process guidance on how to define the content of a sustainability
report. It helps organizations to produce relevant reports more easily and
can be used with the G3.1, G3 Guidelines and with Sector Supplements.”
The Technical Protocol can be accessed at:
https://www.globalreporting.org/reporting/guidelines-
online/TechnicalProtocol/Pages/default.aspx
68January 2012
Global Report Initiative (GRI) (cont.)
The Sustainability Reporting Framework provides guidance on how
organizations can disclose their sustainability performance. It
consists of:
Sustainability Reporting Guidelines
Sector Supplements
Technical Protocol – Applying the Report Content Principles.
The Framework is applicable to organizations of any size or type,
from any sector or geographic region, and has been used by
thousands of organizations worldwide as the basis for producing
their sustainability reports.

73 February 2012
Session 7
Reporting and Indicators (cont.)
Facilitators‟ notes Media/activity/handout guidance
Slide 74: 2 minutes
Source: all information is publicly available
GRI portal. G3.1 Guidelines including Technical Protocol Final. Available
from: http://www.globalreporting.org
Instructions:
Facilitator to introduce the indicators available within the GRI framework
Background:
The section on sustainability Performance Indicators is organized by
economic, environmental, and social categories. Social Indicators are
further categorized by Labour, Human Rights, Society, and Product
Responsibility.
“Each category includes a Disclosure on Management Approach
(„Management Approach‟) and a corresponding set of Core and Additional
Performance Indicators.”
“Core Indicators have been developed through GRI‟s multi-stakeholder
processes, which are intended to identify generally applicable Indicators
and are assumed to be material for most organizations.”
“An organization should report on Core Indicators unless they are deemed
not material on the basis of the GRI Reporting Principles.”
“Additional Indicators represent emerging practice or address topics that
may be material for some organizations, but are not material for others.
Where final versions of Sector Supplements exist, the Indicators should be
treated as Core Indicators.”
[Interactive options: (2 minutes) delegates asked to think up and
shout out examples of performance indicators, and recording these
on a flip chart]
“Reporting on the Performance Indicators, the following guidance on data
compilation applies:
Reporting on Trends
Use of Protocols
Presentation of Data
Data aggregation
Metrics”
69January 2012
GRI indicators
There are six categories: environmental, human rights, labour
practices and decent work, society, product responsibility, and
economic.
They are formed of individual indicators, which can be:
Core Indicators (55 in total): indicators identified in the GRI Guidelines to
be of interest to most stakeholders and assumed to be material unless
deemed otherwise on the basis of the GRI Reporting Principles.
Additional Indicators (27 in total): those indicators identified in the GRI
Guidelines that represent emerging practice or address topics that may
be material to some but not generally for a majority.
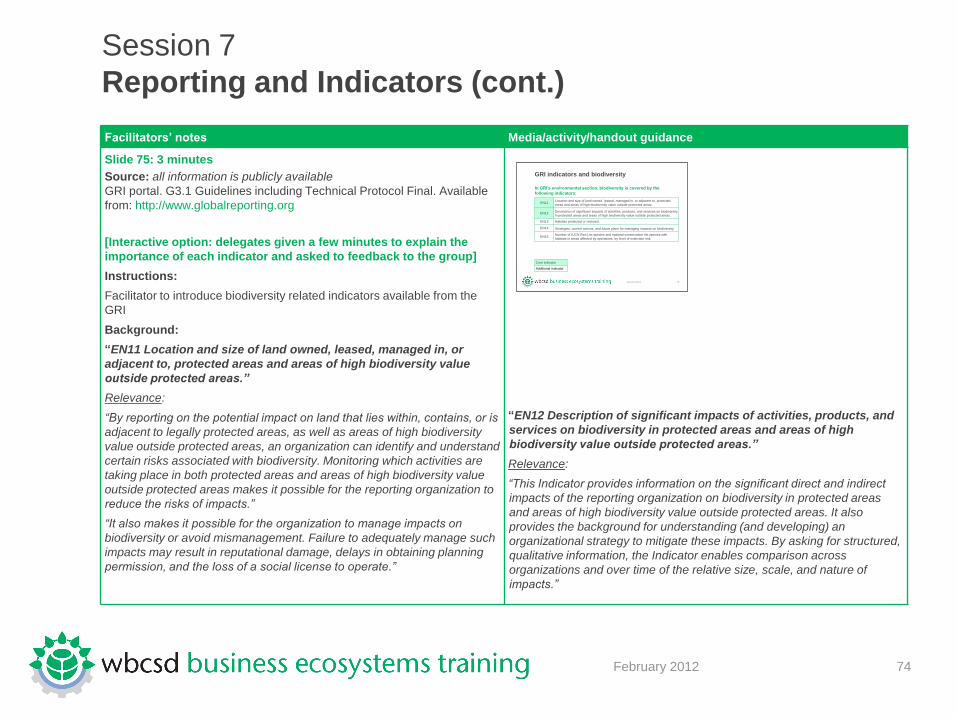
74 February 2012
Session 7
Reporting and Indicators (cont.)
Facilitators‟ notes Media/activity/handout guidance
Slide 75: 3 minutes
Source: all information is publicly available
GRI portal. G3.1 Guidelines including Technical Protocol Final. Available
from: http://www.globalreporting.org
[Interactive option: delegates given a few minutes to explain the
importance of each indicator and asked to feedback to the group]
Instructions:
Facilitator to introduce biodiversity related indicators available from the
GRI
Background:
“EN11 Location and size of land owned, leased, managed in, or
adjacent to, protected areas and areas of high biodiversity value
outside protected areas.”
Relevance:
“By reporting on the potential impact on land that lies within, contains, or is
adjacent to legally protected areas, as well as areas of high biodiversity
value outside protected areas, an organization can identify and understand
certain risks associated with biodiversity. Monitoring which activities are
taking place in both protected areas and areas of high biodiversity value
outside protected areas makes it possible for the reporting organization to
reduce the risks of impacts.”
“It also makes it possible for the organization to manage impacts on
biodiversity or avoid mismanagement. Failure to adequately manage such
impacts may result in reputational damage, delays in obtaining planning
permission, and the loss of a social license to operate.”
“EN12 Description of significant impacts of activities, products, and
services on biodiversity in protected areas and areas of high
biodiversity value outside protected areas.”
Relevance:
“This Indicator provides information on the significant direct and indirect
impacts of the reporting organization on biodiversity in protected areas
and areas of high biodiversity value outside protected areas. It also
provides the background for understanding (and developing) an
organizational strategy to mitigate these impacts. By asking for structured,
qualitative information, the Indicator enables comparison across
organizations and over time of the relative size, scale, and nature of
impacts.”
70January 2012
GRI indicators and biodiversity
In GRI‟s environmental section, biodiversity is covered by the
following indicators:
EN11Location and size of land owned, leased, managed in, or adjacent to, protected
areas and areas of high biodiversity value outside protected areas.
EN12Description of significant impacts of activities, products, and services on biodiversity
in protected areas and areas of high biodiversity value outside protected areas.
EN13 Habitats protected or restored.
EN14 Strategies, current actions, and future plans for managing impacts on biodiversity.
EN15Number of IUCN Red List species and national conservation list species with
habitats in areas affected by operations, by level of extinction risk.
Core indicator
Additional indicator

75 February 2012
Session 7
Reporting and Indicators (cont.)
Facilitators‟ notes Media/activity/handout guidance
Slide 75: 3 minutes (cont.)
EN13 Habitats protected or restored.
Relevance
“A biodiversity strategy contains a combination of elements related to the
prevention, management, and remediation of damage to natural habitats
resulting from the organization‟s activities. This Indicator measures the
implementation of a specific strategy for preventing or redressing negative
impacts associated with activities. Ensuring the integrity of natural habitats
can enhance the reputation of the organization, the stability of its
surrounding natural environment and resources, and its acceptance by
surrounding communities.”
EN14 Strategies, current actions, and future plans for managing
impacts on biodiversity.
Relevance
“Performance against biodiversity policies, objectives, and commitments
depends on having structured programs in place for managing impacts.
The presence and structure of programs is particularly important when
national regulations do not provide clear reference points for an
organization planning its biodiversity management.”
“Members of local communities often have unique knowledge of bio-
diverse areas and their value to local communities that is important for
managing impacts on biodiversity.”
“This Indicator enables both internal and external stakeholders to analyze
how well the reporting organization‟s strategies, current actions, and future
plans address potential impacts on biodiversity. The quality of the
organization‟s approach to managing impacts on biodiversity (as identified
in EN11 and EN12) will affect its exposure to risks such as reputational
damage, fines, or rejection of planning or operating permissions. Actions
to protect or restore habitats and species are of particular relevance.”
EN15 Number of IUCN Red List species and national conservation list
species with habitats in areas affected by operations, by level of
extinction risk.
Relevance
“This Indicator helps the reporting organization to identify where its
activities can pose a threat to endangered plant and animal species. By
identifying these threats, the organization can initiate appropriate steps to
avoid harm and to prevent the extinction of species. The IUCN Red List
and national conservation list species can serve as authorities on the
sensitivity of habitat in areas affected by operations, and on the relative
importance of these habitats from a management perspective.”
70January 2012
GRI indicators and biodiversity
In GRI‟s environmental section, biodiversity is covered by the
following indicators:
EN11Location and size of land owned, leased, managed in, or adjacent to, protected
areas and areas of high biodiversity value outside protected areas.
EN12Description of significant impacts of activities, products, and services on biodiversity
in protected areas and areas of high biodiversity value outside protected areas.
EN13 Habitats protected or restored.
EN14 Strategies, current actions, and future plans for managing impacts on biodiversity.
EN15Number of IUCN Red List species and national conservation list species with
habitats in areas affected by operations, by level of extinction risk.
Core indicator
Additional indicator

76 February 2012
Session 7
Reporting and Indicators (cont.)
Facilitators‟ notes Media/activity/handout guidance
Slide 76: 2 minutes
Source: all information is publicly available
TEEB for business .Chapter 3 , p 32 – example of Reporting by Rio Tinto,
http://www.teebweb.org/LinkClick.aspx?fileticket=26aoFB8xrwU%3d&tabid
=1021&language=en-US
Instructions
Facilitator to give an example of an organisation reporting on biodiversity
e.g. Rio Tinto.
Background
“Rio Tinto is a major international mining company with operations in more
than 50 countries, employing approximately 102,000 people.
In 2004, Rio Tinto launched its biodiversity strategy which includes the
over-arching goal to have a „net positive impact‟ (NPI) on biodiversity.
The company has developed practical tools and methodologies to assess
the biodiversity values of their land holdings and has commenced, in
association with its conservation partners, the application of offset
methodologies in Madagascar, Australia and North America.
In 2009, Rio Tinto completed a methodology for developing Biodiversity
Action Plans (BAPs) in collaboration with Fauna and Flora International
(FFI).
Rio Tinto reports on the biodiversity value of its sites, the amount of land in
proximity to biodiversity rich habitats, and the number of plant and animal
species of conservation significance within these land holdings. This
information is reported on their corporate website.”
71January 2012
Biodiversity reporting by Rio Tinto
Biodiversity values assessment
Developed the group-wide
biodiversity values assessment
protocol in 2007 to assess the
biodiversity values of Rio Tinto's
land holdings and surrounding
areas to help prioritise action.
Operations are ranked as having
either 'very high', 'high',
'moderate' or 'low' biodiversity
values.
Biodiversity values were
assessed on the basis of:
land in proximity to
biodiversity rich habitats
species of conservation
significance
additional site specific context
the external conservation
context
Biodiversity values assessment
(2010)
25%
17%
36%
21%Very high
High
Moderate
Low

77 February 2012
Session 7
Reporting and Indicators (cont.)
Facilitators‟ notes Media/activity/handout guidance
Slides 77-78: 2 minutes
Sources:
BAT managing biodiversity strategy:
http://www.bat.com/groupfs/sites/BAT_89HK76.nsf/vwPagesWebLive/DO
8D3ED7?opendocument&SKN=1
BAT Biodiversity Partnership: http://www.batbiodiversity.org/
Latest BAT Biodiversity Partnership progress report:
http://www.batbiodiversity.org/groupms/sites/BAT_8A7ED8.nsf/vwPages
WebLive/DO8A9FHA?opendocument&SKN=1
Goals for managing biodiversity:
http://www.bat.com/groupfs/sites/BAT_89HK76.nsf/vwPagesWebLive/DO
8D3EC9?opendocument&SKN=1
Instructions:
Facilitator to discuss British American Tobacco‟s biodiversity strategy,
highlighting specific targets, indicators and partnerships.
Background:
Since 2001, BAT have worked with Fauna & Flora International, the
Tropical Biology Association and the Earthwatch Institute, forming the
BAT Biodiversity Partnership. BAT funds projects that are focused on:
Reducing unsustainable use of forests for fuel and restoring
natural forests;
Enhancing freshwater ecosystems, through improved vegetation
cover and water management; and
Promoting agricultural practices that enhance soil health and
biodiversity.
The BAT Biodiversity Partnership produces annual progress reports,
separate from BAT‟s main sustainability report.

78 February 2012
Session 7
Reporting and Indicators (cont.)
Facilitators‟ notes Media/activity/handout guidance
Slides 77-78: 2 minutes (cont.)
GRI indicators:
Within their main sustainability report, BAT disclose information on all GRI
biodiversity indicators:
EN11: Location and size of land owned, leased, managed in, or
adjacent to, protected areas and areas of high biodiversity value
outside protected areas.
EN12: Description of significant impacts of activities. Products and
services on biodiversity in protected areas and areas of high
biodiversity vaue outside protected areas.
EN13: Habitats protected or restored.
EN14: Strategies, current actions, and future plans for managing
impacts on biodiversity.
EN15: Number of IUCN Red List species and national
convservation species with habitats in areas affected by
operations by level of extinction risk.
The facilitator can refer to BAT‟s latest sustainability report for details on
their reporting, available online at:
http://www.bat.com/groupfs/sites/bat_89hk76.nsf/vwPagesWebLive/DO7
QJMQZ/$FILE/medMD8FANND.pdf?openelement
Goals for managing biodiversity:
Review and revise our biodiversity risk and opportunity
assessment tool for use in our next round of assessments of
tobacco leaf growing operations by end 2011;
Use our biodiversity risk and opportunity assessments to help us
identify and, where necessary, mitigate possible biodiversity risks
associated with our leaf operations;
Continue to raise awareness of biodiversity issues through training
workshops, engagement with farmers and our leaf managers and
our online biodiversity learning module; and
Conduct research to verify the apparent return of wildlife to trial
areas of re-established natural forest in Sri Lanka by end 2013.

79 February 2012
Session 7
Reporting and Indicators (cont.)
Facilitators‟ notes Media/activity/handout guidance
Slides 79-81: 1 minute
Instructions
Facilitator to give definition of environmental management systems and
discuss the Holcim/IUCN biodiversity management system as an example.
Environmental management systems
A structured framework for managing an organization‟s significant
environmental impacts. It includes an assessment of a company‟s
activities, products, processes and services that might affect the
environment, and an environmental improvement program.
Source: WBCSD, Corporate Ecosystem Valuation, Additional Notes A,
Selected Ecosystem Valuation Concepts and Issues.
http://www.wbcsd.org/pages/adm/download.aspx?id=5923&objecttypeid=7
“In 2007, Holcim made the strategic choice to engage proactively with
IUCN on the theme of biodiversity to better understand the opportunities
and risks linked to biodiversity and ecosystem conservation. The
relationship has helped Holcim structure a corporate approach and
prioritize biodiversity related activities at site level over the full life cycle of
its operations. This engagement has resulted in an operational Biodiversity
Management System (BMS) that enables better management of
biodiversity in new projects and implements the appropriate corrective
actions in sites of varying sensitivity.
An important first step in the BMS is the establishment of a biodiversity risk
matrix followed by the introduction of measures appropriate for the risk
level encountered at each site (see table in presentation slide). The risk
level is determined first by the biodiversity importance (proximity to high
biodiversity value areas) and second by the potential direct impact level.
This methodology also takes into account the biodiversity value given by
relevant local stakeholders.”
“The matrix is used as part of three implementation steps in the BMS:
Stage 1. Know the potential impact – annual environmental
questionnaire collects (self reported) biodiversity information per site
used for risk mapping. Where risk or impacts are unknown, there is a
need to close knowledge gap.
Stage 2. Match the level of effort to risk – sensitive sites are required
to implement full Biodiversity Action Plans and monitor progress.
Collaboration with expert partners can assist sites to develop needed
biodiversity inventories, set appropriate targets, and determine
actions.”

80 February 2012
Session 7
Reporting and Indicators (cont.)
Facilitators‟ notes Media/activity/handout guidance
Slides 79-81: 1 minute (cont.)
“Stage 3. Monitor results to demonstrate progress towards targets –
At most sites, monitoring can be conducted by internal staff. For
sensitive sites, external expert monitoring can provide additional
credibility to the results. Biodiversity activities need to be integrated
into existing operations management processes, such as
rehabilitation planning and environmental management systems.
A full inventory of all 500+ extraction sites owned by Holcim in over 70
countries has been conducted and all sites are categorized on the risk
matrix. Top management has been informed of the sites which need
attention first and a global biodiversity target has been set in order to
monitor progress: by 2013, 80% of sensitive sites will have a biodiversity
action plan in place. Results and progress made will be published in
Holcim‟s sustainability report.
Holcim recognizes it lacks the capacity to adequately monitor and conduct
the required biodiversity assessments.
Therefore, Holcim will continue to work with external partners where
appropriate whilst building capacity internally. There is also an opportunity
to define smarter and more pragmatic performance indicators to measure
the long term impact on biodiversity.
The outputs of Environmental and Social Impact Assessments, walkover
surveys and more detailed biodiversity assessments have to serve as a
basis for the operational environmental management of each site and as
the point of departure for rehabilitation plans of the extraction sites. These
tasks will remain the responsibility of the local operations.”
Source: TEEB For Business Chapter 4, pp 8-9
http://www.teebweb.org/LinkClick.aspx?fileticket=tcneop1kys4%3d&tabid=
1021&language=en-US
72January 2012
Environmental Management Systems
A structured framework for managing an organization‟s significant
environmental impacts. It includes an assessment of a company‟s
activities, products, processes and services that might affect the
environment, and an environmental improvement program.
Example: Holcim/IUCN Biodiversity Management System (BMS)
73January 2012
Environmental Management Systems (cont.)
Biodiversity Risk Matrix used as part of three stage implementation of BMS:
Stage 1: Know the potential impact
Stage 2: Match the level of effort to risk
Stage 3: Monitor results to demonstrate progress towards targets

81 February 2012
Session 8: Policy Frameworks
Time guidelines
Session objective
To give delegates an overview of the current policy frameworks in place
and provide them with some examples and guidance on how they can
be engaged in the policy process.
Session overview
A presentation on the different regulatory frameworks in place and under
development.
Session format
This session will be run by one course facilitator, who will talk through
key concepts and definitions with participants.
Handouts
Participants course material desk pack – hardcopies will be laid out on
participant desks in advance of their arrival at the course. This pack
contains copies of all of the slides used throughout this course together
with relevant handout materials required for each session.
A glossary of terms used during the module will also be available in the
course material desk pack.
Time guidelines Time
Policy Frameworks 20 mins

82 February 2012
Session 8
Policy Frameworks
Facilitators‟ notes Media/activity/handout guidance
Session 7: Policy Frameworks
Total time: 20 minutes
This session will give delegates an overview of the responses that are
starting to emerge globally to address ecosystem decline and
environmental protection and the resulting policy frameworks
Slide 82: <1 min
Source: WBCSB CEV Helpdesk Call presentation (May 2011) (WBCSD
Members only:
http://www.wbcsd.org/Pages/EDocument/EDocumentDetails.aspx?ID=137
54&NoSearchContextKey=true)
NOTE: The Facilitator should vary discussion depending on
audience, and consider adding examples with specific
country/industry relevance to the audience.
Session 8
Policy Frameworks
Module 4: Managing and Mitigating Impacts

83 February 2012
Session 8
Policy Frameworks (cont.)
Facilitators‟ notes Media/activity/handout guidance
Slides 83-85: 3 minutes
Instructions
Facilitator to talk through some of the current legislation that is relevant to
biodiversity and ecosystems
Source: European Commission http://ec.europa.eu
In the EU
Water Framework Directive: commits the European Member States
to a qualitative and quantitative improvement of bodies of water. This
includes marine waters up to 1 nautical mile offshore. This directive
has resulted in the publishing of many important documents, such as
the River Basin Management Plan.
Marine Strategy Framework Directive: intended to enforce the
protection of the European marine environment to ensure that it is
healthy, productive and safeguarded for the use of future
generations. It outlines an ecosystems-based approach for managing
human activities, supporting the sustainable use of marine goods and
services. It binds member states to develop marine strategies for
their waters.
Environmental Liability Directive: this was put into force in 2009,
and converts non-legislative policies such as the Pollution Prevention
Guidelines into stricter compliance laws, where the failure to meet
requirements results in heavy fines. This is representative of a
„polluter pays‟ principle, and covers contamination of land and water
that puts human or environmental health at risk.
79January 2012
Current Biodiversity/Ecosystem Services
Legislations
In the EU:
Water Framework Directive
Marine Strategy Framework
Environmental Liability Directive
In the US:
The Lacey Act
Endangered Species Act
Customize: company to add any legislation that impacts their
business in particular
81January 2012
Current Biodiversity/Ecosystem Services
Legislations (cont.)
In South Africa
Example: South Africa Water Law, 1996.
Water viewed as a common resource, policy review aimed at
redistributing resources to maximize equality and fairness.
Revoked inequitable private ownership, appointing the National
Government as custodian of water resources.
Minimum requirements for drinking water and ecosystem functioning set
aside in the reserve, which has free access.
Customize: company to add any legislation that impacts their
business in particular
80January 2012
Current Biodiversity/Ecosystem Services
Legislations (cont.)
China
The Chinese Government has made water a major priority
The 12th Five-Year Plan includes a range of targets and policies to
improve water supply
Growth in number of municipal waste water treatment plants increasing
from 18% between 2005 – 2009 to 32% between 2009 to 2012, with
5‟200 plants built every year
Customize: company to add any legislation that impacts their
business in particular
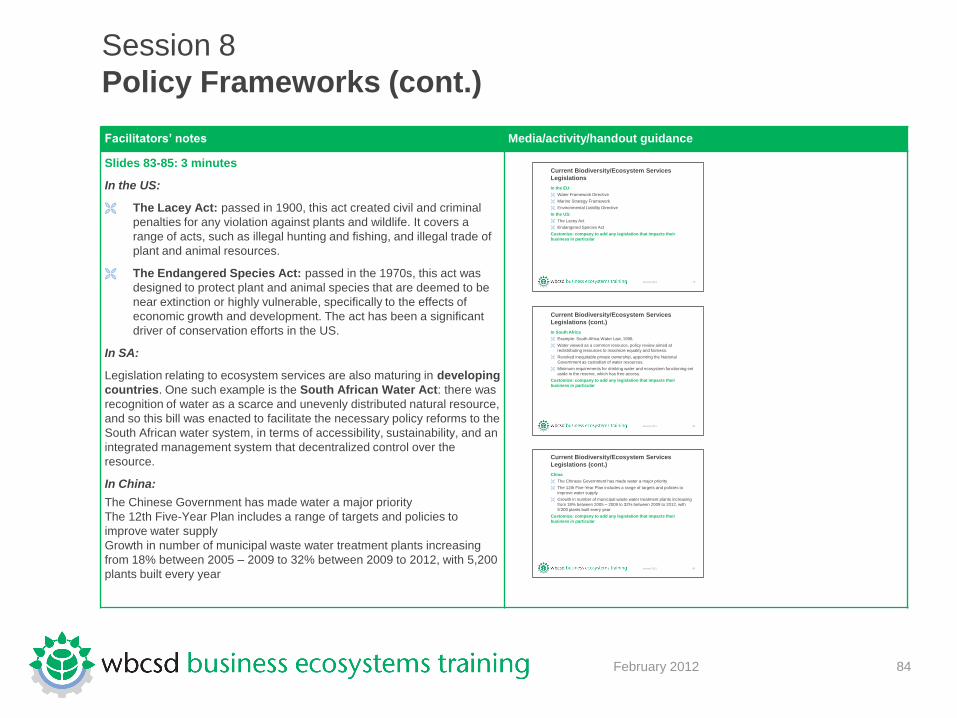
84 February 2012
Session 8
Policy Frameworks (cont.)
Facilitators‟ notes Media/activity/handout guidance
Slides 83-85: 3 minutes
In the US:
The Lacey Act: passed in 1900, this act created civil and criminal
penalties for any violation against plants and wildlife. It covers a
range of acts, such as illegal hunting and fishing, and illegal trade of
plant and animal resources.
The Endangered Species Act: passed in the 1970s, this act was
designed to protect plant and animal species that are deemed to be
near extinction or highly vulnerable, specifically to the effects of
economic growth and development. The act has been a significant
driver of conservation efforts in the US.
In SA:
Legislation relating to ecosystem services are also maturing in developing
countries. One such example is the South African Water Act: there was
recognition of water as a scarce and unevenly distributed natural resource,
and so this bill was enacted to facilitate the necessary policy reforms to the
South African water system, in terms of accessibility, sustainability, and an
integrated management system that decentralized control over the
resource.
In China:
The Chinese Government has made water a major priority
The 12th Five-Year Plan includes a range of targets and policies to
improve water supply
Growth in number of municipal waste water treatment plants increasing
from 18% between 2005 – 2009 to 32% between 2009 to 2012, with 5,200
plants built every year
79January 2012
Current Biodiversity/Ecosystem Services
Legislations
In the EU:
Water Framework Directive
Marine Strategy Framework
Environmental Liability Directive
In the US:
The Lacey Act
Endangered Species Act
Customize: company to add any legislation that impacts their
business in particular
81January 2012
Current Biodiversity/Ecosystem Services
Legislations (cont.)
In South Africa
Example: South Africa Water Law, 1996.
Water viewed as a common resource, policy review aimed at
redistributing resources to maximize equality and fairness.
Revoked inequitable private ownership, appointing the National
Government as custodian of water resources.
Minimum requirements for drinking water and ecosystem functioning set
aside in the reserve, which has free access.
Customize: company to add any legislation that impacts their
business in particular
80January 2012
Current Biodiversity/Ecosystem Services
Legislations (cont.)
China
The Chinese Government has made water a major priority
The 12th Five-Year Plan includes a range of targets and policies to
improve water supply
Growth in number of municipal waste water treatment plants increasing
from 18% between 2005 – 2009 to 32% between 2009 to 2012, with
5‟200 plants built every year
Customize: company to add any legislation that impacts their
business in particular

85 February 2012
Session 8
Policy Frameworks (cont.)
Facilitators‟ notes Media/activity/handout guidance
Slide 86: 3 minutes
Source: UN REDD Programme http://www.un-redd.org/
Instructions:
Facilitator to talk through the slide:
Background:
“REDD was launched by the United Nations Framework Convention
on Climate Change (UNFCCC) in 2007 at Bali (COP-13), with an
initial focus on deforestation and degradation, but at Cancun 2010
was updated to the REDD+, to include: forest conservation,
sustainable forest management and enforcement of forests as
carbon stocks.
The long term vision of REDD/REDD+ is to develop to incorporate
agriculture, forest and other land use (AFOLU) measures.
As a significant proportion of the world‟s forests are located in
developing countries, where governments and industries cannot
necessarily afford to protect them, the mechanism works to transfer
funds into these countries to split the burden between developing
and developed countries. Developing countries participate by
engaging in projects that contribute to reducing emissions (from
deforestation, degradation etc...) and developed countries participate
by reimbursing developing countries for these efforts.”
There are parallels between REDD and offsetting covered earlier in this
module.
“Deforestation and forest degradation, through agricultural
expansion, conversion to pastureland, infrastructure development,
destructive logging, fires etc., account for nearly 20% of global
greenhouse gas emissions, more than the entire global
transportation sector and second only to the energy sector.” (Source:
UN REDD Programme : http://www.un-
redd.org/AboutREDD/tabid/582/Default.aspx).
“This demonstrates the intimate connection between
biodiversity/ecosystem services and emissions/climate change, i.e.
saving forested areas to reduce carbon emissions can be beneficial
for biodiversity conservation, although this will be dependent on the
forest ecosystem under consideration.”

86 February 2012
Session 8
Policy Frameworks (cont.)
Facilitators‟ notes Media/activity/handout guidance
Slide 86: 3 minutes (cont.)
Source: UN REDD Programme http://www.un-redd.org/
“The programme started with 9 initial pilot countries, but now has 36
partner countries spanning Africa, Asia-Pacific and Latin America, of
which 13 are receiving support to National Programme activities.
These 13 countries are: Bolivia, Cambodia, Democratic Republic
of the Congo (DRC), Ecuador, Indonesia, Panama, Papua New
Guinea, Paraguay, the Philippines, Solomon Islands, Tanzania,
Viet Nam and Zambia. To-date, the UN-REDD Programme‟s Policy
Board has approved a total of US$55.4 million for its nine initial pilot
countries and four new countries (Cambodia, Ecuador, the
Philippines and Solomon Islands).”
Donor countries
“Norway continues to be the UN-REDD Programme‟s first and
largest donor. Since the Programme was launched in September
2008, Norway has committed US$52.2 million for 2008-2009, US$31
million for 2010, and at least US$40 million for 2011-2012. Denmark
became the second donor country to join the UN-REDD Programme,
committing US$2 million in June 2009 and another US$6 million in
November 2010.”
“At the end of 2009, Spain announced its pledge of US$20.2 million
to the UN-REDD Programme over a period of three years, and
confirmed US$1.4 million for 2010. In March 2011, Japan made its
first funding commitment to the Programme of US$3 million for the
UN-REDD Global Programme and the European Commission
pledged approximately US$14 million (€10 million).”

87 February 2012
Session 8
Policy Frameworks (cont.)
Facilitators‟ notes Media/activity/handout guidance
Slide 87: 3 minutes
REDD – challenges and uncertainties
Source: REDD Monitor http://www.redd-monitor.org/
Instructions:
Facilitator to walk through each of the points on the slide
Background:
“The issues associated with reducing emissions from deforestation
were acknowledged in the Kyoto Protocol negotiations:
Leakage refers to the fact that while deforestation might be
avoided in one place, the forest destroyers might move to
another area of forest or to a different country.
Additionality refers to the [difficulty] of predicting what might
have happened in the absence of the REDD project.
Permanence refers to the fact that carbon stored in trees is
only temporarily stored. All trees eventually die and release
the carbon back to the atmosphere.
Measurement refers to the fact that accurately measuring the
amount of carbon stored in forests and forest soils is
extremely complex – and prone to large errors.”

88 February 2012
Session 8
Policy Frameworks (cont.)
Facilitators‟ notes Media/activity/handout guidance
Slide 87: 3 minutes (cont.)
Source: REDD Monitor http://www.redd-monitor.org/
[Interactive option – the issues listed below could be posed as
questions to the group and used within a discussion]
A number of issues are yet to be resolved:
“The financing mechanism
Will countries and private firms be able to buy/sell offsets?
Will the credits from these transactions be able to feed into a larger
global carbon market?
Will private firms be able to undertake their own conservation
projects and sell the accumulated credits?
How would these REDD credits differ from regular carbon credits in
terms of pricing and transferability?
What will be the process for determining how projects are classified
under REDD/REDD+ systems?”
“Reference levels and measurements
Will countries with lower historical emissions from deforestation and
degradation be able to access the same benefits?
How will varying levels of forest cover effect the process?
What if conservation of forests represents different opportunity cost
values in different regions, e.g. only timber in one region, but timber
and oil in another?
Will offsets through REDD contribute to donor countries‟ national
emissions targets? (it is largely accepted that such offsets should not
be includable in national emissions measurements)”
“Distribution of benefits
How will the interests of local and indigenous peoples be represented
and protected?
How will the intrinsic value of forested areas be accounted for?
Will other ecosystem services and environmental benefits be
accounted for in pricing, e.g. the benefits of biodiversity?”

89 February 2012
Session 8
Policy Frameworks (cont.)
Facilitators‟ notes Media/activity/handout guidance
Slides 88-90: 2 minutes
Source: WBCSD, CEV Helpdesk Call presentation (May 2011) (WBCSD
Members only:
http://www.wbcsd.org/Pages/EDocument/EDocumentDetails.aspx?ID=137
54&NoSearchContextKey=true)
Instructions:
Facilitator to talk through CBD COP 10.
Slide 84: please refer to the facilitator‟s notes from Module 3 Session 3
“Introduction to policy trends”.
Background:
A number of different decisions were made during the 10th Conference of the Parties to the Convention on Biological Diversity in Nagoya during 2010
Facilitator to highlight the following points:
The agreement of a 2011-2020 strategic plan:
The protocol on Access and Benefit Sharing was agreed and is now
open for signing until Feb 2012 – facilitator to remark that this will be
covered further in the next slide
Resource mobilisation: Government aid versus „innovative financing
mechanisms‟
The encouragement of Sustainable use and links to biodiversity,
development, and poverty alleviation
Protected areas: tough targets as seen in the slide – facilitator to
read out target 5 and 11

90 February 2012
Session 8
Policy Frameworks (cont.)
Facilitators‟ notes Media/activity/handout guidance
Slide 91: 2 minutes
Source:
WBCSD, Effective biodiversity and ecosystem policy and regulation
(2010),
http://www.wbcsd.org/Pages/EDocument/EDocumentDetails.aspx?ID=21&
NoSearchContextKey=true
Instructions
Facilitator to walk through the Convention on Biological Diversity (CBD)
principles and highlight Access and Benefits Sharing
Background:
The three key objectives of the Convention on Biological Diversity
(CBD) are: The conservation of biological diversity; the sustainable
use of the components of biological diversity; and the fair and
equitable sharing of the benefits arising from the utilization of
genetic resources
The third principle of fair and equitable sharing of benefits has the
most immediate social implications. The 2011-2020 plan sets out the
5 strategic goals (introduced in session 3):
A. Address the underlying causes of biodiversity loss by
mainstreaming biodiversity across government and society.
B. Reduce the direct pressures on biodiversity and promote
sustainable use.
C. Improve the status of biodiversity by safeguarding ecosystems,
species and genetic diversity
D. Enhance the benefits to all from biodiversity and ecosystem
services.
E. Enhance implementation through participatory planning,
knowledge management and capacity building.
Goals D and E both refer to access and benefit sharing. Goal D
represents the importance of fair and equitable access to benefits,
where as E refers more specifically to the benefits of engaging with
local and traditional people, not only for preservation of cultures but
also for the importance of local knowledge.
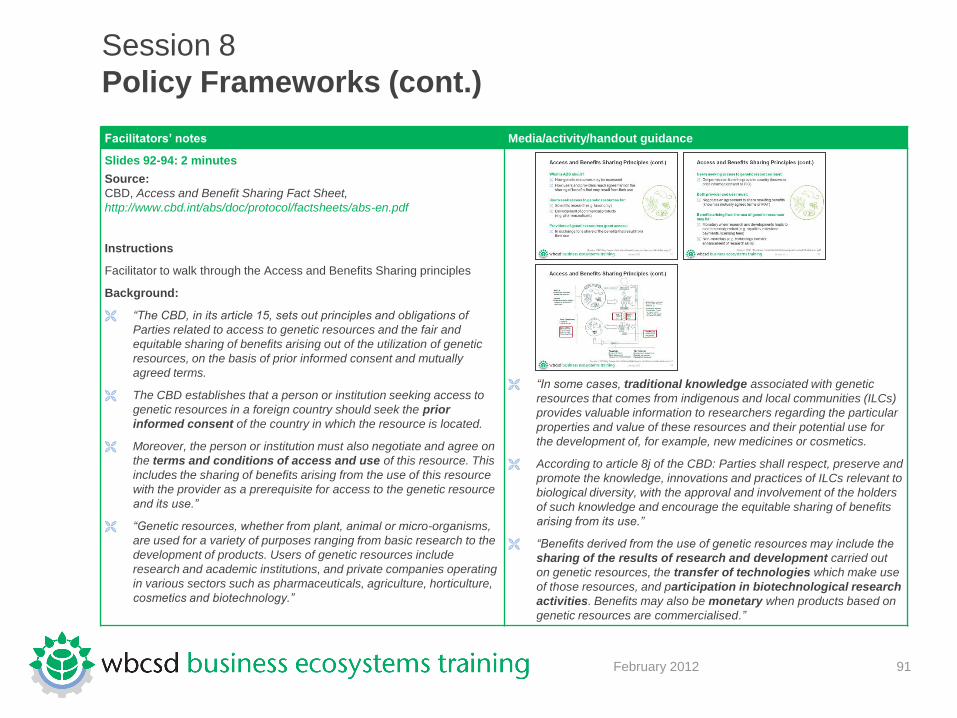
91 February 2012
Session 8
Policy Frameworks (cont.)
Facilitators‟ notes Media/activity/handout guidance
Slides 92-94: 2 minutes
Source:
CBD, Access and Benefit Sharing Fact Sheet,
http://www.cbd.int/abs/doc/protocol/factsheets/abs-en.pdf
Instructions
Facilitator to walk through the Access and Benefits Sharing principles
Background:
“The CBD, in its article 15, sets out principles and obligations of
Parties related to access to genetic resources and the fair and
equitable sharing of benefits arising out of the utilization of genetic
resources, on the basis of prior informed consent and mutually
agreed terms.
The CBD establishes that a person or institution seeking access to
genetic resources in a foreign country should seek the prior
informed consent of the country in which the resource is located.
Moreover, the person or institution must also negotiate and agree on
the terms and conditions of access and use of this resource. This
includes the sharing of benefits arising from the use of this resource
with the provider as a prerequisite for access to the genetic resource
and its use.”
“Genetic resources, whether from plant, animal or micro-organisms,
are used for a variety of purposes ranging from basic research to the
development of products. Users of genetic resources include
research and academic institutions, and private companies operating
in various sectors such as pharmaceuticals, agriculture, horticulture,
cosmetics and biotechnology.”
“In some cases, traditional knowledge associated with genetic
resources that comes from indigenous and local communities (ILCs)
provides valuable information to researchers regarding the particular
properties and value of these resources and their potential use for
the development of, for example, new medicines or cosmetics.
According to article 8j of the CBD: Parties shall respect, preserve and
promote the knowledge, innovations and practices of ILCs relevant to
biological diversity, with the approval and involvement of the holders
of such knowledge and encourage the equitable sharing of benefits
arising from its use.”
“Benefits derived from the use of genetic resources may include the
sharing of the results of research and development carried out
on genetic resources, the transfer of technologies which make use
of those resources, and participation in biotechnological research
activities. Benefits may also be monetary when products based on
genetic resources are commercialised.”

92 February 2012
Session 8
Policy Frameworks (cont.)
Facilitators‟ notes Media/activity/handout guidance
Slides 92-94: 2 minutes
Source:
CBD, Access and Benefit Sharing Fact Sheet,
http://www.cbd.int/abs/doc/protocol/factsheets/abs-en.pdf
Instructions
Facilitator to walk through the Access and Benefits Sharing principles
Background:
Example of use
“The development of compounds called Calanolides, derived from
the latex of a tree (Calophyllum species) found in the Malaysian
rainforest, as a potential treatment for HIV (type 1) and certain types
of cancer.”
Example of benefit sharing:
“Payment of royalties: royalties generated from the commercialization
of a product based on genetic resources are shared between the
provider and the user of genetic resources and associated traditional
knowledge.
Preferential access for the provider country to any medicine derived
from genetic resources and associated traditional knowledge:
preferential rates to purchase medicine.”

93 February 2012
Session 8
Policy Frameworks (cont.)
Facilitators‟ notes Media/activity/handout guidance
Slides 95-98: 4 minutes
Access and benefits sharing: Case study – Natura
Sources: WBCSD, Responding to the Biodiversity Challenge (2010),
http://www.wbcsd.org/Pages/EDocument/EDocumentDetails.aspx?ID=22&
NoSearchContextKey=true
Instructions:
Facilitator to walk through the case study example
Background:
The issue
Sustainability as a business platform
Natura is a Brazilian cosmetic, fragrance and personal hygiene products
company that has adopted the sustainable use of Brazilian biodiversity as
a business platform since 2000, combining scientific research and the
wisdom of traditional communities. The communities‟ traditional knowledge
is leveraged to develop technologies and cosmetic solutions that allow
creation of products with differentiated qualities for the consumer, while
resulting in socio-environmental gains through partnerships with
communities.
The greatest expression of the sustainable use of Brazilian biodiversity is
the cosmetic line Natura Ekos, consisting of around 100 products.
The response
Respecting the criteria of the Convention on Biological Diversity
When developing new products, Natura Ekos establishes partnerships
with indigenous communities to source raw materials to be used in the
brand‟s product. To underpin this relationship, it adopts the principles of
the Convention on Biological Diversity, seeking to promote fair trade,
sustainable use, social development and biodiversity conservation.
Natura has developed partnerships with 26 communities, who, in return for
providing access to the natural ingredients and their traditional knowledge,
receive direct payments and benefits from other investments made by
Natura in local development.

94 February 2012
Session 8
Policy Frameworks (cont.)
Facilitators‟ notes Media/activity/handout guidance
Slides 95-98: 4 minutes (cont.)
The results
A „win-win‟ partnership
Natura Ekos is a business model that creates a virtuous cycle,
generating wealth for all, whilst returning value to the place of origin:
The community benefits from Natura‟s activities because the
partnership generates income for families;
Natura benefits from its business platform because it generates
higher revenues through products with greater appeal to consumers;
Consumers benefit from Natura‟s initiative because they are
proposed products with high quality natural ingredients; and Nature
benefits from Natura‟s activities because the community takes care
of its forests to ensure a better quality of life for itself and for future
generations.
The example of Maracatu project
Depending on time, facilitator may discuss this product as an
example of how Natura have integrated the principles into their
product development.
In March 2010, Natura launched a new toilet soap line under the Ekos
brand, which includes in its formula from 20% to 50% of pure oils extracted
from Brazilian fruits, such as cupuaçu, cacao, passion fruit and murumuru.
Named the Maracatu Project, it marked the expansion of Natura‟s
proposal for the sustainable use of Brazilian biodiversity as a technological
platform.
Sustainable use of the product to preserve biodiversity and promote
social inclusion
Natura‟s project raised awareness of the value of this species through its
stewardship by the communities and, consequently, the potential for
generating income by the families through the harvesting of murumuru.
Through this model, Natura supported the development of a supply chain
that encompasses everything from forest-mapping for identifying the
species, to socio-economic and cultural evaluation, as well as the training
of communities.
This process generated work, promoted social inclusion in a region that
faces many social challenges, and helped keep the forest standing strong.
Natura estimates that the project provided the preservation of
approximately 3,000 trees. From a business perspective, the project
allowed Natura to innovate, using an original natural ingredient, while
securing its future ingredients supply.

95 February 2012
Session 8
Policy Frameworks (cont.)
Facilitators‟ notes Media/activity/handout guidance
Slide 99: 2 minutes
Graphic source: WBCSD , Collaboration, innovation, transformation.
Ideas and inspiration to accelerate sustainable growth – A value chain
approach, (2012) http://www.wbcsd.org/work-program/systems-
solutions/sustainable-consumption-and-value-chain.aspx
Sustainable Procurement Policies
Instructions:
Facilitator to recap the concepts of sustainable supply and value chains
(introduced in module 2) in order to have a more in depth description of
sustainable procurement policies and initiatives.
Background:
Value chains are an integral part of strategic planning for many
businesses today. A value chain refers to the full life cycle of a product or
process, including material sourcing, production, consumption and
disposal/recycling processes
Sustainability is a means of securing the future of the planet. In
conditions of heightened competition and economic instability, businesses
that develop more sustainable value chains can gain a competitive edge,
augmenting the bottom line, while increasing productivity and growth
A sustainable value chain approach enables both business and society to
better understand the environmental challenges associated with the life
cycle of products and services.
Sustainable procurement
In what is often described as “sustainable procurement”, organizations are
looking beyond price, quality, availability and functionality to consider other
factors in their procurement decisions including environmental (the effects
that the products and/or services have on the environment) and social
aspects (labor conditions, indigenous peoples‟ and workers‟ rights, etc.)
(Environmentally and Socially Responsible Procurement Working Group,
2007).
Sustainable procurement can help maintain a company‟s social license to
operate (Kemp, 2001). It can help reduce reputation risks and, ultimately,
help secure sustainable supplies (Kennard, 2006). Sustainable
procurement can also be used to align companies with their stakeholders‟
values and make organizations along the supply chain (from forest owners
and producers to retailers) more resilient to changing business conditions.
Source: WBCSD, Sustainable Procurement of Wood and Paper-Based
Products, http://www.sustainableforestprods.org/node/4
92January 2012
Sustainable Procurement Policies
Recap basic concepts:
Value chains and sustainability
6 factors in developing a
sustainable value chain
Sustainable procurement
Material extraction
Material processing
Manufacturing
Retail
Use
Disposal & Recycling
Logistics
Source: WBCSD (forthcoming), Sustainable Consumption & Value Chain Project

96 February 2012
Session 8
Policy Frameworks (cont.)
Facilitators‟ notes Media/activity/handout guidance
Slide 100: 2 minutes
Source: Unilever website, http://www.sustainable-living.unilever.com/our-
approach/sustainable-sourcing/
Instructions:
Facilitator to walk through some examples of sustainable procurement
policies
Background:
Unilever
“Today we source 10% of our agricultural raw materials sustainably. By
2012 we will source 30%; by 2015 50%; and by 2020 100%.”
Their metric
“Raw or packaging material sourced from verifiable sustainable renewable
sources or made from recycled materials (% by weight).”
Working with suppliers
“Half our raw materials come from farms and forests. For us, sustainable
sourcing means meeting the needs of people today without compromising
the ability of future generations to meet their needs. In practice this means
working closely with our suppliers to help them improve their farming
practices and minimise their environmental impacts.”
Best practice
“In 1998 we established our Sustainable Agriculture Programme. With the
help of an external advisory board and expert agronomists, we developed
the Unilever Sustainable Agriculture Code (the Code) – a detailed
guideline for agricultural best practice. The Code is based on the following
11 indicators:”
“Soil health; soil loss; nutrients; pest management; biodiversity; farm
economics; energy; water; social and human capital; local economy; and
animal welfare.
Measuring sustainable sourcing and tracking progress
Certification: there are certain bodies such as Fairtrade, the Rainforest
Alliance and the Forest Stewardship Council, whose certification schemes
match the principles and practices of the Code. We count suppliers
certified by one of these standards as a „sustainable source‟.
Self-verification: not all the raw materials in all the geographies from
which we source are covered by such organisations. We therefore
supplement our certified partnerships with a system based on self-
verification. Using our software tool, suppliers carry out self-assessments
against the Code. The tool helps identify areas of best practice and areas
for improvement. It also provides a basis for us to work with the supplier to
create a plan for continuous improvement. Any sources that are self-
verified are audited by a third party, whose process is endorsed by an
independent external advisory board.”

97 February 2012
Session 8
Policy Frameworks (cont.)
Facilitators‟ notes Media/activity/handout guidance
Slide 100: 2 minutes
Source:
WBCSD, Collaboration, innovation, transformation. Ideas and inspiration
to accelerate sustainable growth – A value chain approach, (2012)
http://www.wbcsd.org/work-program/systems-solutions/sustainable-
consumption-and-value-chain.aspx
Sompo Japan
This case study shows how a service company created and spread a
green procurement online system through its value chain. The new system
is not only reducing the insurance sector‟s environmental impact and
promoting its stakeholders‟ environmental consciousness, but also helping
Sompo Japan differentiate itself in the market due to its sustainability
initiatives.
Green procurement has been prevailing among large companies in Japan,
but, as yet, not among medium and small sized companies, especially in
local areas. Sompo Japan, which had been tackling green procurement
since 1997, decided to disseminate it amongst insurance agencies, which
are a core part of its value chain, and indirectly to 5.9 million corporate and
individual customers across the country.
With the help of the Green Purchasing Network (an extra-governmental
organization with more than 2,900 corporations and local governments in
Japan), and the cooperation of its office supplies service provider, Sompo
Japan developed an online and centralized green purchasing system,
offering eco-friendly stationary products for its nationwide agency
organizations, the AIR. This consisted mainly of automobile shops, and the
J-SA, an organization of professional insurance agencies.
A communication campaign was launched, not only to disseminate
knowledge of the system and provide agencies with sensitization
messages about purchasing more eco-friendly products, but also to advise
on the sustainable use and disposal of these products. Also, Sompo Japan
made tools such as comics, to encourage agencies in an easily
understood manner.
In less than three years, the voluntary procurement system has been
adopted by about 70% of AIR and J-SA agencies, i.e. about 4,000 entities.
Sompo Japan is actively working to increase this number, and to ensure a
more frequent use of the platform.
The benefit for the agencies has been twofold. Through the use of eco-
friendly stationary products and bulk discounts offered, agencies have
been able to reduce their environmental footprint and costs. Increasing
purchasing amounts leads to further profits for the stationary sales
company offering eco-friendly products.
This initiative has also helped to differentiate Sompo Japan from other
insurance companies, and to strengthen the link between the company
and its agencies.

98 February 2012
Session 8
Policy Frameworks (cont.)
Facilitators‟ notes Media/activity/handout guidance
Slide 101: 2 minutes
Source: WBCSD, Sustainable Procurement of Wood and Paper-Based
Products (2011), http://www.sustainableforestprods.org/node/4
Examples of sustainable procurement guides and advice
Instructions:
Facilitator to refer to the slide and discuss the 10 key issues surrounding
sustainable procurement for wood and paper.
Background:
Sustainable Procurement Guide for Wood and Paper-Based Products
This guide focuses on 10 key issues, formulated as essential questions,
central to the sustainable procurement of wood and paper-based products.
Wood and paper-based products can be an environmentally and socially
sound purchasing option.
The essence of sustainable procurement is to select these products with
acceptable and even beneficial environmental and social impacts. While
sustainable procurement is an investment in a better world, it is also an
investment in a better bottom line.
Good environmental claims that accurately convey the environmental
attributes of products help consumers to make informed choices.
Misleading, false, meaningless or unclear information can result in
consumers losing confidence in environmental claims and labels in
general, lead to unfair business competition and discourage companies
from making truthful claims. So this guidance aims to:
Support business in making robust environmental claims;
Give firms confidence that their claims meet good practice standards
in the domestic market, Europe and internationally;
Improve the standard of environmental claims found in the domestic
market; and
Reduce unfair competition by minimising claims that may be unfair or
misleading.
Other procurement examples: Environmentally Preferable
Purchasing (EPP) Source: EPA., http://www.epa.gov/epp/
Environmentally Preferable Purchasing (EPP) helps the federal
government "buy green," and in doing so, uses the federal government's
enormous buying power to stimulate market demand for green products
and services. Geared first to help federal purchasers, this site can help
green vendors, businesses large and small – and consumers. Use the
easy index to:
Find and evaluate information about green products and services;
Identify federal green buying requirements;
Calculate the costs and benefits of purchasing choices;
Manage green purchasing processes.

99 February 2012
Session 8
Policy Frameworks (cont.)
Facilitators‟ notes Media/activity/handout guidance
Slides 102-103: 1 minute
Instructions:
Facilitator to describe the EU Green Public Procurement instrument, and
discuss how individual member states are implementing or developing
plans.
Presenter may wish to discuss alternative country or policy. Links
and details of all EU member state initiatives can be found at:
http://ec.europa.eu/environment/gpp/pdf/national_gpp_strategies_en.pdf
Background:
Source: DEFRA,
http://sd.defra.gov.uk/advice/public/buying/background/green-public-
procurement/
“Like all Member States of the EU, the UK is encouraged to follow the
principles of Green Public Procurement – “an initiative where
environmental considerations are taken into account within the
procurement process.”
“Green Public Procurement (GPP) aims to direct the combined spending
power of government across the EU member toward environmentally
friendly products and services. Together, public authorities spend around
16% of the Gross Domestic Product (GDP) of the whole EU – a huge
amount of expenditure which can be used to encourage the development
of greener products and reduce environmental impact.”
“The UK – like other Member States – has agreed to the EU‟s proposal
that
“…50% of all tendering procedures should be green, where “green”
means “compliant with endorsed common “core” GPP criteria… The
percentage would be expressed in both number and value of green
contracts as compared to the overall number and value of contracts
concluded in the sectors for which common “core” GPP criteria have been
identified”

100 February 2012
Session 8
Policy Frameworks (cont.)
Facilitators‟ notes Media/activity/handout guidance
Slides 102-103: 1 minute (cont.)
The UK Government Buying Standards prioritises the same key products
as the EU GPP:
Cleaning products
Construction
Electricity / Electrical Goods / Energy-using products
Food
Furniture
Gardening Services / Horticulture
Office ICT Equipment
Paper
Textiles
Transport
Examples of how EU member states and local administrations are
implementing the GPP in purchasing these products can be found at:
http://ec.europa.eu/environment/gpp/case_en.htm
The facilitator should select relevant examples to discuss and may wish to
print the case studies out as a handout.

101 February 2012
Session 8
Policy Frameworks (cont.)
Facilitators‟ notes Media/activity/handout guidance
Slides 104-105: 1 minute
Source: WBCSD, CEV Helpdesk Call presentation (May 2011) (WBCSD
Members only:
http://www.wbcsd.org/Pages/EDocument/EDocumentDetails.aspx?ID=137
54&NoSearchContextKey=true)
Instructions
Facilitator to describe to the delegates the various ways that they can
interact with the policy process and/or how they can ensure involvement.
EU Common Agricultural Reform: The European Union Common
Agricultural Policy (CAP) reform process will not only impact on those
directly involved in agriculture, but also on those downstream industries
whose supply chains rely on them. Agriculture has a heavy impact on
biodiversity, through water consumption, pesticides, land use etc., and the
EU policy is being reformed towards sustainability and environmental
protection, particularly of biologically diverse wetlands. Various industries
were involved in the public consultation for this reform. (Source:
http://ec.europa.eu/agriculture/capexplained/sustain/index_en.htm)
Australian government biodiversity policy consultation: The
Australian government carried out an extensive consultation in the
development of their Biodiversity Conservation Strategy. In producing their
consultation document, they engaged with actors from various sectors,
including business and industry in the region. (Source: Australian
Government Biodiversity Policy
http://www.environment.gov.au/epbc/publications/consultation-draft-
biodiversity-policy.html)
94January 2012
Opportunities for business engagement
Partnerships with other stakeholders key to achieving common
biodiversity/ecosystems goals.
Business engagement in national/international policy initiatives:
Business coalitions with NGOs and civil society
OECD Green Growth Roundtables
Contact Peter Paul van de Wijs ([email protected])
Sustainable Consumption and Value Chain System Solution
Sustainable Value Chain Manual being developed – contact Olivier
Vilaca ([email protected])
Other groups: WEF, GRI and so on.

102 February 2012
Session 8
Policy Frameworks (cont.)
Facilitators‟ notes Media/activity/handout guidance
Slides 104-105: 1 minute (cont.)
Non-government organisations and civil society groups are often key
drivers of biodiversity/conservation initiatives. They often engage with the
relevant actors in business and industry to achieve common objectives.
Below are some recent examples.
Biodiversity and Wine Initiative: In 2004, the South African wine industry
formed partnerships with the Botanical Society of South Africa,
Conservation International and The Green Trust, which led to the
establishment of the Biodiversity and Wine Initiative (BWI). This initiative
takes a „no net impact‟ approach – conserving one acre of natural growth
for every hector of land committed to vineyard (and moving towards a net
positive impact).
(Source: WWF South Africa
http://www.wwf.org.za/what_we_do/outstanding_places/better_land_mana
gement/stewardship/?1101/The-Biodiversity--Wine-Initiative)
Energy and Biodiversity Initiative: The Centre for Environmental
Leadership in Business (Conservation International) convened this
initiative, bringing together “leading energy companies and conservation
organizations to develop and promote a framework of best practices for
integrating biodiversity conservation into upstream oil and gas
development. The partners have created a set of practical guidelines and
tools to minimize impacts to biodiversity and maximize contributions to
conservation wherever oil and gas resources are developed. The
guidelines address all stages of the project lifecycle – from pre-bid to
decommissioning – and are designed to be integrated into existing
company management systems.”
(Source: Conservation International
http://www.conservation.org/sites/celb/fmg/articles/Pages/070199_energy_
biodiversity_initiative.aspx)
94January 2012
Opportunities for business engagement
Partnerships with other stakeholders key to achieving common
biodiversity/ecosystems goals.
Business engagement in national/international policy initiatives:
Business coalitions with NGOs and civil society
OECD Green Growth Roundtables
Contact Peter Paul van de Wijs ([email protected])
Sustainable Consumption and Value Chain System Solution
Sustainable Value Chain Manual being developed – contact Olivier
Vilaca ([email protected])
Other groups: WEF, GRI and so on.

103 February 2012
Session 9: Knowledge share and Q&A
Time guidelines
Time guidelines Time
Knowledge share – activity 15 mins
Session objective
Reinforce the explicit or implicit learning of the course, and provide an
opportunity to address questions relating to the delegates‟ experiences
and challenges of dealing with legislation/policy mechanisms.
Session overview
The session will draw on the previous sessions and aim to build on
delegates‟ previous experience within the field (this is expected to be
limited – hence the short timeframe for this activity).
Session format
This session will be run by one course facilitator, who will chair the
questions and help to facilitate discussion.
Handouts
Participants course material desk pack – hardcopies will be laid out on
participant desks in advance of their arrival at the course. This pack
contains copies of all of the slides used throughout this course together
with relevant handout materials required for each session.
A glossary of terms used during the module will also be available in the
course material desk pack.

104 February 2012
Facilitators‟ notes Media/activity/handout guidance
Slide 106-: 2 minutes
Objective: knowledge share Q & A session
Total time for exercise: 15 minutes
Introduction
This section of the module explores the delegates‟ experiences and the
challenges in dealing with legislation/policy mechanisms related to
managing and mitigating impacts on ecosystems. The aim is to share
experiences between the delegates and translate the theory that has
been covered in the previous modules into a more tangible scenario to
help them absorb the information.
[This session could be linked to a pre-work exercise: delegates to
write a half a page on where they are currently affected by
environmental legislation in their work, and challenges faces in this
area]
The session is designed to be an interactive Question & Answer group,
with delegates sharing their questions and answering under the guidance
of the facilitator over 10 minutes.
Instructions:
The facilitator should explain the aims of the session to the group and
highlight that this is a facilitated Q&A session.
Session 9
Knowledge share – regulations/policy for managing and mitigating
ecosystem impacts
Session 9
Knowledge share – regulations/policy for
managing and mitigating ecosystem impacts
Module 4: Managing and Mitigating Impacts
105 February 2012
Session 9
Knowledge share – regulations/policy for managing and mitigating
ecosystem impacts
Facilitators‟ notes Media/activity/handout guidance
Slides 107-108: 13 minutes
Instructions
The facilitator can use some of the following questions to get the session
started or refer to the categories given for the flip chart layout .
Example questions to start the group discussion:
What are the legislations currently affecting your company?
Take a vote (raise hands) on the legislation most relevant to the
delegates‟ companies
Identify initiatives that their companies currently support and/or are
involved in
Any company goals in the field of No Net loss, reporting, or the use
of offsets
Other question options
Planning processes for corporate infrastructure projects
Identification of new legislation that impact your business
Policy-maker engagement strategies
Environmental reporting
Corporate goals in the area of no net loss
Examples of projects you have worked on that have used are
considering „offsetting‟
99January 2012
Feedback...

106 February 2012
Session 10: Wrap up
Time guidelines
Time guidelines Time
Wrap up – interactive 15-25 mins
Session objective
Session will focus on reviewing the key points of the module, comparing
these with the original needs of delegates (flip chart from icebreaker)
and planning next steps for the delegates.
Session overview
Delegates will be reminded of the module‟s agenda, which will enable
them to recognise the knowledge acquired throughout the different
sessions (set the scene).
The session will then continue with a high level evaluation of the
module‟s objectives and whether they have been achieved.
Finally, the session will conclude with delegates developing steps going
forward, considering actions needed by them and/or their
company/business.
Handouts
Delegates course material desk pack – includes a handout with
references for later study.
Session format
This session will be run by the two course facilitators – one will be
leading the session and the second should facilitate material and/or
addressed questions/queries from delegates/groups.
107 February 2012
Session 10
Wrap up
Facilitators‟ notes Media/activity/handout guidance
Slides 109-111: 5 min
Objective: review the key points of the module, compare with original
delegate needs (flip chart from icebreaker), plan for next steps
Total time for exercise: 15 minutes
Instructions:
Facilitator to:
Recap: review the key learning points.
List key take home messages
Wrap up
Module 4: Managing and Mitigating Impacts
101January 2012
Module 4 – Objectives
By the end of the module, trainees should be able to:
1. Define key policy mechanisms for addressing and mitigating
environmental impact, and enhancing business practice for better
management.
2. Identify the business case for managing and mitigating impacts.
3. Apply the mitigation hierarchy, i.e. develop ideas on how their company
can use offsetting and compensation.
4. Identify how regulatory frameworks and policy mechanisms relate to
participants‟ employers through action planning.
102January 2012
Module 4 – Summary
Understand the basics
Policy and regulatory frameworks
The mitigation hierarchy
Compensation and offsetting
Current policies and regulations

108 February 2012
Session 10
Wrap up
Facilitators‟ notes Media/activity/handout guidance
Slides 112-115: 5 minutes
Instructor to provide a general wrap-up of all four modules.
Module 1 – Understanding the links between ecosystem services and
business
Key concepts used for ecosystem services
Linking concepts and regulatory frameworks
Ecosystems: identifying key ecosystem services
The global ecosystem challenge
Brainstorming the business case
The business case for action
Module 2 – Measuring and assessing impacts and dependencies
Key concepts used for measuring and assessing impacts and
dependencies
Policy trends
Measuring change in ecosystem cervice provision
The business case for action
Introduction to Ecosystem Services Review
Introduction to tools for measuring and assessing impacts and
dependencies
Module 3 – Introduction to valuing ecosystem services
Introduction to regulatory frameworks
Definition of key terms and concepts
Identification of the business case for valuing ecosystems
Knowledge share about the business case
Undertaking ecosystem valuation
Screening for valuation and valuation techniques
Complementary tools
104January 2012
What have we covered? [optional]
Modules 1- 4: Overview
Module 1: Understanding the links
between ecosystem services
and business
Module 2: Measuring and assessing
impacts and dependencies
Module 3: Introduction to valuing
ecosystem services
Module 4: Managing and mitigating
impacts
105January 2012
Module 1 – Recap [optional]
Understand the basics
Drivers for change and business impacts and dependencies
Links with sustainability
Business case for action
Policy and regulatory frameworks
106January 2012
Module 2 – Recap [optional]
Understand the basics
Policy and regulatory frameworks
The business case for action
Introduction to Ecosystem Services Review (ESR)
Introduction to tools, frameworks and methodologies
107January 2012
Module 3 – Recap [optional]
Understand the basics
Policy and regulatory frameworks
The business case for action
Introduction to Corporate Ecosystem Valuation (CEV)
CEV screening and supporting tools and methodologies

109 February 2012
Session 11
Wrap up (cont.)
Facilitators‟ notes Media/activity/handout guidance
Slides 116-117: 5-10 minutes
Instructions:
The facilitator should evaluate the extent to which learning objectives and
outcomes have been achieved, referring back to the learning objectives
captured on the flip chart at the beginning of the session.
Guidance on how to respond if delegates have not achieved their
learning objectives
If there is time revisit specific points and definitions in session 2,
Revisit one specific case study,
Point delegates to the references in their pack which include sources
of further reading
Interactive session: action planning
Facilitator to ask participants to document 3 actions which they could take
in relation to the potential impacts of legislation relevant to their own
organisation. These actions should be as specific and time bound as
possible. For example:
Arrange meetings with site managers from our three largest facilities
over the next 2 months to discuss potential risks and opportunities,
Schedule a meeting this month with the Group Head of Risk to
highlight impacts and dependencies on Ecosystems within our supply
chain and review our management responses,
Review the WBCSD Responding to the Biodiversity Challenge report
this week and prepare a briefing note for the team the following
week.
The facilitator could gather responses from the participants and
consolidate them on a whiteboard/flipchart to share ideas for next steps.
Source: WBCSD,
http://www.wbcsd.org/Pages/EDocument/EDocumentDetails.aspx?ID=22
109January 2012
Action planning
Identify how ecosystem services relate to your own company‟s situation
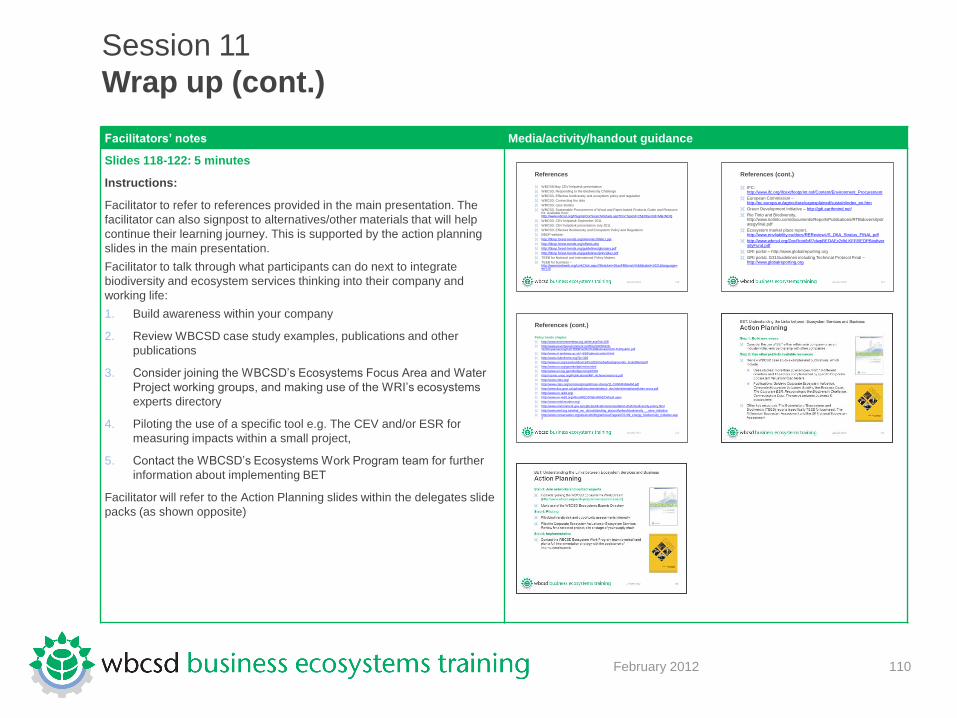
110 February 2012
Session 11
Wrap up (cont.)
Facilitators‟ notes Media/activity/handout guidance
Slides 118-122: 5 minutes
Instructions:
Facilitator to refer to references provided in the main presentation. The
facilitator can also signpost to alternatives/other materials that will help
continue their learning journey. This is supported by the action planning
slides in the main presentation.
Facilitator to talk through what participants can do next to integrate
biodiversity and ecosystem services thinking into their company and
working life:
1. Build awareness within your company
2. Review WBCSD case study examples, publications and other
publications
3. Consider joining the WBCSD‟s Ecosystems Focus Area and Water
Project working groups, and making use of the WRI‟s ecosystems
experts directory
4. Piloting the use of a specific tool e.g. The CEV and/or ESR for
measuring impacts within a small project,
5. Contact the WBCSD‟s Ecosystems Work Program team for further
information about implementing BET
Facilitator will refer to the Action Planning slides within the delegates slide
packs (as shown opposite)
110January 2012
References
WBCSB May CEV helpdesk presentation
WBCSD, Responding to the Biodiversity Challenge
WBCSD, Effective biodiversity and ecosystem policy and regulation
WBCSD. Connecting the dots
WBCSD, case studies
WBCSD. Sustainable Procurement of Wood and Paper-based Products Guide and Resource Kit. Available from: http://www.wbcsd.org/Plugins/DocSearch/details.asp?DocTypeId=25&ObjectId=MjkzNDQ
WBCSD, CEV helpdesk September 2011
WBCSD, CEV helpdesk presentation July 2011
WBCSD, Effective Biodiversity and Ecosystem Policy and Regulation
BBOP website:
http://bbop.forest-trends.org/site/misc/Slide1.ppt
http://bbop.forest-trends.org/offsets.php
http://bbop.forest-trends.org/guidelines/glossary.pdf
http://bbop.forest-trends.org/guidelines/principles.pdf
TEEB for National and International Policy Makers
TEEB for business –http://www.teebweb.org/LinkClick.aspx?fileticket=26aoFB8xrwU%3d&tabid=1021&language=en-US
111January 2012
References (cont.)
IFC: http://www.ifc.org/ifcext/footprint.nsf/Content/Environment_Procurement
European Commission –http://ec.europa.eu/agriculture/capexplained/sustain/index_en.htm
Green Development Initiative – http://gdi.earthmind.net/
Rio Tinto and Biodiversity, http://www.riotinto.com/documents/ReportsPublications/RTBidoversitystrategyfinal.pdf
Ecosystem market place report, http://www.envliability.eu/docs/REReviewUS_D6A_Stratus_FINAL.pdf
http://www.wbcsd.org/DocRoot/bR7dwpBEOAEx2dbLKFF8/EDPBiodiversityFund.pdf
GRI portal – http://www.globalreporting.org
GRI portal. G31Guidelines including Technical Protocol Final –http://www.globalreporting.org
112January 2012
References (cont.)
Policy trends chapter:
http://www.environmentlaw.org.uk/rte.asp?id=108
http://www.povertyenvironment.net/files/IUCN%20-%20Implementing%20TEEB%20for%20Business%20-%20public.pdf
http://www.st-andrews.ac.uk/~dib2/atmos/control.html
http://www.clubofrome.org/?p=326
http://www.un.org/esa/sustdev/csd/csd15/media/backgrounder_brundtland.pdf
http://www.un.org/geninfo/bp/enviro.html
http://www.un.org.geninfo/bp/envirp2/html
http://ozone.unep.org/Publications/MP_Acheivements-E.pdf
http://www.cites.org/
http://www.cites.org/common/prog/african-cherry/11-CUNNINGHAM.pdf
http://www.doc.govt.nz/upload/documents/about- doc/role/international/cites-crocs.pdf
http://www.un-redd.org/
http://www.un-redd.org/AboutREDD/tabid/582/Default.aspx
http://www.redd-monitor.org/
http://www.environment.gov.au/epbc/publications/consultation-draft-biodiversity-policy.html
http://www.wwf.org.za/what_we_do/outstanding_places/fynbos/biodiversity___wine_initiative
http://www.conservation.org/sites/celb/fmg/articles/Pages/070199_energy_biodiversity_initiative.aspx

A1 Wall charts
Module 4: Managing and Mitigating Impacts

112 February 2012
Time Duration (mins) Session Facilitator
10-40 Session 1: Icebreaker and introduction
20 Session 2: Basic concepts
10 Session 3: Introduction to policy trends
45 Session 4: Case study example: applying the mitigation hierarchy
30 Coffee break
10 Session 5: Knowledge check
40 Session 6: Compensation and offsetting
25 Session 7: Reporting and Indicators
20 Session 8: Policy framework
15 Session 9: Knowledge share
10-25 Session 10: Wrap up
BET Module 4: Managing and mitigating impacts
Timetable
Key: Presentation
Exercise

113 February 2012
Group exercise: flipchart layout
Ecosystems Services
Impacted?
Approach?

114 February 2012
Extraction project case study – Flip chart
Case study impacts Pick from the five
management options
available to you and give
your reasons for your choice

115 February 2012
Group exercise: flipchart
List legislation of interest List corporate/department
commitments

A4 HANDOUTS
(LONGER VERSION CASE STUDIES)
Module 4: Managing and Mitigating Impacts

117 February 2012
Compensation case study – EDP
The issue
The environmental impact of invoicing
EDP – Energias de Portugal, an electrical utility company, distributes
around 34 million paper invoices per year in Portugal, a quantity that has
non-negligible environmental impacts. To mitigate these impacts, EDP
has first committed to reduce the number of invoices mailed out every
month. In 2007, it started to promote on-line invoice services, and by the
end of 2009, more than 500.000 clients had joined the initiative. The
company was willing to go further and to compensate all the impacts
resulting from its paper invoicing process, through an innovative
environmental compensation methodology.

118 February 2012
Compensation case study – EDP
The response
Life Cycle Assessment methodology to assess impacts on
ecosystems
The approach, called “Zero Impact” has been developed at the Lisbon
school of engineering – Instituto Superior Técnico. It goes beyond the
offset of CO2 emissions in voluntary markets (already common
worldwide), as it aims to quantify and cover all negative environmental
externalities of the life cycle of paper invoices. The software used for this
Life Cycle Assessment (Sigma Pro 6.0) accounts for the resources,
energy and equipment used for generating invoices (paper, plastic and
printing process), as well as for invoices delivery (fuel).

119 February 2012
Offsetting case study – EDP
The response (cont.)
Life Cycle Assessment methodology to assess impacts on ecosystems
The compensation initiative consists mostly in agro-forestry good practices,
which are implemented in rural areas. The approach is as follows:
1) Compensation of environmental impacts is carried out in the same
ecosystem service category and, whenever possible, in the same location.
2) When not possible, compensation is carried out in another ecosystem
service category.
The compensation initiatives cover most of the impacts on ecosystem
services, as for example: water used for paper production, or soil protection
provided by the agro-forestry good practices implemented in the vicinity of
EDP‟s activities.
The remaining negative impacts not covered by the agro-forestry initiative
are compensated through the CO2 markets, representing approximately
1120 tons of CO2 credits.
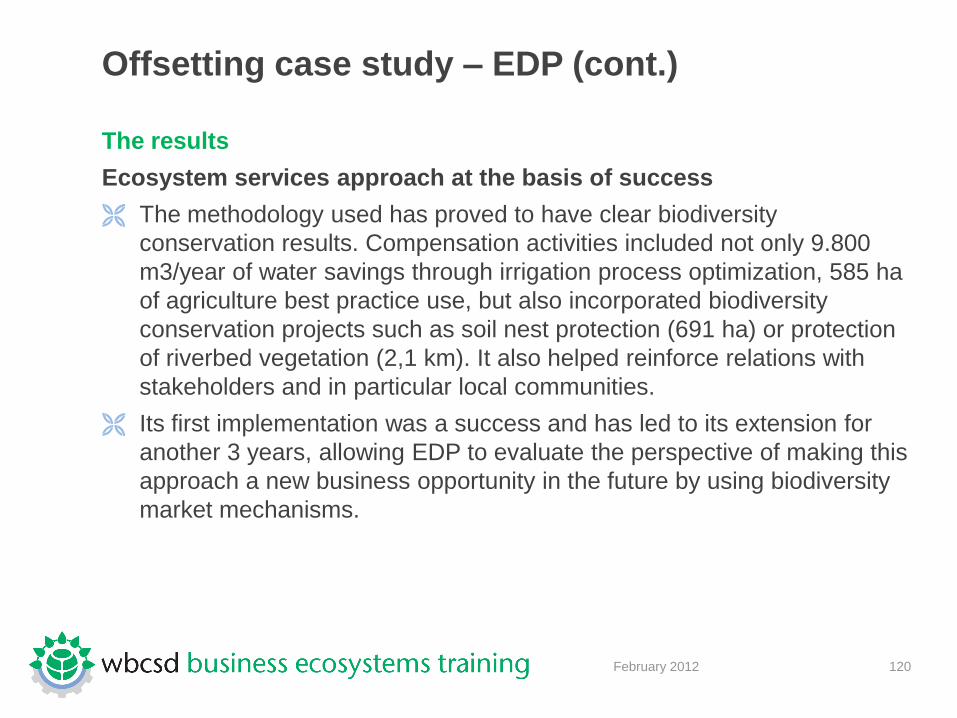
120 February 2012
Offsetting case study – EDP (cont.)
The results
Ecosystem services approach at the basis of success
The methodology used has proved to have clear biodiversity
conservation results. Compensation activities included not only 9.800
m3/year of water savings through irrigation process optimization, 585 ha
of agriculture best practice use, but also incorporated biodiversity
conservation projects such as soil nest protection (691 ha) or protection
of riverbed vegetation (2,1 km). It also helped reinforce relations with
stakeholders and in particular local communities.
Its first implementation was a success and has led to its extension for
another 3 years, allowing EDP to evaluate the perspective of making this
approach a new business opportunity in the future by using biodiversity
market mechanisms.

121 February 2012
Case study exercise – Suncor Energy
The issue
A reclamation objective
Suncor Energy Inc. is Canada‟s largest integrated energy company.
Suncor combines a leading position in oil sands with complementary
operations in refining and marketing, natural gas production and
conventional oil production internationally and offshore East Coast
Canada.
Suncor‟s oil sands business unit operates in the Athabasca region of
Alberta located in the Canadian boreal forest. In order to address the
obvious environmental impacts of oil sands mining, the company is
committed to ultimately returning all lands disturbed by mining and in-
situ operations to a natural state as close to pre-disturbance conditions
as possible.
Reclamation is not only a regulatory requirement, but is also a key
stakeholder expectation that impacts corporate reputation.
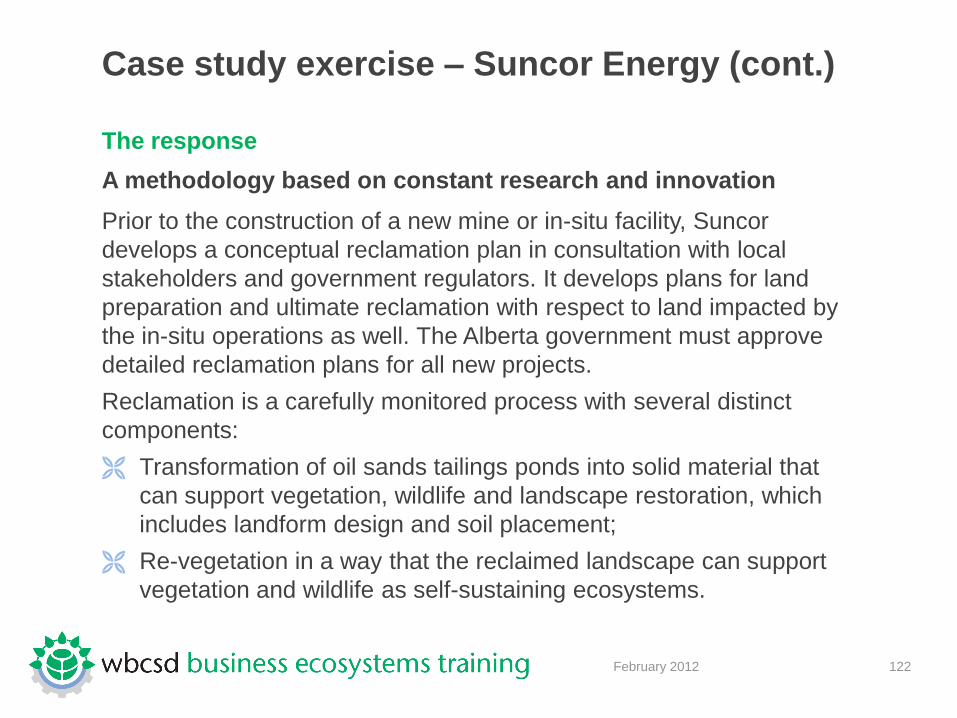
122 February 2012
Case study exercise – Suncor Energy (cont.)
The response
A methodology based on constant research and innovation
Prior to the construction of a new mine or in-situ facility, Suncor
develops a conceptual reclamation plan in consultation with local
stakeholders and government regulators. It develops plans for land
preparation and ultimate reclamation with respect to land impacted by
the in-situ operations as well. The Alberta government must approve
detailed reclamation plans for all new projects.
Reclamation is a carefully monitored process with several distinct
components:
Transformation of oil sands tailings ponds into solid material that
can support vegetation, wildlife and landscape restoration, which
includes landform design and soil placement;
Re-vegetation in a way that the reclaimed landscape can support
vegetation and wildlife as self-sustaining ecosystems.

123 February 2012
Case study exercise – Suncor Energy (cont.)
The results
Pond 1 – the first reclamation of an oil sands tailing pond
Suncor is currently approaching a milestone – with its first surface
reclamation of its former oil sands tailings pond, “Pond 1”. The plan
is to ultimately transform the company‟s 220-hectare pond,
established in the 1960s, into a mixed wood forest and a small
wetland capable of supporting a variety of plants and wildlife.
Reclamation began in 2007 and continues to date. In the first 6
months of 2010 alone, over 150,000 trees were planted on the site.
In 2010, Suncor became the first oil sands company to have a
tailings pond with a trafficable surface that has progressive
reclamation underway. By combining research on innovative
reclamation methodologies and multi-stakeholder consultations
during all stages of its operations, the company is aiming to
increase acceptance of its operations and to consequently maintain
its “social license” to operate.

124 February 2012
Extraction project – Africa (Handout 1)
Context
The extraction project is for a mining company the mine itself has a capacity of
approx. 200,000 tonnes of different minerals.
Production in Africa began in 2008, with full capacity is expected by 2015. The
project‟s assessed reserve life is 35 years, with potential for extension beyond
this.
The main impacts on biodiversity will occur at the mine site and in the upper
portion of the 200 km slurry pipeline through the progressive clearing of a forest.
The mine footprint (approximately 2000 ha), is located within an ecologically
sensitive natural forest.
Commitment to no net loss of biodiversity for the Project according to the BBOP
Principles (voluntary and to meet IFC Performance Standard 6).
A Biodiversity Management Programme is being implemented to avoid and
mitigate impacts, to undertake restoration and to offset the residual impacts.
The mitigation measures cover flora, fauna and aquatics.

125 February 2012
Extraction project – Africa (Handout 1) (cont.)
Impacts
The 300 km of buried slurry pipelines will involve the clearing of a mix of native
and non-native secondary vegetation considered of low biodiversity value.
However, two sections of the pipeline cross sensitive habitats: the first 10 km is
near virgin forest and is accounted for in the mine footprint. The second section
of the pipeline has been routed to avoid current infra-structure and as a result
passes through 20 km of undisturbed forest.
The processing plant occupies 5 km2 of an industrial zone. In addition an existing
pier at the harbour will be extended by over 150 m to accommodate for logistical
needs. The processing plant and pier extension have been assessed in the
Environmental and Social Impact Assessment (ESIA) to have negligible residual
impacts on biodiversity.

126 February 2012
Extraction project – Africa (Handout 2)
Actions
To offset the residual impacts, a composite offset is being planned
1. Offset: establishing an 12,000 ha endangered forest off-site offset, with similar
abiotic and biotic conditions to those found at the mine site and ensuring long
term protection through legal arrangements and community consensus.
2. Reforestation: establishing two-three on-site (mine) forest habitats conservation
areas that occur partially over the mine footprint and ensuring long term
protection through legal and managerial commitments.
3. Conservation forest: establishing a 6,000 ha conservation forest area around
the mine footprint and ensuring long term conservation as part of the priority
species management programme and maintenance for the local community.

127 February 2012
Extraction project – Africa(Handout 2)
Actions (cont.)
4. Forest corridor: the establishment of a forest corridor between the mine area
forests to secure long term landscape level connectivity through partnerships
with government, NGOs and local communities.
5. Protected area: supporting the site management plan design and
implementation in conjunction with government and local NGOs and ensuring
permanency of legal and managerial structures.
6. Reforestation corridor: enhancing forest connectivity in targeted areas of the
through expanded reforestation activities along the pipeline in partnership with
government and local NGOs.
7. Replacement forest: creating a replacement, multifunctional forest on the
footprint during progressive reclamation with an established, integrated
managerial structure by mine closure.

128 February 2012
Disclaimer
Business Ecosystems Training (BET) is a capacity building program released in the name of the WBCSD. It is the
result of a collaborative effort by members of the secretariat and senior executives from KPMG and an Advisory
Committee composed of member companies, Regional Network partners, NGOs, UN and academic institutions, and
others. A wide range of members reviewed drafts, thereby ensuring that BET broadly represents the majority of the
WBCSD membership. It does not mean, however, that every member company agrees with every word.
Business Ecosystems Training (BET) has been prepared for capacity building only, and does not constitute
professional advice. You should not act upon the information contained in BET without obtaining specific
professional advice. No representation or warranty (express or implied) is given as to the accuracy or completeness of
the information contained in BET and its translations in different languages, and, to the extent permitted by law,
WBCSD, KPMG, members of the Advisory Committee, their members, employees and agents do not accept or assume
any liability, responsibility or duty of care for any consequences of you or anyone else acting, or refraining to act, in
reliance on the information contained in this capacity building program or for any decision based on it.
Copyright © World Business Council for Sustainable Development
February 2012