Embed Size (px)
Citation preview

www.ambest.com
Best’s Rating of
LLOYD’S 2009

Copyright © 2009 by A.M. Best Company, Inc.All rights reserved. No part of this report may be reproduced, stored in a retrieval system or transmitted in any form or by any means; electronic, mechanical, photocopying, recording or otherwise.
BestWeek subscribers have full access to all statistical studies and special reports at www.ambest.com/research. Spread-sheet files also are available.
Lloyd’s
September 1, 2009
One Lime StreetLondon EC3M 7HAUnited Kingdom
Web: www.lloyds.comAMB#: 85202AIIN#: AA-1122000
A.M. Best Rating Analysts
London:Miles Trotter, General [email protected]
Catherine Thomas, Managing Senior Financial [email protected]
Colin Towell, Financial [email protected]
David Drummond, Senior Financial [email protected]
Stephen Mullan, Financial [email protected]
Mathilde Jakobsen, Financial [email protected]
Deniese Imoukhuede, Financial [email protected]
Oldwick:Robert DeRose, Vice President+1 (908) 439-2200, Ext. [email protected]
Rating RationaleA.M. Best’s rating of Lloyd’s of London (Lloyd’s) reflects its strong capitalisation, good financial flexibility, good prospective finan-cial performance and excellent global business profile.
Strong capitalisation – A.M. Best believes Lloyd’s will maintain a solid and flexible capital base through 2009 and into 2010. Central solvency capital is expected to remain strong at over GBP2,500 million (2008: GBP2,608 million), after allowing for the buy-back of GBP102 million of subordinated debt. The potential impact of future drawdowns on the Central Fund is expected to diminish, owing to a further decline in run-off liabilities and the reduced likelihood of future insolvencies as a result of increased oversight of syndicates by Lloyd’s. Additionally, the High Court order in June 2009, approving the statutory transfer of 1992 and prior non-life business of members and former members of Lloyd’s to Equitas Insurance Ltd., has further reduced Lloyd’s already remote exposure to liabilities related to this business.
Good financial flexibility – Lloyd’s continues to attract international investment, particularly from other insurers drawn by its capital-effi-cient structure and global licences. In 2008 and the first half of 2009, a number of non-Lloyd’s insurance groups entered the market by either acquiring a managing agent or establishing a new syndicate. Some existing syndicates were also able to raise additional capital to support underwriting, despite capital market constraints.
Good prospective performance – A.M. Best expects Lloyd’s financial performance to remain good in 2009, although some deterioration is anticipated, partly due to the absence of the previous year’s foreign exchange gains. Prior year reserve releases are likely to have a posi-tive, albeit reduced, impact on underwriting earnings. An anticipated rise in attritional claims is likely to offset modest overall rate increases, and the market’s overall combined ratio is expected to increase to approximately 95% from 91% in 2008 (96% excluding profit on foreign exchange). In A.M. Best’s opinion, 2008’s pre-tax profit of GBP1,899 million represents a good result for Lloyd’s, given the magnitude of the year’s catastrophe events and the challenging investment envi-ronment. Results were enhanced by a GBP853 million gain on foreign exchange, largely as a result of the weakening of sterling against the U.S. dollar.
Excellent business profile – Lloyd’s has an excellent business profile, particularly in the U.S. and London market, and continues to expand its global reach through extension of its licence network and local trad-ing platforms. The collective size of the market and its unique capital structure enable syndicates to compete effectively with major interna-tional insurance groups under the Lloyd’s brand. At the same time, its broker subscription business model, which allows large risks to be shared among market participants, is likely to be particularly attractive to insurance buyers seeking to diversify their counter-party risk in the current weak economic environment.
2009 Credit Report

Credit Report September 1, 2009
��
Business ReviewIn A.M. Best’s opinion, Lloyd’s has an excel-lent business profile in the global insurance market as a specialist insurer of property and casualty business. Its competitive strength derives from its reputation for innovative and flexible underwriting, which is supported by the pool of underwriting expertise in London. The collective size of the Lloyd’s market enables its syndicates, which operate as individual businesses, to compete effectively with major interna-tional insurance groups under the Lloyd’s brand.
The Corporation of Lloyd’s oversees and provides services to support the market and its licences, and is responsible for set-ting the level of capital that members must provide to support their underwriting. The Lloyd’s Franchise Board provides a com-mercial focus to management of the market and is responsible for setting minimum standards to help safeguard its future prof-itability.
In 2009 and beyond, A.M. Best expects Lloyd’s to maintain a leading position in its core marine, energy, aviation and specialty markets. It is also likely to remain a signifi-cant writer of catastrophe and reinsurance business, despite strong competition from other international markets, particularly Bermuda. The broker subscription mar-ket is a core characteristic of Lloyd’s and enables large and complex risks to be shared between market participants. A.M. Best believes this structure will be attractive to insureds seeking to diversify
the placement of their risks amid con-cerns regarding the financial security of insurers in the prevailing weak economic climate.
Lloyd’s overall underwriting portfolio comprises direct and reinsurance busi-ness, with insurance representing 65% of gross premium in 2008 and reinsurance accounting for the balance. Exhibit 1 shows Lloyd’s calendar year premium in 2007 and 2008, split by main class of business. Overall, gross premium income increased 10% in 2008, owing in part to the impact of the depreciation of sterling relative to foreign currencies, particularly the U.S. dollar. In addition, a reduction in premium income due to weaker insur-ance rates was offset by new business brought to the market by recently formed syndicates. The number of syndicates has increased from 75 at the beginning of 2008 to 85 in June 2009 (including three reinsurance to close syndicates).
With the exception of motor, all business classes reported growth in 2008. Following a small decline in 2007, reinsurance pre-mium rose by 15.5%, supported by Lloyd’s strong competitive position in the sector. In the property sector, growth was damp-ened by rate reductions. Rates for large commercial risks were under particular pressure due to low claims incidence in 2006 and 2007. Despite this, reported pre-mium income increased 4.3%, buoyed by exchange rate movements.
In the marine sector, available capacity remained high, which placed downward pressure on rates for both hull and cargo business. Premium growth of 8.8% was principally attributable to an increase in sums insured due to higher commodity prices in the first half of the year, when the majority of marine business is underwrit-ten. The level of energy premium written at Lloyd’s has been volatile in recent years, reflecting the market’s rating response to large loss experience, particularly in the Gulf of Mexico. In 2008, the 12.9% increase in GPW (2007: 9.4% decline) was supported by high oil prices at the beginning of the year and rate improvements in the second half of the year.
Exhibit 1Calendar Year Gross Written Premium By Main Business Class (2007-2008) (GBP Millions)
�007 �008 % changeReinsurance 5,453 6,298 15.5%Property 3,809 3,971 4.3%Casualty 3,364 3,762 11.8%Marine 1,226 1,334 8.8%Energy 1,019 1,150 12.9%Motor 983 939 -4.5%Aviation 464 481 3.7%Life 46 49 6.5%Total 16,364 17,984 9.9%
Note: Figures include brokerage and commission.
Source: Lloyd’s Annual Report 2008

Credit Report September 1, 2009
3
Casualty premium rose 11.8% in 2008, as the financial difficulties of some competi-tors presented business opportunities for Lloyd’s syndicates. Competition in the sector remained intense and rates continued to fall from the peak reached in 2003/2004. Plentiful capacity in the aviation market pushed premium rates down further, although an increase in loss experience encouraged stabilisa-tion toward the end of the year. Gross premium income rose 3.7%. In the motor sector, Lloyd’s syndicates continue to focus on company fleet business and niche non-standard risks, primarily in the United Kingdom. In 2008, although rate increases kept pace with claims inflation, premium income fell 4.5%.
The territorial scope of business written at Lloyd’s and the market’s worldwide access to business remain positive rating factors. Through its global infrastructure and net-work of licences, Lloyd’s gives managing agents access to a wide international client base.
A.M. Best expects the Corporation to con-tinue to build a representative presence in certain key markets in 2009, with a particu-lar focus on improving access in Europe. Lloyd’s has increased its support to manag-ing agents developing business in Germany and Scandinavia and is actively exploring the potential for establishment licences in a number of Eastern European countries.
In May 2009, Lloyd’s received an estab-lishment licence in Portugal, and in April 2008, following legislative changes, Lloyd’s became the first admitted reinsurer in Bra-zil, opening a representative office in Rio de Janeiro a year later. New offices in Ire-land and Poland opened in 2008.
Despite these developments, the market is likely to maintain its geographical bias toward North America and the United Kingdom for some time. In 2008, these mature markets represented 44% and 22% of gross premium income respectively (see Exhibit 2).
There was a 2% decline in Lloyd’s overall U.S.-domiciled business in 2008, as a 5% reduction in surplus lines premium offset a small increase in U.S. reinsurance business.
A.M. Best believes that Lloyd’s profile continues to benefit from its substantial participation in the U.S. surplus lines mar-ket, despite the volatility that can be expe-rienced in terms of both premium volume and performance. In 2009, modest surplus lines growth is anticipated despite strong competition. An increase in U.S. reinsur-ance business is also anticipated, owing to rate increases for catastrophe-exposed property business.
Lloyd’s participation in direct U.S. busi-ness (excluding surplus lines) is rela-tively modest and has grown at only 5% per annum over the past five years (see Exhibit 3). Lloyd’s direct account in the United States comprises licensed busi-ness underwritten in Illinois, Kentucky and the U.S. Virgin Islands, as well as other business exempt from surplus lines laws (principally marine, aviation and transport risks). Lloyd’s single-state licences were initially secured for regula-tory reasons and, in A.M. Best’s opinion, are not widely exploited by syndicates.
Business EnvironmentMarket ConditionsIn 2008, large declines in the value of global equity and bond investments and signifi-cant catastrophe losses led to a contrac-tion of insurance industry capital. Raising new capital at an acceptable price has since become more difficult. Under normal circumstances, A.M. Best would expect capital constraints and the prevailing low interest rate environment to have a posi-tive impact on pricing due to a reduction in
3
Exhibit 2Gross Premium by Territory(2008)
Source: Lloyd's Annual Report 2008
Rest of World 4%Central Asia & Asia Pacific 8%
Other Americas 6%
Europe 16%
UK 22%
US & Canada 44%

Credit Report September 1, 2009
4
capacity and the dependence of results on underwriting performance. However, insur-ers went into 2008 with strong balance sheets, and the reduction in industry capi-tal was therefore from a high level. In addi-tion, the extent of a potential decline in demand for insurance, owing to the effect of the economic downturn on asset values and trade, is difficult to predict and may delay a general hardening of rates across the sector.
Rates for business directly exposed to 2008’s catastrophe losses are rising. In the energy sector, risks in the Gulf of Mexico are attracting significant price increases, amid concerns regarding the long-term profitability of this volatile business. In the direct property market, pricing is also improving for U.S. windstorm-exposed risks, although profitable opportunities elsewhere remain somewhat restricted.
The outlook for reinsurance rates is good even though it is again catastrophe-exposed business that is expected to expe-rience the largest increases. As a conse-quence of surplus capital depletion in 2008, some reinsurers have less catastrophe capacity to deploy, while primary insur-ers are often seeking to reduce exposure by increasing the amount of reinsurance purchased. Together these factors should support upward rate movements. In the weak economic climate, A.M. Best expects buyers to seek to place reinsurance with a broader spread of companies, but at the same time to increase focus on the finan-cial security of reinsurer counterparties.
There remains sufficient capacity in the casualty sector and, with the exception of U.S. financial institutions business,
A.M. Best does not anticipate a material improvement in rates in 2009. The volume of marine business premium written is expected to decline, due to a reduction in the value of ships and transported cargo, and competition is likely to restrict an upward movement in rates. Aviation pre-mium is also likely to contract due to lower passenger numbers and flights. Adverse loss experience in 2008 has encouraged price stabilisation; however, ample capac-ity remains.
Operational Change at Lloyd’sA.M. Best believes that further reform of Lloyd’s operations is necessary if it is to maintain and build on its competitive position in the international insurance market. Changes to improve the efficiency of Lloyd’s administrative procedures have been difficult to implement due to its com-plex nature. However, A.M. Best believes that Lloyd’s is now making good progress in reforming key operational processes.
Pre-bind contract certainty and use of the Accounting & Settlement (A&S) reposi-tory and the Electronic Claims File (ECF) repository have been key projects for the market and are now considered “business as usual.” Documentation and data relating to over 90% of premium transactions are submitted electronically each month to the A&S repository for processing. Addition-ally, over 90% of new claims are handled via ECF, which provides all insurers with an interest in a claim immediate, simultaneous access to a central copy of the claims file. Other projects include a new claims seg-mentation strategy, which involves smaller, less complex claims being handled differ-ently from larger claims rather than the tra-ditional, uniform approach. The aim of this strategy is to speed up claims settlement for smaller claims and to focus resources on higher value claims.
Currently, Lloyd’s most significant reform project is the development of the Lloyd’s Exchange. The Lloyd’s Exchange is a mes-saging hub service, which will allow users to transfer risk information using ACORD standard electronic messages. The func-tionality of the exchange is simple and at present it only has an address book and a verification system, which checks that the message is compliant with ACORD
Exhibit 3U.S. Profile of Lloyd’s (2004-2008)(USD Millions)
�004 �005 �006 �007 �008 CAGRLloyd’s Surplus Lines Premium 4,596 4,675 5,989 6,360 6,062 7%Total U.S. Surplus Lines Premiums
33,012 33,281 38,698 36,636 33,353 0%
Lloyd’s Share of U.S. Surplus Lines Premium
14% 14% 15% 17% 18%
Lloyd’s U.S. Direct Business (Excluding Surplus Lines)
1,010 1,034 1,216 1,207 1,232 5%
Lloyd’s U.S. Reinsurance 3,337 3,762 4,849 4,939 5,019 11%Lloyd’s Total U.S. Situs Business 8,943 9,471 12,054 12,506 12,313 8%
CAGR: Compound Annual Growth Rate 2004-2008.Sources: Lloyd’s, A.M. Best Co. and National Association of Insurance Commissioners

Credit Report September 1, 2009
5
standards. The exchange’s simplicity is intentional and allows managing agents to continue to use their own systems together with the exchange while third-party sup-pliers are able to build systems that work with it.
The initial piloting phase of the Lloyd’s Exchange was oversubscribed, demon-strating strong interest among market participants. In A.M. Best’s opinion, the exchange has the potential to improve the efficiency of trading in the Lloyd’s market and, because of its simplicity, is a relatively low-risk project.
In tandem with the exchange project, Lloyd’s is seeking to adopt a single set of ACORD standards for the market. The ulti-mate aim of this work is to allow all risk transactions to be handled electronically via the exchange, and a roadmap detailing the order in which ACORD standards will be implemented has been set out, starting with core placements in the second quar-ter of 2009.
In addition, Lloyd’s is looking to address concerns in the market about the lack of choice of service providers and is working with market associations to evaluate the potential for offering more choice to man-aging agents.
Regulatory and Accounting EnvironmentRegulatory oversight of the Society of Lloyd’s and its managing agents contin-ues to be the responsibility of the United Kingdom’s Financial Services Authority (FSA). The application of Individual Capi-tal Adequacy Standards (ICAS) enabled the FSA to bring Lloyd’s within the scope of its Prudential Sourcebook (PRU). How-ever, some regulatory differences between Lloyd’s and non-life companies in the United Kingdom remain. European Union insurance directives permit Lloyd’s mem-bers to use letters of credit to fulfil FAL requirements as tier I capital. Under the European Commission’s Solvency II pro-posed framework, letters of credit will be considered as tier II capital.
To comply with the FSA’s existing ICAS regime, managing agents conduct an inde-pendent assessment of the capital needs
of syndicates known as the Individual Capital Assessment (ICA). The FSA del-egates the annual review of syndicate ICAs to the Corporation of Lloyd’s, although the FSA reviews a small sample of ICAs in order to validate the effectiveness of the reviews carried out. Lloyd’s is required to assess the adequacy of syndicate ICAs before using these to calculate ICAs for each member. In addition, the Corpora-tion must also conduct an ICA for Lloyd’s overall, using the FSA’s six risk categories – insurance, credit, market, liquidity, group and operational – in order to exam-ine the risks that are not captured in each member’s ICA.
The implementation of Solvency II in 2012 is the principal regulatory challenge facing Lloyd’s. The proposed regulatory and cap-ital regime for EU insurers is an attempt to bring a harmonised, principles-based approach to insurance legislation within the European Union and will apply to Lloyd’s as a single insurance entity. A.M. Best believes the Corporation of Lloyd’s continues to take a proactive approach in discussions with European regulatory bodies and the FSA. Lloyd’s also continues to raise awareness of the implications of the directive for market participants. Man-aging agents were encouraged to complete Quantitative Impact Studies three and four (QIS3 and QIS4), and Lloyd’s mandated the completion of QIS4 for all syndicates in the first half of 2009.
Method of AccountingA.M. Best believes that Lloyd’s method of accounting remains complex, although the introduction of annual accounting in 2005 has provided financial information comparable to standard insurance com-panies. The annual report includes pro forma financial statements (the financial results of Lloyd’s and its members taken together) and Society of Lloyd’s financial statements for which the Society has adopted International Financial Reporting Standards (IFRS). The traditional Lloyd’s underwriting year of account information is no longer presented.
The pro forma financial statements (PFFS) include the aggregate accounts (based on syndicate accounts compiled in accor-dance with U.K. Generally Accepted
Credit Report September 1, 2009
6
Accounting Principles [GAAP]), members’ funds at Lloyd’s (FAL) and the statements for the Society of Lloyd’s. In order to ensure that the accounts are presented on the same basis as other insurers, certain adjustments are made to Lloyd’s capital and investment return (there is a notional investment return on FAL included in the nontechnical account). The sum of the individual audited syndicate accounts is presented in the aggregate statements, the replacement for Lloyd’s traditional three-year accounts. The Society statements pres-ent the central resources of Lloyd’s (e.g. the Central Fund). While the PFFS includes Lloyd’s central resources, the presentation is in U.K. GAAP as opposed to IFRS, which is used for the Society statements.
Managing agents are required to prepare, subject to certain exceptions, underwrit-ing year accounts on a three-year fund basis as well as annual accounts for each syndicate in accordance with U.K.
GAAP. The syndicate underwriting year accounts largely resemble Lloyd’s tradi-tional three-year accounts, which were used for Lloyd’s accounts until 2005. This method of accounting is appropriate for the annual venture structure under which third-party capital providers can join and leave syndicates each year. If all the members agree or if there is no under-writing year being closed, then these accounts are not required. However, as underwriting year accounts are required for members’ tax purposes, this is only likely to occur in practice on single-mem-ber corporate syndicates.
In its November 2008 Pre-Budget Report, the U.K. Government announced that it will bring the tax treatment of Lloyd’s corpo-rate members’ technical reserves into line with that of general insurers by introducing a claims equalisation reserve for tax pur-poses only. This is expected to reduce the volatility of members’ tax results.
Financial PerformanceA.M. Best anticipates deterioration in Lloyd’s performance in 2009, principally due to the absence of the large foreign exchange gains that benefited 2008 results. The market’s overall combined ratio is expected to remain comparable to the 96% reported in 2008 (excluding profit on foreign exchange). This fore-cast incorporates a substantial allow-ance for catastrophe losses, although below the level actually experienced in 2008. An anticipated increase in attri-tional claims is likely to offset modest overall rate increases. Prior year reserve movements are expected to have a posi-tive, albeit reduced, impact on under-writing earnings.
In 2009, for lines of business exposed to U.S. windstorm catastrophes, rates are strengthening and underwriting oppor-tunities for syndicates exist. Elsewhere, small rate increases are unlikely to be sufficient to alleviate pressure on profit margins. The market has exposure to the lines of business that could be affected by claims directly related to U.S. sub-prime and the 2008 financial crisis, prin-cipally professional indemnity and direc-tors’ and officers’ insurance. However,
syndicates have written significantly less large U.S. financial institutions busi-ness since 2000, and A.M. Best does not expect Lloyd’s to incur substantial loss-es from this source.
Farther ahead, the impact of the eco-nomic downturn on overall perfor-mance is uncertain. A.M. Best expects an increased focus on underwriting returns (due to the absence of mate-rial investment income) to underpin pricing. However, the impact of the global recession on claims frequency and demand for insurance is more dif-ficult to predict. Additionally, prospec-tive results are expected to be volatile, owing to the nature of business under-written at Lloyd’s. Nevertheless, A.M. Best believes that better underwriting and risk management standards at syn-dicates, supported by the oversight and activities of the Franchise Performance Directorate (FPD), are likely to temper the extreme performance downside from which Lloyd’s has suffered in the past. The FPD reviews and approves syndicate business plans and monitors performance against these plans. Addi-tionally, it continues to improve the
Credit Report September 1, 2009
7
support it provides to managing agents, principally through the provision of market information and performance analysis.
A.M. Best anticipates modest investment income in 2009. Earnings from syndi-cates’ premium trust funds, which make the largest contribution to Lloyd’s over-all investment income, are likely to be lower than in 2008 owing to prevailing market conditions. However, the poten-tial for substantial investment losses is moderated by the conservative invest-ment strategy pursued by the majority of syndicates. The return on Central Fund assets is likely to remain volatile.
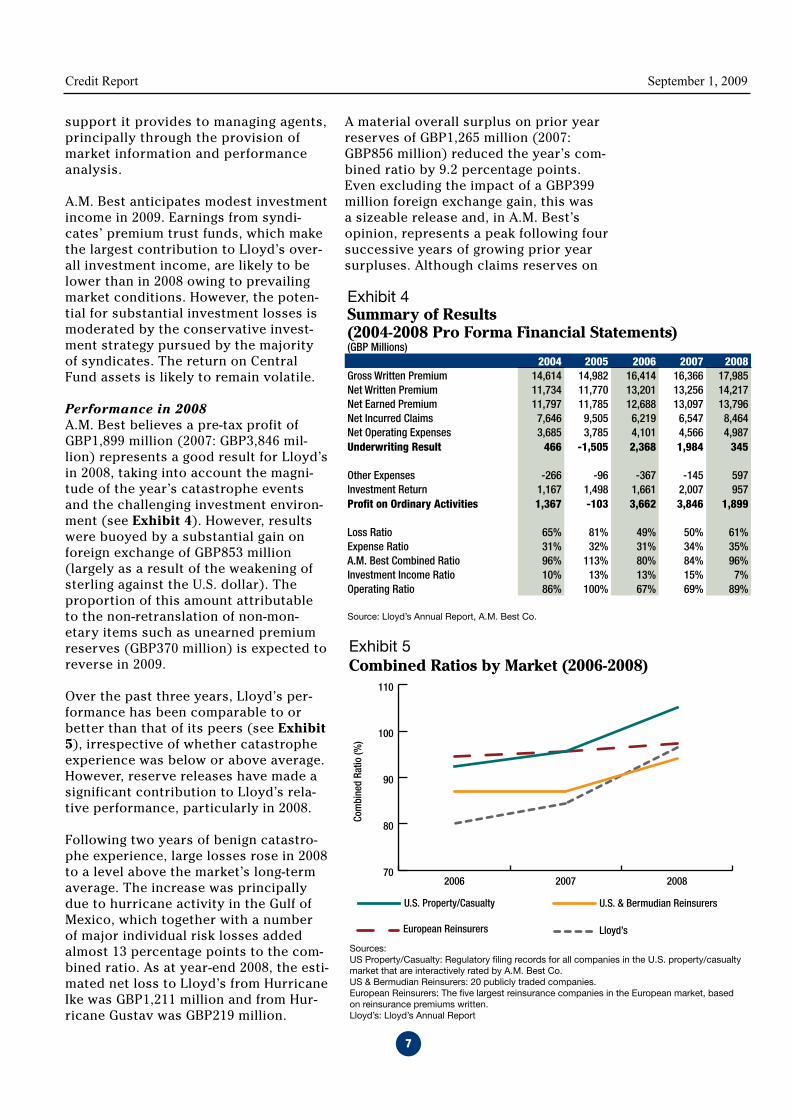
Performance in 2008A.M. Best believes a pre-tax profit of GBP1,899 million (2007: GBP3,846 mil-lion) represents a good result for Lloyd’s in 2008, taking into account the magni-tude of the year’s catastrophe events and the challenging investment environ-ment (see Exhibit 4). However, results were buoyed by a substantial gain on foreign exchange of GBP853 million (largely as a result of the weakening of sterling against the U.S. dollar). The proportion of this amount attributable to the non-retranslation of non-mon-etary items such as unearned premium reserves (GBP370 million) is expected to reverse in 2009.
Over the past three years, Lloyd’s per-formance has been comparable to or better than that of its peers (see Exhibit 5), irrespective of whether catastrophe experience was below or above average. However, reserve releases have made a significant contribution to Lloyd’s rela-tive performance, particularly in 2008.
Following two years of benign catastro-phe experience, large losses rose in 2008 to a level above the market’s long-term average. The increase was principally due to hurricane activity in the Gulf of Mexico, which together with a number of major individual risk losses added almost 13 percentage points to the com-bined ratio. As at year-end 2008, the esti-mated net loss to Lloyd’s from Hurricane Ike was GBP1,211 million and from Hur-ricane Gustav was GBP219 million.
A material overall surplus on prior year reserves of GBP1,265 million (2007: GBP856 million) reduced the year’s com-bined ratio by 9.2 percentage points. Even excluding the impact of a GBP399 million foreign exchange gain, this was a sizeable release and, in A.M. Best’s opinion, represents a peak following four successive years of growing prior year surpluses. Although claims reserves on
Exhibit 4Summary of Results (2004-2008 Pro Forma Financial Statements)(GBP Millions)
�004 �005 �006 �007 �008Gross Written Premium 14,614 14,982 16,414 16,366 17,985Net Written Premium 11,734 11,770 13,201 13,256 14,217Net Earned Premium 11,797 11,785 12,688 13,097 13,796Net Incurred Claims 7,646 9,505 6,219 6,547 8,464Net Operating Expenses 3,685 3,785 4,101 4,566 4,987Underwriting Result 466 -1,505 �,368 1,984 345
Other Expenses -266 -96 -367 -145 597Investment Return 1,167 1,498 1,661 2,007 957Profit on Ordinary Activities 1,367 -103 3,66� 3,846 1,899
Loss Ratio 65% 81% 49% 50% 61%Expense Ratio 31% 32% 31% 34% 35%A.M. Best Combined Ratio 96% 113% 80% 84% 96%Investment Income Ratio 10% 13% 13% 15% 7%Operating Ratio 86% 100% 67% 69% 89%
Source: Lloyd’s Annual Report, A.M. Best Co.
70
80
90
100
110
Lloyd’sEuropean Reinsurers
U.S. & Bermudian ReinsurersU.S. Property/Casualty
200820072006
Com
bine
d Ra
tio (%
)
Exhibit 5Combined Ratios by Market (2006-2008)
Sources:US Property/Casualty: Regulatory filing records for all companies in the U.S. property/casualty market that are interactively rated by A.M. Best Co. US & Bermudian Reinsurers: 20 publicly traded companies. European Reinsurers: The five largest reinsurance companies in the European market, based on reinsurance premiums written.Lloyd’s: Lloyd’s Annual Report
Exhibit 6Combined Ratios by Business Class (2008)
Source: Lloyd's
Energy
Reinsurance
Property
Aviation
Casualty
MotorLife
Marine
Lloyd’s
Accident Year Loss Ratio Prior Year Reserve Movement Expense Ratio
Com
bine
d Ra
tio (%
)
-40
-20
0
20
40
60
80
100
120
140
Exhibit 7Combined Ratios by Quartile (2008)
Note: Combined ratios are stated prior to elimination of transactions between syndicates and the Society.Source: Lloyd's
Com
bine
d Ra
tio (%
)
0
20
40
60
80
100
120Lloyd's
4th Quartile
3rd Quartile
2nd Quartile
1st Quartile
1stQuartile
2ndQuartile
3rdQuartile
4thQuartile
Lloyd’s
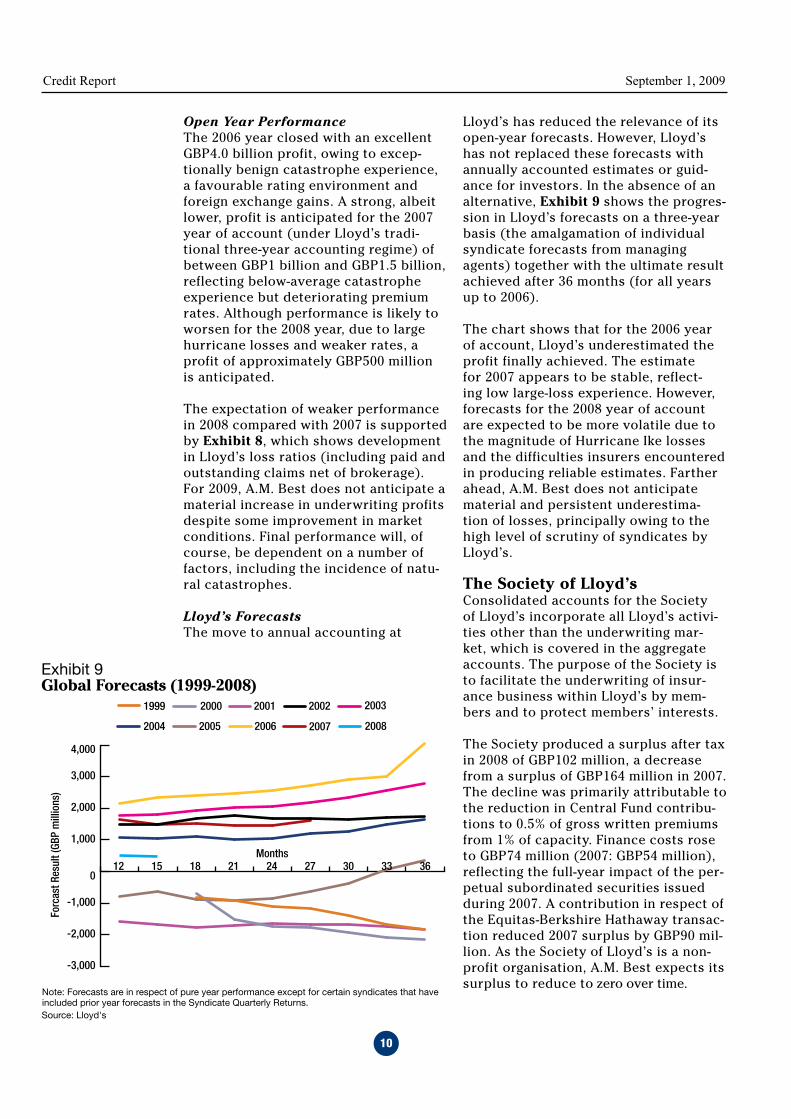
Exhibit 9Global Forecasts (1999-2008)
Note: Forecasts are in respect of pure year performance except for certain syndicates that have included prior year forecasts in the Syndicate Quarterly Returns.
-3,000
-2,000
-1,000
0
1,000
2,000
3,000
4,000
20082007200620052004
20032002200120001999
Forc
ast R
esul
t (GB
P m
illio
ns)
12 15 18 21 24 27 30 33 36Months
Source: Lloyd's

Credit Report September 1, 2009
8
business written between 2002 and 2006 continue to develop favourably across all major business lines, the magnitude of releases from these years is likely to reduce. In addition, market conditions deteriorated in 2007 and 2008, particu-larly for casualty business, and signifi-cant redundancies from these years are unlikely to emerge. Following several years of material reserve strengthening, claims reserves for casualty business written between 1997 and 2001 have been stable since 2006.
There was a small increase in Lloyd’s operating expense ratio in 2008 to 35% from 34% (expressed as a percentage of net written premiums). The most sig-nificant part of operating expenses is acquisition costs, which increased by 8% to GBP3,720 million in line with the increase in business underwritten. The other main element is administrative or management expenses, which remained relatively stable at GBP908 million. Man-aging agent profit commission rose to GBP359 million (2007: GBP230 million), reflecting excellent profits in 2006 and 2007.
Despite the collapse of confidence in the investment markets, Lloyd’s produced total investment income of GBP957 mil-lion in 2008 (2007: GBP2,007 million), which equated to an overall return of 2.5% (2007: 5.6%). Income from syndi-cates’ premium trust funds represents the most significant component of overall income and is largely driven by returns in the U.S. dollar and sterling
fixed-income markets, owing to the high proportion of business transacted in these currencies. In recent years some syndicates have increased their expo-sure to more volatile asset classes; however, most portfolios remain domi-nated by high-quality, short-duration, fixed-income securities. As a result, syn-dicates were largely insulated from sub-stantial losses on equity and corporate debt investments and were also able to take advantage of the rally in govern-ment bonds toward the end of the year to produce a 2% return on premium trust funds (2007: 5.2%).
The return on Central Fund assets rose to 7.8% (2007: 6.8%), principally due to the strong performance of longer dura-tion government bonds in the fourth quarter. A significant proportion of Cen-tral Fund assets comprises proceeds from the subordinated loan notes issued by the Society of Lloyd’s, which match the Society’s long-tail liabilities. Conse-quently, the return on these investments is subject to volatility. The return on members’ FAL fell to 2.7% from 6.2% in 2007.
Exhibit 6 shows the class of business breakdown in Lloyd’s performance based on the aggregate accounts. The three ratios shown – accident year loss ratio, prior year reserve movement and expense ratio – are components of the calendar year combined ratio for each class. The expense ratio includes profit or loss on foreign exchange. The chart shows that on a calendar year basis, all classes except energy contributed positively to Lloyd’s overall underwrit-ing performance in 2008, with prior year reserve releases reducing the combined ratio of each business class.
Despite exposure to hurricanes Ike and Gustav, the reinsurance class produced an accident year profit, the magnitude of which was increased by the favourable impact of exchange rate movements. On a calendar year basis, results were boosted by the release of catastrophe risk loadings on the 2006 and 2007 underwriting years. For property, a com-bination of catastrophe losses and an
70
80
90
100
110
Lloyd’sEuropean Reinsurers
U.S. & Bermudian ReinsurersU.S. Property/Casualty
200820072006
Com
bine
d Ra
tio (%
)
Exhibit 5Combined Ratios by Market (2006-2008)
Sources:US Property/Casualty: Regulatory filing records for all companies in the U.S. property/casualty market that are interactively rated by A.M. Best Co. US & Bermudian Reinsurers: 20 publicly traded companies. European Reinsurers: The five largest reinsurance companies in the European market, based on reinsurance premiums written.Lloyd’s: Lloyd’s Annual Report
Exhibit 6Combined Ratios by Business Class (2008)
Source: Lloyd's
Energy
Reinsurance
Property
Aviation
Casualty
MotorLife
Marine
Lloyd’s
Accident Year Loss Ratio Prior Year Reserve Movement Expense Ratio
Com
bine
d Ra
tio (%
)
-40
-20
0
20
40
60
80
100
120
140
Exhibit 7Combined Ratios by Quartile (2008)
Note: Combined ratios are stated prior to elimination of transactions between syndicates and the Society.Source: Lloyd's
Com
bine
d Ra
tio (%
)0
20
40
60
80
100
120Lloyd's
4th Quartile
3rd Quartile
2nd Quartile
1st Quartile
1stQuartile
2ndQuartile
3rdQuartile
4thQuartile
Lloyd’s
Exhibit 9Global Forecasts (1999-2008)
Note: Forecasts are in respect of pure year performance except for certain syndicates that have included prior year forecasts in the Syndicate Quarterly Returns.
-3,000
-2,000
-1,000
0
1,000
2,000
3,000
4,000
20082007200620052004
20032002200120001999
Forc
ast R
esul
t (GB
P m
illio
ns)
12 15 18 21 24 27 30 33 36Months
Source: Lloyd's

Credit Report September 1, 2009
9
increase in the frequency of large risk losses pushed the current accident year into deficit. However, releases on years 2002-2006 and stable 2005 U.S. hurricane losses supported an overall calendar year profit.
As expected given Lloyd’s exposure to offshore risks in the Gulf of Mexico, the energy class reported weak accident year results. A prior year surplus of GBP67 million was insufficient to offset accident year losses, and the calendar year combined ratio was high at 124%.
Aviation business continued to per-form poorly on an accident year basis, due to an increase in loss experience and ongoing rate softening. However, a substantial prior year release reduced the combined ratio to an excellent 87%. The marine sector produced satisfac-tory accident and calendar year results, despite an increase in the frequency and cost of claims.
In the casualty sector, an increase in attritional claims and further rate dete-rioration placed downward pressure on accident year earnings, and the reported calendar year profit was dependent on redundancies in respect of business written between 2002 and 2006. Profit margins for motor business remained under pressure due to claims inflation.
Lloyd’s overall performance represents the aggregate performance of its separate trading businesses and may include out-
standing performance from Lloyd’s better businesses, as well as weak performance at the other end of the scale. As such, Lloyd’s performance is not directly comparable to that of other insurers because Lloyd’s results have not been actively managed at the centre in the way that the performance of an insurance company is. The Fran-chise Performance Directorate has a role in agreeing business plans and monitoring performance, but Lloyd’s remains a market of competing businesses, each with its own separate decision-making processes. Exhibit 7 shows the quartile split in Lloyd’s com-bined ratio. In 2008, the strongest performing quartile produced an average combined ratio of 76%, as compared to 110% produced by the weakest performing quartile. Syndicates’ U.S. windstorm exposure was a key determi-nant of relative performance.
70
80
90
100
110
Lloyd’sEuropean Reinsurers
U.S. & Bermudian ReinsurersU.S. Property/Casualty
200820072006
Com
bine
d Ra
tio (%
)
Exhibit 5Combined Ratios by Market (2006-2008)
Sources:US Property/Casualty: Regulatory filing records for all companies in the U.S. property/casualty market that are interactively rated by A.M. Best Co. US & Bermudian Reinsurers: 20 publicly traded companies. European Reinsurers: The five largest reinsurance companies in the European market, based on reinsurance premiums written.Lloyd’s: Lloyd’s Annual Report
Exhibit 6Combined Ratios by Business Class (2008)
Source: Lloyd's
Energy
Reinsurance
Property
Aviation
Casualty
MotorLife
Marine
Lloyd’s
Accident Year Loss Ratio Prior Year Reserve Movement Expense Ratio
Com
bine
d Ra
tio (%
)
-40
-20
0
20
40
60
80
100
120
140
Exhibit 7Combined Ratios by Quartile (2008)
Note: Combined ratios are stated prior to elimination of transactions between syndicates and the Society.Source: Lloyd's
Com
bine
d Ra
tio (%
)
0
20
40
60
80
100
120Lloyd's
4th Quartile
3rd Quartile
2nd Quartile
1st Quartile
1stQuartile
2ndQuartile
3rdQuartile
4thQuartile
Lloyd’s
Exhibit 9Global Forecasts (1999-2008)
Note: Forecasts are in respect of pure year performance except for certain syndicates that have included prior year forecasts in the Syndicate Quarterly Returns.
-3,000
-2,000
-1,000
0
1,000
2,000
3,000
4,000
20082007200620052004
20032002200120001999
Forc
ast R
esul
t (GB
P m
illio
ns)
12 15 18 21 24 27 30 33 36Months
Source: Lloyd's
Exhibit 8Global Net Incurred Loss Ratios (2002-2008)
Quarter �00� �003 �004 �005 �006 �007 �0081 0.7% 0.7% 1.1% 2.1% 0.8% 1.0% 0.0%2 2.5% 2.6% 3.0% 4.3% 2.5% 3.1% 2.1%3 7.3% 6.1% 9.8% 14.0% 6.3% 7.5% 7.8%4 15.9% 12.1% 21.6% 36.9% 12.6% 14.2% 21.0%5 25.1% 19.1% 30.9% 47.2% 19.4% 22.1%6 32.7% 24.6% 39.3% 57.3% 26.3% 29.8%7 39.6% 30.1% 46.1% 65.7% 32.6% 36.2%8 45.4% 34.4% 55.4% 70.6% 37.5% 44.0%9 48.8% 36.8% 59.0% 72.5% 40.4%10 51.8% 38.9% 61.4% 74.8% 42.8%11 54.0% 40.3% 62.7% 76.9% 44.3%12 55.3% 40.2% 63.5% 78.5% 45.8%
Note: Denominator is estimated 12th quarter net premium (net of brokerage). Net incurred loss ratios exclude IBNR provisions.Source: Lloyd’s
Credit Report September 1, 2009
10
Open Year PerformanceThe 2006 year closed with an excellent GBP4.0 billion profit, owing to excep-tionally benign catastrophe experience, a favourable rating environment and foreign exchange gains. A strong, albeit lower, profit is anticipated for the 2007 year of account (under Lloyd’s tradi-tional three-year accounting regime) of between GBP1 billion and GBP1.5 billion, reflecting below-average catastrophe experience but deteriorating premium rates. Although performance is likely to worsen for the 2008 year, due to large hurricane losses and weaker rates, a profit of approximately GBP500 million is anticipated.
The expectation of weaker performance in 2008 compared with 2007 is supported by Exhibit 8, which shows development in Lloyd’s loss ratios (including paid and outstanding claims net of brokerage). For 2009, A.M. Best does not anticipate a material increase in underwriting profits despite some improvement in market conditions. Final performance will, of course, be dependent on a number of factors, including the incidence of natu-ral catastrophes.
Lloyd’s ForecastsThe move to annual accounting at
Lloyd’s has reduced the relevance of its open-year forecasts. However, Lloyd’s has not replaced these forecasts with annually accounted estimates or guid-ance for investors. In the absence of an alternative, Exhibit 9 shows the progres-sion in Lloyd’s forecasts on a three-year basis (the amalgamation of individual syndicate forecasts from managing agents) together with the ultimate result achieved after 36 months (for all years up to 2006).
The chart shows that for the 2006 year of account, Lloyd’s underestimated the profit finally achieved. The estimate for 2007 appears to be stable, reflect-ing low large-loss experience. However, forecasts for the 2008 year of account are expected to be more volatile due to the magnitude of Hurricane Ike losses and the difficulties insurers encountered in producing reliable estimates. Farther ahead, A.M. Best does not anticipate material and persistent underestima-tion of losses, principally owing to the high level of scrutiny of syndicates by Lloyd’s.
The Society of Lloyd’sConsolidated accounts for the Society of Lloyd’s incorporate all Lloyd’s activi-ties other than the underwriting mar-ket, which is covered in the aggregate accounts. The purpose of the Society is to facilitate the underwriting of insur-ance business within Lloyd’s by mem-bers and to protect members’ interests.
The Society produced a surplus after tax in 2008 of GBP102 million, a decrease from a surplus of GBP164 million in 2007. The decline was primarily attributable to the reduction in Central Fund contribu-tions to 0.5% of gross written premiums from 1% of capacity. Finance costs rose to GBP74 million (2007: GBP54 million), reflecting the full-year impact of the per-petual subordinated securities issued during 2007. A contribution in respect of the Equitas-Berkshire Hathaway transac-tion reduced 2007 surplus by GBP90 mil-lion. As the Society of Lloyd’s is a non-profit organisation, A.M. Best expects its surplus to reduce to zero over time.
70
80
90
100
110
Lloyd’sEuropean Reinsurers
U.S. & Bermudian ReinsurersU.S. Property/Casualty
200820072006
Com
bine
d Ra
tio (%
)
Exhibit 5Combined Ratios by Market (2006-2008)
Sources:US Property/Casualty: Regulatory filing records for all companies in the U.S. property/casualty market that are interactively rated by A.M. Best Co. US & Bermudian Reinsurers: 20 publicly traded companies. European Reinsurers: The five largest reinsurance companies in the European market, based on reinsurance premiums written.Lloyd’s: Lloyd’s Annual Report
Exhibit 6Combined Ratios by Business Class (2008)
Source: Lloyd's
Energy
Reinsurance
Property
Aviation
Casualty
MotorLife
Marine
Lloyd’s
Accident Year Loss Ratio Prior Year Reserve Movement Expense Ratio
Com
bine
d Ra
tio (%
)
-40
-20
0
20
40
60
80
100
120
140
Exhibit 7Combined Ratios by Quartile (2008)
Note: Combined ratios are stated prior to elimination of transactions between syndicates and the Society.Source: Lloyd's
Com
bine
d Ra
tio (%
)
0
20
40
60
80
100
120Lloyd's
4th Quartile
3rd Quartile
2nd Quartile
1st Quartile
1stQuartile
2ndQuartile
3rdQuartile
4thQuartile
Lloyd’s
Exhibit 9Global Forecasts (1999-2008)
Note: Forecasts are in respect of pure year performance except for certain syndicates that have included prior year forecasts in the Syndicate Quarterly Returns.
-3,000
-2,000
-1,000
0
1,000
2,000
3,000
4,000
20082007200620052004
20032002200120001999
Forc
ast R
esul
t (GB
P m
illio
ns)
12 15 18 21 24 27 30 33 36Months
Source: Lloyd's

Credit Report September 1, 2009
11
A.M. Best believes Lloyd’s will maintain a solid capital base through 2009 and into 2010. Central assets for solvency purposes rose 6% in 2008 to GBP2,608 million (see Exhibit 10) and are expected to remain at a comparable level in 2009, after allowing for the buy-back of GBP102 million of subordi-nated debt. At this level, A.M. Best believes there is sufficient tolerance within central assets to withstand a significant stress sce-nario without threatening the market’s sol-vency.
Farther ahead, A.M. Best does not antici-pate large drawdowns on Central Fund assets, reflecting diminished strain on cen-tral assets from insolvent members. A fur-ther reduction in the number of syndicate years of account in run-off is anticipated, owing in part to the risk-based oversight of existing syndicates by the Franchise Board and an increase in the availability of rea-sonably priced reinsurance to close (RITC) transactions. In the medium term, the members’ contribution rate is expected to remain stable at 0.5% of gross written pre-miums, instead of fluctuating with market performance as it has in the past.
The Corporation of Lloyd’s is responsible for setting capital both centrally and at member level. During 2008 and into 2009, Lloyd’s has made further progress integrating Individual Capital Assessments (ICAs) into its member-level capital-setting process, with the devel-opment of a syndicate ICA benchmarking tool. This model will replace the risk-based capital (RBC) syndicate benchmark model for the 2010 ICA process.
The capital to support underwriting at Lloyd’s is supplied by members on an annual basis, and an important factor in A.M. Best’s analysis of Lloyd’s is its ability to retain and attract the capital required for continued trading. Capital is provided by a diverse mix of sources, including U.K.-listed companies, private individuals and insurance industry sources in Bermuda, the United States and the rest of the world. In A.M. Best’s opinion, Lloyd’s continues to demonstrate good financial flexibility. In the second half of 2008 and the first half of 2009, investment increased, with a number
of non-Lloyd’s insurance groups either acquiring a managing agent or setting up a new syndicate. Some existing members were also able to raise additional capital to support underwriting.
Although new capital has entered the market, A.M. Best expects underwriting discipline at Lloyd’s to be maintained. Both new and existing members are likely to focus on preserving capital, since there is increased uncertainty as to whether further capital to replenish balance sheets following a large loss would be available at an acceptable price. In addition, A.M. Best believes Lloyd’s has a rigorous pro-cess in place to assess and monitor new entrants, which is likely to protect overall market performance and ultimately cen-tral capital. This process is managed by Lloyd’s Relationship Management team, in conjunction with a multidisciplinary team including senior management from the Franchise Performance Directorate. All new entrant applications must be approved by the Franchise Board. Corporate members underwriting on new syndicates are also required to contribute to the Central Fund at a higher rate for their first three years of operations at Lloyd’s (the rate for 2009 is 2%). The capital requirement for new syndicates is also higher. Initial capital requirements are set using Lloyd’s internal capital model, which includes a 20% new syndicate loading.
During the second half of 2008, the weakening of sterling created a degree of concern over the adequacy of FAL for those syndicates
Exhibit 10Central Assets for Solvency (2007-2008)(GBP Millions)
Exhibit 13Composition of Capital (2008-2009)
Source: Lloyd's Annual Report 2008Source: Lloyd's
Note: Captial providers shown as a percentage of overall capacity.Source: Lloyd’s
0 500 1,000 1,500 2,000 2,500 3,000
2007
2008
Net Central Fund assets and other net assets of the Society
Subordinated loan notes and Perpetual Capital Securites
Callable Central Fund contributions
Other solvency adjustments
Names (Unlimited)
Names Conversion CapitalOther Industry - Overseas Non Insurance
Other Overseas Insurance IndustryUK Insurance Industry
US Insurance IndustryBermudian Insurance Industry
20092008
12%
15%
36%
18%
5%
9%5%8%
15%
42%
5%
14%
9%
6%
Exhibit 14Net Year-End IBNR Utilisation (2006-2008)
IBNR
Util
isat
ion
(%)
0
5
10
15
20
25
200820072006
Exhibit 16Reinsurance Debtors (2006-2008)
Source: Lloyd's
0
2
4
6
8
10
12
14
16
200820072006
GBP
Billi
ons
Net Recoverable Net Paid Debt
990 495 1082 41
939 478 1012 36
Capitalisation

Credit Report September 1, 2009
1�
with significant exposure to U.S. dollar business. Although members remained capitalised above their ICA requirements, and the aggregate impact was comfort-ably contained within the Central Fund’s surplus over regulatory requirements, materially affected members were required to provide new assets prior to 1 April 2009 renewals. In A.M. Best’s opinion, the situ-ation was managed effectively by Lloyd’s, which focussed on the largest absolute shortfalls. The majority of new funds were provided by letters of credit or through rights issues in the capital markets. Only a small number of members required materi-al reductions in planned income and expo-sures to fit the existing capital available.
Overall CapitalisationA.M. Best believes total capital available to support Lloyd’s liabilities is likely to remain excellent. This assessment of over-all capital strength factors the potential impact of future drawdowns by existing insolvent members and the successful completion of both phases of the two-phase transaction to reinsure and subse-quently transfer the insurance liabilities of Equitas. Phase one was completed in March 2007, and in respect of phase two, at the end of June 2009, Equitas obtained the approval of the High Court to transfer the 1992 and prior years’ non-life Lloyd’s liabilities of open and closed year Names
by means of a statutory transfer under Part VII of the Financial Services and Mar-kets Act 2000. This transfer is to a newly formed, FSA-authorised insurance com-pany within the Equitas group and commit-ted National Indemnity Co. to provide up to an additional USD 1.3 billion of reinsurance cover for a further premium of up to GBP40 million (Lloyd’s contribution to the pre-mium is GBP18 million).
Any assessment of Lloyd’s overall capital strength is complicated by the compart-mentalisation of capital at member level (see Exhibit 11). The first two links in the “Chain of Security” are on a several rather than joint basis, meaning that any member need only meet its share of claims. How-ever, the third and final link in the chain, Lloyd’s central assets, is available, at the discretion of the Council of Lloyd’s, to meet liabilities that any member is unable to meet in full and comprises the Central Fund and the net assets of the Corporation of Lloyd’s. It is the existence of this par-tially mutualising third link, and the liquid Central Fund in particular, that is the basis for a market-level rating.
Central assets available to meet unpaid cash calls rose in 2008 to GBP2,072 million (excluding the subordinated debt liability and the callable layer), from GBP1,951 mil-lion the previous year. This was in line with A.M. Best’s expectation that central assets would remain stable at approximately GBP2 billion.
A.M. Best believes the protection provided for Lloyd’s policyholders by central assets is likely to remain excellent in 2009 and 2010. In this analysis, A.M. Best has includ-ed the Central Fund, the net assets of the corporation and subordinated debt. A.M. Best anticipates that taken together, these central assets are likely to remain stable in 2009 at approximately GBP2 billion, after allowing for the buy-back in April 2009 of GBP102 million of subordinated debt.
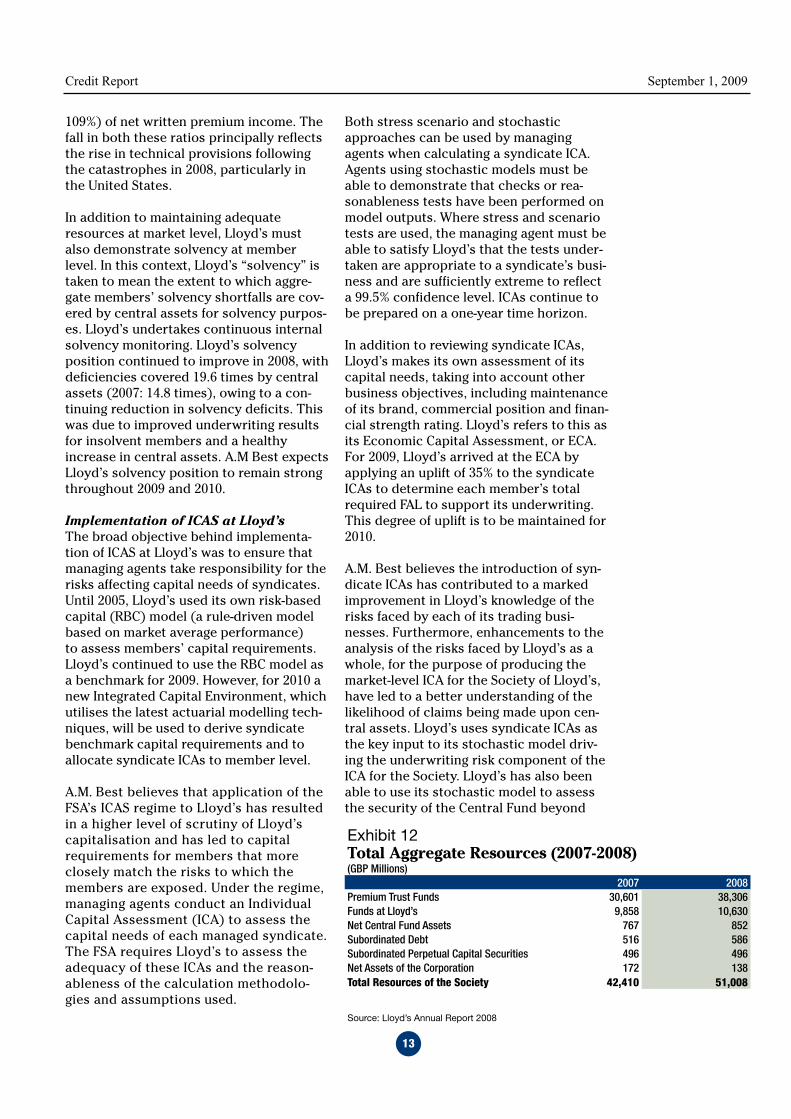
Lloyd’s total resources (see Exhibit 12) were equivalent to 143% of net syndicate technical provisions at 31 December 2008 (2007: 152%). Net resources, after deduction of liabilities and adjusted for differences between IFRS and U.K. GAAP in the Society financial statements, represent 107% (2007:
PremiumPremium Trust Funds and Overseas Regulatory Deposits
GBP 38,306m (GBP 30,601m)(several basis)
Funds at Lloyd’sGBP 10,630m (GBP 9,858m)
(several basis)Members’ Assets
Central Fund GBP 852m (GBP 767m)Subordinated Loan Notes/
Perpetual Capital Securities GBP 1,082m (GBP 1,012m)Other Central Assets GBP 138m (GBP172m)
(mutual basis)
Syndicate Loans &Members’ Annual
Contributions
Exhibit 11Chain of Security
Note: Figures are shown as at 31 December 2008 (31 December 2007).Source: Lloyd’s Annual Report 2007 and 2008
Credit Report September 1, 2009
13
109%) of net written premium income. The fall in both these ratios principally reflects the rise in technical provisions following the catastrophes in 2008, particularly in the United States.
In addition to maintaining adequate resources at market level, Lloyd’s must also demonstrate solvency at member level. In this context, Lloyd’s “solvency” is taken to mean the extent to which aggre-gate members’ solvency shortfalls are cov-ered by central assets for solvency purpos-es. Lloyd’s undertakes continuous internal solvency monitoring. Lloyd’s solvency position continued to improve in 2008, with deficiencies covered 19.6 times by central assets (2007: 14.8 times), owing to a con-tinuing reduction in solvency deficits. This was due to improved underwriting results for insolvent members and a healthy increase in central assets. A.M Best expects Lloyd’s solvency position to remain strong throughout 2009 and 2010.
Implementation of ICAS at Lloyd’sThe broad objective behind implementa-tion of ICAS at Lloyd’s was to ensure that managing agents take responsibility for the risks affecting capital needs of syndicates. Until 2005, Lloyd’s used its own risk-based capital (RBC) model (a rule-driven model based on market average performance) to assess members’ capital requirements. Lloyd’s continued to use the RBC model as a benchmark for 2009. However, for 2010 a new Integrated Capital Environment, which utilises the latest actuarial modelling tech-niques, will be used to derive syndicate benchmark capital requirements and to allocate syndicate ICAs to member level.
A.M. Best believes that application of the FSA’s ICAS regime to Lloyd’s has resulted in a higher level of scrutiny of Lloyd’s capitalisation and has led to capital requirements for members that more closely match the risks to which the members are exposed. Under the regime, managing agents conduct an Individual Capital Assessment (ICA) to assess the capital needs of each managed syndicate. The FSA requires Lloyd’s to assess the adequacy of these ICAs and the reason-ableness of the calculation methodolo-gies and assumptions used.
Both stress scenario and stochastic approaches can be used by managing agents when calculating a syndicate ICA. Agents using stochastic models must be able to demonstrate that checks or rea-sonableness tests have been performed on model outputs. Where stress and scenario tests are used, the managing agent must be able to satisfy Lloyd’s that the tests under-taken are appropriate to a syndicate’s busi-ness and are sufficiently extreme to reflect a 99.5% confidence level. ICAs continue to be prepared on a one-year time horizon.
In addition to reviewing syndicate ICAs, Lloyd’s makes its own assessment of its capital needs, taking into account other business objectives, including maintenance of its brand, commercial position and finan-cial strength rating. Lloyd’s refers to this as its Economic Capital Assessment, or ECA. For 2009, Lloyd’s arrived at the ECA by applying an uplift of 35% to the syndicate ICAs to determine each member’s total required FAL to support its underwriting. This degree of uplift is to be maintained for 2010.
A.M. Best believes the introduction of syn-dicate ICAs has contributed to a marked improvement in Lloyd’s knowledge of the risks faced by each of its trading busi-nesses. Furthermore, enhancements to the analysis of the risks faced by Lloyd’s as a whole, for the purpose of producing the market-level ICA for the Society of Lloyd’s, have led to a better understanding of the likelihood of claims being made upon cen-tral assets. Lloyd’s uses syndicate ICAs as the key input to its stochastic model driv-ing the underwriting risk component of the ICA for the Society. Lloyd’s has also been able to use its stochastic model to assess the security of the Central Fund beyond
Exhibit 12Total Aggregate Resources (2007-2008)(GBP Millions)
2007 2008Premium Trust Funds 30,601 38,306Funds at Lloyd’s 9,858 10,630Net Central Fund Assets 767 852Subordinated Debt 516 586Subordinated Perpetual Capital Securities 496 496Net Assets of the Corporation 172 138Total Resources of the Society 4�,410 51,008
Source: Lloyd’s Annual Report 2008
Credit Report September 1, 2009
14
the 99.5% threshold required for ICAs, tak-ing into account both frequency and sever-ity of loss.
Catastrophe ExposureIn A.M. Best’s opinion, the catastrophe modelling work carried out centrally by Lloyd’s continues to improve its ability to assess the market’s exposure to large loss-es and hence improve confidence in overall risk-based capital strength. Lloyd’s Realis-tic Disaster Scenarios (RDSs) are defined in detail annually by Lloyd’s and are used to evaluate aggregate market exposures as well as the exposure of each syndicate to certain major events. Syndicate-level scenarios are prepared by each managing agent, reflecting the particular characteris-tics of the business each syndicate writes.
Following an overhaul in the wake of 2005 loss experience, the event scenarios have remained relatively consistent since 2006, although the size of events has increased to reflect underlying insurable values and demographic changes. For 2008, the politi-cal risk scenario was updated to reflect the changing political environment, and for 2009, a U.K. flood scenario was included, based on a heavy rainfall event across south-east England. A.M. Best does not
expect any additional event scenarios to be introduced for 2010, although some chang-es and supplementary reporting require-ments are anticipated.
Financial FlexibilityIn A.M. Best’s opinion, the quality of the insurance industry members of Lloyd’s is a source of strength for the market. Lloyd’s continues to attract international invest-ment, particularly from other insurers drawn by its capital-efficient structure and global licences. In recent years, a number of non-Lloyd’s insurance groups have entered the market by either acquir-ing a managing agent or setting up a new syndicate.
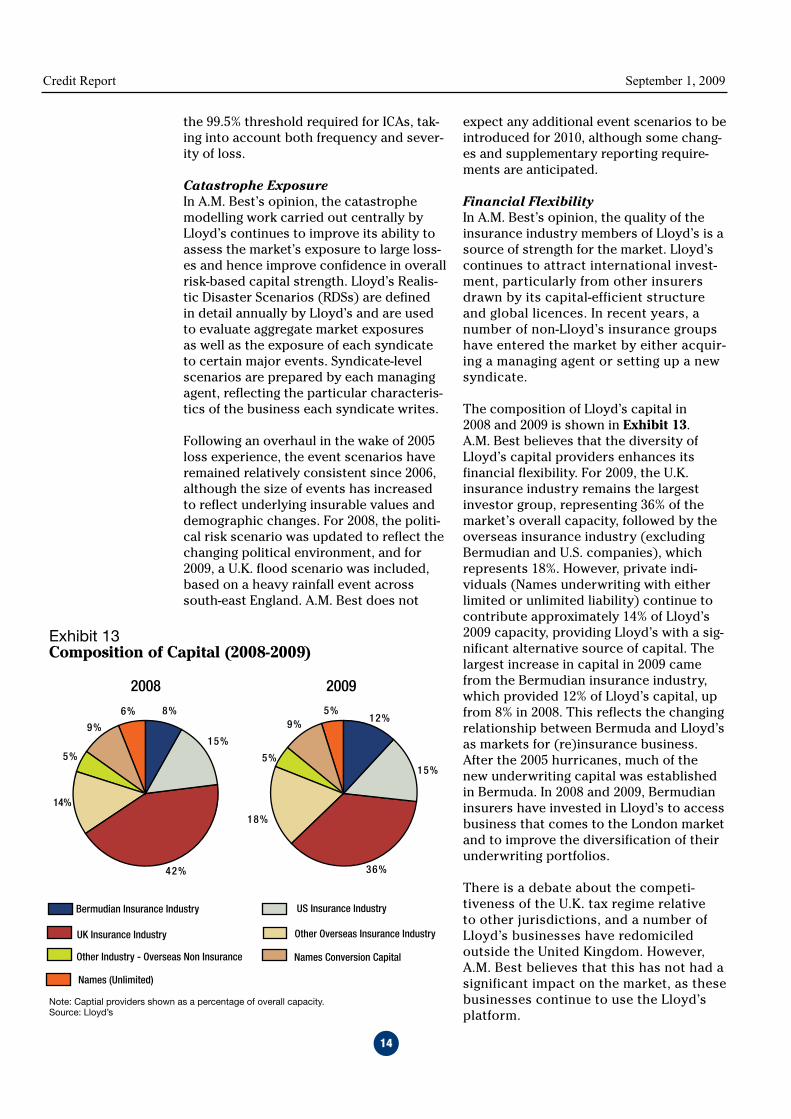
The composition of Lloyd’s capital in 2008 and 2009 is shown in Exhibit 13. A.M. Best believes that the diversity of Lloyd’s capital providers enhances its financial flexibility. For 2009, the U.K. insurance industry remains the largest investor group, representing 36% of the market’s overall capacity, followed by the overseas insurance industry (excluding Bermudian and U.S. companies), which represents 18%. However, private indi-viduals (Names underwriting with either limited or unlimited liability) continue to contribute approximately 14% of Lloyd’s 2009 capacity, providing Lloyd’s with a sig-nificant alternative source of capital. The largest increase in capital in 2009 came from the Bermudian insurance industry, which provided 12% of Lloyd’s capital, up from 8% in 2008. This reflects the changing relationship between Bermuda and Lloyd’s as markets for (re)insurance business. After the 2005 hurricanes, much of the new underwriting capital was established in Bermuda. In 2008 and 2009, Bermudian insurers have invested in Lloyd’s to access business that comes to the London market and to improve the diversification of their underwriting portfolios.
There is a debate about the competi-tiveness of the U.K. tax regime relative to other jurisdictions, and a number of Lloyd’s businesses have redomiciled outside the United Kingdom. However, A.M. Best believes that this has not had a significant impact on the market, as these businesses continue to use the Lloyd’s platform.
Exhibit 10Central Assets for Solvency (2007-2008)(GBP Millions)
Exhibit 13Composition of Capital (2008-2009)
Source: Lloyd's Annual Report 2008Source: Lloyd's
Note: Captial providers shown as a percentage of overall capacity.Source: Lloyd’s
0 500 1,000 1,500 2,000 2,500 3,000
2007
2008
Net Central Fund assets and other net assets of the Society
Subordinated loan notes and Perpetual Capital Securites
Callable Central Fund contributions
Other solvency adjustments
Names (Unlimited)
Names Conversion CapitalOther Industry - Overseas Non Insurance
Other Overseas Insurance IndustryUK Insurance Industry
US Insurance IndustryBermudian Insurance Industry
20092008
12%
15%
36%
18%
5%
9%5%8%
15%
42%
5%
14%
9%
6%
Exhibit 14Net Year-End IBNR Utilisation (2006-2008)
IBNR
Util
isat
ion
(%)
0
5
10
15
20
25
200820072006
Exhibit 16Reinsurance Debtors (2006-2008)
Source: Lloyd's
0
2
4
6
8
10
12
14
16
200820072006
GBP
Billi
ons
Net Recoverable Net Paid Debt
990 495 1082 41
939 478 1012 36
Credit Report September 1, 2009
15
Reserve QualityPost-1992 ReservingA.M. Best anticipates favourable prior year reserve development in 2009, although the size of the surplus is expected to be lower than in 2008. In each of the past four years, Lloyd’s underwriting results have been sup-ported by growing reserve releases, princi-pally relating to business written between 2002 and 2006. This trend is expected to slow as outstanding claims for these years reduce. Furthermore, the potential mag-nitude of releases from reserves for 2007 and 2008 is considered to be lower, due to the impact of softer market conditions and major losses (primarily Hurricane Ike). Claims estimates for long-tail business writ-ten in the 2001 and prior years appear to have stabilised and are likely to develop in line with current expectations.
Farther ahead, the scope for prior year releases is likely to diminish further, in part due to uncertainty surrounding the negative effect of the economic downturn on syndi-cates’ loss experience. However, material adverse development is not anticipated. A.M. Best believes lessons have been learnt from deterioration experienced in respect of U.S. casualty business written in soft market conditions between 1997 and 2001, and that Lloyd’s has since improved its reserving procedures and methodologies. There has been a concerted effort to address issues that affect Lloyd’s as a whole, including the major catastrophes and issues relating to large-scale liability claims. Additionally, all syndicate reserves are subject to indepen-dent actuarial sign-off, and this process is monitored by the Lloyd’s Actuary.
Although there is considerable uncertainty as to the impact of losses directly related to subprime and the financial crisis on the insurance industry, A.M. Best does not anticipate substantial losses at Lloyd’s, largely due to the decline in its exposure to large, U.S.-based financial institutions since 2000. The development of these claims is regularly monitored by the Market Reserv-ing department in conjunction with the Franchise Performance Directorate, which ensures that a syndicate’s reserving meth-odology is realistic.
In 2008, Lloyd’s combined ratio benefited from an overall prior year release of
GBP1,265 million (2007: GBP856 million). Positive development was driven by releas-es from reserves established for business written between 2002 and 2006 for all busi-ness lines. Even taking into account a for-eign exchange gain of GBP399 million, this substantial release exceeded A.M. Best’s expectations for the year. Claims relating to the 2005 hurricanes continued to develop within expectations.
Syndicates in run-off have historically been the principal source of reserve deteriora-tion for the Corporation. However, A.M. Best believes Lloyd’s exposure to the liabilities of existing insolvent members has significantly reduced, principally due to better management of run-off years. In 2008, a focus on promoting efficiency and finding a means to close syndicates (largely through third-party reinsurance to close syndicates) supported a fall in the number of syndicate years of account in run-off to 37 from 54 in the previous year. In addition, the improving trend in the underwriting performance of this business continued, with run-off years generating an underwrit-ing surplus of GBP39 million (2007: GBP48 million deficit). A.M. Best also believes the likelihood of new syndicates going into run-off is lower since the creation of the Fran-chise Board in 2003. The board’s strong oversight of operating syndicates allows it to identify and assist those with problems.
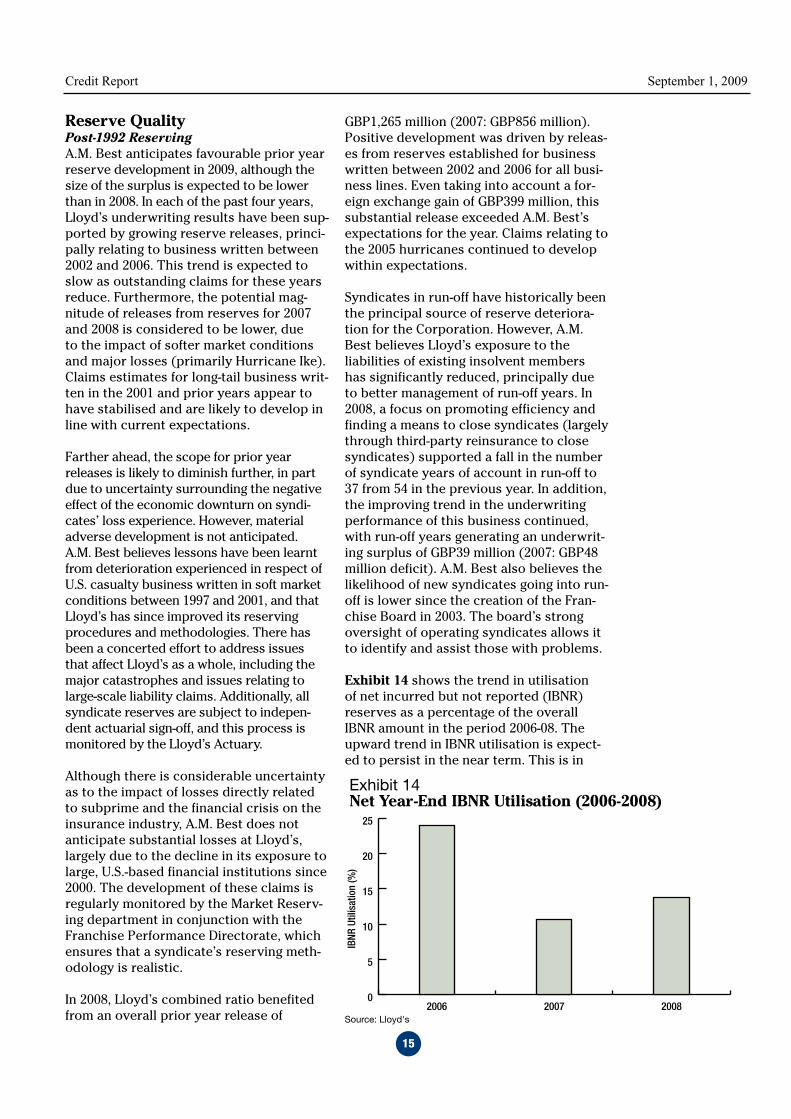
Exhibit 14 shows the trend in utilisation of net incurred but not reported (IBNR) reserves as a percentage of the overall IBNR amount in the period 2006-08. The upward trend in IBNR utilisation is expect-ed to persist in the near term. This is in
Exhibit 10Central Assets for Solvency (2007-2008)(GBP Millions)
Exhibit 13Composition of Capital (2008-2009)
Source: Lloyd's Annual Report 2008Source: Lloyd's
Note: Captial providers shown as a percentage of overall capacity.Source: Lloyd’s
0 500 1,000 1,500 2,000 2,500 3,000
2007
2008
Net Central Fund assets and other net assets of the Society
Subordinated loan notes and Perpetual Capital Securites
Callable Central Fund contributions
Other solvency adjustments
Names (Unlimited)
Names Conversion CapitalOther Industry - Overseas Non Insurance
Other Overseas Insurance IndustryUK Insurance Industry
US Insurance IndustryBermudian Insurance Industry
20092008
12%
15%
36%
18%
5%
9%5%8%
15%
42%
5%
14%
9%
6%
Exhibit 14Net Year-End IBNR Utilisation (2006-2008)
IBNR
Util
isat
ion
(%)
0
5
10
15
20
25
200820072006
Exhibit 16Reinsurance Debtors (2006-2008)
Source: Lloyd's
0
2
4
6
8
10
12
14
16
200820072006
GBP
Billi
ons
Net Recoverable Net Paid Debt
990 495 1082 41
939 478 1012 36
Credit Report September 1, 2009
16
line with A.M. Best’s view that the scope for reserve releases is diminishing.
1992 and Prior Reserving: EquitasA.M. Best believes the High Court order in June 2009, approving the statutory transfer of 1992 and prior non-life business of mem-bers and former members of Lloyd’s to Equitas Insurance Ltd., has further reduced Lloyd’s exposure to uncertainty relating to adverse development of the 1992 and prior years’ reserves.
In November 2006, Equitas entered into an agreement under which National Indemnity Co. (NIC), a subsidiary of Berkshire Hatha-way Inc., reinsured its liabilities. In the first phase of the transaction, NIC agreed to pro-vide Equitas with USD 14.4 billion of rein-surance cover for a premium comprising all of Equitas’ assets, less GBP172 million, together with an overall contribution of GBP72 million from Lloyd’s. The protection under the contract was USD 5.7 billion after taking account of Equitas’ existing undis-
counted claims reserves of USD 8.7 billion (at 31 March 2006).
Phase two comprised the transfer of busi-ness reinsured by Equitas Reinsurance Ltd. at the time of Reconstruction and Renewal in 1996, including business reinsured through Lioncover and Centrewrite, to a new insurance company within the Equitas group. The transfer committed NIC to pro-vide up to an additional USD 1.3 billion of reinsurance cover for a further premium of up to GBP40 million (Lloyd’s contribution to the premium is GBP18 million).
As a result of completion of both phases of the reinsurance transaction, policyhold-ers benefit from a total USD 7 billion of reinsurance cover from NIC over and above Equitas’ 31 March 2006 carried reserves. Lloyd’s achieves finality in respect of its 1992 and prior year non-life liabilities under U.K. law, although some uncertainty exists as to the recognition of the transfer in overseas jurisdictions.
LiquidityIn A.M. Best’s opinion, Lloyd’s is likely to maintain good overall liquidity in 2009. Man-aging agents are responsible for the invest-ment of syndicate premium trust funds. Overall, these funds exhibit a high level of liquidity, as most syndicate investment portfolios tend to consist primarily of cash and high-quality, fixed-income securities of relatively short duration. Lloyd’s monitors liquidity levels at individual syndicates as part of its capital adequacy review. The value of premium trust funds and overseas deposits increased to GBP38,306 million in 2008 (2007: GBP30,601 million).
Lloyd’s also continuously monitors pro-jected liquidity for its central assets, which are tailored to meet the disbursement requirements of the Central Fund and the Corporation of Lloyd’s (including its debt obligations). The Central Fund, corporation assets and subordinated debt increased to GBP2,072 million in 2008 (2007: 1,951 million). In April 2009, Lloyd’s bought back GBP102 million of its debt securities.
Members’ FAL increased to GBP10,630 mil-lion in 2008 (2007: 9,858 million). FAL is either provided by letters of credit (LOCs)
(2008: 57.8%) or by readily realisable assets held in trust. The financial crisis did not appear to have a discernible impact on the availability of LOCs, as the proportion of FAL supplied by LOCs had not fallen as at 31 December 2008, and syndicates were gener-ally able to renew LOCs where required.
Although the problems facing banks have raised questions about whether Lloyd’s would be able to draw on its LOCs quick-ly in the case of a large natural catastro-phe, A.M. Best believes Lloyd’s exposure to the illiquidity of LOCs is low. The Corporation closely monitors LOC issu-ers and its overall exposure to individual issuers. If an issuer were to fall below its minimum standards, members using that issuer would be required to obtain an LOC from a different issuer or provide assets instead.
Lloyd’s is required to hold trust funds in certain regions to support its underwriting operations. Lloyd’s continues to work with its advisers and the U.S. regulators to reduce the gross funding requirements in respect of insurance liabilities in the United States.

Credit Report September 1, 2009
17
ManagementA.M. Best believes that Lloyd’s has a strong governance structure in place and a multi-layered approach to enterprise risk manage-ment (ERM), which enables it to monitor and control risk within the underwriting market. At the core of Lloyd’s governance structure is the Franchise Board, the main aim of which is to oversee trading activities within the Lloyd’s market from a commercial perspective, although this does not extend to active man-agement of Lloyd’s overall business mix.
In A.M. Best’s opinion, the franchise concept is a constructive approach by Lloyd’s to maintain-ing good market performance and protecting the Central Fund. Lloyd’s monitors its syndi-cates closely and remains abreast of the leading trends that can have an impact on future perfor-mance through a network of different functional departments. It undertakes targeted reviews to address potential market issues, such as the perceived long-term lack of profitability for Gulf of Mexico-exposed offshore energy business. Lloyd’s continues to enhance the workings of the franchise structure. During 2009, the Per-formance Management Data project was imple-mented. The project involves the collection of data at a more detailed level and is expected to improve Lloyd’s ability to monitor syndicates’ performance against business plan.
The franchise structure gives Lloyd’s a clear focus on its downside risk with detailed per-formance analysis, increased sophistication in capital modelling, a clear strategy for claims and reinsurance recoveries, coordination of risk management across the franchise, and management of open years and syndicate run-offs all being drawn together to control risk and exposure. This approach allows the Franchise Board to respond quickly to potential issues that may impact the entire market.
A.M. Best believes that the financial perfor-mance of Lloyd’s following the catastrophe events of 2005 and 2008 provides some evi-dence of the effectiveness of the Franchise Board’s activities. However, this governance structure has not been tested during a sus-tained period of highly competitive pricing within the Lloyd’s market, and A.M. Best con-tinues to have some reservations as to how effective it will be under these circumstances. Lloyd’s is a market of competing businesses, each with its own independent management
structure, many of which report to large, exter-nal industry parent companies with their own commercial objectives. The Franchise Board objective of managing market performance across the cycle without at the same time man-aging Lloyd’s business mix will, in A.M. Best’s opinion, be particularly difficult to accomplish.
The Franchise Performance Directorate is responsible for approving syndicates’ business plans and monitoring performance quarterly, both against each syndicate’s original plan and actual results for similar types of business written by other syndicates. A key tool in this work was the creation of loss ratio benchmarks by risk code to determine average and median performance. One of the main aims is to identi-ty syndicates which significantly underperform against business plan. In these cases, Lloyd’s requires managing agents to explain underper-formance and how it will be improved. Should a managing agent fail to sufficiently answer these questions, Lloyd’s may apply constraints where necessary. Constraints could include limiting premium volume from a certain line of business or insisting that a syndicate purchase additional reinsurance to cover overexposure to a particular realistic disaster scenario.
A.M. Best believes that Lloyd’s adoption of a multilayered approach to ERM has promoted a strong awareness of risk both within syndicates
The Council of Lloyd’s
Franchise Board
Nominations,Appointments and
Compensation CommitteeAudit Committee
Capacity Transfer Panel Investment CommitteeMarket Supervision and
Review Committee
Exhibit 15Governance Structure
Source: Lloyd’s Annual Report 2008
Credit Report September 1, 2009
18
and the Lloyd’s market as a whole. Although each syndicate is responsible for its own ERM, a managing agent review panel, referred to as the Lloyd’s G5 Committee, makes an assess-ment of individual market franchisees for internal use. Additionally, Lloyd’s considers risks that affect the market as a whole through its Risk Committee, which focuses on franchise and Corporation of Lloyd’s risks.
The G5 committee meets monthly and is attended by key members of Lloyd’s man-agement team. Syndicates are continually monitored against key indicators of risk and performance using a risk matrix. The focus is on ensuring that each syndicate meets or exceeds Lloyd’s stated minimum standards. The purpose of the committee is to bring together franchisee risk and performance issues, enabling coordinated decision making. Included within the monitoring process are the annual Individual Capital Adequacy (ICA) assessment and reviews of each syndicate’s annual business plan (Syndicate Business Forecast) and Realistic Disaster Scenarios.
In A.M. Best’s opinion, the approach taken by Lloyd’s Risk Committee facilitates the clear articulation of Lloyd’s risk appetite.
The function of the Risk Committee is to ensure that all risks within Lloyd’s eight risk categories are identified and managed in accordance with Lloyd’s risk policy. The Financial Services Authority defines six of these major risk categories (insurance risk, operational risk, group risk, credit risk, finan-cial markets risk, liquidity risk), and the two additional risk categories (business strat-egy risk and regulatory and legal risk) are defined by Lloyd’s. Lloyd’s group risk cat-egory has been extended to include capital risk. The Risk Committee utilises a system of continuous assessment to identify where risk resides, what each risk is and the fre-quency with which it should be monitored. For each risk in the register, a risk appetite is defined, which is approved annually by the Risk Committee, Executive Team and Franchise Board. A key risk for the Lloyd’s market is the implementation of Solvency II and how to reconcile the ICA process for individual syndicates and that of the Lloyd’s market as a whole. In A.M. Best’s opinion, Lloyd’s is well advanced in its preparations and it has an agreement in principle with the Financial Services Authority on how to implement Solvency II at Lloyd’s.
ReinsuranceReinsurance is purchased at individual syn-dicate level rather than centrally by Lloyd’s. Managing agents are responsible for setting appropriate security criteria for reinsurers used on syndicate programmes. However, Lloyd’s also reviews syndicate reinsurance programmes with the aim of identifying any issues, such as a concentration of exposure
to a particular reinsurer, which could affect the financial strength of the market. Lloyd’s monitors outstanding reinsurance assets, counterparty exposure of in-force reinsur-ance programmes and purchasing trends, and tests the market’s reinsurance exposure via the RDS scenarios.
In 2008, 21% of Lloyd’s overall gross premi-ums were ceded to reinsurers. The cession to reinsurers, as a percentage of premiums, has fallen since reaching a peak of 31% in 2001. However, cession levels have remained largely stable over the past few years. The fall earlier in the decade is a consequence of the trend toward larger and fewer syndi-cates but is also due to the Franchise Per-formance Directorate’s focus on reinsurance dependence in its review of syndicate busi-ness plans and quarterly performance moni-toring. In 2008, 95% of reinsurance assets related to reinsurers rated “A-” or above (2007: 95%). The diversity of Lloyd’s reinsur-ance panel has improved, with the top 10 reinsurance groups accounting for 60% of
Exhibit 10Central Assets for Solvency (2007-2008)(GBP Millions)
Exhibit 13Composition of Capital (2008-2009)
Source: Lloyd's Annual Report 2008Source: Lloyd's
Note: Captial providers shown as a percentage of overall capacity.Source: Lloyd’s
0 500 1,000 1,500 2,000 2,500 3,000
2007
2008
Net Central Fund assets and other net assets of the Society
Subordinated loan notes and Perpetual Capital Securites
Callable Central Fund contributions
Other solvency adjustments
Names (Unlimited)
Names Conversion CapitalOther Industry - Overseas Non Insurance
Other Overseas Insurance IndustryUK Insurance Industry
US Insurance IndustryBermudian Insurance Industry
20092008
12%
15%
36%
18%
5%
9%5%8%
15%
42%
5%
14%
9%
6%
Exhibit 14Net Year-End IBNR Utilisation (2006-2008)
IBNR
Util
isat
ion
(%)
0
5
10
15
20
25
200820072006
Exhibit 16Reinsurance Debtors (2006-2008)
Source: Lloyd's
0
2
4
6
8
10
12
14
16
200820072006
GBP
Billi
ons
Net Recoverable Net Paid Debt
990 495 1082 41
939 478 1012 36

Credit Report September 1, 2009
19
total reinsurance assets in 2008 (excluding reinsurance placed with Lloyd’s), down from 62% in 2007.
Exhibit 16 shows the development in Lloyd’s net recoverables and total net paid debt. The increase in total net reinsurance recoverables in 2008 to GBP10.5 billion (2007: GBP7.8 billion) largely reflects the impact
of above-average catastrophe experience and foreign exchange adjustments. The value of net aged debt continued to fall, with net aged debt greater than 6 months standing at GBP161 million in 2008, com-pared with GBP251 million in 2007. This represents 20% of net paid debt, which increased in 2008 to GBP798 million from GBP786 million in 2007.
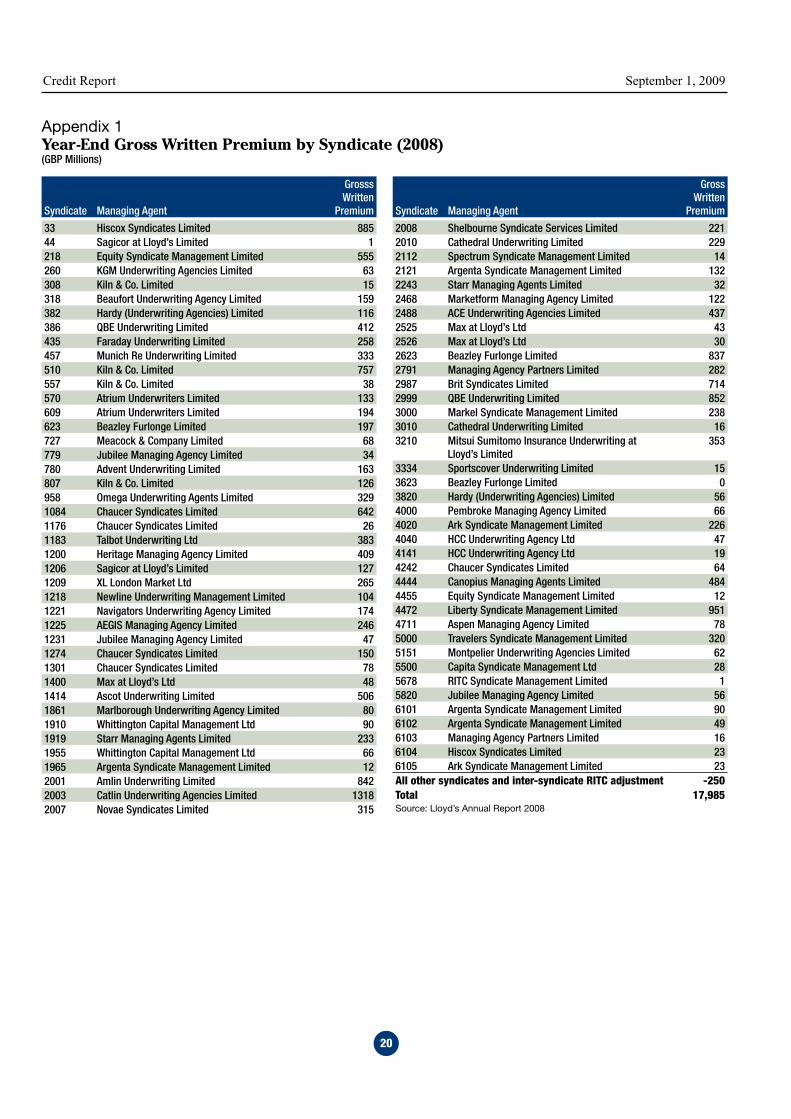
Credit Report September 1, 2009
�0
Appendix 1 Year-End Gross Written Premium by Syndicate (2008) (GBP Millions)
Syndicate Managing Agent
Grosss Written
Premium Syndicate Managing Agent
Gross Written
Premium
33 Hiscox Syndicates Limited 88544 Sagicor at Lloyd’s Limited 1218 Equity Syndicate Management Limited 555260 KGM Underwriting Agencies Limited 63308 Kiln & Co. Limited 15318 Beaufort Underwriting Agency Limited 159382 Hardy (Underwriting Agencies) Limited 116386 QBE Underwriting Limited 412435 Faraday Underwriting Limited 258457 Munich Re Underwriting Limited 333510 Kiln & Co. Limited 757557 Kiln & Co. Limited 38570 Atrium Underwriters Limited 133609 Atrium Underwriters Limited 194623 Beazley Furlonge Limited 197727 Meacock & Company Limited 68779 Jubilee Managing Agency Limited 34780 Advent Underwriting Limited 163807 Kiln & Co. Limited 126958 Omega Underwriting Agents Limited 3291084 Chaucer Syndicates Limited 6421176 Chaucer Syndicates Limited 261183 Talbot Underwriting Ltd 3831200 Heritage Managing Agency Limited 4091206 Sagicor at Lloyd’s Limited 1271209 XL London Market Ltd 2651218 Newline Underwriting Management Limited 1041221 Navigators Underwriting Agency Limited 1741225 AEGIS Managing Agency Limited 2461231 Jubilee Managing Agency Limited 471274 Chaucer Syndicates Limited 1501301 Chaucer Syndicates Limited 781400 Max at Lloyd’s Ltd 481414 Ascot Underwriting Limited 5061861 Marlborough Underwriting Agency Limited 801910 Whittington Capital Management Ltd 901919 Starr Managing Agents Limited 2331955 Whittington Capital Management Ltd 661965 Argenta Syndicate Management Limited 122001 Amlin Underwriting Limited 8422003 Catlin Underwriting Agencies Limited 13182007 Novae Syndicates Limited 315
2008 Shelbourne Syndicate Services Limited 2212010 Cathedral Underwriting Limited 2292112 Spectrum Syndicate Management Limited 142121 Argenta Syndicate Management Limited 1322243 Starr Managing Agents Limited 322468 Marketform Managing Agency Limited 1222488 ACE Underwriting Agencies Limited 4372525 Max at Lloyd’s Ltd 432526 Max at Lloyd’s Ltd 302623 Beazley Furlonge Limited 8372791 Managing Agency Partners Limited 2822987 Brit Syndicates Limited 7142999 QBE Underwriting Limited 8523000 Markel Syndicate Management Limited 2383010 Cathedral Underwriting Limited 163210 Mitsui Sumitomo Insurance Underwriting at
Lloyd’s Limited353
3334 Sportscover Underwriting Limited 153623 Beazley Furlonge Limited 03820 Hardy (Underwriting Agencies) Limited 564000 Pembroke Managing Agency Limited 664020 Ark Syndicate Management Limited 2264040 HCC Underwriting Agency Ltd 474141 HCC Underwriting Agency Ltd 194242 Chaucer Syndicates Limited 644444 Canopius Managing Agents Limited 4844455 Equity Syndicate Management Limited 124472 Liberty Syndicate Management Limited 9514711 Aspen Managing Agency Limited 785000 Travelers Syndicate Management Limited 3205151 Montpelier Underwriting Agencies Limited 625500 Capita Syndicate Management Ltd 285678 RITC Syndicate Management Limited 15820 Jubilee Managing Agency Limited 566101 Argenta Syndicate Management Limited 906102 Argenta Syndicate Management Limited 496103 Managing Agency Partners Limited 166104 Hiscox Syndicates Limited 236105 Ark Syndicate Management Limited 23All other syndicates and inter-syndicate RITC adjustment -�50Total 17,985Source: Lloyd’s Annual Report 2008
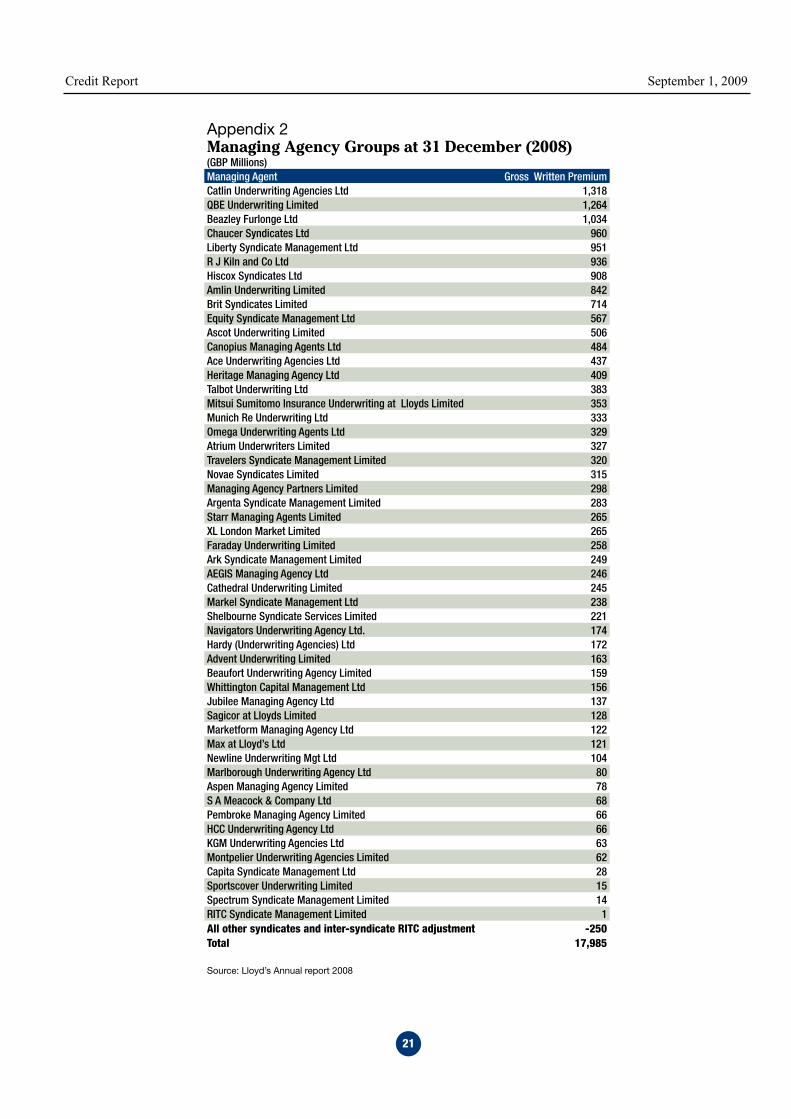
Credit Report September 1, 2009
�1
Appendix 2Managing Agency Groups at 31 December (2008)(GBP Millions)Managing Agent Gross Written PremiumCatlin Underwriting Agencies Ltd 1,318QBE Underwriting Limited 1,264Beazley Furlonge Ltd 1,034Chaucer Syndicates Ltd 960Liberty Syndicate Management Ltd 951R J Kiln and Co Ltd 936Hiscox Syndicates Ltd 908Amlin Underwriting Limited 842Brit Syndicates Limited 714Equity Syndicate Management Ltd 567Ascot Underwriting Limited 506Canopius Managing Agents Ltd 484Ace Underwriting Agencies Ltd 437Heritage Managing Agency Ltd 409Talbot Underwriting Ltd 383Mitsui Sumitomo Insurance Underwriting at Lloyds Limited 353Munich Re Underwriting Ltd 333Omega Underwriting Agents Ltd 329Atrium Underwriters Limited 327Travelers Syndicate Management Limited 320Novae Syndicates Limited 315Managing Agency Partners Limited 298Argenta Syndicate Management Limited 283Starr Managing Agents Limited 265XL London Market Limited 265Faraday Underwriting Limited 258Ark Syndicate Management Limited 249AEGIS Managing Agency Ltd 246Cathedral Underwriting Limited 245Markel Syndicate Management Ltd 238Shelbourne Syndicate Services Limited 221Navigators Underwriting Agency Ltd. 174Hardy (Underwriting Agencies) Ltd 172Advent Underwriting Limited 163Beaufort Underwriting Agency Limited 159Whittington Capital Management Ltd 156Jubilee Managing Agency Ltd 137Sagicor at Lloyds Limited 128Marketform Managing Agency Ltd 122Max at Lloyd’s Ltd 121Newline Underwriting Mgt Ltd 104Marlborough Underwriting Agency Ltd 80Aspen Managing Agency Limited 78S A Meacock & Company Ltd 68Pembroke Managing Agency Limited 66HCC Underwriting Agency Ltd 66KGM Underwriting Agencies Ltd 63Montpelier Underwriting Agencies Limited 62Capita Syndicate Management Ltd 28Sportscover Underwriting Limited 15Spectrum Syndicate Management Limited 14RITC Syndicate Management Limited 1All other syndicates and inter-syndicate RITC adjustment -�50Total 17,985
Source: Lloyd’s Annual report 2008
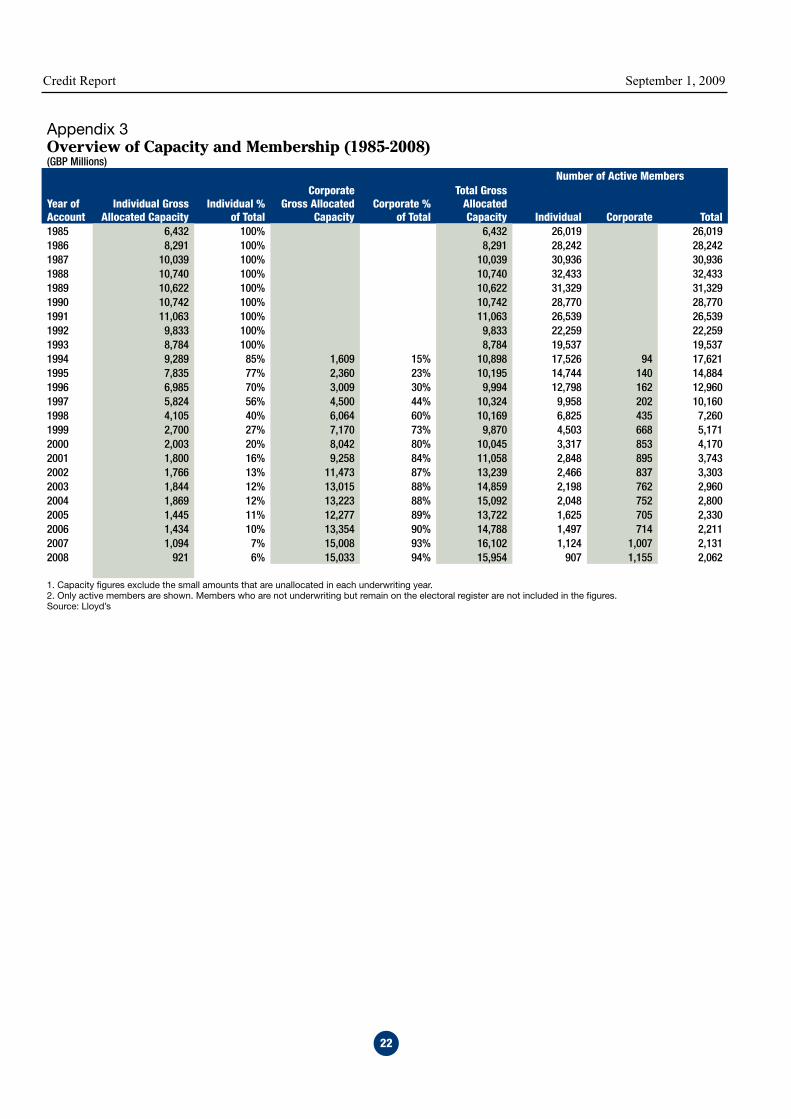
Credit Report September 1, 2009
��
Appendix 3Overview of Capacity and Membership (1985-2008)(GBP Millions)
Number of Active Members
Year of Account
Individual Gross Allocated Capacity
Individual % of Total
Corporate Gross Allocated
Capacity Corporate %
of Total
Total Gross Allocated Capacity Individual Corporate Total
1985 6,432 100% 6,432 26,019 26,0191986 8,291 100% 8,291 28,242 28,242 1987 10,039 100% 10,039 30,936 30,936 1988 10,740 100% 10,740 32,433 32,433 1989 10,622 100% 10,622 31,329 31,329 1990 10,742 100% 10,742 28,770 28,770 1991 11,063 100% 11,063 26,539 26,539 1992 9,833 100% 9,833 22,259 22,259 1993 8,784 100% 8,784 19,537 19,537 1994 9,289 85% 1,609 15% 10,898 17,526 94 17,621 1995 7,835 77% 2,360 23% 10,195 14,744 140 14,884 1996 6,985 70% 3,009 30% 9,994 12,798 162 12,960 1997 5,824 56% 4,500 44% 10,324 9,958 202 10,160 1998 4,105 40% 6,064 60% 10,169 6,825 435 7,260 1999 2,700 27% 7,170 73% 9,870 4,503 668 5,171 2000 2,003 20% 8,042 80% 10,045 3,317 853 4,170 2001 1,800 16% 9,258 84% 11,058 2,848 895 3,743 2002 1,766 13% 11,473 87% 13,239 2,466 837 3,303 2003 1,844 12% 13,015 88% 14,859 2,198 762 2,960 2004 1,869 12% 13,223 88% 15,092 2,048 752 2,800 2005 1,445 11% 12,277 89% 13,722 1,625 705 2,330 2006 1,434 10% 13,354 90% 14,788 1,497 714 2,211 2007 1,094 7% 15,008 93% 16,102 1,124 1,007 2,131 2008 921 6% 15,033 94% 15,954 907 1,155 2,062
1. Capacity figures exclude the small amounts that are unallocated in each underwriting year.2. Only active members are shown. Members who are not underwriting but remain on the electoral register are not included in the figures.Source: Lloyd’s

Credit Report September 1, 2009
�3
Appendix 4Pro Forma Financial Statements (2004-2008) (GBP Millions)
�008 �007 �006 �005 �004Gross written premium 17,985 16,366 16,414 14,982 14,614Reinsurance ceded 3,768 3,110 3,213 3,212 2,880Net written premium 14,217 13,256 13,201 11,770 11,734Increase/(decrease) in gross UPR -558 -237 -644 230 380Reinsurers’ share in UPR 137 78 131 -215 -317Earned premiums 13,796 13,097 12,688 11,785 11,797
Other technical incomeTotal underwriting income 13,796 13,097 12,688 11,785 11,797Net claims paid 7,578 6,226 6,598 6,763 5,420Net increase/(decrease) in claims provision 886 321 -379 2,742 2,226Net claims incurred 8,464 6,547 6,219 9,505 7,646
Management expenses 1267 1117 910 872 880Acquisition expenses 3,720 3,449 3,191 2,913 2,805Net operating expenses 4,987 4,566 4,101 3,785 3,685Other technical expenses -853 -115 226 -117 70Total underwriting expenses 4,134 4,451 4,327 3,668 3,755Balance on technical account 1,198 2,099 2,142 -1,388 396
Net investment income 1,032 2,096 1,729 1,498 1,167Other expenses -331 -349 -209 -213 -196Profit/(loss) before tax 1,899 3,846 3,662 -103 1,367Other recognised gains and losses 619 106 38 42 -22Total recognised gains and losses �,518 3,95� 3,700 -61 1,345
Source: Lloyd’s Annual Report 2008

Founded in 1899, A.M. Best Company is a global full-ser-vice credit rating organization dedicated to serving the financial and health care service industries, including insurance companies, banks, hospitals and health care system providers.For more information, visit www.ambest.com or contact one of our offices.
A.M. Best Company Ambest Road
Oldwick, New Jersey 08858 Phone: (908) 439-2200
Fax: (908) 439-3296 www.ambest.com
A.M. Best Europe Ltd. 12 Arthur Street, 6th Floor
London, UK EC4R 9AB Phone: (44) 20 7626 6264
Fax: (44) 20 7626 6265 www.ambest.co.uk
A.M. Best Asia-Pacific Ltd. Unit 4004 Central Plaza
18 Harbour Road Wanchai, Hong Kong
Phone: (852) 2827-3400 Fax: (852) 2824 -1833 www.ambest.com.hk


![LLOYD’S LAW REPORTS 331 ART 7 - oeclaw.co.uk · 149, Société Eram Shipping Co Ltd v Compagnie Internationale de Navigation [2003] 2 Lloyd’s Rep 405 ; [2004] 1 AC 260, applied](https://img.dokumen.tips/doc/110x75/5e7b1fc115406f053d10437f/lloydas-law-reports-331-art-7-149-socit-eram-shipping-co-ltd-v-compagnie.jpg)
![LLOYD’S LAW REPORTS - KPMG...2005] Vol. 1 LLOYD’S LAW REPORTS 67 ‘.A.] Through Transport Mutual v. New India Assurance Co. Ltd. PART 2 COURT OF APPEAL Dec. 2, 2004 THROUGH TRANSPORT](https://img.dokumen.tips/doc/110x75/5e7b20fc6c25d3684e71d082/lloydas-law-reports-kpmg-2005-vol-1-lloydas-law-reports-67-aa-through.jpg)


![LLOYD’S LAW REPORTS - bvz-abdm.be76 LLOYD’S LAW REPORTS [2015] Vol 1 PART 2 [QBD (Comm Ct) ——— Held by QBD (Comm Ct) (Stephen HOFMEYR QC, Deputy Judge) that t he claim fa](https://img.dokumen.tips/doc/110x75/5e7b20fc6c25d3684e71d085/lloydas-law-reports-bvz-abdmbe-76-lloydas-law-reports-2015-vol-1-part-2.jpg)


![Enforcement QBD (Comm Ct)] The “Prestige” LLOYD’S LAW ......138 LLOYD’S LAW REPORTS [2014] Vol 1 The “Prestige” [QBD (Comm Ct) solicitors complained that. at the time of](https://img.dokumen.tips/doc/110x75/5e7b20fd6c25d3684e71d087/enforcement-qbd-comm-ct-the-aoeprestigea-lloydas-law-138-lloydas.jpg)