Embed Size (px)
Citation preview

NCHRP PROJECT 20-65(56)
Best Practices in Rural Regional Mobility
Final Report
Prepared for National Cooperative Highway Research Program
Transportation Research Board of
The National Academies
KFH Group, Incorporated Bethesda, MD
Under Subcontract to:
Cambridge Systematics, Inc.
March 2017


ACKNOWLEDGMENT OF SPONSORSHIP
This work was sponsored by one or more of the following as noted:
XAmerican Association of State Highway and Transportation Officials, in cooperation with the Federal Highway Administration, and was conducted in the National Cooperative Highway Research Program,
Federal Transit Administration and was conducted in the Transit Cooperative Research Program,
Federal Aviation Administration and was conducted in the Airport Cooperative Research Program,
Research and Innovative Technology Administration and was conducted in the National Cooperative Freight Research Program,
Pipeline and Hazardous Materials Safety Administration and was conducted in the Hazardous Materials Cooperative Research Program,
Federal Railroad Administration and was conducted in the National Cooperative Rail Research Program,
which is administered by the Transportation Research Board of the National Academies.
DISCLAIMER
This is an uncorrected draft as submitted by the Contractor. The opinions and conclusions expressed
or implied herein are those of the Contractor. They are not necessarily those of the Transportation
Research Board, the National Academies, or the program sponsors.

This page intentionally left blank.

i
T A B L E O F C O N T E N T S
Chapter 1: Rural Regional Defined ...................................................... 1
Research Objective ......................................................................................1 Rural Regional Defined ................................................................................1 Why Focus on Rural Regional? ....................................................................5 The Need for Rural Regional Public Transportation Services ......................5 Five Myths about Rural Regional Transit Services .......................................6 Organization of This Report ..........................................................................8
Chapter 2: Literature Review ............................................................... 11
Study Process ..............................................................................................11 Relevant Published Reports .........................................................................11 PowerPoint Presentation from the TRB Rural and Intercity Bus Conferences ......................................................................................17 Conclusions Regarding the Literature Review ..............................................20 References ...................................................................................................21
Chapter 3: Identification of Case Studies ............................................. 23
Introduction ..................................................................................................23 Published Data .............................................................................................23 Classification Characteristics ........................................................................25 Rural Regional Transit Service Criteria ........................................................25 Approach to Categorizing States ..................................................................27 State Policy and Support for rural Regional transit Services ........................27 Survey of the States .....................................................................................28 Survey Issues ...............................................................................................30 State Programs, Regional Organizations and Regional Services .................31 Selection of Case Studies ............................................................................31 References ...................................................................................................44

ii
Chapter 4: Case Studies ...................................................................... 45 Introduction ...................................................................................................45 Case Study: California – Lake Transit Authority ...........................................47 Case Study: Colorado – Colorado DOT Statewide Network, Bustang and South Central Council of Governments ...............................55 Case Study: Iowa – Regional XII Council of Governments Western Iowa Transit, Denison to Harlan Commuter Service...................63 Case Study: Kansas – Statewide Regional Transit Model, Flint Hills and Implementation and Transportation Works for Kansas….. .69 Case Study: Maine – Portland Intercity Service, ShuttleBus-Zoom ..............79 Case Study: Michigan – Alger County Transit ..............................................85 Case Study: Minnesota – Minnesota DOT, Central Community Transit Implementation “Transit for Our Future” Initiative .....................................93 Case Study: Montana- Flathead Transit and North Central Montana Transit and Regional Connections Fostered Through Community Organizations ..........................................................99 Case Study: New Mexico – New Mexico Regional Transit Districts, North Central Regional Transit District .....................................................109 Case Study: Oregon – Oregon DOT Transit Network Program and Northwest Connector Program ..........................................................119 Case Study: Vermont – Rural Regional Services, Joint Schedules on Regional Routes ..................................................................................131 Case Study: Wisconsin – Regional Service in Southwest Wisconsin, Scenic Mississippi Regional Transit Bus ..................................................139
Chapter 5: Lessons Learned - Toolkit .................................................. 147
Introduction ...................................................................................................147 Lesson One: State Policies Can Make a Difference .....................................147 Lesson Two: Different Organizational Approaches Can Work ......................149 Lesson Three: Local Champions Are Required ............................................151 Lesson Four: The Needs of Multiple Markets Should Be Addressed ............152 Lesson Five: An Appropriate Service Design Will Attract More Riders .........155 Lesson Six: Connectivity and Information Are Important ..............................158 Lesson Seven: Creative Funding May Be Needed .......................................161 Summary of Lessons Learned ......................................................................167
Chapter 6: Developing a Rural Regional Route - Checklist .................. 169 Appendix A: Ratio of Intercity 5311 Subrecipients and Subrecipients That Will Serve Multi State Areas ........................................................................A-1 Appendix B: Bus Facilities Serving Intercity and Local Regions ..............................B-1 Appendix C: Rural Regional Mobility Survey ...........................................................C-1

iii
Appendix A: Ration of Intercity 5311 Subrecipients and Subrecipients that Serve Multi-State Areas Appendix B: Bus Facilities Serving Intercity and Local Regions Appendix C: Rural Regional Mobility Survey

This page intentionally left blank.

Rural Regional Defined
1
C H A P T E R 1 : R U R A L R E G I O N A L D E F I N E D
Research Objective The overall objective of this research project has been to identify and evaluate practices used by state
departments of transportation (DOTs), rural regional planning agencies, and transit providers to plan and provide for rural regional mobility - focusing on policies and programs that support services that can meet the Federal Transit Administration (FTA) definition of “public transportation” or the FTA definition of “intercity bus transportation”. The initial focus was on practices that effectively blend these two modes and could be supported with rural transit funding provided under the FTA Section 5311 rural transit program or the Section 5311(f) rural intercity bus program. The study also sought to identify examples of rural regional services that address human service transportation needs as well as general public services. The study focuses not just on regional services, but also on the role of state transit program policies and regional planning agencies in the development of rural regional services.
Rural Regional Defined
Based on this research objective, the focus of this study is on services that fall in in the middle ground between intercity bus service and rural public transportation. The FTA guidance defines intercity bus service as “regularly scheduled bus service for the general public that operates with limited stops over fixed routes connecting two or more urban areas not in close proximity, that has the capacity for transporting baggage carried by passengers, and that makes meaningful connections with scheduled intercity bus service to more distant points, if such service is available.” Rural public transportation is defined as: “Surface transportation by conveyance that provides regular and continuing general or special transportation to the public, but does not include school bus, charter, or intercity bus transportation” that is provided in “non-urbanized area” which” includes rural areas and urban areas under 50,000 in population not included in an urbanized area.”
The Preliminary Scope suggests that rural regional mobility is typically “intra-state, cross-county
transportation” and would include, for example, trips to a regional medical center (e.g., a Veterans Administration Medical Center) for non-emergency services, to a community college, or to access other transportation modes for longer distance travel (e.g., to an intercity bus terminal or airport). The scope for this study noted that rural regional services fall in the gray area between other types of rural transportation services.
Figure 1 presents a Venn diagram depicting the relationship between rural regional, intercity bus, local transit and human service transportation. Rural regional services overlap each mode of transit, but there is a substantial space that is uniquely rural regional.

Rural Regional Defined
2
Figure 1. Rural regional mobility relationships
Building on the definitions of both rural public transportation and intercity bus service., Rural regional
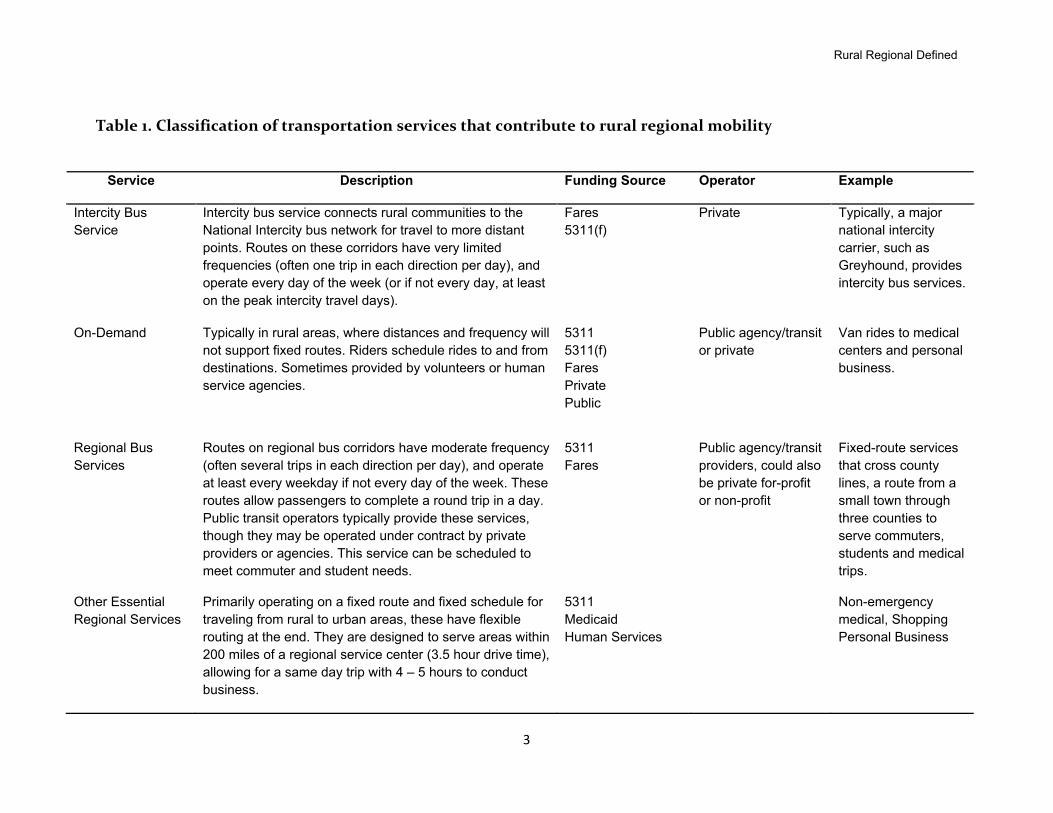
mobility service, also referred to as rural regional transit, is defined as one that provides transportation for the general public from a rural area across the county, or other jurisdictional boundaries1, to serve a destination that has services (e.g., medical, educational, employment, retail, government) not available in the rural area. Often the destination of such services is a larger, more urban location, which we are calling a regional activity center, as a general term for a place that offers services needed but not available in more rural trip origin areas. Rural regional mobility service may be supported with FTA S. 5311 and/or S. 5311(f) and S. 5311(c) funds and may be supplemented with other federal, state, or local funds in addition to passenger fares. Table 1 presents a classification of services that contribute to rural regional mobility. The primary focus of this study is on regional services described in the bottom two rows.
1 Although the study scope referred to such services as intra-state, we anticipate that some systems or providers have developed regional services that cross-state lines, and so we may well document such cases and include relevant best practices needed for such services (for example meeting Federal Motor Carrier Safety Administration requirements).
Human Service Transportation
Intercity Bus
Rural Regional
Services
Local Public Transit
Rural Regional Defined
3
Table 1. Classification of transportation services that contribute to rural regional mobility
Service Description Funding Source Operator Example
Intercity Bus Service
Intercity bus service connects rural communities to the National Intercity bus network for travel to more distant points. Routes on these corridors have very limited frequencies (often one trip in each direction per day), and operate every day of the week (or if not every day, at least on the peak intercity travel days).
Fares 5311(f)
Private Typically, a major national intercity carrier, such as Greyhound, provides intercity bus services.
On-Demand Typically in rural areas, where distances and frequency will not support fixed routes. Riders schedule rides to and from destinations. Sometimes provided by volunteers or human service agencies.
5311 5311(f) Fares Private Public
Public agency/transit or private
Van rides to medical centers and personal business.
Regional Bus Services
Routes on regional bus corridors have moderate frequency (often several trips in each direction per day), and operate at least every weekday if not every day of the week. These routes allow passengers to complete a round trip in a day. Public transit operators typically provide these services, though they may be operated under contract by private providers or agencies. This service can be scheduled to meet commuter and student needs.
5311 Fares
Public agency/transit providers, could also be private for-profit or non-profit
Fixed-route services that cross county lines, a route from a small town through three counties to serve commuters, students and medical trips.
Other Essential Regional Services
Primarily operating on a fixed route and fixed schedule for traveling from rural to urban areas, these have flexible routing at the end. They are designed to serve areas within 200 miles of a regional service center (3.5 hour drive time), allowing for a same day trip with 4 – 5 hours to conduct business.
5311 Medicaid Human Services
Non-emergency medical, Shopping Personal Business

Rural Regional Defined
4
The need for a distinction between rural regional mobility services and intercity services lies in the Section 5311(f) requirement for a meaningful connection to the national intercity bus network. The FTA defines meaningful connection in terms of schedule coordination and shared stop locations with the national network. Developing regional services that can be funded with Section 5311(f) depends on being able to make a meaningful connection. In many cases the required schedule makes using the service for commuting, medical trips, or community college classes impossible. The type of morning in- evening out schedule needed to address trip needs will rarely coincide with the schedule needed to make a meaningful connection to the national intercity bus network. Optimal regional service would meet both needs, and is theoretically possible but likely to be rare. For purposes of this study, the focus should be on regional services that address the kinds of trips than can be made in a day, rather than overnight (or longer trips), while considering possibilities for also meeting intercity needs (and using intercity funding). The intercity program may well be a tool in the toolbox used to create regional services, but the focus of this study is on services that meet a different distinct need (even if they can sometimes be designed to qualify as intercity services).
A key aspect of this definition is that it involves service open to the general public, rather than
dedicated human service transportation (such as Medicaid Non-Emergency Medical Transportation (NEMT)). Dedicated services may be required to meet client needs, but often they are provided because there is no public transit service that makes regional trips. Our focus is on identifying those services and determining how they can be developed elsewhere. It is anticipated that human service agency trips could be provided through agency payment of a fare or participation in funding. Human service trips are not excluded, but we do not see the study as focusing on transportation exclusively provided to client groups that have eligibility requirements based on trip purpose, age, income or eligibility requirements. While it is likely that in many places there is regional transportation provided for NEMT, we believe this is not a study of long-distance NEMT services; though it could address public services that could be used by NEMT clients.
In this case, the general definition of rural regional mobility services includes transit services that: are scheduled, are open to the general public (though they may also carry agency clients), operate on longer routes that cross county lines, connect non-urbanized areas (places under 50,000 population) to each other and to urbanized areas
(over 50,000), and are scheduled to permit a round-trip within a day, allowing the user to spend several hours at their
destination.
Excluded from the scope of this study are demand response services, particularly those that have client eligibility requirements, even if they cross city- or county-jurisdictional boundaries. Long distance Medicaid client trips are an important part of the overall need for regional public transportation, however the focus here is on services open to the general public (which could be used by Medicaid clients) rather than specialized services.

Rural Regional Defined
5
Why Focus on Rural Regional? Increasingly, statewide transit needs studies, local public transportation and human service
transportation coordination plans, and the consultation process required by the FTA for the Section 5311(f) rural intercity program have all identified needs for regional transit services.
The Need Has Always Existed The need for these trips has existed for a long time, and was once met by the private for-profit intercity
bus companies. Under the system of federal and state regulation, they were forced to cross-subsidize services from more profitable interstate services and charter business. As ridership declined, the bus industry began to reduce them, and by the time many human service and community action programs came into being during the 1960s and 1970s, programs found that they needed to provide transportation to their clients to allow them to access program services. These services formed the basis of today’s rural public and coordinated human service transportation programs. The role of intercity bus firms in providing regional trips from rural areas declined significantly following deregulation of the intercity bus industry in 1982, as they could abandon unprofitable rural service. The reduction in rural services has continued since that time, and by 2010 the scheduled intercity bus industry served approximately 2,3402 places, compared to over 15,0003 in 1982.
During this period the rural public transportation industry developed, and at this point there are 1,357
Section 5311 subrecipients providing transportation in rural areas.4 With limited funding, often with eligibility requirements for potential users, rural transit operators focused on the most critical trips by the most transportation disadvantaged populations: medical trips by low-income persons, trips by seniors to nutrition sites and senior centers, and trips by persons with disabilities. For the most part needs were local in nature. States distributed funding to local jurisdictions, and local governments provided the required match. The organizations that developed focused on providing local services, with services not provided outside city or county boundaries.
The Need for Rural Regional Public Transportation Services
The need for regional trips initially became apparent as persons needing specialized medical services provided only at major medical centers had to travel outside jurisdictional boundaries to obtain needed services. The Medicaid program was required to provide longer distance, regional trips for Medicaid-eligible persons without their own transportation. Non-emergency transportation for Medicaid clients continues to be a major element of the need for regional transportation services from rural areas. Other needs have arisen or become more apparent in recent years for a variety of reasons including:
2 U.S. Department of Transportation, Research and Innovative Technology Administration, The U.S. Rural Population and Scheduled Intercity Transportation in 2010: A Five-Year Decline in Transportation Access, February 2011, p. 3. 3 Transportation Research Board, Transportation Research News, No. 225, March-April 2003, “Intercity Bus Links: Moving Into New Territory,” p. 25-26 4 Jeremy Matson, Rural Transit Fact Book 2014, Upper Great Plains Transportation Institute, Small Urban and Rural Transit Center, North Dakota State University, for the U.S. Department of Transportation, August 2014, p. 10.

Rural Regional Defined
6
Employment - Commuter transportation from rural areas to employment outside the immediate area (restructuring of manufacturing due to automation and globalization, and consolidation).
Education - Access to regional community colleges, training programs, state colleges and universities. The mean distance from a student’s home to college is 31 miles to public two-year schools, and 82 miles to public four-year schools.5 These are regional trips.
Medical – In addition to Medicaid, there are other riders who need to access specialized services in regional centers. Changes in health care funding have combined with difficulties in staffing rural medical centers. From 2010 to 2014, 47 rural hospitals ceased providing inpatient services, of which 26 closed entirely and 21 continued to provide some health care services6. Analysis of the impacts of closures reveals that “Survey respondents from the markets of the closed hospitals perceived increased travel distances to health care as a stressor and a risk to the health of those communities.” 7
Shopping – A concentration of shopping in big-box stores replaced many small-town retail
businesses; and now big-box stores are eliminating smaller rural stores and concentrating operations in regional supercenters. This trend can be seen in Walmart’s recent closing of 154 stores, which disproportionately affected low-income and rural areas.8
Social and recreational - Loss of intercity service means social and recreational trips need to be addressed by rural regional, including visits to family (for occasions), friends, parks and recreation sites.
Programs that are funding or providing local transit say they are unable to address needs, and intercity
bus services provided by the market or funded by Section 5311(f) often do not meet these needs because they are scheduled to provide connections between major cities. Section 5311(f) funding requires that services provide a meaningful connection with the national intercity bus network wherever possible. In many cases resulting services are unable to address needs because meaningful connections may not provide schedules useful for regional trips. The rural public transportation community has begun to deal with the need to provide regional trips, as will be evident from the case studies and analysis in this report.
Five Myths about Rural Regional Transit Services9 Without presenting the full results, but in an effort to whet the appetite, the study reveals that there are
a number of myths about rural services that can be put to rest. The following sections describe these myths.
5 Nicholas Hillman, and Taylor Weichman, Education Deserts: The Continued Significance of “Place”in the Twenty-First Century. Viewpoints: Voices from the Field. American Council on Education, Washington, D.C. 2016. 6 Sharita R. Thomas, MPP; Brystana G. Kaufman, BA; Randy K. Randolph, MRP; Kristie Thompson, MA; Julie R. Perry; George H. Pink, PhD. “A Comparison of Closed Rural Hospitals and Perceived Impact”; Findings Brief, NC Rural Health Research Program, April 2015. 7 Ibid., p 1. 8 Tim Meko and Lydia DePillis, https://www.washingtonpost.com/news/wonk/wp/2016/02/05/what-happens-to-a-tiny-town-when-walmart-disappears/. 9 The use of the Five Myths format is inspired by the ongoing “Five Myths About” section in the Outlook section of the Sunday Washington Post.

Rural Regional Defined
7
It’s Not Allowed Many rural transit operators believe or assume that some regulation prohibits them from trips that
cross jurisdictional boundaries. In some cases this appears to arise from the fact that states allocate federal funding to jurisdictions, and that those jurisdictions provide the local match. However, federal programs do not restrict services to particular jurisdictions. Similarly, there is generally no state funding or administrative restriction preventing transit operators from creating regional routes. Some states have requirements in their state transit program authorizing legislation that requires local transit systems to notify jurisdictions outside their designated service area if they intend to provide service into that jurisdiction. For example, Ohio requires transit authorities seeking to provide transit service into a political jurisdiction outside the boundaries of the authority to provide prior notice to the legislative authority of that political jurisdiction which then have 30 days to comment.
Some states provide statutory tools that allow local governments to create regional transit
organizations while others have legislation creating regional transit entities as a basis for funding. Even in these cases, allowing or supporting regional organizations may not necessarily result in rural regional services, and states have to support the development of regional services through policy actions such as incentives.
Any restriction on implementing regional services is likely to be locally imposed. Local governments
providing match for federal and state funds may explicitly or implicitly provide the match with restrictions on service to points outside jurisdictional boundaries. There may be concern about negative publicity if it appears that one jurisdiction is subsidizing residents of another, or if it is perceived that residents are using services to support the economy of another jurisdiction. It is often the case that such services enable employees to bring paychecks to their home jurisdiction, or enable residents to reach services unavailable locally, and the process of developing regional services must address the political concerns. The major exception to the myth is in cases where local funding is provided by a local tax, and language governing the tax prevents any of it from being used on services outside the jurisdiction. It may mean that regional services require a different source of local match.
There’s No Need As will be seen in the case studies, the need for regional services can become evident in a number of
ways. Statewide studies conducted by state departments of transportation often include public surveys or surveys of transit users and frequently the need for regional services is documented, along with other transit needs. For example, in the recent Ohio statewide transit needs study, general public surveys identified regional services as one of the top three priorities. It was also one of the top three priorities for rural respondents, occasional transit riders, and non-riders10.
In many other cases, the need for regional services is identified from local human service-public
transportation coordination plans required by FTA under Section 5310. Sometimes the need for regional service is evident because of changes in a community, such as a plant closing locally while jobs are available in another plant in a different county. Other local studies or efforts may identify this need - economic development studies, or requests for service from regional facilities such as community colleges or regional medical centers. Regional planning organizations may be key players in identifying
10 Ohio Department of Transportation, Ohio Statewide Transit Needs Study, Final Report, January 2015, p.15.

Rural Regional Defined
8
needs and then developing rural regional service plans and funding. Implementation of rural regional services will reflect local prioritization of regional needs versus local
needs, but many places are finding that there are needs that need to be met.
There’s No Funding
The case studies in this report found that regional services are being operated using a variety of funding sources. These include the expected FTA Section 5311 rural funds, Section 5311(f) rural intercity funding, Section 5311(f) in-kind match from connecting unsubsidized intercity services, federal Congestion Mitigation and Air Quality funding, economic development funding, energy funding, tribal transit funding, state funding for match, state incentive funding for regional services, funding for Medicaid non-emergency transportation, and other local sponsors. In most cases, funding for operation of regional services is a creative combination of funding from different sources. In a number of cases, state funding or state policies in providing federal funding, played a significant role in the ability to use funds for regional services.
It’s Not Productive Evaluation of rural regional services needs to take into account the fact that most services are long-
distance with few stops. In comparison with local services, they will have few boardings per mile or per hour. A more appropriate measure is the number of boardings per vehicle trip, which is more likely to reflect that a vehicle traveling a long distance with a substantial load of passengers is being productive. In the case studies that were able to provide productivity data, in general, services appear to be comparable to more local rural services even using the same measurement factors. In most cases, rural regional routes had acceptable ridership to start and have seen increasing demand over time. In some cases fine-tuning of schedules and routes has resulted in improved ridership.
It Requires a Regional Organization While a number of states are pursuing initiatives intended to create rural regional transit organizations,
a number of the case studies reflect initiatives by adjacent organizations to jointly create regional services, or by local systems or entities that see a regional need for their own citizens and take the initiative to offer service. Regional organizations may make it easier to overcome jurisdictional boundaries and develop coalitions needed to design and support such services. Organizations may be regional planning organizations, transit regions defined by state administrative requirements, regional private non-profits, or public joint powers organizations. There is no single model that is most appropriate. The common element in terms of organization is that there are some persons or groups that have become the local champion and have put in the dedication and effort required to design services, find funding, and implement service.
Organization of This Report This report presents results of an effort to identify states with high levels of rural regional mobility,
and within them to identify state transit program policies or programs that have been designed to support regional services. This chapter provides an introduction and definition of rural regional transit services. It also presents the results of the effort to identify both state programs supportive of rural regional services

Rural Regional Defined
9
and local examples that could be used as case studies. Chapter 2 is a literature review. A survey of state transit agencies was conducted to allow states to identify themselves as having addressed this need in some way, and/or to identify examples as potential case study sites. In Chapter 3 and from the results of this survey and other outreach efforts, the study team identified twelve case studies that include state programs or policies designed to support or encourage rural regional services, and cite examples of services. Chapter 4 presents the case studies, which were chosen to describe examples of state policies, organizational structures, funding sources, and service designs. The case studies are used as a basis for the Toolkit presented in Chapter 5. Chapter 6 presents a checklist for developing a rural regional route.

Rural Regional Defined
10
This page intentionally left blank.

Literature Review
11
C H A P T E R 2 : L I T E R A T U R E R E V I E W
Study Process
The initial step in the study process involved a search for previous research that focused on rural regional
services. For the literature review, reports were identified and reviewed. Reports that address rural regional
transit, or more generally rural transit, and relevant for the study that have been published over the last fifteen
years were identified. This included material known to the consulting team as well as material identified through
a search of TRID, the integrated database with records from TRB’s Transportation Research Information
Services (TRIS) Database and the Organization for Economic Cooperation and Development’s (OECD) Joint
Transport Research Centre’s International Transport Research Documentation (ITRD) database. The literature
review also found several reports, particularly articles in the Community Transportation Association of America
publications, which described rural regional transit systems.
For the most part, the major finding is that there is not a lot of previous research addressing rural regional
transit services. The literature that exists is largely directed at the benefits and feasibility of regional
organizations for providing rural public transportation, rather than regional services. Increased ability to provide
regional services is often cited as a major potential benefit of regional organizations, but there is little
documentation about specific regional services that have been enabled by the creation of regional organizations.
For this reason, the study team decided to look beyond the traditional literature in an effort to identify potential
rural regional service case studies.
This secondary effort in the literature review focused on PowerPoint presentations from the TRB Rural and
Intercity Bus Conferences over the past six years to identify relevant presentations on rural regional mobility
services. The vast majority of presentations featured intercity bus service projects. Presentations from the 2014
conference that address the broader theme of rural regional mobility have summaries that are included in this
section.
Relevant Published Reports
Regional Cooperation in Transportation Planning
Regional Cooperation in Transportation Planning, prepared for the Florida Department of Transportation
(DOT), reviewed regional transportation planning practices across the country, highlighting innovative
transportation planning approaches in other states that support regional transportation planning and cooperation.
The report provides specific recommendations for the state’s DOT to improve regional transportation planning
and regional investment decision-making in Florida. The impetus for the report came from findings in the 2060
Florida Transportation Plan that the large number of government entities responsible for transportation planning
and funding decisions posed a significant challenge to implementing the state’s plan. It also noted that improved
regional decision-making was needed. The State of Florida’s plan concluded that improved regional decision-
making requires restructuring existing institutions and processes, including consolidation of transportation
entities to reflect urbanized growth trends, commuting patterns, funding mechanism, and other economic
relationships.
One of the research tasks was to identify incentives established at the state levels to encourage formation of
regional planning, coordination, and partnerships among metropolitan and other planning organizations. The

Rural Regional Defined
12
report finds that states’ incentive programs are typically not statewide but are at the regional or local level. In
addition, most incentive programs are designated for one or two specific purposes, which can include transit and
development of multi-modal transportation, smart growth and other purposes. The only example the researchers
found of a statewide incentive program for regional transportation coordination is Florida’s Transportation
Regional Incentive Program (TRIP). Two other states are identified with statewide programs: North Carolina,
with a focus on rural regions, and Virginia, where the program covers several areas of planning.
The report notes that rural transportation planning across many states increased in the 1990s as a result of
federal legislation and guidance. Thirty states have designated regional planning organizations to represent rural
areas in statewide planning processes.
The report, building on the literature, identifies why local jurisdictions and states pursue regional governance.
Accordingly, regionalism:
provides a holistic perspective for planning, inter-jurisdictional coordination and administrative purposes,
achieves economies of scale by pooling resources such as funding, technical assistance and service delivery,
integrates sectors (i.e., various special purpose planning initiatives such as transportation and land use) thus
increasing administrative efficiency,
provides geographic coverage and representation (political power) in decision-making,
allows public participation, data gathering and implementation of state and federal programs, and
enables two-way communication and conflict resolution vertically between local and state or federal
governments and horizontally across jurisdictions.
Importantly, states must give local and regional entities the authority and support to engage in regional
governance. Because regionalism falls outside dominant government schemes, local leadership and collaborative
capacity are necessary to create, maintain, and evolve regional governance.
One interesting aspect of the research was the development of a conceptual framework of regional
transportation planning and coordination. This framework recognizes that states can foster regional coordination
directly (by defining regional planning entities), and indirectly (by allowing intergovernmental compacts). State
programs and policies vary according to the degree to which they are top-down or bottom-up initiatives.
The researchers’ regional institution and planning framework describes the key features for such planning
and relates them to the extent of regional integration. The key features are: organization structure, planning
procedure, representations, and sphere of influence. These features help explain how regional planning is
accomplished, who is involved, and what sort of control and power it has.
Florida’s TRIP incentive program encourages regional planning by providing state matching funds for
improvements to regionally significant transportation facilities. Eligible recipients include, two or more
contiguous Metropolitan Planning Organizations (MPOs) and two or more contiguous counties that are not
members of an MPO.

Literature Review
13
Data Needs for Assessing Rural Transit Needs, Benefits, and Levels of
Service
A study of the National Cooperative Highway Research Program (NCHRP) reviewed the federal data
collection program for rural transit - the Rural National Transit Database (NTD) - to define additional data
elements to improve the program and to identify options to evaluate rural service levels. This study, titled Data
Needs for Assessing Rural Transit Needs, Benefits, and Levels of Service, was conducted by the consulting team.
While study efforts did not specifically look at rural regional transit, the report discusses the importance of
service area size when evaluating rural transit services. This is particularly true when considering rural regional
systems that cross jurisdictional boundaries serving long trips to reach activity centers and destinations beyond
rural areas. In addition to proposing three new measures for the Rural NTD to assess rural transit from a national
perspective, the report suggests that rural services can be categorized by the type of trips they serve based on
service frequency to assess their level of service to users. This is relevant for this study’s effort to classify
regional services in rural areas. The study suggests the following categories:
Weekly or bi-weekly service to the activity center(s). This level of rural service can meet critical trip
purposes, such as for medical appointments and food shopping and is often termed “lifeline transportation.”
Daily trips inbound from the rural area to the activity center(s)/outbound back to the rural area with at least
five to six hours at the travel destination. Rural service provided daily with less than eight hours at the travel
destination allows users to meet certain trip needs, such as participation at human service agency day
programs, part-time employment, education trips, medical trips, and possibly including dialysis treatment.
Daily service during morning/afternoon peak periods and at least ten hours at the activity center. Rural
service at this level allows for full-time employment for traditional office-type jobs, most education trips,
and medical trips.
Daily service during peak travel periods during the peak season. This type of rural service may be provided
for visitors and employees for rural resort areas, such as ski areas or beach towns, or for peak service during
the academic year for a college in a rural setting.
Connectivity to regional/national intercity carriers. This level of service will vary widely for any given rural
community or area depending on the intercity bus schedule at the closest appropriate activity center, though
the potential of coinciding with the intercity bus schedule increases with greater frequency of rural service to
that activity center.
This approach, frequency of service corresponding to trip types served, may be an appropriate factor for
classifying rural regional transit services for this study.
Organizing Transit in Small Urban and Rural Communities
Organizing Transit in Small Urban and Rural Communities, a research report prepared at North Dakota State
University’s Upper Great Plains Transportation Institute, examines the case for regional organization for rural
transit from an economist’s perspective, using North Dakota as a test case. The report notes that the benefits of
consolidating rural transit agencies had not been quantified. Where such benefits are identified, it has been
qualitative descriptions rather than economic or quantitative.
The study tests the following hypotheses:

Rural Regional Defined
14
Rural transit experiences economies of density. The presence of increasing returns to density in rural transit
infers that it would be more efficient for a single transit agency to provide service in an existing service area,
as is common practice, rather than to create a new transit agency to do so.
Rural transit experiences economies of firm size. Economies of firm size differ from economies of density in
that it considers a proportional increase in service area. The presence of increasing returns to firm size infers
that it is more efficient for an existing agency to provide increased levels of service in an expanded service
area.
Rural transit experiences economies of scope.
Rural transit has excess capacity. National data suggest that there are an excessive number of vehicles
industry-wide. The presence of excess capacity would support a revision of federal and state policies relating
to capital funding allocation and rules for vehicle disposition.
Rural transit is a natural monopoly. The presence of natural monopoly in rural transit would support the
existence of single rural transit agencies as the sole providers of demand response and fixed route service
and for government subsidy of transit.
These translated to six research questions:
1. Is increased service in an existing service area more efficiently provided by a single existing rural transit agency or by adding a new one?
2. Is increased service in an expanded area more efficiently provided by a single rural transit agency or by
creating a second agency?
3. Are demand-response and fixed-response service most efficiently provided by a single firm or should two agencies provide each service exclusively?
4. Do rural transit firms have significant unused vehicle capacity?
5. Is a single regional transit agency always more efficient at providing multimodal service or are there cases where two agencies can provide service more efficiently?
6. Is there economic justification for government support of transit on the basis of increasing returns to scale or
natural monopoly?
Based on various econometric models and analyses, findings of the research include:
It is more efficient for an existing rural transit agency to provide increased outputs within its service area
than to create a new transit agency to do so.
At high levels of output and service area size, it is more efficient for a second agency to provide service, so
that within very large regions with both fixed route and demand response service, it is more efficient for
entities to specialize in one mode of service.
Significant amounts of excess capacity were found.
Regionalizing Public Transportation Services
Regionalizing Public Transportation Services was prepared by the Institute for Transportation Research and
Education at North Carolina State University. The study had several components, including a review of best practices of regional public transp0rtation in other states and identification of opportunities and constraints for such regional service.
The study defines benefits to regionalization:

Literature Review
15
benefits to riders, particularly with the ability to provide trips across county lines,
more effective regional planning,
ability to address regional transportation problems,
adequate funding -a regional entity can be created with its own funding source,
transportation and land use planning integration,
operational and administrative economies,
a regional transit in an urban area has the ability to plan and build a regional rail system,
coordination or consolidation of specialized or rural public transportation services,
development of specialized professional staff, and
improved efficiency and effectiveness of the state department of transportation.
Among the findings of the case study research:
States with legislation promoting or mandating regional transit systems have more of such systems and a
higher level of public and human service transportation consolidation.
Legislation may allow regional systems to be organized through intergovernmental agreement or to be
private non-profit agencies.
Contracting and agency memberships are two principle types of relationships that can be established to
create multi-county transit services.
A perceived loss of control is a common issue or fear that may be a barrier to consolidation or coordination
of transit services.
A local champion can be important.
State DOTs can contribute to formation of regional transit systems through provision of technical assistance.
Funding incentives that favor regional service can be very effective.
The ability to mix funding sources throughout the entire service area is important.
Dedicated funding sources can be important, thereby reducing the likelihood that lack of local funding
becomes a barrier for local jurisdictions to work together in a regional system.
Resources are saved with administration.
Availability of specialized professional staff for a larger/regional transit organization.
Regional systems may be able to realize economies of scale by operating fewer maintenance facilities.
The governing board must be sufficiently representative of the political jurisdictions and stakeholders in the
region.
Funding “equity” means that the jurisdictions receive benefits commensurate with the funds they contribute.
The study then recommends a number of regional transportation systems for North Carolina, suggesting areas
that share common economic, employment, political and social characteristics.
North Carolina Statewide Regionalization Study
The North Carolina Statewide Regionalization Study was prepared by the KFH Group, Inc. for the North
Carolina DOT as the department’s response to Session Law 2011-145, House Bill 28.21, which required the
DOT and its Public Transportation Division to study the feasibility and appropriateness of developing regional
transit systems with the goals of providing increased mobility between existing transit systems within one
county and between counties, improving planning and coordination to better meet public demand, maximizing
funding, and developing centralized professional staff that will create operational and administrative
efficiencies.

Rural Regional Defined
16
The study examined previous literature, experiences in other states, a series of stakeholder interviews,
a survey of transit systems in North Carolina, and input from the Advisory Committee. The study found
that regional transit systems could demonstrate significant benefits in terms of addressing regional travel
needs, improved regional planning, maximizing funding, and creating administrative and operating
efficiencies. However, it is evident that successful efforts at regionalization do not necessarily require
total consolidation of all transit functions under a single entity. The appropriate approach varies with local
conditions, taking a blended approach that integrates primary transit system functions, taking different
elements from a menu. The feasibility of this approach is demonstrated by the variety of successful
regional transit activities across the state, many of which have not required total consolidation. The final
report was submitted to the Joint Legislative Transportation Oversight Committee (JLTOC) and presented
to the committee during the legislative session.
The Transit Capacity and Quality of Service Manual (TCQSM)
The TCQSM, now on its third edition, does not directly address rural regional transit services but does
provide measures that can be used to assess the effectiveness of such service.
The manual provides methodologies and tools to assess transit service quality and to calculate the
capacity of fixed route transit as well as ferry transit. Regarding transit service quality, the manual
provides a framework for assessing transit within two categories: the availability of transit service and its
comfort and convenience. The specific measures for these factors differ for fixed route transit and demand
response transportation, and the measures are described from the passenger’s perspective as well as the
transit operator’s perspective. For example, for transit availability, three measures are defined: frequency
of service; service span (the days and hours of service), and access, which is the spatial element of transit
availability - is transit service provided near one’s desired origins and destinations. These measures are
relevant for rural regional transit, as it is often difficult to provide enough transit, as measured by its
availability, and to provide good access and connectivity with the large geographic areas common for
rural regional transit, the very low population densities, and realities of funding.
Regional Transit Coordination Guidebook
With population growth in Texas’s rural areas and extensive suburban development, the Texas
Department of Transportation sponsored a project titled “Regional Public Transportation Solutions for
Intercity Commute Traffic.” One of the products of the project was the Regional Transit Coordination
Guidebook.
The guidebook provides recommendations for initiating and sustaining coordination activities as well
as evaluation strategies that can be used at various stages along the planning process. The guidebook
builds on regional coordinated projects in Texas as well as elsewhere in the country. The report also
describes coordination efforts in Texas, where state legislation prompted twenty-four council of
government regions to work with the DOT to develop regional plans for transit coordination.
The guidebook lists the advantages of regional transit coordination:
benefits to transit riders/travelers:
more travel alternatives for commuters.
increased mobility and independence for people who do not or cannot drive.
improved availability and convenience of medical trips.

Rural Regional Defined
17
benefits to transit providers:
improved cost-effectiveness and use of resources.
expansion of service area and client base.
improved visibility of transit service in the community.
ability to leverage new funding sources.
benefits to transportation system:
congestion relief on major travel corridors.
reduction in vehicle emissions.
additional travel capacity without building more lane miles.
benefits to employers and the workforce:
opportunity to attract new workers.
reduced need for parking facilities.
support for ridesharing and transit use offered by the internal revenue service.
potential element of corporate pollution-reduction programs.
Ohio Statewide Transit Needs Study
The Ohio Department of Transportation and a team of consultants recently completed an extensive
inventory of transit needs in the state. The outreach process included meetings with all transit systems in
the state, stakeholder interviews, user surveys and public surveys. One key finding is the need for regional
services or connections, which was expressed by riders, stakeholders and transit system operators. The
final recommendations included proposals for funding efforts to incentivize the creation of more regional
services, regional service coordination, and new regional systems in areas without any current public
services. As part of the study process, a Regional Services and Organizations initiative paper was
developed that addressed both the scale and service advantages of regional transit organizations, and the
need for regional services. It included descriptions of several best practices in both areas, suggesting that
this study may be able to identify best practices in rural regional mobility through contacts with the state
program staff.
PowerPoint Presentations from the Transportation Research Board (TRB) Rural and Intercity Bus Conferences
Knowing that there are more efforts at implementing rural regional mobility services than could be
found in the literature search, KFH Group, Inc. decided to review the presentations made at the TRB’s
Rural and Intercity Bus Conferences to see if there were relevant presentations that could help define the
topic or provide some preliminary information on state programs or recent best practices in rural regional
mobility services. Some of the most relevant presentations include the following:
The Relationship between Rural Regional Mobility and How Local Transit Is Organized, 21st National Conference on Rural Public and Intercity Bus Transportation, October 21, 2014, Monterey, California
This presentation by Kim Johnson of the Michigan DOT and Steve Hirschfield of the Wisconsin DOT
is extremely relevant to the current study as it presents the concept of rural regional mobility leading to
the development of this research project. It includes a review of the ways in which public transit is
organized and funded in each of the states (Michigan and Wisconsin), noting that public transit systems

Rural Regional Defined
18
are largely organized and funded through a structure that supports local systems and specialized services.
Although both states have mechanisms for developing regional authorities, public transit has a
predominantly local focus. At the same time both states have intercity bus programs as well as
commercial intercity bus services (unsubsidized). In both states there is a perception that there are
existing and growing needs for regional services that are not met by either the local systems or the
intercity services. This has led to numerous questions about how such needs might be met, what kind of
organizational structure is appropriate for regional services, and how they might be funded. It also led
both states to work with the American Association of State Highway and Transportation Officials
(AASHTO) and its Standing Committee on Public Transportation (SCOPT) to support national research
(this study) to identify best practices by states or rural regional agencies that:
meet the FTA definition of “public transportation”
meet the FTA definition of “intercity bus”
effectively blend these two modes
are supported by a combination of Section 5311 and Section 5311(f) funds
From this presentation it is clear that rural regional mobility services will be services that are open to
and usable by the general public (are not solely human service transportation for eligible clients). It is less
clear whether the definition of rural regional mobility under study should include intercity bus projects
that do not address needs for services that can provide a day-time round trip with enough time on site for
employment, medical services, and higher education classes.
North by Northwest Connector, 21st National Conference on Rural Public and Intercity Bus Transportation, October 21, 2014, Monterey, California
This presentation by the Tillamook County Transportation District provides a description of an
Oregon transit project that has created a regional network in the coastal region of the state. The
presentation covers the goals and tasks of the project, which include the development of a
network of regionally-coordinated routes and services that cross county lines, meet regional
needs, serve both commuters and visitors while offering connections to key intercity terminals.
The project includes the development of a distinct branding for the regional network, regional
fares, a centralized website, and additional inter-agency coordination. Service improvements
included improved connectivity between services at connections points (as opposed to forced
transfers at county borders). Funding sources include Section 5311(f) funding for some new
regional routes: state funds for pedestrian and accessibility improvements, signs and shelters; and
planning funds for creating the organizational structure, developing the new services and
infrastructure, and the marketing and branding. Much of the network includes services that were
already in place, and are now coordinated into a network. Project successes have included
significant ridership increases in some corridors. In many ways this project would appear to be a
best practice rural regional mobility service. Colorado Intercity and Regional Bus Network Plan – 2014 Update, 21st National Conference on Rural Public and Intercity Bus Transportation, October 21, 2014, Monterey, California
This presentation provides an overview of a study prepared for the Colorado DOT, the Colorado
Intercity & Regional Bus Network Plan-2104. This statewide plan updates a 2008 study. The study

Rural Regional Defined
19
includes a needs analysis and the development of a typology of different services designed to meet
different needs:
Intercity Bus Services: Connect rural communities to the national intercity bus network for travel to
more distant points. Such services usually have limited frequencies (often once per day) but operate
every day of the week.
Interregional Express Services: Connect urbanized areas that in most cases have existing local or sub-
regional public transit services. These are focused on commuters, providing multiple weekday
frequencies, often with a morning and evening peak.
Regional Bus Services: Connect rural areas and urban areas, have moderate frequency, and operate at
least every weekday. Schedules allow passengers to complete a round trip in a day, and could
accommodate employment trips (morning in, evening out).
Other Essential Regional Services: Generally operate on a fixed route and fixed schedule with
flexible routing at the ends of the route to serve multiple destinations. Service may be less than daily,
depending on demand, but schedules are designed to allow for a same day trip with 4-5 hours at the
destination for appointments or personal business.
The plan combines existing and proposed services in these categories to create a statewide
network plan, with estimated operating and capital costs. The identified intercity bus network is
generally in place, with portions provided by the private carriers without subsidy, and some
routes that are funded with Section 5311(f). The plan includes a significant planning effort
addressing the interregional express needs, focusing on long-distance commuter services into
Denver. This service is due to be implemented in the summer of 2015. Colorado DOT is doing
more detailed planning to address proposed needs for some regional bus services and essential
regional services, with the type of service a function of the likely pattern and level of demand in
the proposed corridors. State funding for demonstration regional bus services is possible. Vermont Intercity Bus Program-Reconnecting Rural Vermont, 21st National Conference on Rural Public and Intercity Bus Transportation, October 21, 2014, Monterey, California This presentation, by David Peletier of the Vermont Agency of Transportation, presents the recent
development of a Section 5311(f) funded intercity bus program. It describes the recent history of the
decline of Vermont’s rural intercity network and the planning process followed to develop alternatives,
prioritize services, find an operator, implement services, develop a brand and publicize the new services.
Of particular interest was a reference to the analysis of regional transit services as potential intercity
feeder services and the degree of change in regional services needed to provide acceptable intercity
connections. The regional service development in Vermont had been described in presentations at
previous Rural and Intercity Bus Conferences. In 2010, Chris Cole, then General Manager of the
Chittenden County Transit Authority (CCTA) in Vermont, gave a presentation entitled Regional Service
in a Local Environment which covered the development of regional services connecting Burlington,
Vermont with Montpelier, Middlebury, and St. Albans - all in different counties. This presentation
includes information on the demand (primarily daily commuter), the development of a more regional
organizational structure, and the funding requirements - including the role of the state in promoting such
services and providing start-up funding. At the same conference, Aaron Frank, then a planner at CCTA,
gave a presentation entitled Succeeding with Commuters after Intercity Failure which focused on the
development of these regional commuter services in the wake of the withdrawal of most Vermont Transit
intercity routes. The Peletier presentation provides us with the latest chapter in the development of a full
range of transit services, as Vermont added back some rural intercity routes to the regional routes

Rural Regional Defined
20
originally developed in the wake of intercity bus service losses. This illustrates that at least one state
found a need for both regional and intercity services, and has developed a process of organizational
development and state support to implement both.
MassDOT BusPlus Program, 21st National Conference on Rural Public and Intercity Bus Transportation, October 21, 2014, Monterey, California
This presentation by Kyle Emge of the Massachusetts DOT presents the development of a regional bus
program in Massachusetts. A comprehensive study of bus services in that state resulted in the
development of a new definition of regional bus services that combines rural intercity, intercity and
commuter bus by combining the definition of intercity bus services from the Section 5311(f) program
guidance with a definition of commuter bus service. The program has used state funds to provide bus
capital to private firms in return for additional services - either new routes or additional frequencies or
stops. The program has created regional coordination among the states in New England regarding
potential regional bus service improvements, and MassDOT has developed a detailed regional bus and
rail service map and a smart phone ticketing system available to multiple bus operators. In the future,
operating subsidies will be used to initiate services on more new routes. This program is of interest
because of its combined focus on intercity and daily commuter services, the development of regional
(multi-state) connectivity, and the important role of the state in supporting such services.
A number of other presentations at the Rural and Intercity Bus Conferences in the recent past have
addressed state and carrier efforts to develop and implement Section 5311(f) rural intercity bus services.
Those are not summarized here (see the References section) because of their exclusive focus on intercity
service, The presentations described above are distinct in their relevance to this study because they have
in some way addressed the development of regional as well as intercity services, suggesting further
analysis of the programs and projects as potential best practices.
Conclusions Regarding the Literature Review
The review of the literature suggests three basic considerations for this study:
The existing research generally focuses on regional organizations rather than regional services.
The literature suggests that regional services can be classified based on service characteristics, and
regional services can be seen as one category of services that is distinct from, but may also share
characteristics with, intercity bus services, commuter bus services, local public transit and human
service transportation.
A number of states and/or regions have addressed rural regional mobility issues in recent times,
including a number that have documented their efforts through presentations at national conferences.
This suggests that there may be more examples that can be discovered, and that it is possible to
identify policies and practices that can support rural regional mobility.

Rural Regional Defined
21
References
Abernathy, S., Lagerberg, B., & Hammond, P., Intercity Bus in Washington State Four Years and
Counting, 20th National Conference on Rural Public and Intercity Bus Transportation, Salt Lake City, UT,
October 2012
Ballard, L., Challenges of an Intercity Connection Crisis in Montana and North Dakota, 21st National
Conference on Rural Public and Intercity Bus Transportation, Monterey, CA, October 2014.
Bubel, S., Connecting the National Intercity Bus Passenger Network, 20th National Conference on Rural
Public and Intercity Bus Transportation, Salt Lake City, UT, October 2012
Cole, C, Regional Service in a Local Environment, 19th National Rural Public and Intercity Bus
Transportation Conference, Burlington, VT, October 2010
Conley, C., GoBus: An Intercity Bus Success Story, 20th National Conference on Rural Public and
Intercity Bus Transportation, Salt Lake City, UT, October 2012
Cook, T., Recent Evolution of the North Carolina Intercity Bus Program, 21st National Conference on
Rural Public and Intercity Bus Transportation, Monterey, CA, October 2014.
Cook, T., Regionalizing Public Transportation Services, performed by Institute for Transportation
Research and Education, North Carolina State University, for the North Carolina Department of
Transportation, Raleigh, North Carolina, 2002.
Emge, K., MassDOT BusPlus Program, 21st National Conference on Rural Public and Intercity Bus
Transportation, Monterey, CA, October 2014.
Frank, A., Succeeding with Commuters after Intercity Failure, 19th National Conference on Rural Public
and Intercity Bus Transportation, Burlington, VT, October 2010
Fravel, F. & O’Neill, S. Colorado Intercity & Regional Bus Network Plan – 2014 Update, 21st National
Conference on Rural Public and Intercity Bus Transportation, Monterey, CA, October 2014.
Fravel, F. & Green, J, Rural Intercity Transit Program Development for Utah, 20th National Conference
on Rural Public and Intercity Bus Transportation, Salt Lake City, UT, October 2012
Hamby, B. KFH Group, Inc., Data Needs for Assessing Rural Transit Needs, Benefits, and Levels of
Service, National Cooperative Highway Research Program, Transportation Research Board, Washington,
D.C. 2012.
Kittelson & Associates et. al., TCRP Report 165 Transit Capacity and Quality of Service Manual,
Transportation Research Board, Washington, D.C., 2013.
Johnson, K. & Hirschfield, S., The Relationship between Rural Regional Mobility and How Local Transit
is Organized, 21st National Conference on Rural Public and Intercity Bus Transportation, Monterey, CA,
October 2014.

Rural Regional Defined
22
Kack, D., Montana Intercity Bus Service Study, 20th National Conference on Rural Public and Intercity
Bus Transportation, Salt Lake City, UT, October 2012
KFH Group, Inc. North Carolina Department of Transportation, Statewide Regionalization Study, Final
Report, May 1, 2012.
https://www.ncdot.gov/download/transit/nctransit/StatewideRegionalizationStudy.pdf
Lazaro, L, North by Northwest Connector, 21st National Conference on Rural Public and Intercity Bus
Transportation, Monterey, CA, October 2014.
Lewis, C.A. et al., Regional Transit Coordination Guidebook, performed in cooperation with the Texas
Department of Transportation and the Federal Highway Administration, Center for Transportation
Training and Research, Texas Southern University, Houston, TX and Texas Transportation Institute,
College Station, TX, 2009.
Lynott, J., Weaving It Together: A Tapestry of Innovative Funding Sources for Rural & Intercity Transit,
21st National Conference on Rural Public and Intercity Bus Transportation, Monterey, CA, October
2014.Morrell, S., Growing Up, Not Out: Minnesota’s Next Phase for Intercity Bus Development, 21st
National Conference on Rural Public and Intercity Bus Transportation, Monterey, CA, October 2014.
Nelson/Nygaard with KFH Group, Inc., PB World, and Engage Public Affairs, Ohio Department of
Transportation, Ohio Statewide Transit Needs Study, Final Report January 2015: Human Service and
Public Transportation Coordination Initiative Paper.
Nelson/Nygaard with KFH Group, PB World, and Engage Public Affairs, Ohio Department of
Transportation, Ohio Statewide Transit Needs Study, Final Report January 2015: Regional Services and
Organizations Initiative Paper.
Nelson/Nygaard, Ohio Department of Transportation, Regional Services and Organizations Initiative.
https://www.dot.state.oh.us/Divisions/Planning/Transit/TransitNeedsStudy/Documents/InitiativePaper-
RegionalServicesAndOrganizations.pdf
Peletier, D. Vermont Intercity Bus Program – Reconnecting Rural Vermont, 21st National Conference on
Rural Public and Intercity Bus Transportation, Monterey, CA, October 2014.
Peterson, D., Improving Veteran Mobility in Small Urban & Rural Areas, 21st National Conference on
Rural Public and Intercity Bus Transportation, Monterey, CA, October 2014Reuter, C & Ruestman, J,
Intercity Bus Transportation: A New Role for States, 21st National Conference on Rural Public and
Intercity Bus Transportation, Monterey, CA, October 2014.
Ripplinger, D. G., Organizing Transit in Small Urban and Rural Communities, Upper Great Plains
Transportation Institute, North Dakota State University, Fargo, North Dakota, July 2012.
University of Florida, Dept. of Urban and Regional Planning, Regional Cooperation in Transportation
Planning, Final Report, prepared for Florida Dept. of Transportation, Tallahassee, FL, February 2012.

Identification of Case Studies
23
C H A P T E R 3 : I D E N T I F I C A T I O N O F C A S E S T U D I E S
Introduction
The original study scope has called for a categorization of states in relation to their level of rural regional
mobility. Our efforts toward this objective first reviewed data collected and published by the Rural National
Transit Database (NTD) as well as the Bureau of Transportation Statistics to determine whether these resources
have data relevant and applicable for categorizing states. Given that this review and assessment found limits to
published data for purposes of categorization, we developed an alternative approach and used it to help identify
case studies of rural regional services. A review of the available data sources, the alternative approach and the
selection of case studies are presented in this chapter.
Published Data
In order to categorize or classify the states in terms of their level of rural regional mobility the initial effort
focused on the possible use of national data collected using a consistent set of definitions. The major source of
data for rural transit systems is FTA’s Rural National Transit Database. Data from the Bureau of Transportation
Statistics was also reviewed for this purpose.
Rural National Transit Database
The Rural NTD requires states to collect and report specified data and information for their Section 5311
subrecipients. The latter include a range of organizations - public entities such as small cities and counties,
private non-profit agencies, intercity bus services, and rural services provided by tribal organizations.
The subrecipients provide specified data annually, reporting on the types of services provided, vehicles,
operating data (miles and hours), and passenger trips, among other data elements However, there is no other data
classification that would allow compilation of the subset of miles, hours, vehicles, and passenger trips provided
on regional services.
The one relevant data element in the Rural NTD for purposes of identifying regional transit services is type
of service area. Using a drop down menu, each sub-recipient identifies if its service area is a:
county/ independent city
multi-county/ independent city
multi-state
reservation
other
If the service area is multi-county or multi-state, the sub-recipient then lists the specific jurisdictions in the
service area.

Identification of Case Studies
24
Subrecipients that serve multi-county or multi-state areas may or may not provide regional transit services.
However, the data do not provide any information that would confirm that services provided are regional,
regarding the destinations served or about the level of service (e.g., days of the week that service is provided,
hours of service, or number of round trips).
As shown in Appendix A, the data can be used to identify - by state - the number of rural transit systems with
multi-county and multi-state service areas and the number of intercity bus services receiving Section 5311(f)
funding as well as the proportion of each to the states’ total 5311 subrecipients. The data are not sufficiently
fine-grained to effectively categorize states as to their level of rural regional mobility - one could make
assumptions that more multi-county operations and more intercity bus projects are indicative of greater rural
regional mobility, but that would be a significant leap from the available data.
Bureau of Transportation Statistics
The Bureau of Transportation Statistics (BTS) collects and reports transportation data to help advance the
federal DOT’s strategic goals. Among the BTS resources is the Intermodal Passenger Connectivity Database,
with information on 7,000 rail, air, bus and ferry passenger terminals that can be used to assess the degree of
intermodal connectivity in the passenger transportation system. The database identifies, by state, the number of
intermodal facilities that enable passengers to transfer from one mode of public transportation to another. The
BTS refers to an intermodal facility as a “key building block for developing connectivity.”
The study team assessed data elements in this database that measure, by state, the number of passenger
facilities in both urban and rural areas with intercity bus service, with local bus service, and the number of
facilities that serve both. Appendix B shows this data. While the database identifies facilities that have both
intercity bus and local bus and from this, one might surmise that the services could be connected from a
schedule perspective, however the data do not provide any information about the type of local bus service or
specifically the extent of rural regional service provided by the bus service. As in the case of the Rural NTD, the
data are not sufficiently detailed for categorizing states as to their level of rural regional mobility.
State Program Data
Recognizing that there is no national database that collects information on the availability of regional
services, the study team considered that perhaps individual states collected data on subrecipient services that
could be used to identify regional services. Some states publish annual reports that document all of their
subrecipients in detail regarding funding sources, types of service provided, fleet size, operating statistics and
(sometimes) performance. It was thought that perhaps one or more individual states would have compiled
information on subrecipient services that would help define rural regional services, assist in identifying potential
case studies, or provide some model for future research or data collection. However, even in states that have
identified rural regional services as a need or priority there is very little information collected that reflects a
concern for rural regional mobility. For example Minnesota’s annual transit report “2016 Transit Report: A
Guide to Minnesota’s Public Transit Systems” includes data on areas served which may list more than one
jurisdiction, but does not include a specific description of services beyond service type (demand response,
deviated route, fixed route). In the “Highlights” section for each provider, some providers mention services that
may be regional in nature, but there is no definition of regional service that could be applied as a classification.
The “2015 Summary of Public Transportation Report” prepared by the transit program in Washington State also
provides a very complete overview of the state’s transit systems. Sections in each system’s overview include
current operations, which may or may not describe services that are regional in nature. A separate section in
each system overview includes the intermodal connections provided by that system, which could be evaluated to
determine if the connecting services are regional in nature. Oregon DOT provides funding to collect and update

Identification of Case Studies
25
General Transit Feed Specification (GTFS) data for all providers in the state, and the data is used to provide a
library of all transit routes in the state as GIS shapefiles. Together with the GTFS data, which includes schedule
information, this would allow one to compile a list of rural regional services, however that list is not developed
and provided by the state. A review of a number of other state transit annual reports revealed that in general the
inventory of transit services is structured around federal funding programs, includes funding information, has
operating statistics, and may include a map or list of the service area of each system (usually defined in terms of
counties or municipalities) - but does not include information specifically about rural regional transit services or
mobility.
Classification Characteristics
The lack of data on rural regional services at the national or state level is not surprising, given that there is no
particular funding associated with that kind of service in the same manner as for the intercity program (Section
5311(f)) funding. Much the same conclusion was reached regarding demand response service as a type of
transit by researchers at the Small Urban and Rural Transit Center at North Dakota State University. Their study
“Developing a Method for Assessing National Demand-Response Transit Level of Service” found that the key
data elements needed to assess the level of service, identify gaps in service coverage and assess unmet needs are
not included in the NTD. Data that would allow the development of service level criteria for demand response
service such as geographic coverage, days of service per week, hours per day, advance reservation requirements
and eligibility are not collected, but would be needed to evaluate demand response service levels and compare
them between systems, states or nationally. The situation is much the same for rural regional transit services.
In the same way that the cited study identified potential factors to be included in a demand response level of
service survey tool, the next section presents some factors for rural regional services that could be used as
criteria for determining level of service. Their application might initially be a state transit needs study or
strategic plan, particularly if public outreach or stakeholder input has identified an unmet need or desire for
regional transit services.
Rural Regional Transit Service Criteria
As noted above, a methodology for evaluating and classifying rural regional mobility services requires
characteristics or criteria for the classification - which do not exist in any of the available data sources. Ideally, a
reporting system would include the following measures to assess existing and potential services, and it is
possible that a number of states with their own reporting systems could add factors from this list to better
describe rural transit services, including those that might be classified as regional:
service availability
access to key destinations
connectivity
These factors can be used to describe and classify and compare rural regional mobility services—or as a basis
for planning rural regional services.

Identification of Case Studies
26
Service Availability
This criterion measures when the rural regional transit service operates in terms of days per week, the time
periods when trips are provided, and the length of time the schedule allows a rider to remain at the regional
activity center. A rural regional transit service with daily service, multiple round trips throughout the day
provides a higher level of service for rural riders than one that operates only on selected weekdays, with a
schedule that gives riders just a partial day at the regional activity center. For example, a service that operates
every weekday with a schedule that allows a rider to remain at the activity center for at least nine hours during
the day would provide an individual in the rural community the opportunity to have a full-time job with
traditional office hours.
Service availability has three components:
Day service is provided: Does the service operate every day or less than that?
weekdays and Saturdays/Sundays
weekdays
less than five days per week
Service span: Does the schedule of trips allow a rider to access and remain at the regional activity center for
less than a full day, for a full day of at least nine hours, or for a full day plus evening hours? A transit service
with the latter schedule, for example, would provide opportunities for an individual living in a rural area to
take night classes at the community college.
daytime
partial day - less than 9 hours
full day – more than 9 hours
full day and evening
Number of round trips: Does an individual have only one choice of trips to travel to and from the regional
activity center, or does the transit service provide more than one round trip per day of service?
one
two to three
more than three
Access to Key Destinations
This criterion assesses whether the rural regional service provides direct access to key destinations at the
regional activity center, or if the rider must transfer to some type of local transportation service once arriving at
the regional activity center to get to the desired final destination. The transit service does not control which key
destinations are available at the regional activity center, such as a major hospital or VA medical center, intercity
bus terminal, or community college, but it does have control over whether it directly serves such destinations.
Direct access provides a higher level of service.
This criterion could be measured as:
number of key destinations directly served; no transfer required, and
number of key destinations not directly served; riders must transfer to a local transportation service.

Identification of Case Studies
27
Connectivity
Connectivity with other transportation modes is an important attribute for rural regional mobility services,
expanding travel opportunities for rural residents to travel outside their region.
This criterion has two components: first, measuring whether the rural regional transit service connects with
other modes and, second, if there is schedule connectivity, that is, whether the schedules of the two
transportation modes are coordinated.
Does the rural regional transit service connections to other modes? If yes, which modes?
Coordination of schedules: If other modes are served, does the rural regional service coordinate its schedule
with the other transportation modes and what is the extent of the coordination?
schedules are not coordinated
schedules are coordinated
schedules and transfers are coordinated, with interlined ticketing (A rider can buy a ticket on the rural
regional service that also serves as the ticket for the connecting service.)
These factors can be used to be descriptive, and to the extent that different services are identified that have
similar characteristics might be used as a basis for a typology (like that developed by Colorado DOT). There is
concern about using them as a basis for a ranking, or the development of scoring that would imply that one kind
of service is better than another for the simple reason that the level and pattern of demand varies so much across
the country that the most appropriate level of rural regional service may not rank highly. For example, a very
small town in a rural area that is located far from the nearest regional center may not be able to support seven-
day a week service, with multiple frequencies to meet employment, educational and human service needs, and it
would make more sense to describe the kind of service that is feasible for that environment on a continuum that
would suggest a path for future development, as opposed to simply ranking less-than-daily service, once a day,
as inadequate or poor.
Approach to Categorizing States
With the limits of published data for the study’s purposes, we had hoped that that the level of rural
regional mobility in each state could be assessed in two ways: first, by collecting data on the level of
service provided by their rural regional transit services (using criteria discussed above) and second, by
the support they provide that facilitates the development and operation of rural regional transit services.
The plan was to survey the states, ask them to identify rural regional services for case studies, and then
apply the criteria to the services. The second type of information we desired from the states was about
the state transit programs, and any policies or programs that had been developed to address regional
service. The results of the survey provided some of the desired information, but not in a way that
would allow the study team to classify states based on their rural regional mobility. Enough
information was provided to allow the development of a general categorization of state program
approaches, and to seek case studies of rural regional services in each category.
State Policy and Support for Rural Regional Transit Services
The literature and our experience with rural transit both suggest that states can play a role in improving rural
regional mobility. This includes actions such as providing funding and technical support for the planning,

Identification of Case Studies
28
development and operation of the services. The experience in Vermont, for example, demonstrates that state
support through policy initiatives can foster rural regional transit and improve mobility for rural residents.
Toward this end, we assessed each case study state as to whether it has any of the following:
enabling legislation that provides authority for jurisdictions to jointly fund and operate rural regional transit
services.
funding earmarked for rural regional transit services (either state funds or state priorities for the use of
available federal funding).
technical support to assist jurisdictions to plan and operate rural regional transit
state-funded demonstration projects that feature rural regional transit
Survey of the States
We surveyed state DOTs to obtain information about each state’s rural regional transit services, asking
questions about whether there had been any identified need for regional services, the source of that information,
whether or not there were any state programs or policies in support of rural regional services, and lastly asking
the state DOT staff to identify particular rural regional services or operations that could be considered as case
studies. The plan was to follow up with interviews of the potential case study sites, collecting information about
the context and level of service. In a general to have a sense that methodology was followed.
A draft survey instrument was developed as a six-question online survey. An initial test of the survey was
conducted with two state DOTs. Following the test, the survey was updated significantly to include more
questions to draw out details and potential case studies. The final version consisted of six sections based on the
initial six questions, by adding several follow up questions to each section. The online survey was designed so
that if a participant responded “no” to the first questions in a section, they would be sent to the next section,
skipping all of the follow up questions for that section. Most of the questions were open ended, asking for
resources, like transit plans, studies, policies and initiatives that either identified a need for or supported rural
regional transportation in the survey participant’s state. Additional questions asked whether the state or agency
had policies or programs supporting regional services, and if so, what they were and how they were
implemented. Respondents were also asked to identify systems or services that might be good case studies,
along with contact information if available.
The final survey included 59 questions. A copy of the questionnaire is included as Appendix C. The
survey was designed to use an on-line survey provider. An introductory email letter and link to the survey site
was sent by email to 72 state managers and 54 state RTAP managers. Recipients were encouraged to forward the
survey to regional state managers and others involved in regional transportation. The original invitation was sent
in November 2015 with a reminder email sent the following week. Individual correspondence with states
continued for some time after the stated closing dates. The reminder also included direction that the survey could
be forwarded to regional planning agencies.
Thirty-six recipients responded to the survey, representing twenty states. Table 2 lists the states and agencies
that submitted surveys for each state. Seventeen of the twenty states had responses from a state agency related to
transportation, if not the state department of transportation itself.

Identification of Case Studies
29
Table 2. States responding to the survey
State
Number of
Surveys
Submitted Agency Completing the Survey
AK 1 Alaska Department of Transportation & Public Facilities
AL 1 Alabama Department of Transportation
GA 1 Georgia Department of Transportation
IA 1 Iowa Department of Transportation
IN 1 Indiana Department of Transportation
KS 1 Kansas University Transportation Research Center
MN 1 Minnesota Department of Transportation- Office of Transit
MT 1 Montana Department of Transportation
NC 1 North Carolina Department of Transportation-Public Transportation Division
ND 1 North Dakota Department of Transportation - Transit Program Manager
NE 1 Nebraska Department of Roads
NM 1 New Mexico Department of Transportation
OH 11 Marion Area Transit, Huron County Transit, Seneca County Agency
Transportation, City of Ashland, City of Sidney/Shelby Public Transit, Lancaster-
Fairfield Public Transit, City of Bowling Green, HAPCAP, Community Action
Committee of Pike County, MVRPC, Crawford County Council on Aging
OR 2 Oregon Department of Transportation, Rail and Public Transit Division
PA 1 Lower Anthracite Transit System
SD 4 South Dakota Department of Transportation, River Cities Public Transit,
Brookings Area Transit Authority, Inc., Arrow Public Transit, Inc.
TN 1 Tennessee Department of Transportation
UT 1 Utah Department of Transportation
VA 1 Department of Rail and Public Transportation
WI 3 Wisconsin Department of Transportation, City of Prairie du Chien (SMRT Bus -
three county system), Merill Transit System
Identification of Case Studies
30
Survey Issues
The survey responses confirmed that there is not a consistent view of what constitutes rural regional mobility,
but it is possible to identify state programs that self-identify as having rural regional mobility as a concern
worthy of state policy consideration. Beyond that, in the initial rounds of survey efforts, many states did not
respond or did not respond with enough information to facilitate a determination of whether or not there is a high
level of regional mobility or whether or not there are potential “best practice” case studies. In a number of cases,
respondents had not understood the focus of the study. Programs or state initiatives known to the study team did
not appear among survey responses and required more directed contact.
Based on an analysis of the results of the survey, it was determined that follow-up calls would be needed to
improve responses, identify states with potential best practices, and obtain more information from those that had
identified potential services as case studies. Many respondents indicated that local or regional coordination plans
had been done, but it was not clear whether these plans had identified either rural regional needs or rural
regional service strategies. Materials were reviewed and follow-up calls made to see if the responses referenced
rural regional needs or services beyond the demand response provision of Medicaid non-emergency medical
transportation.
Many survey participants provided links to or titles of state-wide transit plans and additional contacts as
resources to investigate rural regional transportation in their states. However, upon review of these reports or
documents in many cases there was little additional information about rural regional needs included, or
identifications of particular rural regional services that might be good case studies. The interviews also led to the
identification of additional issues in terms of identifying relative differences in rural regional mobility, or in
terms of identifying potential case studies:
A number of reported examples of rural regional services subsequently turned out to be provisions of longer
distance human service trips on a demand response basis. For example, a rural provider providing a Non-
Emergency Medicaid Transportation (NEMT) trip on an exclusive demand response basis; rather than a
regional service offered on a scheduled basis and open to the general public.
Some potential examples were determined to be crossing county lines within or between urbanized areas
(funded by Section 5307), rather than either connecting rural areas to urbanized or being provided entirely
within rural areas (eligible for Section 5311).
Some potential case studies suggested were Section 5311(f) funded services that we classified as intercity,
rather than regional, based on schedules that did not permit a same-day return trip or were clearly designed
to make connections with the national intercity network without regard to other trip needs. As will be seen,
we did identify a number of case studies that utilize Section 5311(f) funding, make intercity connections,
allow same-day trips, and serve other trip purposes.
In a number of cases, potential case studies of rural regional services are, or have become, services between
Urbanized Areas (UZA) rather than rural services (or even services linking non-urbanized to urbanized
areas). Following the 2010 Census many non-urbanized areas were reclassified as UZAs, or were added to
UZAs, and services linking them are not rural in the sense that operations between them can be (or are)
funded with FTA Section 5311 program funds. Even though some of these services originally could be
described as rural, or were nominated by states or their own management as potential case studies, they have
not been included. Many appear to offer relevant models, and are more productive due to the higher
ridership between larger population centers - but the point of this project is to look at rural regional services.

Identification of Case Studies
31
There was some difficulty narrowing the study enough to focus specifically on rural regional services,
identifying cases that would enable identification of best practices, and shaping a study that fit within
resources available. It should be noted that we did not receive responses from many states, even after
follow-up, and it is understood that there may be other examples of rural regional service that would meet
the scope of this study.
State Programs, Regional Organizations and Regional Services
Another issue in identifying “best practices” is the overlap between policy efforts to create regional
administrative structures or organizations and regional services. Regional organizations can more easily create
and support regional services, but regional services can be developed and implemented without necessarily
having regional organizations. Given the adopted definition of rural regional transit services (for this study), this
step in the research process tried to determine if the services identified by the state agencies were open to the
general public on a scheduled basis, whether provided by regional entities or not, and if implemented by a
regional organization how that supported the development of regional services.
A typology of state roles regarding rural regional services would likely include three general classifications:
Top-down: States that have done state-level analyses and implemented regional services directly or
mandated them in some way.
Bottom-Up: States that have identified a need for regional cooperation, and are providing encouragement
and support for local efforts, for example by providing technical assistance, funding for feasibility studies,
funding for transition costs, or incentive funding for implementation of regional services. States may focus
their efforts on creating regional organizations or on regional services.
Permissive: State transit programs that have not identified a particular need or benefit for regional
organizations or services, are therefore not addressing rural regional needs in any specific way. These states
may well see the level of demand for regional connections as being met by demand response rural services
that cross county lines (likely providing human service trips such as medical trips) and by rural intercity
services.
In addition, there are examples of states that combine approaches, such as Kansas, which has legislatively
mandated rural regional transit organizations, but is incentivizing rural regional services as a potential strategy
that may be implemented by regional organizations. The case studies were selected to include examples
representing all three kinds of state policy response.
Selection of Case Studies
The information collected through the survey process and additional efforts was used to identify case studies.
Case studies were chosen to:
include examples from all three types of state program/policy types,
include services that are provided by a variety of organizations, including states, private non-profit
providers, tribal entities, and local public transit providers (both local and regional entities)
illustrate the use of a variety of funding sources
include services designed to serve multiple trip purposes
include services that are operated with Section 5311(f) intercity funding and make intercity connections, but
also address rural regional needs

Identification of Case Studies
32
Figure 2 provides a map of the states with case study sites, Table 3 presents an overview of the case study
sites in terms of these selection factors and Table 4 provides a more detailed summary of the state program
context, the local case study example, and the rationale for including it as a case study. Not all of the
states/systems that responded to the survey are included in the final list of case studies. In some of the case
studies the state’s programs and policies are a main focus, with an example of a rural regional service in that
state. In other case studies there is no particular state support or initiative regarding rural regional transit
services, but at the local (regional) level entities have planned or implemented rural regional services that fit
within the study focus.
Figure 2. Map of case study states

Identification of Case Studies
33
Table 3. Case study overview
"Top
Dow
n""B
otto
m-U
p""P
erm
issi
ve"
Impl
emen
ted
Plan
ned
S. 5
311(
f)
Trib
al
Stat
e In
cent
ives
Oth
er U
niq
ue
City
or C
ount
yPr
ivat
e N
on-P
rofit
Cont
ract
Inte
rcity
Re
gion
al P
ublic
Sing
le E
ntity
Mul
tipl
e En
titie
s
State Operator is a:
State Role Service Service Funding Mix Includes: Operator Type
California Lake Transit Authority
Colorado South Central Council of Governments
Iowa Dennison to Storm Lake Commuter
Kansas Flint Hills Area Transportation Agency
Maine ShuttleBus Zoom Intercity/Portland
Michigan Alger County Transit
Minnesota Central Community Transit
Montana Flathead Transit and North Central Montana Transit
New Mexico North Central Regional Transit District
Oregon North by Northwest Connector Network (five systems)
Vermont LINK regional commuter services (four operators)
Wisconsin Scenic Mississippi Regional Transit

Identification of Case Studies
34
Table 4. State programs, case studies, and the rationale for inclusion
State Rural Regional Policies Recommended Case Study
Rationale
California
California state law facilitates creation of Joint Powers Authorities (for many purposes, including public transportation) allowing public entities to jointly create agencies to address public purposes. As a result there are many rural regional transit authorities. At the same time there are no legal barriers that prevent an agency from serving points outside its base jurisdiction.
Lake Transit Authority is a joint powers authority that includes Lake County, and the Cities of Clearlake and Lakeport. It operates public transit throughout Lake County, and has developed connecting rural regional intercity routes that link key points in Lake County with Napa and Mendocino Counties. Lake Transit Route 7, Route 4 and Route 1 are funded with FTA Section 5311(f) rural intercity funds. They cross county lines to connect with transit systems in the other counties and Greyhound.
Rural transit system providing regional routes that cross county lines, serve multiple markets (students, workers, medical, and intercity connections) utilizing local, state and S 5311(f) funding.
Colorado
Colorado Department of Transportation conducted a regional and intercity bus plan in 2014 and is completing an update of this plan. Both documents and the recent statewide transit plan identified needs for a statewide coordinated network that includes intercity bus services, regional commuter services, rural regional services (lower frequencies in more rural areas) and essential mobility services (infrequent or demand response specialized services). CDOT has used S.5311(f) funding to address gaps in service provided by private intercity carriers, has implemented regional express buses (branded as Bustang) in 3 corridors focused on Denver and is in the implementation planning stage for multiple corridors of rural regional service.
Planning and implementation activities for rural regional services as called for in the regional and intercity bus planning process, following the model established by the state’s Bustang commuter service. The next phase of the plan involves development of regional services allowing day trips from rural locations to regional centers for medical, personal business, and intercity connections. Existing rural regional service operated by South Central Council of Governments (SCCOG) from Trinidad to Pueblo is under consideration for development into a state-supported rural regional service. The case study would examine current SCCOG services and issues involved in expanding its market emphasis.
Example of a state taking the initiative to design, fund and implement rural regional services as part of an overall plan for a coordinated statewide transit network. Identifies service and funding issues for an existing rural regional service that has a primary focus on human service as the focus. Expands to include more general public usage and intermodal connections.

Identification of Case Studies
35
State Rural Regional Policies Recommended Case Study
Rationale
Iowa Iowa has a long history of regionalizing its transit services, beginning in 1976. The evolution of the state’s transit regionalization results today in 16 regions: Iowa has 99 counties. The rural regions of these counties are divided into one of the 16 rural regions. Within each region, a designated transit system or agency is responsible for administering and/or providing transit service. Service within each of the 16 rural regions is demand response transportation (DRT). County governments decide on the level of service within their county. The transit systems operate regional services within their regions, but region-to-region services are limited.
A recent example of the development of a rural regional service is the planning and funding for Denison to Storm Lake Commuter Service in Region 12. An employer moved their plant to another county, and regional transit service was proposed to link previous employees with new jobs. The service is planned to serve approximately 72 employees. A unique combination of funding will support the service. The state’s Economic Development Authority is funding 50%, Monogram Foods is funding 25% and rider fares are expected to support the remaining 25% of operating expenses. The project is funded but operations have not yet begun.
Demonstrates process for identifying particular rural regional need, identifying stakeholders, developing a service plan, and obtaining funding from sources other than normal transit programs—which may be required to implement other rural regional services.
Kansas In 2010, the state’s Transportation Works for Kansas (T-WORKS) legislation provided a significant increase in state transit funding linked to a restructuring of statewide transit into a regional structure that would form the basis for future transit development. KDOT subsequently implemented the regional structure through development of a statewide business plan, the KDOT Regional Transit Business Model Implementation Plan. The regions are designed to implement several key strategies, including the development of regional services. A subsequent refinement is now restructuring the state into 10 Coordinated Transit Districts. The program provides for additional state funding for vehicle capital to operate regional services, scheduling and dispatching technology, and Mobility Management.
The Flint Hills Area Transportation Agency (ATA) is a private non-profit transit agency that has taken a lead role in developing regional services connecting the City of Manhattan with neighboring counties, implementing a key strategy of the KDOT regionalization initiative. Originally service was focused on the City of Manhattan and Riley County, but regional expansion has added service to the Green Valley and St. George areas of Pottawatomie County, Fort Riley and Geary County including Junction City, Grandview Plaza, and Milford. As Manhattan is now an Urbanized Area, ATA will be using S. 5307 funding to support services in the urbanized area, and S. 5311 for rural regional services.
Using state funding intended to support development of regional services, ATA, FHAT hired a mobility manager and purchased new vehicles to expand routes across county lines. It represents the most highly developed implementation of the KDOT rural regional organizational model.

Identification of Case Studies
36
State Rural Regional Policies Recommended Case Study
Rationale
Maine MaineDOT is required by state law to divide Maine into geographic regions for the purpose of coordinating and providing public transit. It has designated 8 transit regions, 9 regional transit providers (and 2 additional providers within existing regions). Rural regional needs were identified in the recently completed Maine Strategic Transit Plan 2025 and in the 8 regional Local Coordinated Plans. Maine DOT provides funding for rural regional transit services including state funds for local match. It also provides technical support and funding for demonstration projects. MaineDOT provides funding support for 2 private sector intercity services (Bangor to Caribou and Calais to Bangor), as well as one public sector service (Biddeford-Saco-Old Orchard Beach to Portland).
One of the designated regional transit providers, the Biddeford-Saco-Old Orchard Beach Transit Committee, operating as ShuttleBus Zoom, provides rural regional services from Old Orchard Beach into Portland. The Zoom Turnpike Express starts in Biddeford and travels to Portland via I-95, with stops at park and ride locations along the way. Service is weekday only, peak hour-peak direction. In addition, Shuttle-Bus Zoom recently implemented its Intercity/Portland service, providing local service from Biddeford, Saco, Old Orchard Beach and Scarborough using local roads. The Portland/Intercity service utilizes Greyhound In-kind match and Section 5311(f) funding, and offers interline ticketing with Greyhound (and the national interline system). It operates 7 days per week, with up to 7 trips per day on weekdays. Stops in Portland include the Greyhound terminal and the airport.
ShuttleBus Zoom has developed a rural regional service that addresses both needs for express commuter services and local service directly to towns off the interstate, utilizing S. 5311(f) intercity funding and in-kind match to address a variety of rural regional travel needs.

Identification of Case Studies
37
State Rural Regional Policies Recommended Case Study
Rationale
Michigan Michigan DOT was one of the first to support rural intercity bus service beginning with a state-funded program. The intercity network continues today as one kind of connection between regions. Often these services are scheduled to provide connections in major urban areas and do not meet needs for connections from rural areas to regional centers at times that allow for a work trip or a same day trip for a medical appointment. There are a large number of rural county and city systems, however, few have developed regional links to cross county lines. The MDOT approach to development of regional services has been permissive, allowing local initiatives and providing technical assistance. Previous feasibility studies for regional services in the Upper Peninsula and western Michigan identified a number of issues in developing regional service. One example of a rural regional service that has developed is the Regional service operated by Alger County Transit.
Alger County Transit (ALTRAN) is the public transit operated in Alger County, providing local county-wide dial-a-ride service and also operating a weekday rural regional route from Harvey and Munising in Alger County to the regional center of Marquette, in the neighboring county. There are 3 scheduled round-trips per day, at times that would permit work trips or medical appointments. The service also carriers packages. ALTRAN provides Backpacker service for recreational trips.
Will focus on development of a rural regional service in Michigan with particular attention to identification of the potential market, funding and organizational support for regional service, and its relationship to other transit services in the region.

Identification of Case Studies
38
State Rural Regional Policies Recommended Case Study
Rationale
Minnesota The Minnesota Department of Transportation’s Office of Transit conducted the Greater Minnesota Transit Investment Plan in 2011. This led to the Transit For Our Future Initiative to help established 5311 and 5307 transit providers implement the Three Cs: Coordination, Cooperation and Consolidation. MnDOT developed a manual providing a menu of potential regional coordination actions, along with training and technical assistance. The initiative provides incentive funding for operation of regional services, technical assistance and transition costs. Much of the emphasis has been the advantages of regionalizing from sharing administrative, capital or technology costs, but studies have addressed the potential for regional services. The initiative provided funding for several regional coordination plans and market assessments. All projects must demonstrate partnerships among one or more established public transit systems.
The case study is actually a focus on the state program initiative, combined with a more detailed look at the status of implementation. One of the first results of the state initiative is the merger of 2 rural systems, Kandiyohi Area Transit and Renville County Heartland Express, to form Central Community Transit (CCT), in January 2015. CCT Bus provides transportation for all of Kandiyohi County and Renville County residents with a fleet of 21 buses and over 50 volunteer drivers throughout the 2 counties. A majority of the transition cost was covered by a grant from MnDOT under the initiative. CCT regional services are currently provided as demand response service, with current route deviation routes in Kandyohi County. A second element of the case study is MnDOT support for the Southeast Minnesota Travel Study, due to be completed in March 2016. This project is evaluating the need for intercounty travel in an eleven-county region of southeast Minnesota. In addition there have been 2 other regional coordination studies.
Addresses development of a state program to facilitate and incentivize development of rural regional systems by providing guidance, tools, and technical assistance encouraging local systems to increase regional collaboration without state imposition of a regional structure, or direct state implementation of regional services.

Identification of Case Studies
39
State Rural Regional Policies Recommended Case Study
Rationale
Montana Montana Department of Transportation (MDOT) administers the federal rural transit programs in the state. MDOT’s federally mandated statewide transportation plan, TranPlan 21, addresses public transportation. The most recent version from 2008 notes decline in intercity bus service and the consequent need for regional connections. A statewide intercity bus plan completed in 2012 further analyzed the need for such service focusing on need for intercity services that would make stops in the state during daylight hours when local transit providers could provide connections. It also developed criteria for identifying unmet needs, which could be used in evaluating funding requests for rural intercity services. Subsequent regional planning efforts identified needs for regional connections which led to development of two rural regional (intercity) routes that utilize Section 5311(f) funding.
Flathead Transit Montana Flathead Transit is a service of the Confederated Salish and Kootenai Tribes with daily passenger service between Missoula and Whitefish. This service connects with Greyhound, Amtrak and local and regional services in Missoula. The project is being funded by MDOT and is matched with Greyhound miles. The transit program logs in 632,256 annual vehicle revenue miles and 44,540 riders. North Central Montana Transit (NCM) North Central Montana Transit is a public transportation system transit route designed to serve the Hi-Line communities of Hill and Blaine Counties and surrounding communities and provide coordinated services with Fort Belknap and Rocky Boy’s Transit systems. NCM Transit is operated by Opportunity Link, Inc., established in partnership with North Central Montana area organizations, including local and tribal government agencies, social service organizations and educational institutions.
Both of these transit systems are good examples of coordination and support to provide regional linkages. They have developed these services working with multiple community players, including tribal and local government, community organizations, private intercity transit, social services agencies, and educational institutions. The services are provided in a very low-density region where distances to basic services are long, and could provide a model for low-demand regional service.

Identification of Case Studies
40
State Rural Regional Policies Recommended Case Study
Rationale
New Mexico
Regionalization is allowed through state legislation, with additional legislative authority provided to RTDs to increase local taxes to help fund the RTD with voter approval. The state is supportive and provides technical assistance as well as state planning funds at the outset. As of 2012, New Mexico has 4 RTDs, 2 of which have voted in an increase to the gross receipts tax. Within the service area of regional transit districts, they are responsible for identifying and implementing regional services. New Mexico DOT’s Transit and Rail Division has developed and implemented regional services, including a commuter rail line (Rail Runner), and a network of regional commuter buses (Park and Ride service).
North Central Regional Transit District (NCRTD) is made up of 4 counties, 4 cities, and 6 tribal entities. The first of the state’s regional authorities to be formed, it directly provides services on 20 routes across the region. As a regional entity, it provides funding for regional services delivered by local systems in Santa Fe and Los Alamos, and the NM Rail Runner Express, an additional means of providing regional connectivity. The case study would examine the role of NCRTD in developing and delivering rural regional services, as well as supporting regional routes delivered by other entities. The NMDOT Park and Ride express network will be included in the case study as an example of rural regional services directly provided by a state DOT
Illustrates the ability of a regional entity to develop and implement regional services within a region, with additional connectivity provided by services developed and implemented by the state DOT. Also demonstrates the role of regional taxation authority in enabling the creation of a largely rural regional transit system.

Identification of Case Studies
41
State Rural Regional Policies Recommended Case Study
Rationale
Oregon
Although Oregon DOT does not have an initiative or program specifically aimed at development of rural regional organizations or services, a new program, the Transit Network Program, uses 5311(f) and other funds to provide grant funding for projects that improve the utility, efficiency and safety of Oregon’s transit network. ODOT uses GTSF data from 62 providers and open source software developed by Oregon State University to identify “key transit hubs” where three or more fixed-route transit services connect. Investments are prioritized in these hubs. The Transit Network program encourages collaboration and coordination between transit services, and investments in passenger information systems, planning, services, mobility management, technology and passenger amenities. ODOT supports state-contracted gap-filling services (the POINT network) and funding for local/regionally developed regional services. The North by Northwest Connector is five transit systems that developed a regional network with special branding, utilizing (in part) Section 5311(f) intercity funding provided by ODOT.
The North by Northwest Connector Network (NNC) is comprised of 5 local transit systems, partnered to develop and sustain a multi-county regional network. The project began with a $3.5 million U.S. DOE grant and is defined by a regional inter-governmental agreement. Partner agencies jointly apply for funding, and share administrative costs. The project has included development of regional routes by modifying local services and of higher quality transfer points at major stops where riders could make scheduled connections, as opposed to previous haphazard connections at county lines. New services have been combined under a common brand which is incorporated into existing agency brands, but ha not replaced them. There has been coordination of fares, and a regional visitor bus pass is available, supporting travel in the region between Willamette Valley and the coast. Services are designed to attract multiple types of riders, and strategic partners includes 2 tribal confederations, an urbanized area transit system, Greyhound, Amtrak and its thruway bus system, and local towns that are supporting improved pedestrian access and stops.
Would be a good example of multiple partners collaborating, including public advocacy for funding. Unique funding from a 3-year, 2001, demonstration grant from the U.S. Department of Energy (DOE) through its Energy Efficiency and Conservation Block Grant Program to create the North by Northwest CONNECTOR, an initiative to connect county-based operations. Another unique aspect of this initiative was the marketing to and services for tourists. The CONNECTOR appeals to a wide array of travel needs, from essential options to reach employment or health care, to tourists looking for a way to reach key destinations along the coast or in the valley, and college students and faculty accustomed to living less dependent on private automobile ownership

Identification of Case Studies
42
State Rural Regional Policies Recommended Case Study
Rationale
Vermont Following the reduction of intercity services
previously provided by Vermont Transit Lines, Inc., and in response to a growth in long-distance commuting, the Vermont Agency of Transportation (VTrans) worked with public transit providers to develop a network of regional connectors timed to link smaller towns with major employment centers. VTrans provided start-up funding using Congestion Mitigation and Air Quality (CMAQ funding). After 3 years, continuation funding from the state was provided, based on successful operation as measured against VTrans performance measures. They have been included in the base operations of each of the providers, which are funded by a combination of local funds, state transit funding, federal S.5307/S.5311 and other sources. Other regional services have also been developed connecting rural points to employers in larger cities.
The case study includes the state’s role in funding and planning regional services, and the local providers of the service. These include the state’s urbanized provider, Chittenden County Transit Authority (CCTA) and rural providers Addison County Transportation Resources, Inc. (ACTR), Green Mountain Transit Authority (GMTA), and Rural Community Transportation, Inc. (RCT). Services are branded as LINK schedules (one route is branded as the Route 2 Commuter). Routes connect Middlebury and St. Alban’s to Burlington, Burlington to Waterbury and Montpelier, and St. Johnsbury to Barre and Montpelier. Schedules are designed to address commuter needs. Some services are operated jointly, with each partner operating particular trips, while others are entirely provided by a single operator.
These services demonstrate how separate rural systems can work together to provide rural regional commuter services without having to create a regional entity. The services demonstrate different methods of sharing operations while maintaining unique fare structures. The role of the state in using CMAQ to support development of the network is also important.

Identification of Case Studies
43
State Rural Regional Policies Recommended Case Study
Rationale
Wisconsin
Wisconsin DOT administers federal transit programs and provides funding to local rural transit projects and for Section 5311(f) rural intercity services. There is no regulatory barrier to developing rural regional services, and rural regional needs have been identified in local coordination plans. The DOT has provided support for one particular three-county rural regional system, the Scenic Mississippi Regional Transit (SMRT) system, in southwest Wisconsin.
In order to retain and expand local businesses, the City of Prairie du Chien worked with surrounding communities to obtain WSDOT funding for a regional transit system feasibility study. Addition of other counties and agencies led to an expansion of the focus of service to include a number of trip purposes. After some setbacks in initiating service, the SMRT system now uses 3 buses to provide 5 round-trips per day on 3 regional routes that cross county lines linking key destinations across the region. State/federal funding is critical, but there is also local funding and financial support from private sector business partners.
Documents local identification of a need for regional connections in a rural area, development of regional support through a feasibility study, and implementation of a regional service that connects large employers, major shopping areas, educational institutions and medical facilities—addressing both work trip needs and senior transportation needs.

Identification of Case Studies
44
References
Godavarthy, Ranjit, Jeremy Mattson, Patrick Nichols, Del Peterson, and Jill Hough. Developing a Method
for Assessing National Demand-Response Transit Level of Service. University of South Florida, Tampa:
National Center for Transit Research, 2015.
Godavarthy, Ranjit Prasad, Hough, Jill, Mattson, Jeremy, Developing a Method for Assessing National
Demand-Response Transit Level of Service, North Dakota State University, November 2015.
http://scholarcommons.usf.edu/cgi/viewcontent.cgi?article=1495&context=jpt
Kansas Department of Transportation, Office of Public Transportation. KDOT Regional Transit Business
Model Implementation,: guildines for Transitiong to the New CTD Boundaries, April 21, 2015 – Final.
https://www.ksdot.org/Assets/wwwksdotorg/bureaus/burTransPlan/pubtrans/pdf/Regional%20-
%20CTD%20Transition%20Guidelines.pdf
Minnesota Department of Transportation, 2016 Transit Report: A Guide to Minnesota’s Public Transit
Systems. January 2011.
http://www.dot.state.mn.us/transit/reports/investmentplan/pdf/2011%2002%2010%20Final%20Investmen
t%20Plan.pdf
Peter Schauer Associates, Boonville, Missouri, with Millar, William, Meyers, Tom and Rothe, Rich.
MaineDOT, Maine Strategic Transit Plan 2025: Transforming Public Transit, Meeting Future Needs,
and Managing Expectation and Resources. June 30, 2015. Final Report.
http://www.maine.gov/mdot/planning/docs/FinalStrategicPlan.pdf
SRF Consulting Group, Inc. Plymouth, MN. Minnesota Department of Transportation, Office of Transit,
Greater Minnesota Transit Investment Plan 2010-2030. February 2011.
http://www.dot.state.mn.us/transit/reports/investmentplan/pdf/2011%2002%2010%20Final%20Investmen
t%20Plan.pdf
Washington State Department of Transportation Public Transportation Division, 2015 Summary of Public
Transportation, December 2016. http://www.wsdot.wa.gov/publications/fulltext/LegReports/15-
17/2015PublicTransportationSummary.pdf

Case Studies
45
C H A P T E R 4 : C A S E S T U D I E S
Introduction
Based on the rationale provided in the previous chapter, the following states/services were chosen for regional rural case studies:
1. California: Lake Transit Authority 2. Colorado: Colorado Department of Transportation Statewide Network- Bustang and South Central
Council of Governments 3. Iowa: Regional XII Council of Governments Western Iowa Transit – Denison to Harlan
Commuter Service 4. Kansas: Statewide Regional Transit Model – Flint Hills Implementation, Transportation Woks for
Kansas 5. Maine: Portland Intercity Service, ShuttleBus Zoom 6. Michigan: Alger County Transit 7. Minnesota: Minnesota Department of Transportation – Central Community Transit
Implementation “Transit for our Future” Initiative 8. Montana: Flathead Transit and North Central Montana Transit, Regional Connections Fostered
Through Community Organizations 9. New Mexico: New Mexico Regional Transit Districts, North Central Regional Transit District 10. Oregon: Oregon Department of Transportation Transit Network Program, North by Northwest
Connector Program 11. Vermont: Rural Regional Services – Joint Schedules on Regional Routes 12. Wisconsin: Regional Service in Southwest Wisconsin, Scenic Mississippi Regional Transit Bus
Each of these case studies is presented separately within this chapter. Chapter 5 addresses the Lessons Learned from the case studies.

Case Studies
46
This page intentionally left blank.

Case Study: California
47
C A S E S T U D Y : C A L I F O R N I A
Lake Transit Authority
Source: Lake Transit Webpage, http://laketransit.org/ Figure 4. Picture of a Lake Transit bus
Introduction
Lake Transit Authority (LTA) operates fixed route and demand response public transportation in Lake County, California, with connecting regional bus services in Napa and Mendocino Counties. The agency was created in 1996 and recently celebrated its twentieth anniversary. The overall vision statement is clear and simple: “Mobility for all citizens of Lake County.” In order to achieve this, LTA provides different types of services, including routes that it describes as regional and intercity, that provide connectivity between local services in Lake County and larger destinations (and transit hubs) like Napa (Calistoga, Deer Park) and Mendocino (Ukiah) Counties. LTA uses Section 5311(f) rural intercity funding for its regional services because they make connections with the national intercity network outside the county, even as they meet regional needs for a variety of trip purposes.
Organizational Structure
LTA is a Joint Powers Authority (JPA) under California legislation that facilitates creation of multijurisdictional entities to meet public needs. The three components of the JPA are Lake County, City of Clearlake, and City of Lakeport. There is no direct participation from Mendocino or Napa Counties. The LTA is governed by an eight-member board: two members of the County Board of Supervisors, two Lakeport City Council members, two Clearlake City Council members, and two citizens selected by the Lake County Board of Supervisors. This board governs the Lake County/City Area Planning Council,
Source: Lake Transit Webpage, http://laketransit.org/
Figure 3. Lake Transit logo

Case Study: California
48
which is the Regional Transportation Planning Agency that allocates and administers Local Transportation Funds and State Transit Assistance funds in the region. It is also the designated Consolidated Transportation Services Agency (CTSA) for Lake County. CTSA coordinates public transit and human service transportation.
LTA contracts for transit management services, and a separate contractor provides transit operations
and maintenance. There are no public employees involved in managing, operating or maintaining transit services in Lake County, although there is consideration being given to making the Transit Manager an employee.
State Context and Policy Development
The State of California provides a regulatory and funding framework that can support regional services by facilitating the creation of JPA’s through the designation of regional organizations to allocate and administer state transportation and transit funds, and by designation of regional coordination entities.
The California Department of Transportation’s Division of Rail and Mass Transportation (DRMT)
utilizes Federal Transit Administration (FTA) Section 5311(f) funding to provide regional routes at a number of providers. There are currently 33 subrecipients providing regional intercity routes under this program, and program expenditures have grown beyond the 15 percent Section 5311(f) set-aside.
According to DRMT the major limiting factor for further growth in rural regional services is a lack of
funding. The existing regional operators in the program are now facing an across the board funding reduction because the state has used previous reserves and is now limited to the 15 percent allocation from the Section 5311 program. Caltrans sees significant demand for funding for these types of regional services, but is unable to meet it at current funding levels. Because Lake Transit is not a unique program in its use of Section 5311(f) for regional routes, Caltrans has not provided any special or unique support to Lake Transit, although Caltrans has identified it as an exemplary program of this type.
Example of Regional and Intercity Services
LTA operates a variety of service types to meet service needs. There are ten routes, of which six are identified as regional and intercity (Figure 5). Four routes are funded in part with Section 5311(f) funding, and cross county lines to make connections with systems in other counties.
Route 7 Lakeport-Ukiah operates four times per day between Lakeport (in Lake County), and Ukiah
(Mendocino County). In Ukiah, there are connections to Greyhound (at the airport), Amtrak Thruway Bus, and Mendocino Transit Authority (MTA). MTA and Amtrak Thruway bus connections are at Pear Tree Center and make a stop at the airport. It operates as an express service, but there are scheduled stops at Mendocino College and Veterans Clinic in Ukiah (as well as the other transportation terminals). LTA accepts transfers from MTA for a $1.00 discount on its fares, and has free transfers to other LTA buses (if the trip is within the same fare zone as the transfer point). The four round- trips are not scheduled to serve commuters, though there are morning and evening trips. By having that much frequency, there is good connectivity to Greyhound and Amtrak Thruway buses. Route 7 operates Monday through Saturday. The route is approximately 35 miles long, and one-way travel time is scheduled for just under 90 minutes. At the eastern end of the route, in Lakeport, the Route 7 bus is interlined with Route 4.

Case Study: California
49
Route 4 Lakeport-Clearlake provides eight daily round-trips in this corridor along the south side of Clear Lake, of which four in each direction offer interlined connections with Route 7. These trips are an extension of the intercity/regional route to the eastern end of the county. This service is funded in part with Section 5311(f) rural intercity funding. Schedules on this route are hourly in the morning and evening, with two-hour headways for some late morning and later evening trips. One-way running time is about fifty minutes to cover 27 miles. Stop locations are at major intersections and key shopping centers. Service is Monday through Saturday; the last westbound trip and first eastbound trip in the morning do not operate on Saturday.
Route 3 Clearlake –Deer Park provides a connection to Napa County, with transfer opportunities to
the Napa VINE Route 10 Calistoga Shuttle or to the St. Helena Shuttle in Calistoga. Transfers are accepted each way between the two systems. This route offers four daily roundtrips; two of them extending to St. Helena Hospital in Deer Park. The end-to-end scheduled running time is approximately 85 minutes to cover 45 miles for trips that connect Clearlake and Deer Park. Another major destination on the route is Twin Pine Casino. There is also ridership from students and staff at a charter school in Middletown. This route is partly funded with Section 5311(f) rural intercity funding, based on the connection to VINE service and its connection to the intercity network.
LTA lists other routes as regional or intercity, but they do not cross county lines or connect with
intercity modes. LTA has several local routes in Lake County, and provides ADA paratransit dial-a-ride services where fixed route service would require it.
Source: Lake Transit Website, http://laketransit.org/routes-schedules/regional-and-intercity-routes-schedules/ Figure 5. Lake Transit routes
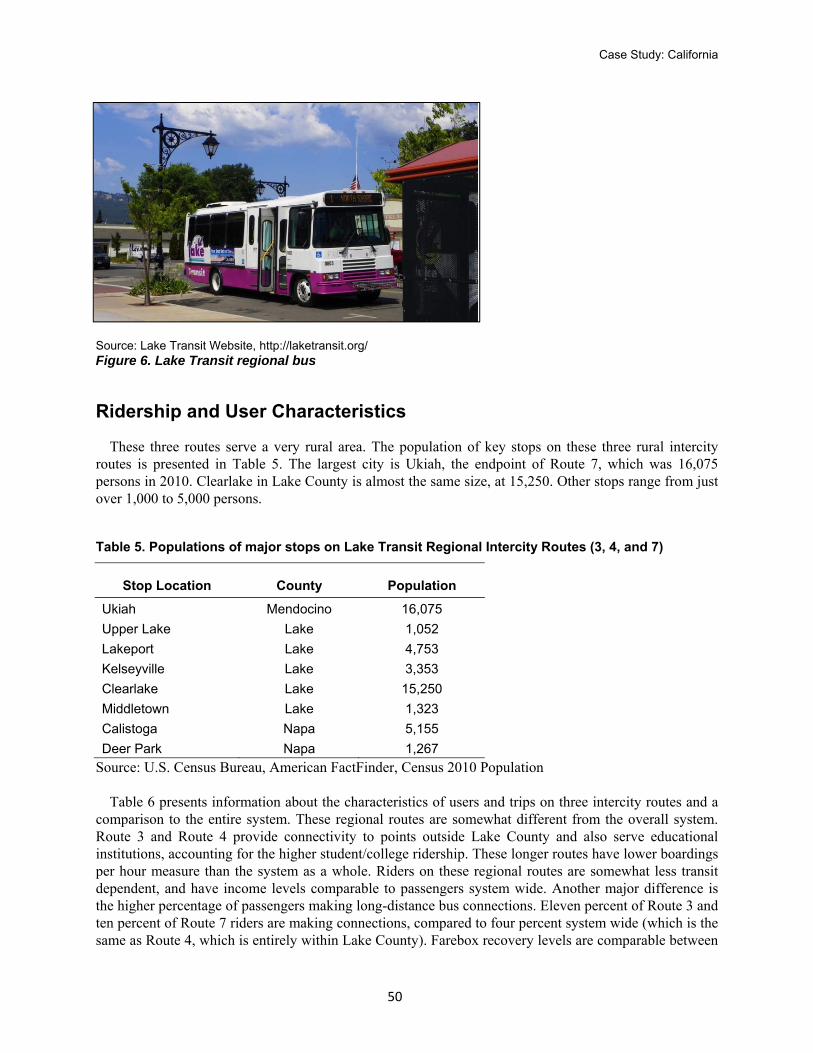
Case Study: California
50
Source: Lake Transit Website, http://laketransit.org/ Figure 6. Lake Transit regional bus
Ridership and User Characteristics
These three routes serve a very rural area. The population of key stops on these three rural intercity routes is presented in Table 5. The largest city is Ukiah, the endpoint of Route 7, which was 16,075 persons in 2010. Clearlake in Lake County is almost the same size, at 15,250. Other stops range from just over 1,000 to 5,000 persons.
Table 5. Populations of major stops on Lake Transit Regional Intercity Routes (3, 4, and 7)
Stop Location County Population
Ukiah Mendocino 16,075
Upper Lake Lake 1,052
Lakeport Lake 4,753
Kelseyville Lake 3,353
Clearlake Lake 15,250
Middletown Lake 1,323
Calistoga Napa 5,155
Deer Park Napa 1,267
Source: U.S. Census Bureau, American FactFinder, Census 2010 Population Table 6 presents information about the characteristics of users and trips on three intercity routes and a
comparison to the entire system. These regional routes are somewhat different from the overall system. Route 3 and Route 4 provide connectivity to points outside Lake County and also serve educational institutions, accounting for the higher student/college ridership. These longer routes have lower boardings per hour measure than the system as a whole. Riders on these regional routes are somewhat less transit dependent, and have income levels comparable to passengers system wide. Another major difference is the higher percentage of passengers making long-distance bus connections. Eleven percent of Route 3 and ten percent of Route 7 riders are making connections, compared to four percent system wide (which is the same as Route 4, which is entirely within Lake County). Farebox recovery levels are comparable between

Case Study: California
51
intercity routes taken as a group and the system, though the Ukiah route has lower ridership (boardings) and farebox recovery.
Funding
One of the unique things about Lake Transit intercity routes is that they are funded in part with FTA Section 5311(f) rural intercity funding. Like most transit systems, farebox revenue is the initial source for operating funding, but leaves a significant net operating deficit. In California, there are a number of potential sources of transit funding for such systems. These include Local Transportation Funds (LTF), generated from a quarter-cent sales tax, with the amount based on sales tax collected in the county. These funds are used for a variety of purposes in addition to the allocation provided to Lake County Transit. State Transit Assistance Funds (STA) are provided by the state from fuel excise taxes. Federal funds administered by Caltrans include the Section 5311 non-urbanized area funding program, utilized by Lake Transit as part of the funding mix. All of these sources are fairly typical for rural transit systems.
Lake Transit is able to use the Section 5311(f) rural intercity funding program for regional intercity
routes. These funds are administered by Caltrans through a separate application process. Although Lake Transit does not currently take advantage of it, Caltrans complements Section 5311(f) by providing toll credits for local match for new services. Lake Transit has been able to use Section 5311(f) funds for capital to purchase buses for regional intercity routes, but it has depended on this funding source for operation of its regional intercity routes.

Case Study: California
52
Table 6. Lake Transit intercity/regional ridership and user characteristics
Route 3 Route 4 Route 7 System
2008 Ridership1 20,168 40,000 12,992 326,8744
2014 Ridership1 21,000 38,000 17,027 335,328
2015 First Half2 10,372 20,065 7,509 196,461
2015 Annualized2 20,744 40,130 15,018 392,922
Passengers/Rev Hr. (first half 2015) 2
5.77 9.17 4.16 7.18
Farebox Recovery 19.6% 24.9% 9.5% 19.2%
User Characteristics3
Employed
-Full-time 12 15 11 18
-Part-time 33 19 33 18
-Retired 15 7 59 20
Not Employed 39 59 56 44
Student Ridership 45 29 63 31
Income Below $35K 100 92 86 92
Income Below $10k 27 57 60 47 Transit Dependent (No car, no license or both)
72 85 85 94
Trip Purpose
School/College 31 28 45 21
Work 25 7 20 23
Shopping 11 28 15 26
Recreation 17 17 20 19
Medical 8 24 15 17
Social Services 3 17 15 7
Long-Distance Conn. 11 4 10 4
Sources:
(1) Lake County/City Area Planning Council, Transit Development Plan & Marketing Plan, Final Report, June 2015,
pp. 6-4, 6-9, 6-15. Total System Ridership is from 2010-2011, p. 1-6.
(2) Lake Transit Authority 2015-2016 First Half Report, 5-11-2016
(3) Lake County/City Area Planning Council, Transit Development Plan & Marketing Plan, Final Report, June 2015,
pp. 2-5 to 2-11.
(4) 2010-2011 Caltrans requires that routes funded under this program be 50 miles or greater in length, and has set a
ceiling of $300,000 per year per operating grant. Federal guidance for Section 5311(f) calls for services to provide a “meaningful connection” to the national intercity bus network. FTA defines “meaningful connection” in terms of serving common stops with schedules allowing transfers to and from intercity bus services. Lake Transit’s Route 7 provides a connection to the Greyhound network in Ukiah, Mendocino

Case Study: California
53
County, and on Route 3 to VINE routes that connect to intercity services in Calistoga, Napa County. Route 4 is funded under this program as it provides connections between these two routes. The three routes function together as one long multi-county route. Federal Section 5311(f) requirements stipulate that these funds cannot be used for commuter services. An examination of Lake Transit schedules for Routes 3, 4 and 7 shows they are designed to make meaningful connections with Greyhound services and Amtrak Thruway buses, with schedules throughout the day to permit a variety of trip purposes, including school/college, shopping, medical, work and intercity connections.
Lessons Learned
Through careful service design, regional routes can be developed that serve a variety of trip purposes and make “meaningful” connections to national intercity bus services.
Connectivity through shared stops, scheduling, and fare transfer policies are important elements in developing viable services.
Even in very rural areas, rural regional intercity services can generate ridership and farebox recovery levels comparable to many local rural fixed route services.
California Case Study References
Lake County/City Area Planning Council, Transit Development Plan & Marketing Plan, Final Report,June 2015, Mobility Planners, AMMA Transportation Planning, and Transit Marketing LLC. Lake Transit Authority 2015-16 First Half Report Executive Summary, Operating Statistics Summary and Financial Status Report, presented at the Lake Transit Authority Board Meeting May 11, 2016. http://laketransit.org/wp-content/uploads/2014/04/5-11-16-LTA-Agenda-Packet-Final.pdf Ogbonna, James, California Department of Transportation, Division of Rail and Mass Transportation, Branch Chief, March 30, 2017 U.S. Census Bureau, American FactFinder, Census 2010 Population http://factfinder.census.gov/faces/nav/jsf/pages/community_facts.xhtml
Wall, Mark, Lake Transit, Transit Manager, July 1, 2016

Case Study: California
54
This page intentionally left blank.

Case Study: Colorado
55
C A S E S T U D Y : C O L O R A D O
Colorado Department of Transportation Statewide Network – Bustang and South Central Council of Governments
Source: Bustang website, http://www.ridebustang.com/ Figure 7. Bustang bus
Introduction
This case study presents a state department of transportation that is in the process of implementing a state-led approach to creating a statewide network of intercity and regional services to provide needed connectivity and transportation choices between rural and small urban places and the state’s major urban areas. In the past, Colorado’s transit program was completely discretionary with regard to local or regional services. However, as the state became involved in choosing routes and services for a statewide intercity network, it identified regional needs as well and so became more involved in planning for and then implementing such service itself. Local initiatives to develop projects that would result in a statewide network often run into institutional issues which the state has helped to overcome.
Organizational Structure
The Division of Transit & Rail (DTR) in the Colorado Department of Transportation “… is responsible for planning, development, operation and integration of transit and rail into the statewide transportation system.” It was created by the legislature in 2009, and administers federal and state transit grant programs in Colorado. The state grant program is known as FASTER, and was created by the same legislation that created the transit division. DTR’s guiding principles include the creation of more modal choices; increased mobility from connecting networks of local, regional and intercity services; and partnering with local agencies, transit providers, the private sector and other stakeholders. These guiding principles have come into play as DTR has taken the responsibility for creating a linked statewide network of services that includes local transit agencies, private contractors, and unsubsidized private transit providers.

Case Study: Colorado
56
State Context and Policy Development
There is history that has led to the DTR taking an active role in creating a statewide network. This history can be said to date back to the mid- 1980’s, when the state transit program was faced with the loss of all Trailways intercity bus service when the firm pulled out of the state. Although there was also Greyhound service, Trailways had provided a comprehensive network of regional services. Some of these regional intercity routes were replaced by Greyhound and its affiliate Texas, New Mexico and Oklahoma Coach Lines (TNM&O). A number of these routes were funded by CDOT under the FTA rural intercity bus program (initially called Section 18(i), later Section 5311(f)). In addition, some local transit operators developed regional connections to fill gaps. In 2005, Greyhound merged TNM&O into the parent company and eliminated unprofitable routes as part of a national restructuring. The former TNM&O route east-west across the state on US 50, although funded by CDOT, was eliminated, and communities along the former route asked CDOT for assistance.
CDOT provided funding for a study of options and eventually led to CDOT issuing a grant solicitation
using Section 5311(f) funding for service from Gunnison to Salida to Denver, and for a feeder connection from Pueblo to Salida. Subsequently CDOT developed and issued route specific solicitations for service in the U.S. 40 corridor for service between Denver and Salt Lake City (funded jointly with Utah), support for services to rural points on I-76 in northeastern Colorado, and finally for service on U.S. 50 east from Colorado Springs to together with Kansas.
In order to evaluate these services and identify where similar services might be justified in the future, in
2008 CDOT conducted the Colorado Statewide Intercity and Regional Bus Network Study. An update was completed in 2014. These studies proposed a statewide intercity network that included both services provided by the market and a number of subsidized routes that could be largely funded under Section 5311(f). It also identified a need for a statewide network of regional services. The regional network defined different levels of proposed service depending on the market – with low levels in corridors primarily addressing human service transportation needs, and high-frequency service for commuter services into major employment centers. The regional network included a number of services already provided by local public transit systems, and a substantial expansion of both existing and new services. At that time there was no funding available for these expanded regional services.
Shortly after the 2008 plan, the state legislation reorganized the transit program at CDOT, creating DTR, and providing state funding for some transit projects. Initially the funding was limited to capital funding and was provided to local systems under a competitive discretionary grant program. It also provided a basis for future transit program development. The other development during this period was the loss of regional commuter service from Colorado Springs into Denver. This service, branded as FREX, ended when a sponsoring local jurisdiction declined to provide needed funding. Therefore, CDOT’s update of the statewide regional and intercity bus plan in 2014 included a focus on three items: developing a proposal for CDOT operation of commuter bus service into Denver; the need to maintain intercity service; and the continuing need for rural regional service to complete the network. The plan further defined regional services as those including long-distance commuter service into the urbanized area, and rural regional service, thus allowing rural/small town residents to make a one-day round-trip to and from regional activity centers, as well as less than daily essential service for human service needs. Subsequently the recommendations of this plan were included in the 2015 Statewide Transit Plan, which documented the unmet needs (Figure 8) and the existing services operated by local public transit entities that could be classified as regional services (see Figure 9).

Case Study: Colorado
57
Source: Colorado Statewide Transit Plan, p. 78 Figure 8. Statewide regional and interregional service gaps
Source: Colorado Statewide Transit Plan, p. 48. Figure 9. Regional transit routes in Colorado

Case Study: Colorado
58
Following these studies, CDOT moved to implement the commuter bus recommendations, using state FASTER funding now available for operating assistance. The service, under the “Bustang” brand, is operated under contract to CDOT and has been well received. Ridership in the first year exceeded forecasts. Additional planning and strategy development work focusing on the intercity and rural regional network resulted in more detailed route and service proposals. This included potential timetables (allowing consideration of potential connections, the possibility of in-kind match, and assessment of potential duplication of unsubsidized service), a strategy for shifting intercity program routes to competitively bid contracts, and extending the statewide branding concept to rural regional services and the intercity network as Bustang “Outrider” service, with a goal of implementing a connected statewide network. Funding includes the Section 5311(f) allocation with Greyhound in-kind match for maintaining the intercity network, and a combination of shifting of resources and limited state operating funds to initiate rural regional services. There is more state funding available for capital, and CDOT will be purchasing buses to be used for intercity and rural regional services (lowers operating costs, improves services, allows common branding).
An example of this approach is the planned development of rural regional services. The overall approach involves developing an RFP process to contract for intercity and new rural regional services, and working with existing operators to determine if and how they can be integrated into the statewide branded network of commuter, intercity and rural regional bus routes. The example below describes one of the successful existing rural regional service that addresses critical long-distance medical transportation needs as a case study in itself. It also presents some of the issues involved in expanding that service to serve a broader market as part of the statewide network. It demonstrates the important role of human service agency transportation funding in supporting a rural regional service.
Example of Regional and Intercity Services
South Central Council of Governments Transit (SCCOG) is the provider of general public transit services in Las Animas and Huerfano Counties in Colorado. It provides door-to-door demand response service locally, primarily serving senior citizens, persons with disabilities, Medicaid clients and the general public. Much of the demand (and the local service) is concentrated in the cities of Trinidad (2015 city population 8,153) and Walsenburg (2015 population estimate 2,898).
SCCOG transit operates a rural regional route three days per week from Trinidad through Walsenburg
and into Pueblo. Trinidad is 86 miles from Pueblo, and is the county seat of Las Animas County; while Walsenburg is 50 miles from Pueblo and is the county seat of Huerfano County. The regional route is open to the general public, and generates approximately 1,500 (1,522 in 2015) round-trips per year. The service provides door-to-door service at origin towns and at the destinations. The regional route starts picking up riders at approximately 8:45 a.m., and may also pick up passengers in Aguilar on the way to Walsenburg. It is scheduled to arrive in Pueblo between 10:45 a.m. and 11 a.m., and begins pickup in Pueblo at 3:00 p.m. leaving by 3:30 p.m. (or whenever the last rider’s appointment ends), with the end of the run at about 5:30 p.m.
The existing service uses the full capacity of the 12 to 14 passenger accessible cutaway small bus used
by SCCOG (Figure 10), particularly when there are persons with mobility devices on board. They average 9 to 10 passengers per trip, so buses are generally full, and there are peaks that fill the
bus. Approximately 15 percent of riders pay a cash fare ($7.00 from Trinidad, or about $0.08 per mile). The remaining riders have their trips paid for by Medicaid or the Area Agency on Aging. About 45 percent of passengers are on Medicaid, 12 percent are in the Area Agency on Aging program (over 60

Case Study: Colorado
59
years of age), and about 3 percent are clients of the Las Animas County Rehabilitation Center. Medicaid funding is very important for supporting this service. In Colorado, Medicaid will pay for client transportation when it is provided on a multi-passenger vehicle for more than one member at a time. The member travelling the furthest distance is reimbursed at the full rate, the member travelling the second furthest distance is reimbursed at half of the rate, and any additional members at one quarter of the rate. If there are several Medicaid client members on a trip, a significant portion of the cost is covered by Medicaid. The Medicaid program benefits as well, with significant cost savings over sending the members individually.
Source: Colorado Statewide Transit Plan, p. 47. Figure 10. Cutaway bus used by SCCOG
The route between Trinidad, Walsenburg and Pueblo on I-25 is also served by Greyhound Lines, though the service has been substantially reduced and now consists of two northbound departures from Trinidad at 7:05 a.m. and 2:00 p.m., with the second bus stopping in Walsenburg at 2:40 p.m. Arrivals in Pueblo are at 8:35 a.m. and 3:35 p.m. Southbound from Pueblo there is a single Greyhound bus leaving Pueblo at 2:55 a.m., arriving in Walsenburg at 3:50 a.m. and in Trinidad at 4:30 a.m. These schedules would not allow anyone from Trinidad and Walsenburg the option of a day trip to Pueblo, particularly because the return trip would have to take place in the early morning hours of the following day. The SCCOG service does not compete with Greyhound even though they serve the same points, because of the schedule.
The CDOT Regional and Intercity Plan recognized the success of SCCOG in providing this rural
regional service on a scheduled basis, open to the general public, and it proposed building upon it as part of the overall state network. The CDOT proposal calls for providing a larger vehicle, a 30-seat coach with lift and at least two wheelchair positions, to allow for a larger load. In addition, the CDOT vision would provide funding to expand the frequency to five days per week, which SCCOG estimates would increase ridership from 1,500 trips per year to between 2,500 and 3,000 trips per year. CDOT’s estimate of potential demand is approximately 3,900 trips per year for the expanded service. The CDOT proposal would utilize the transit center in Pueblo (which is also served by Greyhound) as a stop. A route with a similar coach on a similar schedule would eventually be funded to operate from Lamar to Pueblo, meeting the Trinidad bus at the Pueblo transit center. One of the buses would do local drop-offs (and afternoon pick-ups) in Pueblo, while the other bus would continue to Colorado Springs to a timed connection with a

Case Study: Colorado
60
Bustang schedule to Denver. The expanded SCCOG service would continue to be operated by the same agency, but vehicle and information would be branded as part of the statewide network. Ticketing would continue to include cash fares, and options of using a credit card or smartphone payment would be available as part of the statewide system.
The CDOT proposal offers a significant expansion of service and capacity and the potential to serve a
broader public. However, it illustrates a number of the service planning issues that can arise in developing rural regional services. These include:
Local pick-up: The larger bus may offer more capacity, but there are questions about whether it
can access neighborhoods to do pick-ups at individual residences. With more riders, the time required for service may be too great, making it difficult to make the schedule and subjecting riders to very long pick-up and drop-off rides. A transfer from a separate local small bus or van might be required if the service expands, potentially making the trip more difficult for some users.
Local distribution in Pueblo: A similar issue exists at the other end of the trip. Could a larger vehicle access the medical offices? Would the distribution process for a larger group take too long (particularly if it included riders from the Lamar bus)?
Fare payment: SCCOG believes that most passengers who would be paying a fare do not have credit cards or smartphone apps that would allow them to purchase tickets over the internet, or to pay by phone on boarding. Cash at the farebox will still be needed as a payment method.
Continuation of Medicaid usage/funding: The service is intended to address travel needs that include the need for Medicaid NEMT trips to Pueblo. With limited state funding for operations, CDOT would like to provide incremental funding to expand service, rather than supplant existing Medicaid funding. A concern is that the Medicaid program may decide that this service is a type of intercity bus service, and purchase tickets in lieu of the current funding method. The Medicaid program goal is to provide trips for its members, who have no other transportation, with the least cost to the program.
SCCOG staff has expressed interest in the concept of including service in the statewide network, and
has identified these as critical issues in maintaining the existing rural regional service base. Recognizing that there is already some service in this corridor, and that there are issues to be resolved, CDOT has listed this route for consideration for inclusion in the branded Rural Regional network in FY 2017-2018 or the following year.
Lessons Learned
Both local regional and state level planning has identified rural regional needs. There is ongoing involvement in the planning process across levels, with local transit providers and planners participating in the development of state proposals for new service, and state support and involvement in local service planning.
To a much greater extent than most states, there is direct state involvement in the design and implementation of regional services, as exemplified by the CDOT operated Bustang commuter bus service, but also found in CDOT planning for a statewide network that will include rural intercity bus routes and rural regional services.
The existing SCCOG rural regional route provides a service open to the general public, but its ridership and funding base is human service agency/medical trips that are funded by agencies.
Including human service agency services requires consideration of service planning issues, schedule, capacity, accessibility, pick-up, drop-off, and the requirements of the agency funding

Case Study: Colorado
61
programs if this source of support is to continue. It is a goal of CDOT to meet both kinds of needs if possible, with the two types of service combined to create a stronger base.
Colorado Case Study References
Colorado Department of Transportation, Division of Transit & Rail, Transit and Rail Program https://www.codot.gov/programs/transitandrail Colorado Department of Transportation, Colorado Statewide Intercity and Regional Bus Network Study, 2008. Colorado Department of Transportation, Division of Transit and Rail, Intercity and Regional Bus Network Plan, April 2014. Colorado Department of Transportation, Division of Transit and Rail, Statewide Transit Plan, March 2015. South Central Council of Governments, Enhancing Transit Services in South-Central Colorado, Final Report, LSC Transportation Consultants, Inc., April 8, 2014. Vander Broek, Nate, Transit Director, South Central Council of Governments, January 8, 2016.

Case Study: Colorado
62
This page intentionally left blank.

Case Study: Iowa
63
C A S E S T U D Y : I O W A
Region XII Council of Governments Western Iowa Transit – Denison to Harlan Commuter Service
Introduction
This rural transportation service, operated by Region XII’s Western Iowa Transit, was included as an example of the creative use of multiple funding sources to address a need for a regional service. Half of the funding comes from a Community Development Block Grant administered by the Iowa Economic Development Administration, 37.5 percent of the funding is from a private employer, Monogram Foods in Harlan, Iowa, which is in Region III and riders’ fares make up the remaining 12.5 percent of the program cost.
Monogram Food Solutions LLC, founded in 2004, purchased the Harlan plant in 2013. They produce
and distribute packaged meat products, snacks, and appetizers. Based in Memphis, TN, they have facilities in Bristol, Indiana; Harlan, Iowa; Chandler, Minnesota; Schulenburg, Texas; Martinsville, Virginia; and Plover, Wisconsin.
Organizational Structure
The Region XII Council of Governments (COG) was organized in 1973 to assist local governments in Audubon, Carroll, Crawford, Greene, Guthrie, and Sac Counties in western Iowa. Originally chartered to serve grant-writing and planning needs for the area, the COG has grown into the agency that facilitates multi-community collaboration and development of all types, providing initiatives in the region that are needed and otherwise not provided. Region XII COG has three departments - Local Assistance, Workforce Development, and Western Iowa Transit.
Today, Region XII COG is the transportation planning authority for the region. Region XII’s public transit service, Western Iowa Transit, provides on-demand transportation services in Audubon, Carroll, Crawford, Greene, Guthrie, and Sac Counties. Figure 12 shows the location of Region XII in Iowa.
Source: Region XII Council of Governments Website, http://www.region12cog.org/ Figure 11. Region XII Council of Governments building in Carroll, Iowa

Case Study: Iowa
64
Source: Region XII Council of Governments Website, http://www.region12cog.org/our_region/our_region.asp Figure 12. Region XII Iowa
State Context and Policy Development
Iowa has a long history of regionalizing its transit services, beginning in 1976. Today, Iowa has 99 counties divided into 16 regions. Within each region, a designated transit system or agency is responsible for administering and/or providing transit service. Service within each rural region is demand response transportation. County governments decide on the level of service within their county. Despite the regional organization of transit, there are few examples of rural regional transit routes crossing county lines or linking different regions. Iowa DOT also uses Section 5311(f) intercity bus funding to support rural intercity routes that provide connectivity to the major cities and the national intercity bus network. However, there is no particular defined source of funding for regional routes - if a local need is identified then the county or region is free to address it within the available programs and funding.
The ability to implement the regional route described in this case study arose in part because of a change in policy by a different state agency. The Iowa Economic Development Authority (IEDA) updated their federal Community Development Block Grant (CDBG) program to allow funds for transportation to employment. Through the Career Link program, transportation services that remove barriers to employment are eligible. Individuals living in non-entitlement communities can receive transportation services to job activities and/or adult educational training opportunities. The Career Link program is under the CDBG Job Creation, Retention & Enhancement Fund.
Example of Regional and Intercity Services
A recent example of the development of a rural regional service in Iowa is the planning and funding for Denison to Harlan commuter service in Region XII. Tysons Foods closed their meat packing plant in Denison, leaving approximately 400 people looking for new employment. During discussions on how to meet the needs of those workers, the Region XII Council of Governments realized that 27 miles south in

Case Study: Iowa
65
Region III, Monogram Foods was looking for new employees. Crawford County, where Denison is located, has an unemployment rate of 5.4 percent of the civilian non-institutionalized population age 16 and older. Harlan, in Shelby County where Monogram Foods is located, has an unemployment rate of 2.8 percent and a smaller labor force.
Western Iowa Transit had already been running a van
pool commuter service, through their JobJet program in Denison, to the Tyson plant for several years. At the time of the plant closing, they had two full vans serving the plant. Based on this JobJet commuter service they
proposed a regional transit service to link approximately 80 employees with a new job site at Monogram Foods in Harlan.
The new shuttle service to the Monogram plant in Harlan has three departure times, serving the three
shifts, 5:00 a.m., 6:00 a.m., and 2:30 p.m. The return trips depart at 3:45 p.m., and 12:45 a.m. They have 80 employees who use the service; trips cost $1.00 per day per employee. Service departs from the Walmart parking lot in Denison and arrives at the Monogram Plant about 40 minutes later. The shuttle service is posted on Region XII Council of Government’s website and is open to the public. The shuttle is relatively new, it started running in March 2016.
Source: Monogram Website, http://www.monogramfoods.com/locations/ Figure 14. Monogram Food’s Harlan location
Ridership and User Characteristics
Region XII’s six counties cover 3,462 square miles in west central Iowa. The combined total population is approximately 74,084 and it has a combined population density of 21.4 people per square mile. When comparing the two counties, Crawford County (where the route originates, picking up employees in the town of Denison) and Shelby County (where Monogram Foods plant is located), Shelby’s population density is slightly lower, at 20.37 compared to 24.17 in Crawford County. Table 7 provides land area and population for Crawford and Shelby Counties.
Source: http://www.amvcms.com/our-community/central-region-iowa-kansas.aspx
Figure 13: City of Harlan welcome sign

Case Study: Iowa
66
Table 7. Land area and population for Crawford and Shelby Counties
Report Area Total Population Total Land Area(Square Miles)
Population Density (Per Square Mile)
Crawford County, IA 17,259 714.19 24.17
Shelby County, IA 12,034 590.78 20.37
Iowa 3,078,116 55,856.86 55.11
United States 314,107,083 3,531,932.26 88.93
Source: US Census Bureau, American Community Survey. 2010-14. Source geography: Tract Table 8 provides a demographic comparison of the two counties. Crawford County is slightly larger,
with a slightly larger labor force and higher unemployment rate.
Table 8. Crawford and Shelby County demographic comparison
County Population
Land Area
(Square Miles)
Population Density
(Per Square
Mile)
Percent Population Non-White
Percent Population Age 65 or
More
Percent Population
with a Disability
Median Family Income
Labor Force
Number Unem-ployed
Unem-ployment
Rate
Crawford County
17,259 714.19 24.17 8.45% 16.93% 12.19% $56,820 8,989 489 5.4%
Shelby County
12,034 590.78 20.37 3.43% 21.90% 15.08% $63,522 7,068 200 2.8%
Sources: US Census, American Community Survey, 2012 - 2014; US Department of Labor Statistics, 2016
Funding
A unique combination of funding supports the service. The state’s Economic Development Authority is funding 50 percent through the Career Link program, Monogram Foods is funding 37.5 percent and rider fares are expected to support the remaining 12.5 percent of the operating expenses. (11) The Career Link program, part of Iowa’s Community Development Block Grant program’s Job Creation, Retention and Enhancement Fund, is an industry driven program investing in training and transportation to help low and moderate income individuals obtain employment.
The Career Link program provides grants to non-entitlement cities (population under 50,000) or
counties. The funds flow through local government to a non-profit transportation entity providing transportation services predominantly to low- to moderate-income individuals that reside in non-entitlement communities. Eligible activities include operation of transportation services to job activities and adult educational training/instructional opportunities. The maximum grant award for employment related transportation projects is $150,000, with a fifty-percent cash match required. Matching funds can be a combination of funds from participating businesses, local, state, and federal funds.
Thanks to the support from the Economic Development Authority and Monogram Foods, 90 people are
able to access employment and a new regional route between Denison and Harlan is available to the general public.

Case Study: Iowa
67
The Community Development Block Grant program is an entitlement program under the U.S. Department of Housing and Urban Development (HUD). HUD’s website states that “the program works to ensure decent affordable housing, to provide services to the most vulnerable in our communities, and to create jobs through the expansion and retention of businesses.”
According to the U.S. Office of Community Planning and Development’s National Expenditure Report
for all CDBG Disbursements, in FY 2015, 0.12 percent or $3,796,980 of the national CDBG funds were spent on transportation services.
Lessons Learned
This example of rural regional services demonstrates a process for identifying a particular rural regional need, identifying stakeholders, developing a service plan, and obtaining funding from non-traditional sources – which may be required to implement rural regional services.
As stated by Chris Whitaker, Local Assistance Director of the Region XII Council of Governments, “It is important to be open minded, listen to the employer and the employees needs and try and adapt your services to meet some of their needs.”
Iowa Case Study References
Castro, Secretary Julian. Community Development Block Grant Program ‐ CDBG. US Department of
Housing and Urban Development. HUD.GOV. June 28, 2016.
https://www.hudexchange.info/programs/cdbg/cdbg‐expenditure‐reports/
Crawford County News. Crawford County Awarded $110,000 Transportation Grant to Support Daily Commuters. cbc online. March 25, 2016. June 14, 2016. http://www.1380kcim.com/news/2016/crawford-co-awarded-110000-transportation-grant-to-support-daily-commuters/. Fravel, Fred, KFH Group, Inc. February 24, 2016. Hanson, Nicole. Phone Interview with Nicole Hanson about Deneson to Harlen Commuter Service. Iowa Economic Development Authority. Job Creation, Retention & Enhancement Fund. Career Link. 2016. June 28, 2016. http://www.iowaeconomicdevelopment.com/CDBG/CDBGJob. Monogram Food Solutions LLC. June 28, 2016. http://www.monogramfoods.com/features/. Office of Community Planning and Development. CDBG National Expenditure Reports (PY02 - PY14). HUD Exchange. June 28, 2016. https://www.hudexchange.info/manage-a-program/cdbg-expenditure-reports/. Region XII Council of Governments. Agency Information. Region XII Council of Governments. 2008-2014 June 14, 2016. http://www.region12cog.org/. Region XII Council of Governments. Transportation Planning. June 14, 2016. http://www.region12cog.org/local_assistance/transportation.asp Region XII Council of Governments. Public Transit. Cited: June 14, 2016. http://www.region12cog.org/western_iowa_public_transit/public_transit.asp.

Case Study: Iowa
68
US Department of Labor. Bureau of Labor Statistics. April 2016. US Census Bureau. American Community Survey. 2010 - 2014. Whitaker, Chris. Local Assistance Director. Region XII Council of Governments. June 27, 2016.

Case Study: Kansas
69
C A S E S T U D Y : K A N S A S
Statewide Regional Transit Model – Flint Hills Implementation and Transportation Works for Kansas
Source: Flint Hills ATA Bus Facebook Page, https://www.facebook.com/FlintHillsATAbus/ Figure 15. Picture of a Flint Hills ATA Bus
Introduction
The Transportation Works for Kansas (T-WORKS) transportation program is state legislation that supports and encourages a regional approach to transportation across sectors. As part of T-WORKS, the Kansas Department of Transportation (KDOT) public transportation program unit assembled a study team consisting of KDOT representatives and the consulting teams of Olsson Associates, SRF, and URS to develop the KDOT Regional Transit Business Model Implementation Plan. This plan redefined the regional boundaries based on current travel patterns, creating ten Coordinated Transit Districts (CTDs). Nine of the ten CTDs have primarily rural-focused districts, which are the focus of the Implementation Plan. The tenth district is urban comprised of Douglas, Johnson, Shawnee, and Wyandotte counties. Figure 17 from the KDOT Regional Transit Business Model Implementation Plan exhibits the new CTD boundaries.
Previously, Kansas was broken up into fifteen CTDs. Within each CTD, stakeholder teams composed
of transit providers, city and county officials, medical providers, and social agencies were created. KDOT staff facilitates regular meetings of the teams and offers incentives to the teams for implementing the rural regional strategies outlined in the Regional Transit Business Model Implementation plan.
Source: Transportation Works for Kansas
Website, http://tworks.ksdot.org/ Figure 16. Transportation Works for Kansas Logo

Case Study: Kansas
70
Source: KDOT Regional Transit Business Model Implementation Plan Figure 17. New CTD boundaries
State Context and Policy Development
In 1992 the Kansas Coordinated Transit District law formalized the regional transportation coordination effort. The T-WORKS transportation program, signed into law by the Kansas state legislature in May 2010, provided a financial investment to advance coordination beyond current localized efforts. The Transportation Works for Kansas (T-WORKS) transportation program is a ten-year, eight billion dollar transportation program designed to create jobs, preserve highway infrastructure, and provide multimodal economic development opportunities across the state.
In 2014, the KDOT Office of Public Transportation published the KDOT Regional
Transit Business Model Implementation Plan with strategies for the provision of transit services throughout rural Kansas that make the most efficient use of the additional transit funding made available by the state legislature as part of the T-WORKS transportation program. (1)
Lead by KDOT’s Office of Public Transportation staff, each CTD stakeholder team
and a state study team met four times over the course of the two-year Regional Transit Business Model Implementation project to develop implementation strategies supporting the regional transit approach. The KDOT Office of Public Transportation recognized that regional coordination initiatives take time and partnerships. They worked to develop partnerships with all the key stakeholders in each CTD and allow enough time for trust to build among the partners. The additional resources and flexibility between CTDs helped as well.
Source: https://www.facebook.com/FlintHillsATAbus/photos/ Figure 18. Logo for a Flint Hills ATA bus stop

Case Study: Kansas
71
State Regional and Intercity Support
The KDOT Regional Transit Business Model Implementation Plan offers multiple implementation strategies for the CTDs. While specific strategies and elements are tailored to individual CTDs, there are some consistent strategies offered across the state. The Regional Transit Business Model Implementation Plan strategies include offering the CTDs coordinated dispatch software, new intercity routes and mobility management staff. The KDOT team offers technical and financial support to the CTDs and suggests using the following strategies to implement rural regional transit.
Regional routes. Allow multiple providers to coordinate, combine, and share trips, while
preventing duplication Coordinated scheduling. Utilizes Global Position System (GPS), vehicle-based tablets, and
scheduling software to provide providers with knowledge and details of other trips in their area Mobility management. Gives transit providers a regional resource to provide driver or rider
training and that facilitates administrative transit connections between transit providers, employers, medical centers, and social agencies
Regional governance structure. Provides a framework to make service and funding decisions related to regional transit, including oversight, financial participation, legal context, and regional branding
Branding elements. Convey the connection between the provider, the CTD, and KDOT public transportation program to the public
During the two-year development of the Regional Transit Business Model Implementation Plan, the KDOT public transportation program unit and representatives from consulting teams formed stakeholder committees for each CTD and conducted information gathering meetings in each region, they collected data and established project visions and goals. Each region developed an action plan that narrowed the broader strategies to the most promising and appropriate, relative to the characteristics of their area and the resources available.
As part of the KDOT Regional Transit Business Model Implementation Plan the KDOT Office of
Public Transit procured coordinated dispatch software for six lead agencies in six of the ten CTDs. This software can be utilized by all transit providers in a CTD to enhance coordination and scheduling. Working with Reveal Management Services, Inc., KDOT installed a statewide technology infrastructure to enable transit agencies to share knowledge, information and resources. Reveal was implemented as the centralized paratransit scheduling and dispatching system. The latest software implementation enabled automated vehicle tracking and mobile date functionality across the state to provide better customer service and maximize cost efficiencies.
Funding
Public transportation in Kansas is supported by the Federal Transit Administration (FTA), state and local funding programs. These federal and state funding programs, which are augmented by local match, provide funding for the 83 general public transit service providers and 59 transit providers that service older adults and people with disabilities throughout Kansas. Figure 19, from the Appendix of the Kansas Department of Transportation’s 2016 Annual Report, illustrates the state and federal CTD operation costs for FY 2015.

Case Study: Kansas
72
Source: Appendix to the Kansas Department of Transportation’s 2016 Annual Report Figure 19. CTD operating revenue FY2015
The T-WORKS program ensures that every county in Kansas receives $8 million dollars in transportation investment, made up of highway preservation, highway expansion and modernization, aviation, transit and rail projects. Transit services are allocated $100 million of the $8 billion over the ten years of the program. As a result, transit funding in Kansas increased from $6 million to $11 million annually starting in 2013.
Transit funding formulas are recalculated annually. Figure 20, taken from a T-WORKS 2010 fact sheet
on Kansas transit programs, illustrates the new transit funding allocations. This includes approximately $1.3 million for supporting regional transit approaches.

Case Study: Kansas
73
Source: T-WORKS Transit Program fact sheet, KDOT website: http://kdotapp.ksdot.org/TWorks/docs/doing-biz_transit.pdf Figure 20. T-Works transit funding allocations from 2010
The KDOT public transportation program unit utilized the increased state dollars from the T-WORKS Transit Program to offer funding to the CTDs for hardware and personnel for coordinated scheduling, personnel and administration for a mobility manager, and operations and capital for intercity services. Figure 21, from the KDOT Regional Transit Business Model Implementation Plan, illustrates the preliminary allocation of the KDOT funding available to support the strategies to implement rural regional transit.
Source: KDOT Regional Transit Business Model Implementation Figure 21. KDOT match allocation for regional strategies

Case Study: Kansas
74
Example of Regional and Intercity Services
The Flint Hills Area Transportation Agency, Inc. is a private non-profit corporation founded in 1976 by a group of county residents concerned about a lack of public transportation. As a stakeholder in the Flint Hills CTD, it is one of the early adopters of the KDOT Regional Transit Business Model Implementation Plan. In 2014 the Manhattan urbanized area became eligible to receive Section 5307 funds. As a result, the Flint Hills Regional Transit Administration was established to serve as the designated recipient of Section 5307 funds.
Through the Regional Transit Business Model Implementation project, the Flint Hills CTD engaged the
Kansas University Transportation Research Center to complete a 2015 feasibility study to examine the achievability of fixed route transit service in Junction City and across the river and jurisdictional boundaries to Grandview Plaza, Kansas. The study area consisted of approximately 14 square miles, including the city limits for Junction City and Grandview Plaza, as well as the connecting intercity transit service which links Junction City to Manhattan. The Flint Hills Area Transportation Agency (ATA) had been operating the existing demand-response transit service separately in Junction City and Grandview Plaza from 2010 to 2015 with a steady increase in ridership.
The Junction City/Grandview Plaza Fixed Route Feasibility Study was supported by multiple Flint
Hills CTD stakeholders including, the Flint Hills Area Transportation Agency, Geary County Commission, KDOT staff, and a 20 member advisory committee. Based on the study, and resources from
T-WORKS a fixed route service crossing the Smokey Hill River and jurisdictional boundaries was established in key areas of Junction City and Grand View Plaza. This route was integrated into the larger tri-county regional transit system going 25 miles north to Manhattan, KS and increased connectivity across the region.
The tri-county services also started as part of
the Regional Transit Business Model Implementation project. In 2011 Flint Hills ATA began a pilot program in partnership with KDOT to add additional regional services, these buses ran outside of the normal City of Manhattan-Riley County demand response services. The services were expanded into portions of western Pottawatomie County, Geary County (Junction City), and Fort Riley. The pilot program ran between February 2011 thru April 2012, at which time the pilot ended and ATA partnered with Geary County, Pottawatomie County and Riley County to continue the regional services as part of their regular 5311 services. Regional routes now include “The Intercity Shuttle” which operates weekdays between Manhattan-Fort Riley and Junction City, and the Wamego-Manhattan service. These are operated as demand response (reservation required) in these
Source: https://www.facebook.com/FlintHillsATAbus/photos Figure 22. Flint Hills ATA Bus, 2015 Transit Day at the Kansas Capitol

Case Study: Kansas
75
corridors, with fixed stops in Fort Riley. Demand response ridership in 2011 (March-December) was 3,818. Ridership increased to 6,115 in 2012 and to 8,124 in 2013, a 33 percent increase from 2012 to 2013. Ridership for 2014 through April was 3,434, a 22 percent increase in ridership over the same time the year before.
KDOT purchased a vehicle for the new Manhattan to Wamego route, representing the first regional
route and first vehicle purchased with the T-WORKS regional transit dollars. Mobility Managers have also been hired through the T-WORKS program, in the Flint Hills Region through a partnership with the Flint Hills Regional Council and KDOT. Mobility manager personnel and administrative expenses are reimbursed at 100 percent for the first year and 80 percent after that, with the T-WORKS regional transit dollars.
Outcomes and Future Outlook
KDOT’s regional transit business model initiative resulted in multiple projects that are underway in regions across the state, with more to come. Regional routes are now operating in multiple CTDs making the following connections:
Emporia to Topeka Emporia to Andover, El Dorado, and Wichita Manhattan to Wamego
The KDOT Office of Public Transit procured coordinated dispatch software for the lead agencies in
each CTD. This software can be utilized by all providers in a region to enhance coordination and scheduling.
KDOT reports in their KDOT Regional Transit Business Model Implementation Plan that by
encouraging regional coordination and supporting mobility management, transit services will be provided using less resources, thus allowing Kansas transit providers to deliver more rides to people in need. They also report that increasing the amount of available transportation in rural areas will help increase the economic prosperity and health of the region. People in rural areas will be able to access more employment, healthcare, and educational opportunities resulting in increased economies in rural areas and enriched lives for rural residents.
In the South West CTD, as a part of the T-WORKS regional effort, Dodge City was identified as a
community with a need for fixed route transit. In May 2015, in addition to hiring a mobility manager, they began operation of three fixed route bus services.
Since the passage of the Transportation Works for Kansas in 2010, transit ridership in the rural areas
increased 21 percent. In 2014, transit ridership increased seven percent, providing more than 12 million rides.
The CTDs will continue to be supported by the KDOT Office of Public Transit until 2020. In FY 2015,
KDOT allocated $11 million for public transit across the state. By 2020, the tools and infrastructure will be in place to continue the regional services developed and implemented by this plan.
According to KDOT, the major factors inhibiting development of additional regional services are the
need for local funding participation. Because of the state incentives that include funding for the local share of vehicles for regional services and regional mobility management, the local funding needs may

Case Study: Kansas
76
actually be quite low when shared among several jurisdictions. The challenge has been making more regions in the state aware of these possibilities.
Lessons Learned
The Kansas Regional Transit Business Model Implementation project is an example of a top down regional transit implementation model. The Transportation Works for Kansas (T-WORKS) legislation demonstrates how state policy can foster regional transit. This model demonstrates strategies like support of leadership, additional resources, multiple players to aid coordination and significant funding. By having state leadership and resources, there are fewer regulatory barriers and more partnerships to support local implementation.
State-procured coordinated dispatch software can be utilized by all providers in a region to enhance coordination and scheduling.
By encouraging regional coordination and supporting mobility management, transit services can be provided using fewer resources, thus allowing transit providers to deliver more rides to people in need. This will enable rural residents to access more employment, healthcare, and educational opportunities resulting in increased economies in rural areas and enriched lives for rural residents, helping to help increase the economic prosperity and health of the region.
Kansas Case Study References
Davis, Cory. Comprehensive Transportation Planning Manager. Kansas: Kansas Department of Transportation, Bureau of Transportation Planning. March 30, 2017. Dodge City. Dodge City/Public Transportation. D-TRAN Fixed Route. June 10, 2016. http://www.dodgecity.org/index.aspx?nid=727. Dodge City Fixed Route Bus Schedule. April 27, 2015. Flint Hills Transportation Agency, Inc. Annual Report for the Year Ending June 30, 2014. Manhattan, KS, 2014. Junction City/Grandview Plaza Fixed Route Feasibility Study, Final Report, November 2015 Kansas Department of Transportation. Appendix to the Kansas Department of Transportation's 2016 Annual Report. 2016. Kansas Department of Transportation. KDOT Regional Transit Business Model Implementation Plan. 2014. KDOT Regional Transit Business Model Implementation, Guidelines for Transitioning to the New CTD Boundaries, KDOT Office of Public Transportation, 2015 Kansas Department of Transportation. KDOT Regional Transit Business Model Implementation Powerpoint presentation. June 3, 2016. http://reap-ks.org/publication/05-02-14-kdot-regional-transit-business-model-implementation-presentation-powers/wppa_open/. —. Moving Kansas Forward Annual Report 2016. 2016. Kansas University Transportation Research Center. Junction City/Grandview Plaza Fixed Route Feasibility Study. Kansas University Transportation Research Center, 2015.

Case Study: Kansas
77
Marshall, Vincent. Fixed Bus Route System Coming to Dodge City. Dodge City Daily Globe. [Online] April 2, 2015. [Cited: June 10, 2016.] http://www.dodgeglobe.com/article/20150402/NEWS/150409935 Riley County Kansas. ATA Bus. Riley County/Home/Government/Affiliated Agencies/ATA Bus. [Online] June 9, 2016.] http://www.rileycountyks.gov/795/ATA-Bus. Smith, Anne, January 6, 2016. T-WORKS Legislation, KDOT, 2013 T-WORKS Transit Program. Transportation Works for Kansas: KDOT, 2010. Fact Sheet. T-WORKS Transit Program, Doing Business with KDOT, Fact Sheet, 2010

Case Study: Kansas
78
This page intentionally left blank.

Case Study: Maine
79
C A S E S T U D Y : M A I N E
Portland Intercity Service - ShuttleBus-Zoom
Introduction
Introduction
In 2015, ShuttleBus-Zoom partnered with Greyhound to leverage Section 5311(f) funding to run an intercity route along Routes 1 and 9 from Portland to Biddeford. This intercity route offers new transportation options to Biddeford, Saco, Old Orchard Beach and Scarborough. ShuttleBus-Zoom used Greyhound miles to match Section 5311(f) funding. This new route crosses jurisdictional boundaries and makes intercity connections, and expands services to previously underserved areas, thus meeting local transportation needs as well.
ShuttleBus-Zoom provides public transportation to the Cities of Biddeford and Saco and the Town of
Old Orchard Beach. It is overseen by the Biddeford-Saco-Old Orchard Beach Transit Committee, a governmental entity consisting of three members from each of three municipalities, and one elected official from each. It originated in 1978 through an inter-local agreement by the Cities of Biddeford and Saco and the Town of Old Orchard Beach to provide public transportation under the name ShuttleBus-Zoom.
ShuttleBus-Zoom’s Portland Intercity Service leverages a unique partnership with Greyhound Lines,
Inc. (Greyhound), one of the largest private motor-coach operators in the United States. Greyhound offers intercity, charter, and package express services across the United States and into Canada. With two bus stations/stops in Portland Maine, riders can travel to hundreds of destinations in the United States and Canada. Greyhound partners with several public transit systems, providing in-kind or matching miles for the FTA Section 5311(f) funding program to help increase intercity transit across the country and bring more passengers to their services.
State Context and Policy Development
State law, Title 23 M.R.S.A. Section 4209, requires the Maine Department of Transportation (MaineDOT) to divide the state into geographic regions to coordinate and provide public transit. There
Source: www.facebook.com/ridethebluebus/photos Figure 23. ShuttleBus-Zoom buses

Case Study: Maine
80
are eight designated transit regions and nine regional transit providers in the state. ShuttleBus-Zoom is Transit Region 8’s designated transit agency.
Example of Regional and Intercity Services
In 1978, the Cities of Biddeford and Saco and the Town of Old Orchard Beach formed an inter-local agreement forming a quasi-municipal government entity to provide public transportation under the name ShuttleBus-Zoom. This agreement allows ShuttleBus-Zoom to execute contracts and obtain and dispense funds for the purpose of providing public transportation.
In 2014, Al Schutz, Executive Director of ShuttleBus-Zoom, learned about the 5311(f) intercity bus
program from MaineDOT and Mr. Schutz thought that this could help his declining local route from Biddeford to Portland. He contacted Greyhound and revised the route to connect with Greyhound services in Portland and destinations like the newly opened Baxter Academy for Technology and Science. The Baxter Academy for Technology and Science, one of the few charter schools in Maine, needed transportation for their students coming from more than 20 towns and Al Schutz was able to enter into an agreement to meet those needs. With a letter from Greyhound pledging miles as a match, Mr. Schutz was awarded 5311(f) intercity funding for the Portland intercity route and started operations in June 2015.
The revised route and new partnership with Greyhound increased ridership by seven percent in the last
year. Mr. Schutz is now considering partnering with Greyhound to carry cargo from Portland to Biddeford.
ShuttleBus-ZOOM Family of Services ShuttleBus-Zoom operates five types of transit services throughout Biddeford, Saco, and Old Orchard
Beach with some services making connections to the Greater Portland area. Both the Intercity/Portland bus and the Zoom Turnpike Express have a transfer system that links to METRO and the South Portland Bus System. The ShuttleBus-Zoom route descriptions below are taken from the FY2013 – FY2017 MaineDOT Locally Coordinated Transit Plan for ShuttleBus.
Tri-Town Local Route. The Tri-Town local route operates with two buses seven days a week serving
the Cities of Biddeford and Saco, and the Town of Old Orchard Beach. The first bus serves three communities via Elm Street, while the second bus provides service via Alfred Street. The buses operate along the same route but in reverse order.
Source: www.facebook.com/ridethebluebus/photos Figure 24. ShuttleBus-Zoom logo
Source: http://abduzeedo.com/logo-design-greyhoundsFigure 25. Greyhound logo

Case Study: Maine
81
Trolley Service. In summer months, ShuttleBus runs a popular trolley service between Old Orchard Beach and Pine Point in Scarborough. On weekdays, the trolley runs from 10:00 a.m. to 10:00 p.m. Weekend trolley service runs from 10:00 a.m. to midnight.
Portland Intercity Service. The Tri-Town to Portland intercity service, or “Portland” bus, runs daily
from Biddeford to Portland with stops in Saco, Old Orchard Beach, Pine Point, Scarborough, and South Portland (primarily the Maine Mall). From June 15 to September 15, the service operates two extra runs on Sunday. The bus runs Monday through Friday from 6:25 a.m. to 10:20 p.m., Saturday from 8:30 a.m. to 7:05 p.m., and Sunday from 10:45 a.m. to 5:05 p.m.
UNE Nor’easter Express. Since September 2007,
ShuttleBus has operated the Nor’easter Express route between University of New England’s Hills Beach campus and downtown Biddeford/Saco. One bus serves the route seven days per week during the academic year. The bus runs Monday through Thursday from 7:30 a.m. to 9:45 p.m., Friday from 7:30 a.m. to 11:05 p.m., Saturday from 12:00 p.m. to 11:05 p.m., and Sunday from 11:40 a.m. to 7:30 p.m.
ZOOM Turnpike Express. The ZOOM Turnpike Express
travels from park and ride lots in Biddeford and Saco, via the Maine Turnpike, to Congress Street and the University of Southern Maine, and back during morning and afternoon rush hours. The bus runs weekdays during heavy commuter times from 6:00 a.m. to 6:40 p.m.
Regional and Intercity Service – Portland Intercity Service ShuttleBus-Zoom’s Portland Intercity Service offers multiple daily trips departing from Greyhound’s
Portland terminal and ending at ShuttleBus-Zoom’s Biddeford location. Monday through Friday, the bus runs from 6:25 a.m. to 10:20 p.m. Saturday from 8:30 a.m. to 7:05 p.m., and Sunday from 10:45 a.m. to 5:05 p.m. From June 15 to September 15 the service has two extra runs on Sunday. The bus stops at the following locations:
Portland: 950 Congress Street Portland City Hall: 389 Congress Street Scarborough: 200 US RT1 Old Orchard Beach: 11 1st Street Saco: 130 Maine Street Biddeford: 13 Pomerleau Street
The Purple Line on the map in Figure 27 depicts the ZOOM Turnpike Express Route and the Green
Line. Running south of the ZOOM Turnpike Express is ShuttleBus-Zoom’s Portland intercity route. The ShuttleBus-Zoom’s Portland intercity route costs are determined by zones. One-way single zone travel is $1.50, travel through two zones is $3, and travel through three zones is $5. Ten ride passes through two zones cost $23, and $39 for three zone travel.
Source: www.facebook.com/shuttlebuszoom/photos Figure 26. Boarding a ShuttleBus

Case Study: Maine
82
Source: http://ShuttleBuszoom.com/rates/intercity-portland/: Inter-city bus map Figure 27. ZOOM Turnpike Express (Purple Line) and ShuttleBus-Zoom’s Portland Intercity (Green Line) routes
Ridership and User Characteristics
The Cities of Biddeford and Saco and the Town of Old Orchard Beach are located on the coast of southern Maine in York County. As seen in Figure 28 they have a combined population of 48,736 over 75.98 square miles making the population density 641.45 per square mile. Portland, the largest city in Maine, is twenty miles north of Biddeford with a population density of 3,078 people per square mile. Located on a peninsula with the historic port district, Portland is a tourist attraction as well as home to several large employers, colleges, universities, multiple hospitals, and medical centers. The Maine Medical Center, located in Portland, is the largest hospital in Northern New England with 28,000 inpatient visits and about 500,000 outpatient visits annually.
ShuttleBus-Zoom’s Executive Director Al Schutz estimates that approximately forty percent of trips on
the Portland intercity service are for local errands and/or transferring to Portland local metro service, thrity percent are for employment and the remaining thirty percent are uncategorized.
Funding
ShuttleBus-Zoom’s $2.9 million annual operation is supported by state and federal funds, advertising and contract services, fares, and funding from four municipalities. This holds true for all five transit services. Biddeford, Old Orchard Beach and Saco each pay $125,000 for bus service and Scarborough pays $25,000. Mr. Schutz estimates that about half of ShuttleBus-Zoom’s Portland Intercity Service funding comes from the 5311(f) operating grant which requires a fifty percent match. ShuttleBus-Zoom’s partnership with Greyhound provides the fifty percent match using Greyhound’s intercity miles.
Fifteen percent of each state’s Section 5311 (f) allocation is set-aside for rural intercity bus service
(5311(f)). To be considered intercity, service must not be primarily used as a commuter service, be a fixed route, and be capable of carrying luggage, and make a meaningful connection with a national intercity transportation provider. Operating funds under this program require a fifty percent match. Transportation providers can use “in-kind” or “miles” as the match. Initially implemented in 2007, “in-kind match” defines intercity bus routes to include both a subsidized segment (5311(f)) and a connecting unsubsidized

Case Study: Maine
83
segment. The value of the unsubsidized segment can be used as in-kind match for the match on the 5311(f) operating funds for the subsidized segment.
Source: Community Commons Website, www.communitycommons.org Figure 28. Population density for the Cities of Biddeford and Saco and the Town of Old Orchard Beach
In return for bringing passengers to Greyhound’s Portland station and selling Greyhound tickets, ShuttleBus-Zoom receives a letter from Greyhound dedicating miles from the northern (unsubsidized) part of Greyhound’s Portland route to use the fifty percent match for their Biddeford to Portland service. As part of the agreement, ShuttleBus-Zoom operates the Biddeford to Portland route five days a week making meaningful connections to Greyhounds’ services and sells interline tickets with Greyhound. An average of two ShuttleBus-Zoom’s Portland intercity passengers connect and transfer to Greyhound’s regional bus service daily.
In addition to federal and municipal support from the Cities of Biddeford and Saco and the Town of
Old Orchard Beach, ShuttleBus-Zoom partners with private agencies. Many townships and businesses that ShuttleBus-Zoom serves contribute financially to support the service. Walmart contributes $6,000 a year, Southern Maine Health Center contributes $6,500 a year and businesses like senior centers, shopping centers and health care providers partner with ShuttleBus-Zoom to ensure the people they serve

Case Study: Maine
84
have transportation to their services. ShuttleBus-Zoom recently utilized Section 5307 funding to hire a mobility manager to help foster these public private relationships.
Lessons Learned
Through leveraging public-private partnerships with community businesses and Greyhound, ShuttleBus-Zoom is able to provide bus services to smaller communities on local routes that are bypassed by Interstate 95. ShuttleBus-Zoom utilized 5311(f) intercity funding and in-kind matches to address regional travel needs.
ShuttleBus-Zoom’s Executive Director Al Schutz shared the following advice for other transit managers: “With stifling overregulation from the federal government, transit managers stop trying to innovate, but you have to be willing to take a risk and run with it. With a common sense attitude and running your service as a business you can provide the transportation services your community needs. We have to be willing to take risks and push the envelope while complementing that with a common sense business attitude in operating services. Go out and take risks and make gains.”
Maine Case Study References
Fravel, Fred. 15th Biennial FTA State Programs Meeting. 2013 State Public Transit Partnerships Conference. : KFH Group, Inc., August 8, 2013. Gallagher, Noel K. “First year may chart the course for Baxter Academy.” Portland Press Herald. June 30, 2014. Greyhound. Greyhound Partners with ShuttleBus-Zoom to Expand Service in Maine. June 4, 2015. June 23, 2016. https://www.greyhound.com/en/media/2015/06-04-2015. Greyhound. All Routes from Portland, ME. June 27, 2016. http://locations.greyhound.com/bus-routes/all-destinations/portland/me. MaineDOT. MaineDOT Locally Coordinated Transit Plan Region 8: ShuttleBus. FY 2013 - 2017. Coordinated Plan. MaineDOT. Maine Strategic Transit Plan 2025. 2015. Final Report April 19, 2015. Mainly Media, February 26, 2015. June 23, 2016. http://courier.mainelymediallc.com/news/2015-02-26/News/New_funds_pumped_into_local_transit_system.html Meiklejohn, Ben. New Funds Pumped into Local Transit System. Biddeford-Saco-OOB Courier. [Online] Schutz, Al. Executive Director, ShuttleBus-Zoom. June 24, 2016. ShuttleBus-Zoom. Inter-city/Portland Bus Routes & Rates. ShuttleBus-Zoom. June 23, 2016. http://ShuttleBuszoom.com/rates/intercity-portland/. US Census Bureau, American Community Survey. Geography Tracts: US Census Bureau, 2010 - 2014. US News and World Report. Maine Medical Center. Health Care. June 24, 2016. http://health.usnews.com/best-hospitals/area/me/maine-medical-center-6110430.

Case Study: Michigan
85
C A S E S T U D Y : M I C H I G A N Alger County Transit
Introduction
The Michigan Upper Peninsula (UP), a large rural area of 16,452 square miles (see Figure 30), is home to about 308,000 people. The UP’s fifteen counties are divided into three planning and service delivery regions:
Eastern UP (EUP): Chippewa, Luce, and Mackinac Counties. Central UP (CUP): Alger, Delta, Dickinson, Menominee, Marquette, and Schoolcraft Counties. Western UP (WUP): Baraga, Gogebic, Houghton, Iron, Keweenaw, and Ontonagon Counties.
The sparse population and long distances between population centers create significant barriers to
effective regional transit. In addition, many counties in the UP border Wisconsin and people often need to cross the state line for work, medical care, or higher education.
There are a large number of rural county and city transit systems in Michigan; however, few have
developed regional links that cross county lines. The Michigan Department of Transportation (MDOT) approach to the development of regional services is permissive, allowing local initiatives and providing technical assistance. Alger County Transit (ALTRAN) is an example of a rural transportation provider that developed successful regional service. ALTRAN provides a regional connection from Alger County to the closest urban center, Marquette, which is 45 miles away.
http://www.exploremunising.com/services/shuttle-transportation/
Figure 29. Alger County Transit bus

Case Study: Michigan
86
Source: 2016 Coordinated Mobility Plan: Prosperity Region 1, KFH Group Figure 30. Map of Michigan's Upper Peninsula
State Context and Policy Development
The Alger County Transit Munising to Marquette route evolved from service that was started under a
Michigan Department of Transportation (MDOT) demonstration program that provided funding to establish and demonstrate regional routes. While in the past MDOT had programs aimed at creating and supporting regional services, over the past decade these have not been continued. The Altran regional route, however is not unique in the state, as there are others such as Straits Regional Ride, which links communities in Cheboygan, Emmet and Presque Isle with flexible routes linking designated bus stops. The Straits program was also started under the MDOT regional demonstration program. Another rural regional program in Michigan is operated by the Thunder Bay Transportation Authority Dial-a-Ride serving the residents of Alpena, Alcona and Montmorency Counties and the City of Alpena. The Alger County example was chosen for this case study as an example of a fixed-route, fixed-schedule rural regional route serving multiple needs.
More recently, the need for regional mobility has been recognized at the highest levels of the state.
Governor Snyder released a special message to the legislature in June 2014, on the topic of aging, titled “Making Michigan a Great Place to Live Well and Age Well.” The special message included the following language regarding access to transportation:
“Michiganders, including many older adults, need regional mobility and transit providers need to
become more regionally focused. This is both an urban and rural issue.”

Case Study: Michigan
87
Another MDOT program that potentially could address the need for some regional trips is the state’s intercity bus program, one of the oldest in the nation. However, meeting regional needs for same-day trips is difficult when the intercity routes are timed to make connections in distant hubs. For example, although there are intercity bus services in the UP, they primarily serve to connect points in the UP to places beyond the region. Indian Trails has two routes that traverse the region, one from east to west and one from north to south. The service makes daily stops in Menominee, Powers, Escanaba, Gladstone, Iron Mountain, Marquette, Manistique, Gwinn, and Ishpeming. Service does not extend into Alger County. In order to be able to connect with nationwide bus networks, the Indian Trails buses in the UP run during the very early hours of the morning, between approximately 12:00 a.m. and 8:00 a.m. Because the service runs only once daily, a person seeking to travel to Marquette for employment or medical care would have to stay until the next day in order to catch a ride back to Escanaba or Marquette, both about 45 miles from Alger County. Figure 31 is a map of the intercity bus system in Michigan.
Source: Michigan Department of Transportation Figure 31. Michigan’s intercity bus system
In the UPMI region, the fifteen counties have an agreement to provide inter-county services. Counties allow other counties’ transit services to pick up passengers in their regions and vice versa. The regional transit services available in the CUP vary greatly by county. Alger, Delta, Marquette, and Schoolcraft Counties have created public transit authorities. Only the Marquette and Alger agencies have regular

Case Study: Michigan
88
inter-county services. Dickinson and Menominee Counties’ public transportation is only available through local community action agencies. Formal transit providers, health care providers, human service agencies, and one tribal organization also provide limited regional transit services for people who qualify.
Example of Regional and Intercity Services
Organizational Structure Alger County initiated countywide public transit services in
January 1982. The Alger/Marquette Community Action Board operated transit services until March 1990 when Alger County Transit (ALTRAN), an Act 196 transit authority, was created to provide countywide transit services in Alger County.
ALTRAN provides several types of service, including local
county-wide dial-a-ride (branded as Ride to Work Service) service to 350 to 400 people daily in the 915 square mile Alger County; a weekday rural regional route from Munising in Alger County, 45 miles west to the regional center of Marquette, located in the neighboring county; local demand response service on Friday/Saturday evenings; and seasonal “Backpacker Transportation” from Munising and Grand Sable to stops in the National Lakeshore Park.
There are many partners that play a role in supporting regional transportation in Michigan’s Upper
Peninsula (MIUP). From FTA funding for regional routes and underserved populations, to local initiatives and agencies serving targeted population, many factors contribute to meeting regional transportation needs in MIUP.
Transportation planning and coordination efforts have been underway in Alger County for a number of
years. The Alger 2014 County Coordinated Transportation plan reported that ALTRAN meets regularly with stakeholders to discuss transportation needs. ALTRAN management meets monthly with twenty-six human service agencies; quarterly with the all governmental agencies which include the city, county, townships, schools, hospital, Park Service and Forest Service. ALTRAN staff provides an annual update for the Chamber of Commerce; requesting input regarding services that may be need to address needs identified by the business community and the Visitor’s Bureau.
ALTRAN staff meets regularly with agencies and employers in cases where transit service impacts
their clients and employees. The meetings inform the coordinated transportation planning process and collect input on mobility issues. For example, ALTRAN meets regularly with Kewadin Casino, the largest employer using the ride to work program, to obtain input and fill gaps in their schedules.
ALTRAN works with community partners to improve mobility options for people with disabilities,
older adults and persons with lower incomes. The Commission on Aging funds transportation and they provide regular input to ALTRAN on needs for older adults.
ALTRAN’s Munising to Marquette Connection In 1997, about ten Alger County residents asked the executive director of ALTRAN, if she could
expand service into Marquette. She worked with them to arrange a schedule and route to Marquette that would work for all of them. This was established originally as a commuter route. MDOT provided some
Source: Alger County Transit Webpage, http://www.altranbus.com/ Figure 32. Alger County Transit logo

Case Study: Michigan
89
funding over a four year period for this service. Over the years, ALTRAN was able to expand the service through partnerships with health and human service providers.
Today, the Munising to Marquette route provides regional service weekdays from 6:15 a.m. to 5:00
p.m. The 29-passenger bus makes three round trips a day with an average of 25 passengers each trip. ALTRAN reports that in the winter, the bus can fill up and reservations become oversubscribed.
The schedule is as follows: Bus leaves Munising at 6:15 a.m., 11:15 a.m., and 3:15 p.m. Bus leaves Marquette at 8:00 a.m., 1:00 p.m., and 5:00 p.m.
The commuter bus will pick up passengers with reservations along the 45 mile route. They have an
agreement with Marquette County that allows them to pick up passengers in Marquette County and collect and keep the fares from those rides. About 15 miles of the route is in Marquette County. The Marquette County transit system does not cover that area, so the ALTRAN service is not duplicative or competitive, but complementary.
The trip purposes vary from employment, NEMT, educational, personal errands and connections to
regional transportation. ALTRAN reported that through coordination with the Marquette General Hospital Dialysis Unit, they are able to transport an average of six patients 45 miles from Alger County to dialysis in Marquette daily. The hospital pays for patient transportation for clients from Alger County regardless of their Medicaid status. In addition to the hospital, the Northern Michigan University, car dealerships, and shopping and commercial services in Marquette are desirable destinations for residents of Alger County.
ALTRAN runs Backpacker Transportation service, transporting passengers from Munising Falls
Visitor Center along Pictured Rocks National Lakeshore Park, 45 miles to Grand Sable Visitor Center with stops at tourist destinations along the route.
Ridership and User Characteristics Alger County is a 915 square mile rural county on the southern shore of Lake Superior. It is home to
9,522 people, 2,327 of whom live in the City of Munising. The population density is approximately 10 persons per square mile. ALTRAN is the only public transportation service available in Alger County. There is no intercity bus service or taxi service in the county. Alger County is a tourist area with most businesses relating to tourism. The 2014 Alger County Coordinated Transportation Plan reported that there are approximately 38 businesses in the county whose workers use public transportation/ride-to-work to get to/from their jobs.
Many of the 9,500 people living in Alger County are more vulnerable than the average US population.
The unemployment rate for Alger County is 9.5 percent the percentage of population age 65 or older is 22.27 percent, and 18.82 percent of the population report having a disability. Compared to Marquette County (median income of $61,374), the median family income in Alger County is lower ($50,098) and in Alger County, 50.65 percent of children are eligible for free/reduced lunch. There is only one federally qualified health center in Alger County and two in Marquette County. Many residents in Alger County need to travel to other communities to access services. ALTRAN is able to provide transportation to these services in an efficient and cost effective way.

Case Study: Michigan
90
Funding
ALTRAN reported that 39 to 40 percent of their system revenue comes from fares, about 18.5 percent from federal sources, about 35 percent from state sources and about one percent from local and tribal sources, depending on the reporting year. ALTRAN receives annual funding of about $25,000 from the local Commission on Aging, approximately $15,000 from the City of Munising for local matching funds, and about $5,000 from local Native American tribes through the two percent through Tribal Slot Revenue Payments grants. The Tribal Slot Revenue Payment grants are not awarded to ALTRAN every year.
A one-way trip on the Munising to Marquette route costs $7.00; repeat passengers can purchase a 40-
trip pass for $120. ALTRAN staff estimates that 96 percent of passengers use the 40-trip passes. ALTRAN leverages local partnership opportunities by providing services to social programs like meals on wheels and school systems, for a fee. On the Munising to Marquette route, they carry cargo (auto parts) on less crowded return trips.
ALTRAN receives federal funding through several MDOT programs. Section 5311 (rural formula)
provides funding through formula money for operating and capital assistance. The Specialized Services Program for unmet needs for individuals with disabilities and older adults helps fund ALTRAN services. The former Section 5316 (JARC) has been used to provide funding for developing new or expanded transportation services to connect welfare recipients and low income persons to jobs and employment related services. ALTRAN was the recipient for JARC which funded fifty percent for operations. The State of Michigan provides funding matches for these federal programs.
Outcomes
Through inter-county partnerships and collaboration with service providers, Alger County Transit is able to help residents in Alger County access social services, medical services and employment in Marquette City, which is 45 miles away. As noted above, Alger County is much more rural, and many services are only available in the regional population center. For those unable to drive or without access to a vehicle, this regional transit route provides the only link to these services.
ALTRAN leadership identified complementary markets and funders and designed a service package
that meets the needs of multiple populations with one service. They successfully make three 45-mile round trips a day, with 40 percent of the revenue from fares.
Lessons Learned
Inter-county partnerships and collaboration with service providers enabled Alger County Transit to help rural residents to access social services, medical services and employment in the closest urban center.
Identifying complementary markets and funders and designing a service package that meets the needs of multiple populations with one service enabled Alger County Transit to develop a successful service.

Case Study: Michigan
91
Michigan Case Study References
Alger County Transit. Local Transportation. Alger County Transit. 2016. June 14, 2016. http://www.altranbus.com/local.html Central Upper Peninsula Planning and Development Regional Commission. Central Upper Peninsula: Regional Transit Mobility Planning. May 2015. Governor Snyder's Special Message on Aging. Cotey, Rochelle. Executive Director, ALTRAN-Alger County Transit. June 20, 2016. Edgar, Sharon, Administrator, Office of Passenger Transportation, Michigan Department of Transportation, e-mail communication March 30, 2017. Google. Directions from Munising Falls Visitor Center to Grand Sable Visitors Center. Google Maps. Cited: June 14, 2016. https://www.google.com/maps/dir/Munising+Falls+Visitor+Center,+1505+Sand+Point+Road,+Munising,+MI+49862/Grand+Sable+Visitor+Center,+Pictured+Rocks+National+Lakeshore,+E21090+County+Road+H58,+Seney,+MI+49883/@46.5041129,-86.5648285,10z/data=!3m1!4b1!4m13!4 KFH Group, Inc. Coordinated Mobility Plan: Prosperity Region 1. 2016. Michigan Gaming Control Board. Tribal Casino Slot Revenue Payments & Slot Information. March 7, 2017. Michigan Department of Transportation. ALTRAN Transit Authority. MDOT/Doing Business/Passenger Transportation. 2016. June 14, 2016. http://www.michigan.gov/mdot/0,1607,7-151-9625_21607-162099--,00.html. Michigan Department of Transportation, Alger County Public Transportation Human Services Transportation and Job Access Plan: MDOT, 2014. Alger County Coordinated Plan. Monette, Kim. Acting Executive Director, ALTRAN- Alger County Transit. March 7, 2017. US Census Bureau, American Community Survey. 2010 - 2014. US Department of Health and Human Services, Center for Medicare Medicaid Services. Provider of Services File. September 2015. US Department of Labor, Bureau of Labor Statistics. 2016 - April.

Case Study: Michigan
92
This page intentionally left blank.

Case Study: Minnesota
93
C A S E S T U D Y : M I N N E S O T A
Minnesota Department of Transportation Central Community Transit Implementation - “Transit for Our Future” Initiative
Introduction
This is a case study of a state that has developed policies and programs to encourage rural and small urban transit systems to regionalize and meet multiple goals, including the provision of regional services. The state program is discretionary, providing planning support and transition funding, but dependent on local initiative to develop projects and apply for funding.
State Context and Policy Development
The Minnesota Department of Transportation (MnDOT) administers federal and state transit programs through its Office of Transit, which also directs planning and research studies, provides technical assistance, ensures program compliance and coordinates statewide pedestrian and bicycle activities. In Minnesota, state statutes require that public transportation be available to all citizens in all counties, with the result that there are 59 separate local and regional public transportation providers in the state.
As part of its statewide planning responsibility, the Office of Transit conducted the Greater Minnesota
Transit Plan in 2009, which provided a 20-year strategic plan for public transportation in the state outside the Twin Cities, the area known as Greater Minnesota. That study identified future needs and funding requirements. Subsequently the Greater Minnesota Transit Investment Plan of 2011 focused on setting priorities through a new process, and included the development of different futures that might take place under scenarios of reduced funding (this followed the economic crisis of 2008) as well as increased transit funding. One of the outcomes of this study was recognition that having many small transit systems limited potential efficiencies and left needs for regional connections unmet. For transit to be able to survive and thrive in a future that might involve reduced resources, changes would be needed that
Source: http://www.dot.state.mn.us/transit/riders.html Figure 33. Transit rider boarding a STRIDE vehicle

Case Study: Minnesota
94
involved a higher level of cooperation among providers, and potential organizational changes that could reduce the administrative, capital and operating costs of providing transit statewide.
Transit for Our Future Initiative Provides Funding for Regional Projects The Office of Transit statewide developed the “Transit for Our Future Initiative” to encourage and
assist established public transit providers to develop and implement local solutions to improve efficiency and service. The initiative developed a framework for this effort that includes three levels of joint action that could be implemented by two or more transit systems to achieve these objectives. These are described by MnDOT as the “three Cs”: Coordination, Cooperation and Consolidation.
Coordination. A formal relationship between multiple systems, each of which maintains a
separate identity and authority, including vehicle operation. Coordination may focus to a large extent on information sharing or providing information. Examples might include joint support for a mobility coordinator, travel trainer, or joint grant preparation.
Cooperation. Involves more joint decision-making and activity between multiple agencies under formal interagency agreements, managing resources of a distinct organization or service. Examples might include a joint Mobility Manager, joint purchasing, and sharing of resources such as technology or facilities.
Consolidation/Partnering/Merging. Combining all operational authority and control in a single combined agency that provides service based on agreements between the agencies. The basic example is combining multiple systems into a single system with its own policy board, branding, and services.
MnDOT developed a document, Guidance for Coordination, Cooperation and Consolidation (August
2013) that provides more detail on each strategy, a “toolkit,” directions for getting started, and a sample scope of work for technical studies that might be needed to develop and implement strategies. It includes information on legal relationships that can be used to implement any of the three C steps. In Minnesota, these include Joint Powers Agreements or Intergovernmental Service Agreements, either of which can be used by local governments to join in providing public services (such as transit). Much of the focus of this document is on options intended to improve efficiency and effectiveness through sharing of information or resources, rather than on developing regional routes or services.
This set of strategies is intended to serve as the basis for established Section 5311 rural and Section
5307 urban transit operators to jointly apply for funding under MnDOT Transit for Our Future project. The minimum grant is $5,000, and the local share is 15 percent (20 percent for capital). Funding can be used for virtually anything except bus purchases. Potential uses listed in the application include operational enhancements, service modifications (including regional routes), and transition activities or costs. Program design objectives and characteristics includes consolidated service design with a region-wide focus, providing access to most desired regional trade centers with greater frequency. MnDOT provides technical assistance in developing these projects.
The overall strategy includes MnDOT funding for Transit Restructuring Studies, which are
recommended for any joint project that includes organizational restructuring or increased services, including development of regional routes and services. Often a project that combines two or more systems organizationally also includes development of regional services that cross jurisdictional boundaries of former partners. Identification of regional needs, gaps and potential services is part of the study.

Case Study: Minnesota
95
MnDOT Identification of the Need for Rural Regional Services Implementation of this program to support regionalization of transit systems has been concurrent with
other MnDOT initiatives that include a focus on regional services. In 2014 the Minnesota Intercity Bus Study reviewed and identified the statewide network of intercity bus services, many of which are funded by MnDOT through its administration of the FTA Section 5311(f) program. Although this network links regional centers with the Twin Cities and gateways to service beyond state boundaries, in most cases it does not provide for same-day round-trips to regional centers, nor does it serve commuter needs.
MnDOT decided to examine regional transit needs in depth for an eleven-county region of growing
counties in southeast Minnesota in the Southeast Minnesota Travel Study. This study included a review of existing services, household surveys, transit user surveys and analysis of travel patterns from cell phone locations. This information was used to analyze major corridors and develop conceptual regional services. The study found several different transit market segments, but in terms of expanded services the preference is for regional public transit services, particularly express commuter routes. The study developed conceptual corridors and estimated demand for each, broken into work and non-work trips. This sets the stage for subsequent planning to determine operators, schedules, vehicles, and fares.
Another state study that addresses the need for regional transit is the 2016 update to the Greater
Minnesota Transit Investment Plan, which is the statewide plan for transit improvement. Technical Memorandum #2 reported on a statewide Wikimap and online destination survey. It reports that both transit users and non-users “identified a need for trips crossing county lines and connections to cities in other Districts.” Travel patterns include connections from Greater Minnesota to the Twin Cities (addressed by the intercity network for non-work trips, and growing commuter services for work trips), and connections from smaller towns to regional centers (which are more easily addressed by transit operations coordinating or consolidating at the regional level).
Progress under the MnDOT Initiative
Over the past three years the Transit for Our Future Initiative has funded a number of projects, some of which resulted in regional transit entities (with regional services), and others which did not. Some of these projects included:
Faribault and Martin Counties - 2013-2014 restructuring study resulted in consolidation of two
county systems under a Joint Powers agreement. Blue Earth, Nicollet and Le Sueur Counties - 2015 restructuring study led to service plan for new
regional service with implementation under Saint Peter Transit acting as a lead agency. Kandiyohi, Renville and Meeker Counties - 2014 restructuring study led to consolidation of
Kandiyohi Area Transit and Renville County Heartland Express into a single new provider, Central Community Transit (CCT). Subsequently during 2015 Meeker Transit joined CCT under its Joint Powers Agreement.
Another project began as an effort by two systems to jointly fund a Compliance Coordinator, but that
did not work out and ended with one system maintaining the buses of the other as a resource sharing measure. Four counties joined together to create a regional route known as Buffalo Ridge, but the demand was not there and the route was discontinued.

Case Study: Minnesota
96
Example of Regional and Intercity Services
MinCentral Community Transit (CCT) is an example of how the MnDOT policy initiative has resulted in the creation of a single regional system in place of three separate county systems. Kandiyohi Area Transit is based in Willmar, in southwestern Minnesota. Willmar is a regional center (2015 estimated population of 19,638), located in Kandiyohi County (2015 estimated population of 42542). A 2014 restructuring study under the Transit for the Future Initiative led to the creation of a regional advisory committee, and eventually Kandiyohi Area Transit consolidated with Renville County Heartland Express in neighboring Renville County. Jurisdictions that had operated the two systems included the two counties and the city of Willmar - each represented on the policy board of the new combined CCT system under a Joint Powers Agreement adopted by each jurisdiction. A transition grant under the Transit for the Future Initiative supported the effort by providing funding for the creation of a new identity, rebranding the combined fleet, marketing, and costs associated with combining internal systems.
The combined CCT has provided a single regional transit provider, though initially it did not result in
any new scheduled regional services. CCT provided county-wide demand-response service in both counties, and offered an hourly deviated fixed route scheduled service in Willmar (weekdays) and weekday advance reservation route making four daily round-trips from Willmar to New London and Spicer, both small towns in Kandiyohi County. Stops on the Willmar service include a college, medical facilities, the bus station (Willmar is served by the Section 5311(f) funded Jefferson Lines service), major shopping areas, and social and health services.
In 2015 continued work on regional restructuring led to the addition of adjacent Meeker County to the
CCT Joint Powers Agreement, expanding the board to 16 members by adding four Meeker County representatives. Another transition grant is anticipated from MnDOT to fund rebranding of the fleet, marketing, telephone and computer system changes. Expansion of CCT to a three-county system includes the planned implementation of new regional routes, connecting Willmar with Litchfield (in Meeker County) and Olivia (in Renville County), as shown in Figure 35 from the restructuring plan. These regional routes are proposed to be deviated fixed route services. The Willmar-Litchfield route is planned to operate Monday, Wednesday, Friday and Saturday; and the Willmar-Olivia route Monday through Saturday. Both will operate at least three round-trips per service day. Combined with the inter-community routes and structured (zoned) demand response service within each county, a regional network of services will result from the consolidation of the three separate county systems.
These regional routes connect the principal activity centers in the three counties, but it should be noted
that Willmar offers more services, jobs and shopping due to its larger population. Olivia, the principal center in Renville County, has a population of 2,484, according to the 2010 Census, while Litchfield in Meeker County has a population of 6,726. The distance from Willmar to Litchfield is 27 miles; and the distance from Willmar to Olivia is 26 miles. Proposed fare options would result in a fare of either $4.00 or $5.00 for each of these trips (before any senior or other discounts), a fare per mile of $0.15 to $0.19.
Source: http://www.cctbus.org/ Figure 34. CCT Bus

Case Study: Minnesota
97
Source: Nelson Nygaard, Kandiyohi, Renville and Meeker Transit Restructuring Plan, Final Report, Summary Report, p. 7-5. Figure 35. CCT restructuring plan
Lessons Learned
State transit programs can support the creation of regional transit organizations and services without top-down mandates, by offering:
Technical assistance Funding for restructuring/feasibility studies Studies/plans to help identify needs for regional services Templates for organizational structures, agreements, and contracts Funding for transition costs, including re-branding, marketing, changes to hardware and software,
and human resources costs Funding for operations of new regional services (until they can be included in ongoing grants to
the consolidated system) Depending on local interest, response to such a state program will take time, in the absence of on-
going incentives or mandates

Case Study: Minnesota
98
With support, local areas can combine and create regional entities that can be more cost-effective, make better use of technology, be fully compliant with program requirements, and meet previously unserved regional needs.
Minnesota Case Study References
Minnesota Department of Transportation Greater Minnesota Transit Investment Plan, 2011. Minnesota Department of Transportation, Greater Minnesota Transit Plan, 2009. http://www.dot.state.mn.us/transit/reports/transit-report/pdf/greater-mn-transit-plan.pdf Minnesota Department of Transportation Greater Minnesota Transit Investment Plan, 2017. http://www.dot.state.mn.us/transitinvestment/pdf/gmtip-public-comment-draft.pdf Minnesota Department of Transportation, Guidance for Coordination, Cooperation and Consolidation, August 2013 Minnesota Department of Transportation Minnesota Intercity Bus Study, 2014 Minnesota Department of Transportation Southeast Minnesota Travel Study, 2016 Minnesota Department of Transportation, Transit for Our Future Initiative, 2014. http://www.dot.state.mn.us/transit/transit-for-our-future/, accessed April 2016 Minnesota Department of Transportation, Transit for Our Future, “System Design Objectives and Characteristics,” http://www.dot.state.mn.us/transit/transit-for-our-future/docs/design-characteristics-regional-transit-system.pdf. Nelson Nygaard Consulting Associates, Inc., Kandiyohi, Renville and Meeker Transit Restructuring Plan, Final Report, Summary Report, 2016
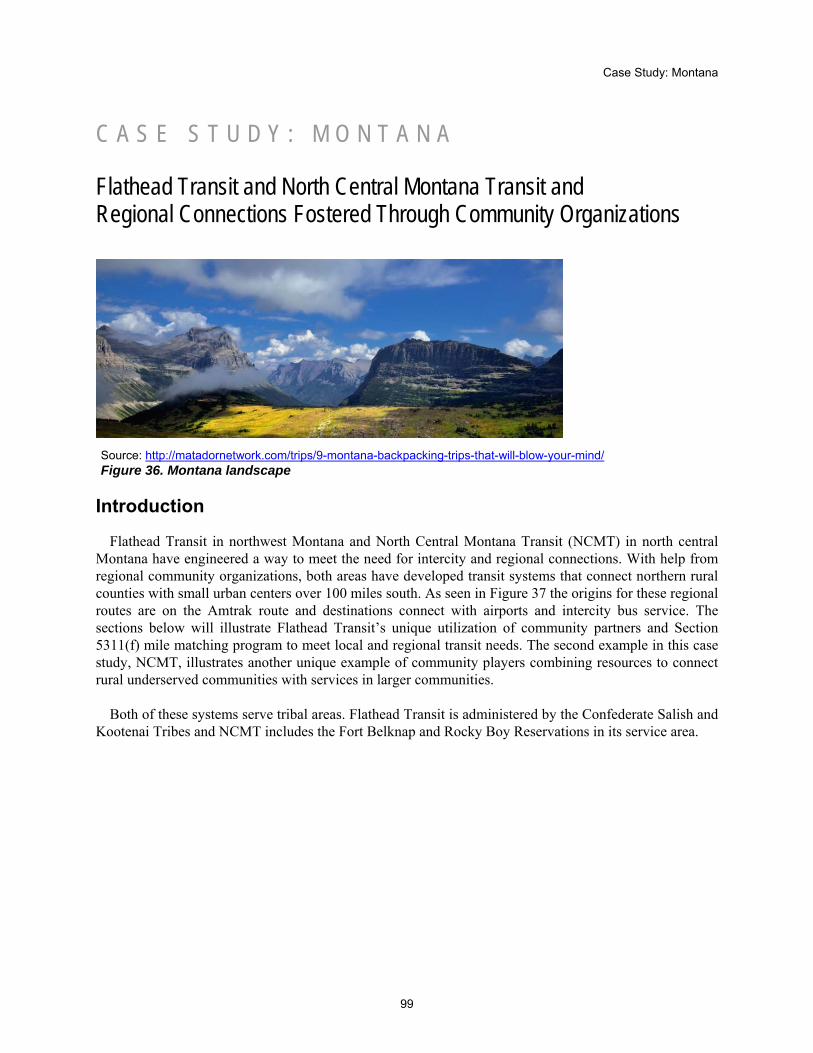
Case Study: Montana
99
C A S E S T U D Y : M O N T A N A
Flathead Transit and North Central Montana Transit and Regional Connections Fostered Through Community Organizations
Introduction
Flathead Transit in northwest Montana and North Central Montana Transit (NCMT) in north central Montana have engineered a way to meet the need for intercity and regional connections. With help from regional community organizations, both areas have developed transit systems that connect northern rural counties with small urban centers over 100 miles south. As seen in Figure 37 the origins for these regional routes are on the Amtrak route and destinations connect with airports and intercity bus service. The sections below will illustrate Flathead Transit’s unique utilization of community partners and Section 5311(f) mile matching program to meet local and regional transit needs. The second example in this case study, NCMT, illustrates another unique example of community players combining resources to connect rural underserved communities with services in larger communities.
Both of these systems serve tribal areas. Flathead Transit is administered by the Confederate Salish and
Kootenai Tribes and NCMT includes the Fort Belknap and Rocky Boy Reservations in its service area.
Source: http://matadornetwork.com/trips/9-montana-backpacking-trips-that-will-blow-your-mind/ Figure 36. Montana landscape

Case Study: Montana
100
Source: Montana Department of Transportation Website Figure 37. Regional transit in Montana
State Context and Policy Development
In Montana, the Department of Transportation (MDT) administers the federal rural transit programs. MDT’s federally mandated 2008 statewide transportation plan, TranPlan 21, notes the decline in intercity bus service and the consequent need for regional connections. A statewide intercity bus plan completed by MDT in 2012 further analyzed the need for such service focusing on the need for intercity services that would make stops in the state during daylight hours when local transit providers could provide connections. Subsequent regional planning efforts identified needs for regional connections which led to the development of rural regional/intercity routes that utilize Section 5311(f) funding.
The state transit program provided technical and fiscal support for these two services in the same
manner that it does for all subrecipients, with no particular additional state role.

Case Study: Montana
101
Examples of Regional and Intercity Services
These two case studies of rural regional service represent other similar services that have developed in Montana where there are similar demand characteristics. In addition to the examples described below, Northern Transit Interlocal (also known as Golden Triangle Transit) utilizes Section 5311(f) to provide service in the I-15 corridor from Great Falls to the Port of Sweet Grass and westward. Another service, the Big Sky (Skyline) regional intercity bus service is another regional intercity service in Montana. In terms of their role and operating characteristics, all of these fall in between the many local Section 5311 rural operations and the intercity services such as Jefferson Lines that link Montana with the national intercity network. In addition, the Missoula Ravalli Transportation Management Association (TMA) has implemented a regional vanpool program in western Montana that also provides one-time intercity rides.
Flathead Transit The Flathead Reservation is a little over 1.2 million acres with land in four counties: Lake, Sanders,
Missoula, and Flathead Counties. The reservation is unusual in many ways. Eighty percent of the people living on the reservation are not members of the tribe. The tribe is self-governed; they have their own tribal court and the Salish Kootenai College. Population density for the counties served by the Confederated Salish and Kootenai Tribes public transit systems in that region is low. As illustrated in Table 9 the average population density is 20.43 people per square mile for the four counties combined. Currently, the region is served by two transit systems run by the Confederated Salish and Kootenai Tribes (CSKT). CSKT Transit provides public transportation throughout the Flathead Reservation and surrounding areas and Flathead Transit provides intercity transportation between Whitefish, total population of 6,357, and Missoula, total population of 66,788.
Table 9. Population and land area for Confederated Salish and Kootenai Tribes Transit service area
Four Counties Combined Total PopulationTotal Land Area(Square Miles)
Population Density (Per Square Mile)
Four Counties Combined 243,744 11,931.81 20.43
Flathead County, MT 92,373 5,087.68 18.16
Lake County, MT 28,987 1,490.17 19.45
Missoula County, MT 111,011 2,593.42 42.8
Sanders County, MT 11,373 2,760.54 4.12
Montana 1,006,370 145,546.56 6.91
United States 314,107,083 3,531,932.26 88.93
Source: US Census Bureau, American Community Survey. 2010 - 2014.

Case Study: Montana
102
Organizational Structure
In 1998, the tribe created the Department of Human Resource Development (DHRD), to address the 41 percent unemployment rate for tribal members. At the time, social services for tribal residents were spread over a large geographic area with limited transportation options. As part of the DHRD programs, they combined the services in one location, creating a one-stop and removing the burden of travel to different locations to access services. The combination of services offered at the one-stop includes: Temporary Assistance for Needy Families (TANF), Workforce Investment Act (WIA), Vocational Rehabilitation, Fatherhood, Low-Income Energy Assistance (LEAP), Office of Community Services, all Elder programs, and Food Stamps. The Food Stamp program is run by the county so the tribe gave the county office space in their one-stop and eliminated the need to travel to a separate location for county services. The DHRD director, Arlene Templer, in her 2013 presentation at the Native Nations Institute for Leadership, Emerging Leaders Seminar, recounted that combining all the programs under one roof eliminated turf issues.
The DHRD found that TANF participants were missing appointments and unable to stay employed due to a lack of transportation. In response, they bought two vans for the TANF program. Eventually they started receiving state transit funding through Montana’s TransADE funding program, later switching to Federal Transit Administration funding through the state, including Section 5311 and JARC. Tribal transit funding is also used to support the CSKT transit services. Through an earmark, the DHRD was able to buy a gas station located at the one-stop, to use as a transportation hub, and they use the revenue from the gas station to match the federal transportation grants. They used a second earmark to build mechanical bays to service their vehicles. The DHRD also receives a grant to conduct Commercial Driver’s License training which serves as workforce development and provides “homegrown” drivers.
Source: www.greyhound.com/en/media/2013/12-09-2013: Figure 40. Greyhound press release
Source: http://www.charkoosta.com/2010/2010_03_25/DHRD_transportation.html Figure 39. The fleet of 2010 DHRD buses
Source: http://www.csktribes.org/ Figure 38. Logo of the Confederated Salish and Kootenai Tribes

Case Study: Montana
103
Flathead Transit Services Today, Flathead Transit, a service of the Confederated Salish
and Kootenai Tribes, provides daily passenger service between Missoula and Whitefish. The schedule is shown in Figure 41. The route starts in Pablo at 10:00 a.m., arrives in Missoula at 11:30 a.m., then goes up to Whitefish arriving at 3:00 p.m. There are ten stops (in Missoula, Evaro, Arlee, Ravalli, Saint Ignatius, Pablo, Polson, Lakeside, Kalispell and Whitefish), along the 200 mile one way route. On the way home, the 22 passenger van leaves Whitefish at 4:00 p.m. and arrives back in Pablo at 8:30 p.m., with the same 10 stops along the way. The average fare is $33 one way. Tickets can be purchased in Saint Ignatius (Stuart’s Cenex), Pablo (Quick Silver), Polson (KwaTaqNuk), and Kalispell (Brian’s Conoco).
Passengers can connect with Greyhound, Jefferson Lines, and
local transit services in Missoula, and with Amtrak in Whitefish. The bus service is funded through MDT’s 5311(f) program and is matched with Greyhound miles. No state or local funds are
required because of the Greyhound match. Using intercity bus “miles” to match 5311(f) funds is an innovative way to fund regional transit services. By partnering with a private intercity bus service, rural transit providers can use 5311(f) funds to provide feeder routes to intercity bus services and count miles from the intercity section of the route, operated by a private agency, as the match for their feeder service.
Corky Sias, the CSKT Tribal Transit Program Manager reports that the Flathead route averages about
11 riders a day. Riders include older adults, people connecting to other regional routes, college students and tourists visiting national parks.
Flathead Transit added a 12-foot trailer to the back of the bus so that they can also carry commercial
freight from Missoula along the route to Whitefish. Mr. Sias estimates that packages average about 200 pounds each and the cargo mainly consists of car parts, tires and blood for the Red Cross. The packages are picked up from the Greyhound and Jefferson lines and Flathead Transit takes them north. The revenue from the cargo transport goes back into the transit system and helps sustain the route, which is funded through the MDT 5311(f) program.
The Flathead Reservation has a Section 5311 funded deviated fixed route transit system, CSKT Transit.
They serve the reservation area five days a week from 6:00 a.m. to 5:30 p.m. (Monday through Thursday) and 8:00 a.m. to 4:30 p.m. on Friday. The system averages 200 riders a day. A one-way fare is $2.00 unless the trip is covered by a social service program. The service also goes to Missoula and Kalispell twice a day. Passengers can use this route to connect with the Flathead route.
Source: http://www.csktribes.org/32-generalpages/125-cskt-flathead-transit-schedule Figure 41. Flathead Transit schedule

Case Study: Montana
104
North Central Montana Transit North Central Montana Transit is a public
transportation system designed to serve the Hi-Line communities of Hill and Blaine counties in north central Montana. As illustrated in Table 10 these counties have a population density of 3.23 per square mile with a total combined population of 23,010 people spread over 7,126 square miles. This service serves surrounding communities and connects with Fort Belknap and Rocky Boy Reservations.
Rocky Boy Reservation is the smallest in
Montana, located in the Bear Paw Mountains. The tribe owns a ski area and steel manufacturing facility. Despite these activities, unemployment is high and almost half of the reservation’s 1,931 members live in poverty. Most residents live far away from towns and services. The Fort Belknap Reservation and additional tribal lands encompass 650,000 acres of plains and grasslands. Some points of interest on Fort Belknap Reservation are Aaniiih Nakoda College, Saint Paul’s Mission Church and natural areas that serve as tourist sites.
Table 10. Population and land area for North Central Montana Transit service area
Report Area Total PopulationTotal Land Area(Square Miles)
Population Density (Per Square Mile)
Two Counties Combined 23,010 7,126.51 3.23
Blaine County 6,576 4,227.56 1.56
Hill County 16,434 2,898.95 5.67
The Town of Havre 9,668 3.80 2,543.05
Hill County without Havre 6,766 2,895.15 2.34
Montana 1,006,370 145,546.56 6.91
United States 314,107,083 3,531,932.26 88.93
Source: US Census Bureau, American Community Survey. 2010-14. Source geography: Tract (Community Commons)
Source: North Central Montana Transit Facebook page Figure 42. NCMT public transit bus

Case Study: Montana
105
Organizational Structure
The Northwest Area Foundation (NWAF), an organization dedicated to helping communities in eight states (Idaho, Iowa, Minnesota, Montana, North Dakota, Oregon, South Dakota, and Washington) and 75 Native Nations, helped established Opportunity Link, Inc. (OL) in 2004. OL is a non-profit organization committed to assisting eleven counties and three reservations in Montana to achieve and sustain independence, prosperity and a better way of life.
North Central Montana Transit is operated by OL and was established in partnership with North Central Montana area organizations including local and tribal government agencies, social service organizations and educational institutions. NCMT serves Hill and Blaine Counties and the surrounding communities. This includes coordinating services with Fort Belknap and Rocky Boy Reservation’s transit systems.
Blaine County, located just below Canada’s border, is sparsely populated and has a population density of 1.56 persons per square mile. Hill County’s population density is higher (5.67) because the Town of Havre is located in it and has a population density of 2,543.05. If you subtract the Town of Havre, Hill County would have a population density of 2.34, well below the national (88.39) and state (6.91) averages. Havre is the County Seat of Hill County and the largest town in that region. People living in this region often have to travel long distances to access employment, educational services, and health care needs. These great distances make providing public transit difficult.
OL recognized the need for a transportation service to connect people living in this region with services
in Havre and Great Falls and in 2008, enlisted the Western Transportation Institute (WTI) at Montana State University-Bozeman to develop a plan for implementing public transportation in the region. WTI’s research team combined stakeholder’s resources through community meetings with tribal and county officials. They included representatives of communities and areas to be covered by the transit service and formed a Transportation Advisory Committee (TAC) consisting of elected officials, representatives from senior centers, transportation agencies, medical facilities and educational facilities, social service providers, and community based and minority advocacy organizations. The TAC also included representatives from the Fort Belknap and Rocky Boy tribes. In 2009, the TAC approved a coordinated transportation plan for their community and in 2010, NCMT was serving approximately 350 rides a week. In addition to state and federal funding, local partners including Blaine and Hill Counties, Northern Montana Hospital in Havre, and local organizations help to support the service.
NCMT Services NCMT runs several routes throughout the Hill and Blaine County region, connecting rural residents
with services in Havre. They have a route that connects their region to the City of Great Falls, over 100 miles away, with larger medical, educational, and retail facilities.
Source: www.nwfa.org Figure 43. NWAF logo
Source: http://www.idealist.org/view/volop/jwk2Z834XdbD/Figure 44. OL logo

Case Study: Montana
106
The Havre to Great Falls route runs one roundtrip on Tuesdays and Thursdays. In the mornings, the trip starts at 6:40 a.m. in Ft. Belknap with more than ten pick-up points in the Havre/Fort Belknap area, including a park and ride lot. The route then runs 112 miles to Great Falls Transfer Center and ends at GTF International Airport at 10:45 a.m. The afternoon trip starts at 2:15 p.m. at the airport and ends at 6:20 p.m. in Fort Belknap via Havre.
The Great Falls Transfer Center is on the corner of 4th Street and 1st Avenue South, downtown Great
Falls, MT. The Great Falls Transit District (GFTD) acquired the vacant Greyhound bus depot on July 28, 2000, using a Montana Air Quality and Congestion Initiative (MACI) grant and property-tax funds. Since January 2002, the transfer center offers connections to intercity bus service. Riders of North Central Montana Transit can connect with GFTD systems and Rimrock Trailways. GFTD’s transit system serves the communities of Great Falls and Black Eagle.
Opportunity Link is in a unique position to break down historically isolated silos of service and act as a
resource broker between diverse communities, races, incomes and governments. Their success stems from being able to contribute big picture strategic thinking along with ground level achievements as well as providing critical services as a collaborator, innovator and facilitator.
Factors for Success
Both of these transit systems are good examples of coordination and support among multiple community players, including tribal and local government, community organizations, private intercity bus companies, social service agencies, and educational institutions. In both cases community organizations with a broader mission than just transit identified transportation as a need for the wellbeing of the populations they serve and took on the role of coordinating and meeting transit needs for the region.
Source: Great Falls Transit District Website, http://www.gftransit.com/transfe 1 Figure 46. The Great Falls downtown transfer center
Source: http://archive.constantcontact.com/fs083/1101992540357/archive/1102678175649.html Figure 45. NCMT route Great Falls to Fort Belknap

Case Study: Montana
107
In northwest Montana, the Confederated Salish and Kootenai Tribes recognized the need for
transportation to help their community reach services and employment. They leveraged several resources and strategies to meet the transportation needs of the community, including land use. By creating a one-stop center, they reduced transportation needs without driving more miles, people can access all the social services and educational programs in one place.
The CSKT leveraged multiple funding sources and programs, combining transportation into the
network of services provided to their members. For example, they leveraged vocational dollars to train drivers, who they could then hire. The tribe partnered with the state, and private transportation companies and used federal 5311 and 5311(f) funding to meet the transportation needs of their region and connect people in rural areas to population centers in Kalispell and Missoula.
In north central Montana, a non-profit organization, Opportunity Link, committed to assisting eleven
counties and three reservations, in Montana achieve and sustain independence, prosperity and a better way of life also took on the role of public transportation provider. They were able to leverage community partners and state and federal support to connect their rural community with resources 100 miles south in Great Falls, MT.
In rural areas, underserved populations can become isolated and without transportation, unable to
access services and amenities needed to live a healthy life. Both of these social welfare organizations recognized the need for intercity transportation and developed partnerships and unique systems to meet that need for the populations that they serve.
Lessons Learned
Coordination and support among multiple community players, led by community organizations with a broader mission than just transit, helped make these two examples a success.
Leveraging multiple community partners, funding sources, programs, and land use were important in these efforts.
Creating a one-stop center reduces the need for transportation to multiple destinations. In Montana the major factor influencing the development of rural regional services is demand.
State policies and programs have not limited the development of regional services, which have emerged in response to local needs.
Montana Case Study References
American Indian Relief Council. Reservations/Montana. American Indian Relief Council. June 17, 2016.: http://www.nrcprograms.org/site/PageServer?pagename=airc_res_mt_flathead. Char-Koosta News. “CSKT Flathead Transit partners with Montana DOT and Greyhound to implement service between Missoula and Whitefish.” December 12, 2013. June 15, 2016. http://www.charkoosta.com/2013/2013_12_12/CSKT_transit_from_Missoula_to_Kalispell.html. Community Commons. Health Indicators Report. Community Health Needs Assessment (CHNA). 2010. June 20, 2016. http://assessment.communitycommons.org/CHNA/report?reporttype=libraryCHNA.

Case Study: Montana
108
Confederated Salish & Kootenai Tribes of the Flathead Reservation. Transportation Program. Home/Services/Human Resource Development/Transportation Program. 2015. June 17, 2016. http://cskt.org/. Great Falls Transit District. Downtown Transfer Center. June 16, 2016. http://www.gftransit.com/transfer_center.htm.
Kack, David. Get on the Bus: Connecting Small Communities on Montana's Hi-Line. Bozeman: Western Transportation Institute, Montana State University, 2010. Kraft, Adam, Montana Department of Transportation, Transportation Planning Division, March 28-20, 2017. Montana Department of Transportation. TranPlan 21. MDOT. 2007. Public Transportation Policy Paper. Montana Department of Transportation. Montana Public Transit Systems. 2014. June 15, 2016. http://www.mdt.mt.gov/publications/docs/maps/public_transportation.pdf. Montana.gov. Montana Governor's Office of Indian Affairs/Fort Belknap Indian Community. Montana.gov, Official State Website. June 17, 2016. http://tribalnations.mt.gov/fortbelknap. Opportunity Link. Mission and Background. June 15, 2016. http://opportunitylinkmt.org/mission-background/. Opportunity Link. North Central Montana Transit. June 16, 2016. http://opportunitylinkmt.org/north-central-montana-transit/. Sias, Corky. CSKT Tribal Transit Program Manager. June 17, 2016. Templer, Arlene. Engaging the Nationa's Citizens and Effecting Change: The Salish and Kootenal Story. Emerging Leaders Seminar. November 7, 2013. June 16, 2016. https://nnidatabase.org/video/arlene-templer-engaging-nations-citizens-and-effecting-change-salish-and-kootenai-story. U.S. Census. Community Facts - American Fact Finder. 2010June 20, 2016. http://factfinder.census.gov/faces/nav/jsf/pages/community_facts.xhtml. US Census Bureau. American Community Survey. 2010 - 2014. http://assessment.communitycommons.org/CHNA/report?reporttype=libraryCHNA.

Case Study: New Mexico
109
C A S E S T U D Y : N E W M E X I C O
New Mexico Regional Transit Districts North Central Regional Transit District
Introduction
The state of New Mexico allows Regional Transit Districts (RTDs) to hold referendums to increase local taxes to help fund transit. As of June 2016, New Mexico has four RTDs, two of which have passed an increase to the gross receipts tax for financial support. In addition to local and regional transit providers, the state Department of Transportation also provides regional transit services directly, including a commuter rail line (Rail Runner), and a network of regional commuter buses (park and ride services).
The North Central Regional Transit District (NCRTD) was the first RTD and the first to pass a gross
receipts tax. NCRTD connects communities and pueblos throughout north central New Mexico covering Los Alamos, Rio Arriba, Santa Fe and Taos Counties. There are six pueblos in NCRTD’s service area; Ohkay Owingeh, San Ildefonso, Tesuque, Pojoaque, Santa Clara and Nambé. NCRTD initiated service in 2007 and has a unique service model for a rural system. In general, they charge no fares to ride and their service is mostly flex route, providing over 20 flex routes in the over 10,000 square mile service area.
The NCRTD system illustrates the ability of a regional entity to develop and implement regional
services with additional connectivity provided by services developed and implemented by the state. This is a good example of regional taxation authority enabling the creation of a largely rural regional transit system that crosses jurisdictional boundaries.
State Context and Policy Development
In 2003, New Mexico passed the Regional Transit District Act, NMSA 1978, Chapter 73, Article 25. This allowed and encouraged the formation of Regional Transit Districts in New Mexico to provide, among other things, regional public transit services.
Source: North Central Regional Transit District Facebook Page, https://www.facebook.com/ridethebluebus/photos Figure 47. NCRTD bus
Source: North Central Regional Transit District Website, http://www.ncrtd.org/ Figure 48. NCRTD logo

Case Study: New Mexico
110
Example of Regional and Intercity Services
History and Organizational Structure In November 2003, an Organizing Committee (then called the Working Group) began meeting and
established the major guiding principles of the NCRTD. This ten member entity was certified as the North Central Regional Transit District by the New Mexico Transportation Commission in 2004, New Mexico’s first RTD. In 2006, NCRTD developed a service plan, consolidating existing services in the City of Española and Rio Arriba County under NCRTD. Taos County joined NCRTD in 2007.
The map in Figure 49, from the 2015 Long Range Strategic Plan, outlines the geographic area of the
NCRTD service area. Bus routes depicted in green are outdated; NCRTD has added more routes since the Long Range Strategic Plan was published. Figure 50 provides an updated route map in the Regional and Intercity Services section of this case study.
Source: NCRTD Long Range Strategic Plan Figure 49. Map of the North Central Regional Transit District

Case Study: New Mexico
111
Source: NCRTD Website, http://www.ncrtd.org/ncrtd-routes.aspx Figure 50. NCRTD route map

Case Study: New Mexico
112
NCRTD is governed by a 14 member board of directors consisting of local officials representing four counties, four cities, and six tribal entities. It serves as the administrative entity responsible for administration of transit services for north central New Mexico. They cover a service area of 10,079 square miles with a fleet of 43 buses. Table 11 outlines the size of the fleet.
NCRTD funds regional services using revenue from the Gross Receipts Tax (GRT). They fund transit services, operated by Los Alamos County, the City of Santa Fe, and Rail Runner in the NCRTD.
Table 11. The North Central Regional Transit District Fleet
The 2015 NCRTD Long Range Strategic Plan reports that “NCRTD does an excellent job coordinating
with transit systems in the four‐county region. Coordination includes route planning and funding to ensure a high level of regional mobility.”
Regional and Intercity Services
NCTD operates 20 flex routes and two fare based premium services, the Taos Express (now called the Chile Line) and the Mountain Trail Route to recreational areas. Most routes do not charge passengers a fare to ride.
Routes are divided into the following service areas and run mostly weekdays. Rio Arriba/Espanola Los Alamos Northern Pueblos Santa Fe Taos
NCRTD also operates a reservation based dial‐a‐ride service in the Pojoaque and Nambé Pueblos.
Mountain Trail is a premium service to ski and tourist attractions. The route begins at South Capital Rail Runner Station (connecting to multiple regional and local services) continues through downtown Santa Fe North on Route 475 to Ski Santa Fe recreational areas. This route charges a fare: tickets are $5 each way and bikes are accommodated on a first come first served basis.
In addition to its flex routes, Mountain Trail services the Taos community. The Chile Line provides
seasonal connections between the Town of Taos and the Village of Taos Ski Valley some 20 miles away. Unlike the rest of the Chile Line, this is a fare based service. Passengers pay between $2.00 and $5.00. The Chile Line flex route operates along ten miles of State Highway 68 and makes connections to service
NCRTD Vehicle Fleet
Number of Vehicles
Type of Vehicle
3 25 to 28-Passenger Buses 8 8 to 14-Passenger Buses 21 5-passenger paratransit vans 3 Contingency Fleet
Source: http://www.ncrtd.org/about-ncrtd.aspx

Case Study: New Mexico
113
throughout Taos County, and to Santa Fe, connecting with the NM Rail Runner which goes all the way to Albuquerque.
NCRTD buses serve key regional destinations including the Los Alamos National Laboratory, Buffalo
Thunder Resort and Casino and Cumbres & Toltec Scenic Railroad in Chama at the region’s northern most reaches.
In Santa Fe, NCRTD buses connect with New Mexico Rail Runner Express to Albuquerque and Belen.
New Mexico Department of Transportation’s (NMDOT) park and ride regional bus network operates four routes in the North Central Region, NCRTD coordinates with and connects to all NMDOT routes in their region.
Ridership and User Characteristics
NCRTD provided 184,320 annual passenger trips in Fiscal Year 2015 on routes they operated. The routes funded by NCRTD provided an additional 317,616 annual passenger trips. Figure 51 provides ridership data for Fiscal Years 2013, 2014, and 2015.
Source: NCRTD Website, 2016 Ridership Reports, http://ncrtd.org/ridership-reports.aspx Figure 51. NCRTD ridership
The US Census Bureau, American Community Survey (2010 – 2014) estimates the total population for the North Central Regional Transit District to be 237,446, residing in 10,083 square miles, making the population density approximately 23.55 persons per square mile. Table 12 breaks down the population and total land area for the NCRTD region by county.
RTD conducted an overall needs assessment based on the transit dependence index analysis in the 2014
Transit Service Plan Update, identifying the Town of Taos, southeast of Taos, City of Espanola, and County of Santa Fe as having the greatest need for transit services. This analysis utilized factors related to population density, age, income status, and vehicle availability. Figure 52 from the 2014 Transit Service Plan Update illustrates the location of higher transit dependent populations.
269,146
312,093 317,616
193,027209,750
184,320
0
50,000
100,000
150,000
200,000
250,000
300,000
350,000
FY 12‐13 FY 13‐14 FY 14‐15
Number of One W
ay Trips
NCRTD FundedRoutes
NCRTD OperatedRoutes

Case Study: New Mexico
114
Table 12. NCRTD population and land area
Source: US Census Bureau, American Community Survey. 2010-14. Source geography: Tract
Source: 2014 Transit Service Plan Update Figure 52. North Central Regional Transit district transit dependent populations
In addition to identifying major trip origins and destinations, the 2014 Transit Service Plan Update reviewed current transit services in the region and recommended revisions that coordinated directly with the five other systems in the NCRTD service area. This resulted in changing competing routes into
Report Area Total PopulationTotal Land Area(Square Miles)
Population Density (Per Square Mile)
Report Area 237,446 10,082.52 23.55
Los Alamos County, NM 17,974 109.17 164.64
Rio Arriba County, NM 40,155 5,860.83 6.85
Santa Fe County, NM 146,361 1,909.43 76.65
Taos County, NM 32,956 2,203.09 14.96
New Mexico 2,080,085 121,298.4 17.15
United States 314,107,083 3,531,932.26 88.93

Case Study: New Mexico
115
complementary routes. The Transit Service Plan helped NCRTD increase connectivity by making recommendations that:
Eliminated service duplication. Modified existing routes and schedules. Reduced number of timing points. Tailored service for seasonal fluctuations when serving tourist areas and colleges.
There are seven colleges and universities in NCRTD’s region. Table 13, from the 2014 NCRTD’s
Transit Service Plan Update, lists educational institutions, student population and locations. Many institutions’ students and employees use NCRTD’s services. For example, four of the seven Santa Fe routes bringing people into Santa Fe from the surrounding areas stop at the Santa Fe Community College.
Table 13. Students in the NCRTD area
County City College/University 2012 Student Population
Los Alamos Los Alamos University of New Mexico 710 Rio Arriba Española Northern New Mexico
College 3,873
Santa Fe Santa Fe Institute of American Indian Arts
350
Santa Fe Santa Fe Santa Fe Community College
6,480
Santa Fe Santa Fe Santa Fe University of Art and Design
650
Santa Fe Santa Fe St. John’s College 450 Taos Taos University of New Mexico 1,705
NCRTD Regional Total 14,218
Source: 2014 NCRTD’s Transit Service Plan Update
Funding
In 2008, NCRTD was the first RTD to secure a GRT for public transit, adopting a 0.125 percent tax. In FY 2015, NCRTD reported that 75 percent of their revenue ($7.2 million) was from GRT, 19 percent from federal grants, four percent from member local match and two percent miscellaneous. (7)(3) The Fiscal Year 2017 Budget report adopted on June 10, 2016 shows a decrease in percent of GRT revenue and an increase in federal allocation. The GRT source for FY 2017 is 59 percent of operating revenue, federal allocations is 30 percent, Los Alamos County contribution is three percent and miscellaneous revenues make up two percent. The Fiscal Year 2017 Budget reports the region has been in a recession and tax revenue reflects this with limited growth. Figure 53, from the Fiscal Year 2017 Budget report, summarizes NCRTD’s revenue over the last five years.

Case Study: New Mexico
116
Source: NCRTD Fiscal Year 2017 Budget, http://ncrtd.org/uploads/files/FY17%20BUDGET%20REPORT%20INTERNAL%20BOOK%20CONTENT%20-%208%2075%20X%2011%2025%20-%206-20-16.pdf Figure 53. NCRTD revenue
NCRTD develops and delivers rural regional services and supports regional routes delivered by other entities. As a regional entity, NCRTD provides funding for regional services delivered by local systems as an additional means of providing regional connectivity. They also connect with regional transit providers. For example, NMDOT runs the Park and Ride Express which connects with NCRTD services.
New Mexico and the federal government recognized NCRTD for their outstanding services. In 2015,
Therese McMillan, FTA Acting Administrator, presented NCRTD with the FTA Administrator’s Award for Outstanding Public Service in Rural Transportation. NCRTD was also the NMDOT FY 2014 Section 5311 Transit System of the Year recipient.
Lessons Learned
NCRTD’s success in increasing and expanding transportation services since its inception in 2004 illustrates the ability of a regional entity to develop and implement services with additional connectivity provided by other agencies. This example demonstrates the role of the regional taxation authority in enabling the creation of a largely rural regional transit system.
In FY2014, NCRTD conducted a route and schedule analysis. After consolidating routes and
adjusting service times to connect to other regional services, NCRTD ridership increased by 8.6 percent, with 209,750 riders for FY2014. This increase is eight times the 2013 national average for increased trips on public transportation, demonstrating the need for regional services.

Case Study: New Mexico
117
New Mexico Case Study References
Felsburg Holt & Ullevig. Long Range Strategic Plan. North Central Regional Transit District, 2015. North Central Regional Transit District. About NCRTD. June 30, 2016. http://www.ncrtd.org/about-ncrtd.aspx. KFH Group, Inc. Transit Service Plan Update: Final Report. 2014. July 5, 2016. http://ncrtd.org/ncrtd-transit-service-plan.aspx NCRTD. 255 Mountain Trail. 23 June 2016. July 1, 2016. http://www.ncrtd.org/uploads/FileLinks/b305b80b23be4acbb456f233ad191ceb/255_Mountain_Trail___6_23_16.pdf North Central Regional Transit District. Annual Report. 2015. July 5, 2016. http://ncrtd.org/uploads/FileLinks/ad079f8eb84c49e49e233770613806f4/NCRTD_2015_AnnualReport_FINAL.pdf North Central Regional Transit District. Fiscal Year 2017 Budget. 2016. July 15, 2016. http://ncrtd.org/uploads/files/FY17%20BUDGET%20REPORT%20INTERNAL%20BOOK%20CONTENT%20-%208%2075%20X%2011%2025%20-%206-20-16.pdf. Sampson, Rich. "New Mexico’s North Central Regional Transit District: Embracing the Regional Rural Reality." 2014, Winter Spring edition. US Census. American Community Survey. 2010 - 2014.

Case Study: New Mexico
118
This page left intentionally blank.

Case Study: Oregon
119
C A S E S T U D Y : O R E G O N
Oregon Department of Transportation Transit Network Program and Northwest Connector Program
Introduction
The Northwest Connector is a multi-county regional transit network that provides transit services across five counties in Northwestern Oregon. Recently rebranded from its former name, the North by Northwest CONNECTOR, its services are designed to attract multiple types of riders. It has a number of strategic partners including two tribal confederations, an urbanized area transit system, Greyhound, Amtrak and its thruway bus system, and local towns that are supporting improved pedestrian access and stops. The five county transit agencies listed below form a multi-county regional transit network, the Northwest Oregon Transit Alliance (NWOTA), that facilitates Northwest Connector service:
Tillamook County Transportation District - The Wave Lincoln County Transportation Service District (LCT) Columbia County (CC Rider) Sunset Empire Transit District (SETD) Benton County-Benton County Rural Transit (BCRT)
The project began with a $3.5 million U.S. Department of Energy (DOE) grant and is defined by a
regional inter-governmental agreement. Partner agencies remain independent and jointly apply for funding, and share administrative costs for the NWOTA. The project includes development of regional routes by modifying local services and of higher quality transfer points at major stops where riders could make scheduled connections. New services are combined under a common brand which is incorporated into existing agency brands, not replacing them. A regional visitor pass is common to all the participating systems, supporting regional travel between Willamette Valley and the coast, but each retains its individual local fare structure.
Source: Tillamook County Transportation District Figure 54. North by Northwest CONNECTOR bus

Case Study: Oregon
120
Organizational Structure
In 2010, a team of political actors, the five transit agency directors, informally supported by state and regional technical support staff, applied for a U.S. DOE Energy Efficiency and Conservation Block Grant (EECBG) Program, under the General Innovation Fund category and were awarded a three year, $3.5 million for a pilot project using bus service to reduce fossil fuel emissions.
The two counties and three transit districts (separate from county governments) developed a
coordinating council and intergovernmental agreement, officially forming the NWOTA. The grant allowed the partners to launch a pilot program of regional strategies aimed at increasing transit use by commuters and visitors, and decreasing community dependence on fossil fuels. They included:
co-branding and marketing; regional route and service coordination; increasing frequency and days of service; construction of bus-stop furnishings; centralized website; and partnership development for the NWOTA partners.
Today, Northwest Connector transit services are supported by the individual partner transit agencies,
state and federal grants and other partnerships. All the transit agency partners are financially independent and receive individual financial support through ODOT grants and local support. The Lincoln County Transportation District, Tillamook County Transportation District and Sunset Empire Transportation District have local property tax support as well. Several of the intercity services are supported by 5311(f) funds. For example, ODOT funded the Lincoln City to Grand Ronde/Salem service with Section 5311(f) intercity funds. The local match for this particular route is being provided by the Confederated Tribes of the Grand Ronde and the Confederated Tribes of the Siletz Indians.
The North by Northwest CONNECTOR coordinates and co-markets Columbia County Rider, Sunset
Empire Transportation District, Tillamook County Transportation District, Benton County Transit, and Lincoln County Transit. It combines the resources of the partner transit agencies to provide seamless transit services along the northwest Oregon coasts from Astoria to Newport with connections to inland population centers including Albany, Salem, Portland and transit connections in Rainier.
State Context and Policy Development
The overall Oregon Department of Transportation (ODOT) intercity program is called the Transit Network Program, which uses a number of funding sources including 5311(f), 5311, and also state dollars. It is described in the Oregon State Management Plan. It has five components: information systems (GTFS for all transit providers, timetables and maps.); state contracted service (ODOT’s POINT network and Amtrak Thruway); intercity bus discretionary grants; multi-modal transit hubs; and transportation options program coordination. Recently ODOT has purchased Remix route planning software for use by all transit providers, enabling them to use their GTFS data for service planning and Title VI compliance.
ODOT encourages private for-profits to compete for service contracts, and they are eligible for capital
grants - but not for operating grants. The grant program is described as discretionary (local transit providers initiate projects, the state evaluates and selects among them), but the state may fund intercity

Case Study: Oregon
121
projects of statewide importance outside the discretionary grant program by providing either contracts or grants. So ODOT can design and fund an intercity grant project as well as a contracted project.
With regard to the original development of the Northwest Connector, ODOT was not a co-applicant for
the Department of Energy funding, providing only staff time in an advisory role. The routes included in the Northwest Connector network are funded under various grant programs, including Section 5311(f).
Given this basic program structure, it is not surprising that Oregon has several examples of rural
regional mobility covering large regions in addition to the North by Northwest Connector. The Confederated Tribes of the Umatilla Indian Reservation KAYAK network covers a large area whose jurisdictional boundaries are based on historic tribal areas and transit service needs. Another regional network with regional services is Cascades East Transit, operated by Central Oregon Intergovernmental Council. ODOT is supportive of the development of regional networks and regional services, and sees that there is potential for additional regional service development in other areas, if there is funding and willing local leadership.
Examples of Regional and Intercity Services
The Northwest Connector system provides transit services across five counties in northwestern Oregon. The system also provides connections to Amtrak and cities in the I-5 corridor including Kelso, Portland and Albany.
Source: North by Northwest CONNECTOR website: http://nworegontransit.org/ Figure 55. Map of the CONNECTOR Service Area

Case Study: Oregon
122
The NWOTA coordinates services by improving and in some cases eliminating transfer points. For example, the TCTD service used to stop in Otis and passengers had to transfer to Lincoln County’s bus services. Now TCTD goes into Lincoln City, eliminating the transfer, and the agencies share the cost of the extended run.
Route and service changes built on the strengths of the five existing systems, took into account
connections to intercity transit services and focused on improvements that served major travel markets identified by a market study. Route and service changes implemented under the Northwest Connector focused on improving connections between the partner agencies. Connecting routes between counties existed before the project; however, except for one route from Portland to Tillamook, all other inter-county transit travel required a transfer, usually in a remote area near a county line. Also, while inter-county trips can be made using the regional visitor pass, transferring to the next county still requires passengers to pay a new fare.
The final report for the U.S. DOE grant, North by Northwest CONNECTOR: Successes and Lessons
Learned reported the following major service adjustments during the initial years of program implementation covered by the grant.
Lincoln-Benton County Connections
Before
BCRT and LCT were cooperating to provide “Coast to Valley” service from Corvallis to Newport. The service was fixed-route service funded with New Freedom funding, primarily serving medical and hospital access needs for coastal residents. The LCT bus started in Newport and travelled inland (east), and the BCRT bus started in Corvallis and travelled west. The two buses would meet at Ellmaker Wayside, a remote rest area roughly near the mid-point, exchange passengers, and then go back to their respective starting points.
After
Seven day fixed route service was initiated on this route as part of the CONNECTOR pilot project, and a new connection to the Albany Amtrak station was made. In addition, BCRT and LCT set up a more efficient arrangement to eliminate the mid-point transfer. The LCT bus now makes one run all the way from Newport to Albany/Corvallis and back twice a day; while the BCRT bus runs between Albany and Corvallis. As operational costs for each party were roughly the same, no cost-sharing arrangement was needed for this change.
Tillamook-Lincoln County Connections
Before
Between Tillamook and Lincoln counties, the transfer point was Otis (population approximately ten), and the layover time for a transit connection was typically several hours.
After
As a result of the CONNECTOR project, the TCTD bus now runs all the way into Lincoln City and LCT helps defray TCTD’s extra operational costs. The change also provided an opportunity for direct

Case Study: Oregon
123
service from Tillamook to the Chinook Winds Casino in Lincoln County for access to both jobs and recreation. On weekdays the connection to Salem is made by Salem Area Mass Transit District, but on weekends (when SAMTD does not operate), TCTD operates the full trip to Salem and Lincoln two times per day. To address the cost of the service changes, LCT secured FTA 5310 funds for service between Nehalem (in Tillamook County) and Lincoln City (in Lincoln County) and used these funds to pay TCTD for providing the service as a contractor. The 5310 funds provide a 90/10 federal/local match, with the local share provided by the tribes.
Clatsop-Tillamook County Connections
Before
Between SETD in Clatsop County and TCTD in Tillamook County, the transfer point was Tolovana Park, located south of Cannon Beach.
After
SETD and TCTD moved the transfer point to a better location in mid-town Cannon Beach, where riders can access a greater number of community amenities and services, and also connect to the ODOT funded NW POINT intercity passenger service that serves Portland and the north coast. Schedules have been adjusted to reduce transfer wait times. Both partners were able to absorb minor operational cost increases resulting from these changes through efficiencies gained through service adjustments elsewhere.
Columbia-Clatsop County Connections
Before
Travel from Portland to Astoria on the northern tier of the system (along the Columbia River Highway US30) required two transfers and about six to eight hours. A transfer between Columbia County Rider buses was required in St. Helens, and an additional transfer was needed in Westport, a rural community with limited amenities, to access the SETD system. Service was available weekdays only.
After
Connecting times between SETD and Columbia County Rider have been better coordinated and the CONNECTOR pilot project allowed SETD and Columbia County Rider to test seven-day service. However, there is still significant room for improvement between Portland and the coast via this route. An interim recommendation from the consulting team was to move the SETD/Columbia County Rider transfer point to Clatskanie, a larger community with significantly more destinations and services than Westport. However, political and financial constraints in Columbia County precluded SETD’s ability to provide service within Columbia County during the pilot project.
Currently, the transfer point is at the Rainier Transit Center and this trip takes approximately 3.5 hours.
Plans call for the transit center site (formerly a gas station) to be re-developed to meet public transit needs. The transit center will have rider amenities such as restrooms a place to wait for the bus and park n ride parking on site. The Oregon Connect V Program and a federal intercity grant to be used as the match dollars provided funding or this project. The Connect V funding totaled $678,308 and a federal intercity grant funds totaled $135,662. Weekday intercity service from the Amtrak station in Kelso, Washington to

Case Study: Oregon
124
Astoria, Oregon was initiated in 2013, allowing travel through Columbia and Clatsop counties without a transfer.
As changes to connections and service between Columbia County Rider and SETD have yielded
minimal improvements to efficiency and convenience, SETD is working on an alternate initiative to help improve visitor access via the northern tier of the Northwest Connector system. The ODOT POINT bus traveling on Highway 26 has fewer stops and is a much faster way to reach Portland.
Ridership and User Characteristics
Like most rural areas, Columbia, Clatsop, Tillamook, Lincoln, and Benton Counties’ primary mode of travel was by single occupant vehicle. Seasonal travel to the coast caused traffic congestion on several routes but the counties wanted to keep their rural small town character and not expand their roads. Plus the seasonal nature of the traffic made highway expansion and funding difficult to justify. The majority of transit users are transportation disadvantaged; people with disabilities, older adults, those without access to a personal vehicle, and people with lower incomes.
The five counties served by the Northwest Connector cover 4,245 square miles with a combined
population of 244,067, making the average population density 57.5 people per square mile. Table 14 breaks out the population, land area, and population density for the five counties and compares it to the state and United States. The coastal counties have lower population densities and are attractive vacation and recreational destinations for the more densely populated Willamette Valley.
Table 14: Five County population, land area, and population density
Report Area Total PopulationTotal Land Area(Square Miles)
Population Density (Per Square Mile)
Report Area 244,067 4,244.8 57.5
Benton County, OR 86,034 676 127.27
Clatsop County, OR 37,236 829.08 44.91
Columbia County, OR 49,325 657.38 75.03
Lincoln County, OR 46,138 979.76 47.09
Tillamook County, OR 25,334 1,102.58 22.98
Oregon 3,900,343 95,988.34 40.63
United States 314,107,083 3,531,932.26 88.93
Source: US Census Bureau, American Community Survey. 2010-14. Source geography: Tract By creating the regional network, the local transit providers were able to expand their ridership. The
participating Northwest Connector agencies added new types of riders, attracting tourist and recreational riders with their intercity services making connections to the Willamette Valley.

Case Study: Oregon
125
The NWOTA developed a marketing and branding strategy that incorporated the Northwest Connector name into existing individual agency brands and identities. This helped connect the five diverse counties and attract multiple types of riders. Tourists and employees from the Willamette Valley could use the Northwest Connector service to travel out to the coast and between the five counties using regional bus passes. The idea was that consistent branding would help visitors use the system. The name and brand are currently being updated. Over 1,600 CONNECTOR visitor bus passes were sold in 2014.
Funding
In 2010, the five transit agencies were awarded a $3.5 million grant from the U.S. DOE EECBG Program to initiate the North by Northwest CONNECTOR pilot project. This is the first project of its kind funded by the U.S. DOE, and serves as a national model for rural transit coordination in other areas of the country. The pilot program funding was for a three-year project covering planning, administration and service expansion.
A key task of the U.S. DOE grant was to examine ways to sustain the program after grant funds expire.
Example strategies include new revenues from sales of regional advertising and visitor passes, charitable fundraising activities in partnership with the North by Northwest Transportation Foundation, Oregon’s energy tax credit program, tribal partnerships, business sponsorships, and ongoing funding from the Federal Transit Administration.
The Northwest Connector’s coordinating agency, NWOTA, is supported through contributions from
the five partners and additional grant funding, including grants awarded by ODOT specifically to support the partnership. In addition, each of the five transit partners contributes approximately $10,000 a year to the NWOTA. About half of this is used for administrative expenses. Other NWOTA expenses include items such as website maintenance, national conferences, legal/audit/insurance, and marketing. NWOTA contracts with the Columbia Pacific Economic Development District to provide one full-time equivalent administrator staff support.
Source: Tillamook County Transportation District Figure 57. TCTD bus
Source: Tillamook County Transportation District Figure 56. CONNECTOR logo

Case Study: Oregon
126
Factors for Success
The new Northwest Connector services established an integrated, multi-tier, vertical and horizontal mobility network – supplemented by Amtrak’s Cascades service through the Willamette Valley as well as private intercity bus routes – creating a ladder-like matrix of connectivity throughout the region. With services that are frequent, reliable and easy to understand, the Northwest Connector appeals to a wider audience of travelers. From people looking for essential transit options to reach employment or health care to tourists looking for a way to reach key destinations along the coast or in the valley and college students and faculty accustomed to living less dependent on private automobile ownership, the Northwest Connector system meets more types of travel needs.
After the NWOTA formed, they started community outreach and branding efforts in 2011 and launched
the NW CONNECTOR system in 2012. As a result of the U.S. DOE pilot project the five-county region now has:
1) centralized coordination program (NWOTA), 2) centralized website, 3) regionalized transit services, 4) regional route and service coordination, 5) regional bus stop furnishing and improved pathways, 6) regional fare system, 7) enhanced branding and marketing system, and 8) employer and visitor transit programs.
The coordinating council meets monthly to collaborate and monitor progress on major tasks. The U.S.
DOE final report, North by Northwest CONNECTOR: Successes and Lessons Learned, reported that “All partners had to broaden their perspectives beyond the customer base in their individual service areas. Achieving a regional outlook required compromise, and sometimes challenging financial tradeoffs.”
The centralized NWOTA website provides public information about the Northwest Connector, and is
being updated to improve its functionality. This includes coordinated route and fare information for riders across all five counties. The website also has a member’s only side to host management tools to benefit all five partner agencies. Originally, the agency-only side of the website was developed to manage regional Google Transit Feed System (GTFS) data to facilitate adjustment of routes and stops, but ODOT now provides for GTFS feeds for each agency across the state. The route and stop module is also set up to keep track of stop furnishings, and provide information on available stop amenities to users.
Careful analysis of data and market trends helped to focus regionalization efforts where they are most
effective. The Northwest Connector program has achieved two major regional service planning objectives: improved connections between the five partner agencies’ transit systems and improved connections between the Willamette Valley population centers and the five counties. To make responsible service changes a detailed market analysis was performed during system implementation. The market analysis looked at identifying new markets for transit services.
The market analysis served as a powerful tool for the agencies to make data driven decisions regarding
local and regional routes and schedules, stops and connections, service provision and expansion. Analysis of data and market trends helped focus regionalization efforts where they were the most effective. For example, developing a regional fare structure for both commuters and visitors was considered early on. However, the market analysis helped the partners understand that investment in a regional commuter pass

Case Study: Oregon
127
program would not likely be worth the potential return. Alternatively, the analysis provided significant justification for a visitor pass program, including valuable information on geographic areas where marketing activities would likely have a positive effect.
Small adjustments to regional routes and coordination of services between the partner agencies helped
improve services and increase ridership. Specific improvements to intercity services were discussed in the section above. In addition to regional transfer adjustments, service hours and fare structures were also analyzed for seamless coordination. Routes and service that existed at the onset of the project were used as a foundation for regionalization. Significant ridership increases on the system have resulted from the partnerships. For example, since TCTD’s Route 4 was extended to Lincoln City in the spring of 2012, ridership on this route has increased over 74 percent on weekends and 71 percent on weekdays. To implement the route changes, however, LCT had to be willing to allow TCTD to operate within its service area, reduce its own service, and pay TCTD for increased operational costs.
The North by Northwest CONNECTOR: Successes and Lessons Learned report found that when the
partner agencies evaluated their individual services in the context of a regional system, many partners identified future partnering opportunities. For example:
TCTD worked with SETD and local veterans to identify better ways of providing veterans in
Tillamook County with transportation to appointments at Camp Rilea in Clatsop County. LCT worked with TCTD and both the Siletz and Grand Ronde Tribes, to explore connections
between the Chinook Winds casino in Lincoln City, and the Spirit Mountain casino in Grand Ronde.
The CONNECTOR Alliance, as a group, is also exploring new service to Salem along the Salmon River Highway in partnership with the Tribes. (LCT is sponsoring this initiative for the group.)
SETD identified a need for Amtrak through bus service from the train station in Longview/Kelso to Astoria, and is working to incorporate new intercity service on that route into the CONNECTOR system.
Performance measures gathered during the DOE grant period showed that on the whole, regional
ridership increased. Figure 58, from the North by Northwest CONNECTOR: Successes and Lessons Learned report shows the overall system-wide ridership, including all fixed routes within all five transit service areas.

Case Study: Oregon
128
Source: North by Northwest CONNECTOR: Successes and Lessons Learned report Figure 58. CONNECTOR System-Wide Annual Ridership from 2011 to 2013
The North by Northwest CONNECTOR: Successes and Lessons Learned report found that, transit service provided by the five CONNECTOR agencies is responsible for about five million fewer miles driven in the region each year. This reduction in total vehicle miles traveled (VMT - statistics that are influenced by the number of transit riders served per mile of bus operation) in turn has the potential to relieve congestion, reduce vehicular delay, and decrease greenhouse gas emissions.
In addition to the increased services and service hours of the CONNECTOR its coordinating agency,
NWOTA was recognized by the National Association of Counties with its 2013 Achievement Award.
Lessons Learned
A highly connected, ladder-like mobility network, with services that are frequent, reliable and easy to understand, appeals to a wide audience of travelers with multiple types of travel needs.
Partners need to broaden their perspectives beyond their individual customer base. Compromise and financial trade-offs may be needed to achieved a regional outlook.
Community outreach and branding efforts were important, as does a centralized regional website that is well-maintained.
Careful analysis of data and market trends help to focus regionalization efforts where they are most effective.
Small adjustments to regional routes and coordination of services between the partner agencies help improve services and increase ridership.
Participating partners may identify future partnering opportunities.

Case Study: Oregon
129
Oregon Case Study References
Davis Evans and Associates Inc. North by Northwest CONNECTOR Successes and Lessons Learned. 2013. Lincoln County Oregon Transit. North by Northwest CONNECTOR. June 2, 2016. http://www.co.lincoln.or.us/transit/page/north-northwest-connector Mary McArthur, Heidi Henry. CONNECTOR Frequently Asked Questions: Northwest Oregon Transit Alliance. Pilant, Doug. Executive Director, Tillamook County Transportation District. May 31, 2016. POINT. NorthWest POINT, Portland-Astoria. POINT. June 2, 2016. http://www.oregon-point.com/nw_point.php Richardson, Carole (Plangineering LLC), Stefano Viggiano (Parsons Brinckerhoff), Sine Adams (Parsons Brinckerhoff) and Mary Burke (Maverick Media), North by Northwest Connector Management Plan, A Strategic Approach to Regional Transit Coordination, October 2016. Sampson, Rich. Connecting Northwest Oregon: A Heroic Effort: Community Transportation Association of America, 2015. Sunset Empire Transportation District. Routes. Lower Columbia Route. Plan Your Trip. June 2, 2016. http://www.ridethebus.org/Lower_Columbia_Weekday.aspx Sunset Empire Transportation District. Plan your Trip. June 2, 2016. http://www.ridethebus.org/Map_My_Ride.aspx?start=Portland&end=Astoria The Chief News. “PCC students design concept for Rainier Transit Center.” April 26, 2016. http://www.thechiefnews.com/news/pcc-students-design-concept-for-rainier-transit-center/article_88a43bf6-0c25-11e6-83cf-3b771cca9654.html US Census Bureau, American Community Survey. Community Health Needs Assessment. Community Commons. 2010 - 2014. July 13, 2016. http://assessment.communitycommons.org/CHNA/report?reporttype=libraryCHNA

Case Study: Oregon
130
This page left intentionally blank.

Case Study: Vermont
131
C A S E S T U D Y : V E R M O N T
Rural Regional Services - Joint Schedules on Regional Routes Chittenden County Transportation Authority Deerfield Valley Transit Authority Green Mountain Transit Authority Rural Community Transit
Introduction
Over the past fifteen years, the Vermont Agency of Transportation (VTrans), with the support of the state’s legislature, has worked with the state’s local transit providers to address the need for regional connectivity. The result is an extensive network of regional services providing regional commuter services and rural regional links between rural transit system services. The state transit funding program has used Congestion Mitigation and Air Quality (CMAQ) funding to support the development of many regional routes. In many cases, transit operators have developed unique ways of jointly implementing regional services sharing costs and providing a convenient one-seat ride. This case study will examine the role of the state program in supporting the development of regional service, and provide an example that illustrates ways that rural transit operators have implemented services that increasingly offer a high level of statewide rural regional mobility.
State Context and Policy Development
State Policies and Development of Rural Regional Services VTrans administers federal transportation programs in Vermont, including FTA Section 5311 and
Section 5311(f) rural transportation assistance programs, and Section 5310 for non-urbanized areas. The state has only one urbanized area, Burlington, and transit service in that area is provided by the
state’s only public transit authority, Chittenden County Transportation Authority (CCTA). CCTA is considered a municipality. It serves the communities of Burlington, Essex, South Burlington, Shelburne, Williston, Winooski, Milton, Hinesburg and a portion of Colchester. CCTA operates regional express routes under the LINK Express name that serves Montpelier, Middlebury, and St. Albans, located outside the urbanized area. In 2011 CCTA and Green Mountain Transit Agency (GMTA) became a single organization, making CCTA a regional transit authority because of GMTA’s services in Washington, Lamoille, Franklin and Grand Isle Counties.
CCTA is governed by a thirteen member Board of Commissioners, including two commissioners from
Burlington and one from each of the other towns and counties in its expanded service area. Outside the CCTA/GMTA service area, all of Vermont’s transit providers are private non-profit
organizations. Figure 60 presents a map of generalized service areas. In Vermont, the role of county governments is limited to functions related to law enforcement, courts and local jails, so many services

Case Study: Vermont
132
are provided through private non-profit organizations. Service areas of transit providers are not always defined by county or township boundaries.
Source: Vermont Agency of Transportation PPID Division, Systems Planning Unit Figure 59. Vermont’s public transportation providers
Development of Regional and Intercity Services Statewide The focus on regional solutions began with the realization that regional and intercity bus services
provided by the state’s regional intercity bus carrier, Vermont Transit, were rapidly shrinking. Deregulation of the intercity bus industry in 1982 started the reduction and subsequent events led to continued service reductions. The Vermont Statewide Intercity Bus Study performed for VTrans in 1998 documented a reduced network providing service to 50 cities and towns in the state. By the most recent update in 2013, this number had declined to only six places with intercity service. Efforts to use FTA Section 5311(f) funding to maintain service in some corridors by providing bus capital were not successful in retaining service. In 2005, Greyhound Lines, owner of Vermont Transit, closed the firm and

Case Study: Vermont
133
left the state with limited Greyhound frequencies in two corridors. This gap initially became most apparent at the local level when the need to provide regional work trips was identified in CCTA planning.
CCTA is a public entity providing transit service to the Burlington urbanized area (Vermont’s only
UZA). In 2003, CCTA conducted a Short-Range Transit Plan. While it addressed many needs within the CCTA service area, it also identified a need for work trips from rural areas into Burlington, from Burlington to the state capitol, Montpelier, (which is non-urbanized), and to the state office complex in Waterbury (non-urbanized and located between Burlington and Montpelier). The 2003 transit plan defined potential commuter routes between Burlington, Montpelier, Waterbury, St. Albans, and Middlebury.
At the same time, at the state level, VTrans was developing a state “new starts” policy that would
provide funding to local public transit providers for new services for a limited period. At the end of the period, if the service met performance thresholds established for that type of service, it would be included in the on-going program with state and FTA funding support. VTrans identified CMAQ funding as the source of support for the new starts program, with three years of operating funding under CMAQ provided to allow service to develop full ridership.
CCTA used the new funding to develop three regional routes, all branded as new LINK services.
Commuter schedules from Burlington to Waterbury and Montpelier (2003); from Middlebury to Burlington (2004); and from St. Albans to Burlington (2005) were implemented by CCTA. Service to Middlebury has weekday service provided by CCTA and Saturday service provided by Addison County Transit Resources (ACTR). These services featured a limited number of stops, schedules that allowed travel in either direction morning and afternoon, and commuter (multi-ride) fares. Stops included downtowns and park and ride lots, and they were launched with a significant marketing effort.
Success of these routes, and support of the VTrans funding program, led other transportation providers
across Vermont to implement regional commuter routes, and connect rural, non-urbanized places to each other. Many services were entirely within the service area of a particular provider, but operators (most of them private, non-profit organizations) also worked with each other to jointly develop and operate connecting routes. By 2010, there were twelve regional commuter routes statewide, operated by nine different providers. Organizational consolidation reduced the number of providers over time, and these routes are still operating. Additional routes have been developed and implemented using CMAQ funding through VTrans. There are now 31 routes that VTrans classifies as Rural Commuter, and ten routes that are classified as Express Commuter as part of its annual statewide assessment of transit performance. (3) Figure 61 presents a map Vermont showing regional commuter routes.
In addition to these regional routes, VTrans uses CMAQ funding, transferred into its Section 5311(f)
rural and intercity program, to fund three rural intercity routes: one connecting Burlington to Albany via Rutland and Bennington, a second route connecting White River Junction with Springfield (Massachusetts) via Brattleboro, and a third route connecting Rutland and White River Junction. VTrans also provides comprehensive transit information covering all transit providers (including the regional and intercity services) serving the state on its Go! Vermont website and telephone information source (which also provides car- and van-pool matching, bicycle information and intercity bus schedules).

Case Study: Vermont
134
Source: KFH Group from data provided by VTrans, provider websites, ESRI Data. Figure 60. Regional commuter routes in Vermont
Examples of Regional and Intercity Services
Many routes in Vermont link rural areas with multiple frequencies and routes connecting providers may be jointly operated with no requirement that users change buses at the border of the provider’s service area.
Route 2 Commuter One early example of this service model is the Route 2 Commuter, which operates between St.
Johnsbury (2010 population 6,193) and the state capital Montpelier (2010 population 7,855). The trip takes 80 minutes each way, including stops, to cover 36.1 miles. The Route 2 Commuter schedule includes five round-trips per day: morning and evening services; a short-turn to a park and ride lot midway between the towns, also schedule to address work-trip commuter needs; and a mid-day round-trip.

Case Study: Vermont
135
Two providers jointly operate this service. Rural Community Transit (RCT), a private non-profit based in St. Johnsbury, operates two round-trips. The other schedules are operated by GMTA, the Montpelier-based arm of CCTA. The complete timetable is presented by both providers in their public information. There are different fares; RCT trips are fare-free and GMTA trips have a $2.00 fare. Productivity on this route averages six boardings per hour. Schedules are designed to connect to other regional routes in Montpelier, facilitating trips beyond this one route.
The significant lesson of this service is that it serves two rural towns, in different transit service areas,
through a cooperative service that does not require passengers to change buses at the border, and does not require a complicated cost allocation or contract.
Bennington-Wilmington This model has most recently been implemented in the southern part of the state by two private non-
profit transit providers. Both Deerfield Valley Transit Association (DVTA-now a division of Southeast Vermont Transit, Inc.) and Green Mountain Community Network, Inc. (GMCN) are private non-profit organizations created to provide public transportation in their respective service areas. They both applied to VTrans for funding to operate scheduled service between Bennington (GMCN’s hub on the west end) and Wilmington (the main hub for DVTA), filling a gap in the state’s transit network. VTrans has provided three years of operating funding using CMAQ funding, and service started on July 9, 2012. It is now in its third year.
Source: DVTA Figure 61. DVTA Moover Bus used on the Bennington-Brattleboro Service
The original grant proposal was jointly submitted by the two organizations in late 2011. Ten years earlier DVTA led a regional team in producing The Brattleboro-Bennington Feasibility Study, which included focus groups, surveys, public hearings and meetings with local policy-makers. The proposed route was also included a number of subsequent regional and statewide transit plans. The service was designed to service demand from many different ridership markets: persons connecting to intercity bus services at either end of the route, persons seeking medical and shopping services not available in the towns along the route, veterans needing access to VA medical facilities, employees, students, persons making recreational trips, riders with special needs and anyone without access to a personal vehicle. Though the agreement between GMCN and DVTA is a handshake, the application addressed the administrative and operational roles of each agency. The service pattern originally called for each operator to provide two round-trips per day schedules, but on a seasonal basis GMCN reduces the service

Case Study: Vermont
136
to one round-trip for three months each year. DVTA operates two morning round-trips from Wilmington (2010 CDP population, 463) to Bennington (2010 CDP population, 9,074). GMCN operates the late afternoon round-trip. Both operators show all schedules in their information.
Schedules are designed to facilitate connections at each end. The Bennington terminus (see Figure 63)
is the GMCN transit center which offers multiple routes to other towns, including the GMCN connection to Williamstown, Massachusetts (connects to Peter Pan intercity bus service to New York) and regional GMCN service to Manchester, Vermont (where it connects to Marble Valley Regional Transit Authority service to Rutland). The GMCN transit center in Bennington is also the stop for Vermont’s Section 5311(f)-funded Vermont Translines service between Albany and Burlington, and is the stop for the Yankee Trails local commuter bus service to Albany.
Source: DVTA Figure 62. Green Mountain Community Network (GMCN) Bennington Transit Center
In Wilmington, there is a timed connection to the DVTA service to Brattleboro, which offers a connection to southbound Greyhound service (funded by VTrans with Section 5311(f). Both operators agreed to follow the DVTA fare-free policy on this route (even though GMCN has fares on its other routes). Deviations are provided by advance reservation. The one-way trip between Wilmington and Brattleboro takes 40 to 45 minutes to cover 22 miles.
Schedules are designed to allow for work trips, and the service carries a limited number of employment
trips, student trips and mobility for seasonal workers in resort areas of southern Vermont. A 2014 survey of riders and potential riders demonstrated the variety of potential markets, with 29 percent of respondents working in one of the endpoints, 32 percent seeking connections to points out of the region, six percent desiring school trips, and 42 percent seeking to make trips for medical purposes, shopping and other purposes. Ridership has not grown as rapidly as hoped, with a combined annual ridership in 2015 of 4,142, approximately three boardings per service hour for the combined service. The route uses Route 9 through Green Mountain National Forest and Woodford State Park, which generate little ridership. A transfer in Wilmington is required for persons making the trip across southern Vermont from Brattleboro (2010 CDP population, 7,414) to Bennington. The connecting buses are shown in schedules, and there is a minimal wait time. Nevertheless, these factors may be affecting ridership.

Case Study: Vermont
137
As the Bennington-Brattleboro route is fare free, there is no farebox contribution to either participating transit system. Both DVTA and GMCN had applied to VTrans for CMAQ funding for the initial three years of operation, with the thought that at the end of three years, if the service met the state’s performance criteria, they would be folded into the base combined state/federal operating grant for each system. However, at the end of third year the route had not yet achieved the minimum state target for boardings per hour for rural commuter services; though it was providing acceptable performance on the other performance measure, (cost-effectiveness - defined as the cost per passenger trip). The use of performance measures to evaluate each system’s portion of service separately is problematic for DVTA because it operates two daily round-trips, whereas GMCN operates only a single trip for three months per year. DVTA’s costs are higher because of the additional round-trip, but the ridership is similar to that of the single GMCN schedule so its performance appears lower. When the two routes are combined, the overall boardings per hour measure for the combined service is higher than for DVTA alone, but still below the VTrans ridership standard, though the cost-effectiveness of the combined route meets the state’s criteria. DVTA and VTrans are working on ways to increase ridership through schedule changes and marketing, as it provides the link across the southern part of the state.
Lessons Learned
State support is important. Although rural regional routes have been implemented in a number of states that do not have an explicit policy supporting this type of service, the statewide experience in Vermont demonstrates that local public transit operators can and will implement regional routes that provide connections if there is policy and funding support from the state. The use of CMAQ funding for startup and initial operation of rural regional (commuter) routes proved to be a boon to the creation of a statewide network of connected regional services, allowing the systems to design the connections and test the markets. In addition, Vermont provides a high level of state funding to support public transportation.
Cooperation between operators. Neighboring transit systems can jointly develop services that do not require passengers to change at service area borders, and meet multiple regional needs. In particular, splitting schedules between operators means that:
o passengers get a one-seat ride, o each system provides a share of the cost, o each system gets to count a proportionate number of riders and share in the revenue, and o this can be accomplished with minimal efforts regarding MOUs, cost allocation studies
and contracts.
Need for regional performance evaluation. Vermont’s annual transit performance evaluation, which is used as factor in funding decisions, includes categories by service type. Rural regional routes across the state are compared with each other, rather than with other types of services. Nevertheless, the process does not treat joint operations as a single project, which can mean that the performance of operators in a joint service can appear to differ. This does not present an accurate picture of the combined service, and may jeopardize ongoing funding because one or more schedule appears to have unacceptable performance measure.
Ability to link very small towns. Although some of Vermont’s regional routes were designed to provide service to commuters traveling to and from the state’s only urbanized area (Burlington) many regional routes link small towns with each other. This demonstrates that careful consideration of needs and trip purposes can lead to successful rural regional services that do not necessarily have a trip end in a large population center.

Case Study: Vermont
138
Network connectivity. Designing services so that they have scheduled connections to rural
regional services increases the overall feasibility and provides for much more widespread rural regional mobility.
Vermont Case Study References
Chittenden County Transit Authority, www.cctaride.org/about-ccta/, “About Chittenden County Transportation Authority, July 18, 2016 Aaron Frank, “Succeeding with Commuters after Intercity Failure”, presentation at the 19th National Rural Public and Intercity Bus Transportation Conference, October 25, 2010. Vermont Agency of Transportation, Public Transit Route Performance Reviews – Annual Report for State Fiscal Year (SFY) 2015. http://www.census.ogv/quickfacts/table/PST045215/5046000 Deerfield Valley Transit Association and Green Mountain Community Network, New Start Proposal for Providing Public Transit Service between Wilmington and Bennington, November 10, 2011. http://factfinder.census.gov/faces/nav/jsf/pages/community_facts.xhtml Southeast Vermont Transit, Wilmington-Bennington Action Plan, June 8, 2016, p.7. http://www.census.gov/quickfacts/table/PST045215/5007975,00

C A S E S T U D Y : W I S C O N S I N
Regional Service in Southwest Wisconsin Scenic Mississippi Regional Transit Bus
Introduction
SMRT is a rural regional bus system serving Crawford, Vernon and La Crosse Counties in southwest Wisconsin. The service is intended to serve a variety of users, including commuters, seniors, disabled persons, riders going to medical or educational trips, shoppers and the general public.
State Context and Policy Development
The Wisconsin Department of Transportation supports the development and provision of public transit in the state’s urban and rural areas, along with a statewide intercity bus network. Federal funding, including Section rural transit assistance under the Section 5311 and the rural intercity program under Section 5311(f), are utilized together with State Urban Mass Transit Operating Assistance. The state funding is provided on a formula basis to eligible applicants including municipalities with populations greater than 2,500 as well as transit authorities and commissions.
There is no particular program designed to support rural regional transit services, though the state has provided funding through its normal programs to support service such as that provided by SMRT. In addition to SMRT there are several other regional services in the state, such as the Ozaukee County Express, the Washington County Commuter Express, Bay Area Rural Transit, and the Beloit-Janesville Express. These are categorized by the state as Commuter/Regional Bus Routes in the “Wisconsin Get-Around Guide” inventory of public transit services in the state.
Example of Regional and Intercity Services
How It Came to Be The concept for a regional service developed from a desire for a transit service to provide employment trips
between Prairie du Chien (population 5,757) and La Crosse (population 52,440). The city of Prairie du Chien developed an interest in a regional transit solution as a result of the findings of a business retention and expansion survey that found a shortage of qualified employees, and a lack of reliable transportation options. The city’s shared-ride subsidized taxi service did not provide a regional connection, and did not address this need for
Source: S.M.A.R.T Figure 63. SMRT logo

Case Study: Vermont
140
work trips. From the city’s perspective, the primary rationale for service was to support economic development and was seen as a city initiative.
When the concept was introduced to the Crawford County Transportation Coordinating Committee, (TCC)
additional goals were identified. The regional planning organization, Mississippi River Regional Planning Commission (MRRPC) participated in the Crawford coordination group, and also in the coordination committees in Vernon and La Crosse Counties. Once aware of the general concept, coordinating committees recommended expanding the concept to include stops in their counties. A regional advisory committee was formed that included representatives of MRRPC and three transportation coordinating committees. Prairie du Chien engaged a consultant to perform a feasibility study. It examined demographic and travel pattern data, engaged stakeholders, included open houses and presented service options and ridership forecasts. The study led to an expanded focus to include multiple markets, including work, medical, shopping and educational trips. Connectivity with service providers was identified as a key aspect of service design. The study team worked with the staff of the Wisconsin Department of Transportation, and after the study was completed in 2010 the state committed to funding startup if local match could be obtained.
During 2011 and 2012 there were difficulties with the implementation process. Prairie du Chien agreed to
contract for the service, but the local match was an issue. MRRPC sought local funding support from governments, businesses, and institutions in the region. Eventually WDOT operating and capital funding availability coincided with the provision of local support. Two rounds of bidding for operation of the system resulted in the selection of a contract operator. Buses arrived and service operations began on December 2, 2012.
The Regional Services There are three fixed routes: the Blue, Yellow and Red Routes, as can be seen in Figure 64. On the map, the
Blue Route is not shown separately, as it follows the same route as the Yellow Route, but with different stops and schedules. All three routes are fixed route, fixed schedule services, with one bus on each route. Service is operated Monday through Friday only. Service hours vary.
The Blue Route links Viroqua, Westby, and Coon Valley with La Crosse, with a morning round-trip
(5:37 a.m. to 8:24 a.m.), a mid-day trip (10:30 a.m. to 12:40 p.m.), and a late afternoon trip (4:05 p.m. to 6:49 p.m.). Routings of the three trips vary somewhat.
The Yellow Route serves the same towns as the Blue Route, but has alternative stops, and complementary schedules, with two morning services, a mid-day service and an afternoon return trip.
The Red Route is in a different corridor, starting in Prairie du Chien, and linking to Lynxville, Ferryville, De Soto, Genoa, and Stoddard to La Crosse. There is an early morning schedule, a mid-day schedule, and an afternoon service.
The schedules offer an early morning route and return service that would allow for a full eight-hour workday
in La Crosse, with the overall span of service beginning at approximately 5:45 a.m. and final drop-offs at approximately 6:15 p.m. The exact time varies by route.
Stops are located at major employers, downtown areas, medical facilities (hospitals and clinics), Technical
College (students and faculty ride free with ID), University of Wisconsin-La Crosse campus, Viterbo University, major shopping destinations (Walmart and Shopko) and the Amtrak station (optional on demand). Stop locations in towns are defined, with flag stops offered in rural areas between towns. In La Crosse, six stops are at shelters/stops of the local bus system, and free transfers are available.

Case Study: Vermont
141
Source: SMRT website. Figure 64. SMRT Routes and Service Area
The fare is $3.00. There are discounted punch cards (20 percent savings) and a monthly pass for regular users. Buses are 26-passenger body-on-chassis buses, with lifts and two wheelchair positions, bike racks and Wi-Fi internet access. The buses are publicly-owned. The service is operated by a private contractor, with buses that are owned by Prairie du Chien.
Source: http://lacrossetribune.com/news/local/smrt-bus-service-up-and-running/article_9ecfa0a4-a7d4-11e2-adce-0019bb2963f4.html Figure 65. The new SMRT bus connects La Crosse, Vernon and Crawford Counties

Case Study: Vermont
142
Ridership
Figure 66 presents the growth of ridership since the project’s inception (not including the partial first month). Ridership grew steadily over the first 22 months, flattening out in late 2014. The year of 2015 proved to be highly variable, with some months showing increases over the previous year. A reduction in service hours of approximately twenty percent accounts for the flattening out of ridership in 2014. Revisions to routes and schedules in October 2015 led to an upturn in ridership, and the first quarter of 2016 showed continued increases.
Some lessons learned as routes and schedules have been developed are that the heaviest ridership is
directional, going from rural areas and smaller cities toward the larger employment market/services of La Crosse; and it is heavier in the peak hours There is limited demand for trips between small towns. A review of ridership for a week in March 2016 reveals that the average boardings per vehicle trip (ten trips per day) was 7.42, with the highest average of 18 riders on the first morning inbound trip.
Source:Data supplied by Peter Fletcher, Mississippi River Regional Planning Commission Figure 66. SMRT ridership
Sustainability and the Future
Based on the continued growth of ridership, support of sponsors and communities, continued support of Prairie du Chien, and the continuation of funding through WDOT, it would appear that existing services will continue into the future. Looking ahead, at the request of La Crosse County, MRRPC has initiated a planning study to look at the feasibility of additional SMRT service routes that would connect Monroe and Trempealeau Counties with La Crosse.
0
500
1000
1500
2000
2500

Case Study: Vermont
143
User and Trip Purpose Characteristics
A user survey is performed periodically. The most recent survey showed that service addresses a number of different markets:
gender of riders
o 49.1%, male o 50.9% female
age of riders o 20.8% under age 25 o 37.7% ages 25 to 44 o 37.7% ages 45 to 64 o 3.8% age 65 or older
trip purpose o 54.1% work o 14.8% school o 13.1% medical o 18% other
rider satisfaction o 78.7% very satisfied o 21.3% satisfied o 0.0 % unsatisfied
Services are intended to meet needs for work, educational, medical and general trip purposes, and apparently
they meet that need. Unusual for a rural service is the low percentage of senior riders and the equal gender balance. It would appear that riders are quite satisfied with the service.
Source: http://www.ridesmrt.com/ Figure 67. Bus service replaced vanpool service to Organic Valley Cooperative

Case Study: Vermont
144
Organizational Structure
SMRT can be characterized as having a very lean organizational structure. The City of Prairie du Chien is the lead agency, acting as both fiscal agent and grant applicant. The service is operated under contract by Running, Inc., a private firm that operates the city’s shared-ride taxi service under a separate contract. The city provides a limited amount of funding to MRRPC for staff time to oversee the contractor and work with regional partners. Policy guidance is provided by a continuation of the advisory committee to the original feasibility study which includes representatives of the transportation coordinating committees of the three counties, MRRPC, and the City of Prairie du Chien.
Funding
The FY2016 operating budget for SMRT is $352,483. It is composed of $49,500 in user fares, $60,000 in contributions, $73,313 in local general fund match revenue from the City of Prairie du Chien, and a $169,670 grant from WDOT. The WDOT grant utilizes Federal Transit Administration (FTA) Section 5311 rural program funding combined with state match from the State Urban Mass Transit Operating Assistance program. Funding under this program is formula-based.
The funding from contributions represents a unique aspect of SMRT funding. While the city provides a
significant amount of the local operating match, other villages, towns and counties in the service area have been asked to contribute as well. There is no allocation or mandated amount, and the system’s service design is not based on whether a jurisdiction has provided funding or not. The theory is that if a regional system had to depend on getting a certain amount of funding from each jurisdiction served, it would be unlikely that it would ever be implemented. The willingness of Prairie du Chien to provide the match regardless of the contributions of others has been key to the initiation and continuation of service.
The other aspect of the use of contributions is that the request for funding support is also made to the business
community, medical providers, educational institutions, foundations and other organizations. As a result there are a number of sponsors, who are featured on the system website and other publicity. They include Gunderson Health System, Vernon Memorial Healthcare, Dairyland Power Cooperative, Crossing Rivers Health, Organic Valley Cooperative (dairy), Otto Bremer Foundation, and Ho-Chunk Nation (which provides funding through Vernon County).
Lessons Learned
Combine multiple markets. Include commuters, students, medical trips and shoppers as potential riders. Complement and/or connect with other services. SMRT connects with the local bus in La Crosse, at
park and ride lots, serves the Amtrak stop, and connects with the City of Prairie du Chien shared-ride taxi service for first-mile/last-mile service.
Seek support from business community. Sponsorships help provide local match, and are recognized on the SMRT web site and schedules. Services are identified in business publications.
With a limited marketing budget, work with county aging units and be sure to have an up-to-date website.
Local champions are important. The MRRPC has played a significant role in developing and implementing this regional service, and the City of Prairie du Chien role as lead agency, grant applicant, and guarantor of local share has been critical.

Case Study: Vermont
145
Wisconsin Case Study References
City of Prairie du Chien, Annual Budget 2016. Community Transportation Association of America, Community Transportation, “Scenic Mississippi Regional Transit: A Connected Community Responds to a New Transit Provider”, 2013, at www.web1.ctaa.org/webm.../anmviewer.asp?a=3493&z=60 Fletcher, Peter, Mississippi River Regional Planning Commission, June 8, 2016. Garth Frable, SMRT BUS-Improved Transportation Option for Southwestern Wisconsin, presentation to the 2014 Wisconsin Transportation Conference, September 30,2014. Scenic Mississippi Regional Transit: www.ridesmrt.com/ SMRT website: www.ridesmrt.com/ Vierbicher Associates, Inc., Bus Transit Feasibility Study, prepared for the Crawford County Transportation Coordination Committee, October 12, 2010. Wisconsin Department of Transportation, Transit Section, Wisconsin Get-Around Guide, Winter 2017 edition. http://wisconsindot.gov/Documents/travel/pub-transit/get-around.pdf

Case Study: Vermont
146
This page intentionally left blank.

Lessons Learned—Toolkit
147
Bustang - Direct State Operation of Regional Service in Colorado
The Colorado case study identified the current development of the Bustang commuter bus network
and its planned expansion to more rural areas (under the Bustang Outrider brand name) as an example
of a state department of transportation that conducted a planning process identifying intercity and
regional needs, and subsequently began implementation of services itself. The Bustang service is
designed, branded and marketed as a CDOT service, using buses purchased by the state, although the
actual operation is contracted out. The Bustang Outrider services will use state funded vehicles, but
the operation may be either contracted or provided by local transit providers.
C H A P T E R 5 : L E S S O N S L E A R N E D - T O O L K I T
Introduction
The case studies presented in the previous chapter were selected to provide a wide variety of rural regional
examples, varying in organizational structure, funding source, target markets and service characteristics.
However, a number of common themes emerged. They are presented in this chapter to assist those who are
considering how to address needs for rural regional transit services in other locations. The lessons learned can be
summarized in seven themes:
1. Lesson One: State Policies Can Make a Difference
2. Lesson Two: Different Organizational Approaches Can Work
3. Lesson Three: Local Champions Are Required
4. Lesson Four: The Needs of Multiple Markets Should Be Addressed
5. Lesson Five: An Appropriate Service Design Will Attract More Riders
6. Lesson Six: Connectivity and Information Are Important
7. Lesson Seven: Creative Funding May Be Needed
Lesson One: State Policies Can Make a Difference
The fact that the case studies involved services in a number of states with different approaches to regional
transit suggests that it is possible to develop rural regional services regardless of whether or not a state transit
program has any specific policy or support for regional efforts. A number of projects appeared to benefit from an
environment in which state transit programs specifically addressed the need for regional transportation or
supported the development of regional transit organizations. Supportive state policies included:
Direct state provision of regional services. In these cases the state transit program became the direct
provider of regional services designed to address needs identified as having a statewide significance.
The state program contracts directly for operation on specific routes and schedules, with specified stops
and connectivity. In some cases, these services might also be considered as rural intercity services. The
Colorado case study provides an example of direct state operation.
State programs providing demonstration or incentive funding. In several instances states supported
the development of regional services by providing a separate pool of funding available to local transit

Lessons Learned—Toolkit
148
providers seeking to develop regional services, often as part of a regional organization. The Kansas and
Minnesota case studies provide examples of state funding programs supportive of regional transit.
State legislation allowing local revenues. The New Mexico case study presented an example of state
legislation permitting localities to collect a particular tax (the gross receipts tax) to provide support for
Regional Transit Districts. The districts are then in a position to implement regional services, as
documented in the case study of the North Central Regional Transit District. This District provides
funding to local providers in its region, but also operates rural regional routes that connect the local
systems, and connect to the state operated Rail Runner Express rail passenger service and regional
commuter bus services operated under the New Mexico Park and Ride network.
Section 5311(f). In a number of states the Federal Transit Administration (FTA) Section 5311(f)
program has been used to provide support for services that meet the intercity bus criteria of the program
(making meaningful connections with the national intercity network), and also meet regional needs. In a
number of cases the private intercity carriers have provided the in-kind match allowed under this
program, further reducing the cost of these regional services. Examples from the case studies include
Lake Transit services in California and the Shuttle Zoom rural route in Maine.
Case-by-case support. State transit programs can also offer support for rural regional services on a
case-by-case basis, providing funding for feasibility studies, service operation or vehicle capital as part
of the normal program management—if the state program is designed to fund projects (which may be
regional) rather than simply sub-allocate funding to local operators on a formula basis. For example, a
local operator may be under political constraints to address local needs with a funding allocation, but
would apply for additional funding for a regional project. States can support the development of regional
services using demonstration or other funding not tied to regional organizational structures, as can be
seen in the case of Vermont’s use of CMAQ funding for new services, particularly regional connections.
Kansas DOT Funding for Regional Transit
In Kansas, the state DOT provided a separate
funding category for Regional Transit
Approaches as part of its 2010 T-WORKS
Transit Program, allowing this funding to be
used for a variety of operating, administrative
and capital purposes in support of regional
services. Subsequently the Kansas Regional
Transit Business Implementation Model
allocation of increased state funding provided for
a higher state/federal share for intercity services,
and 100% non-local funding for capital (for the
first year), leading to implementation of new
regional services.
Minnesota Transit for Our Future Initiative
In Minnesota, the Transit for Our Future
Initiative provided a policy structure supporting
the development of regional providers (and
services), and a separate special funding
program providing funding for restructuring
studies. An additional separate funding program
under this initiative provides funding that can
be used for service modifications that include
regional routes.

Lessons Learned—Toolkit
149
Lesson 2: Different Organizational Approaches Can Work
Among the case studies we found no single organizational model that is more appropriate for regional
services. The common thread among the various organizational structures used to develop rural regional services
is the inclusion of regional stakeholders in the development and oversight of the project, whether or not they are
an advisory committee, board members of a transit provider or regional planning organization, members of a
legally-constituted authority, coordination committee members or otherwise constituted. The case studies
identified the organizational structures summarized in Table XX.
The appropriateness for any organizational approach is determined in part by the following factors:
Legal Authority. Groups seeking to develop rural regional services have been helped by having a
legal framework that can be used to create a policy board with the authority needed to apply for grant
funding, and contract and operating services.
Role of Regional Planning Agencies. Regional planning agencies play an important role in
identifying the need for service, planning, and oversight of ongoing regional service.
Need for Regional Input/Oversight. Ongoing input from other organizations served by regional
transit services the regional service can be beneficial. Input could be obtained through a regional
governing board or advisory committee. For some regional services, ongoing communications
between connecting transit operators may suffice.
Who Operates the Service? Regional transit needs could be met by a single local transit operator,
joint operations by multiple operators, or a private transit contractor.
Legal Authority
Aside from the fact that there are a number of organizational models, one factor that stands out is that a
number of states have enacted state legislation that makes the creation of multi-jurisdictional regional services
easier to implement by providing the legal and administrative framework. In some cases this legislation is the
general statute that allows governmental entities to enter into agreements with other governments for a specific
set of purposes, for example the California statutes that govern Joint Powers Agreements. Most states have
similar statutes, sometimes described as inter-local agreements, but some state statutes limit the purposes of joint
agreement entities, and not all include public transportation as an eligible purpose.
Other states have specific legislation that provides a general authority for the creation of regional transit
entities, whether they are authorities or districts. Michigan’s Act 196 is an example, used in the creation of the
Alger County Transit authority. New Mexico’s Regional Transit District Act of 2003 provides both the legal
framework for regional transit entities and the potential for dedicated taxing authority. In Kansas state funding is
tied to the Coordinated Transit Districts created by the T-WORKS legislation.
In all of these states, the groups seeking to develop rural regional services have been helped by having a legal
framework that can be used to create a policy board with the authority needed to apply for grant funding, and
contract and operating services.

Lessons Learned—Toolkit
150
Table 15. Organizational Structures Found in Case Studies
State Case Study Site Type of Organization
California Lake Transit Joint Powers authority between two cities and a county
Colorado
Bustang State Agency
South Central Council of
Governments Regional Council of Governments
Iowa
Dennison to Harlan
Commuter, Western Iowa
Transit
Council of Governments
Kansas
Flint Hills Coordinated
Transit District
Coordinated transit district (under state transit legislation) Flint Hills Area
Transportation Agency
Maine Shuttle-Bus Zoom Inter-local agreement between cities and towns, with joint oversight committee
Michigan Alger County Transit Transit authority under state transit legislation
Minnesota Central Community Transit Joint Powers agreement between cities and counties
Montana
Flathead Transit Department of Tribal Government
North Central Montana
Transit Private non-profit with board composed of tribal, service and educational institutions
New Mexico North Central Regional
Transit District Transit District organized under state enabling legislation
Oregon Northwest Oregon Transit
Alliance
Five separate transit agencies operating under an
intergovernmental agreement.
Vermont
Southeast Vermont
Transit, Inc. and Green
Mountain Community
Network, Inc.
Handshake agreement between two private non-profit agencies
Wisconsin Scenic Mississippi
Regional Transit Regional advisory committee, lead agency (city government) is grant applicant, fiscal agent

Lessons Learned—Toolkit
151
Role of Regional Planning Agencies
The case studies include a number of rural regional services that are provided under the auspices of regional
Councils of Government (COGs). Examples include the Region XII COG in Iowa, which operates the transit
agency in the region, as does Southwest Colorado COG. A full read of the case studies reveals an important role
for regional planning agencies in identifying the need for service, planning, and oversight of ongoing regional
service. For example, the Mississippi River Regional Planning Commission (MRRPC) in southwest Wisconsin
was a key participant in the work of the Crawford County Transportation Coordinating Committee where the
need for regional transit was identified as a priority. MRRPC staff played a key role in the feasibility study that
led to the creation of the Scenic Mississippi Regional Transit system.
Need for Regional Input/Oversight
If the organizational structure does not provide for representation from the different jurisdictions being served
by the regional service (as in the case of a COG or regional planning agency), there is a need to consider
whether or not such input is needed on an ongoing basis, and how to solicit this input. If the governing board is
not regional by definition, a regional advisory committee (perhaps under the auspices of a regional planning
agency) is a strategy used in some case study areas to ensure that the service meets regional needs or at least to
ensure communication. There may be cases where regional services operated by a single entity for the benefit of
its own residents do not require regional oversight; instead, communication between transit operators suffices -
for example the coordinated services jointly operated by GMCN and DVTA/SVTA in southern Vermont or the
Alger Transit route into Marquette.
Who Operates the Service?
Another aspect of rural regional service organization is the question of operation of services. A local transit
operator may be able to expand service to meet a regional need (as in the case of Alger Transit), but several
examples demonstrate that if multiple operators are involved, a service can be jointly operated without forcing
riders to change buses at the county line by running buses through to destinations or connecting points on
alternating schedules. Good examples include a number of regional services in Vermont, which have a combined
schedule with different trips operated by the participating transit agencies, and the North by Northwest
Connector network in Oregon. In other cases, in the absence of existing transit operators with capability, the
regional service is operated under contract by a private transit contractor, as in the case of the Bustang service in
Colorado or the SMRT service in southwest Wisconsin.
Lesson 3: Local Champions Are Required
The process of gathering information for the case studies reinforced the importance of local champions in
creating and maintaining rural regional transit services. Whether this is more or any less true than for local
transit projects is academic - in many cases there were clearly identifiable persons that had taken on this role for
a regional project. It may be that this role is even more critical for regional projects because they are still outside
the norm for rural public transportation; they often involve coordination with more agencies, jurisdictions and
operators; and they are likely to require innovative approaches to a multitude of issues such as funding,
operations.

Lessons Learned—Toolkit
152
What Do We Mean By a Local Champion?
The general meaning of a “local champion” is a person or persons who take on the responsibility for:
realizing the need for a rural regional solution, and helping to define the vision
creating a team that includes representatives of all key stakeholders, helping them identify shared goals
and objectives, and maintaining focus and action
working with that team to develop feasible options, assess them and select solutions
bringing best practices and resources to the project
identifying problems or barriers, finding solutions, and maintaining momentum toward service
implementation
communicating the vision, goal, recommended solutions and resource needs to both the stakeholder
team and the broader community to obtain and then maintain community support
taking and keeping ownership of the project as it is implemented to meet user needs, overcome
problems, and improve or expand the service.
Where Can They Be Found?
In the case studies it was apparent that virtually every project had one or more local champions. They were
found in:
local coordination committees
regional planning agencies
mobility management programs
state transit programs
tribal organizations
economic development organizations
transit systems
In some cases this person is the director of a transit provider, in some cases a planner with a regional planning
agency, and in other cases this person is someone aware of the needs because of their work with human service
or economic development agencies. The key factor is that they went above and beyond their normal duties to
innovate and problem-solve to create rural regional services.
Lesson Four: The Needs of Multiple Markets Should Be Addressed
Many rural transit systems provide regional trips on a demand response basis, and these services are designed
to serve one specific client group or trip purpose—which limits the potential ridership, and makes fixed route,
fixed schedule service infeasible. Many of the case study rural regional routes make schedule service feasible by
trying to address the needs of multiple user groups to increase potential ridership. There are a number of
examples of services that serve multiple markets:
Employment
Medical appointments
Community college or high school
Intercity or commuter bus/train connections

Lessons Learned—Toolkit
153
Shopping/personal business
Social and recreational needs
Planning efforts and information sources than can be used to identify the transit needs of specific target
markets include:
Planning for rural regional services
Coordination planning process
Statewide planning studies
Other sources such as major employer requests, strategic surveys, and transit user requests
Each of these sources and approaches is discussed below, followed by approaches for estimating demand for
specific user groups. Finally, the use of consulting services is also identified as an approach.
Planning for Rural Regional Services
Assessing the feasibility of regional service begins with the identification of needs and potential markets. In
some of the identifying potential markets, their specific requirements, and the likely demand of each is the
planning process. The case studies included several examples of how this process took place.
Coordination Planning Process
In some cases the project began as part of the work of the local coordination committees formed as part of the
SAFETEA-LU transportation authorization planning requirements for Job Access and Reverse Commute
(JARC), New Freedom, and the Elderly and Disabled (Section 5310) program. The purpose of this planning
process was to identify and prioritize strategies to address key transportation needs. In some cases the need for
regional transportation was identified as a local priority. As part of the process, the initial identification of
potential market(s) included development of information about populations involved and characteristics of need.
For example, SMRT service in southwestern Wisconsin grew out of the coordination committee work in the
affected counties.
Statewide Planning Studies
Some projects resulted from statewide transit studies or initiatives that identified a need. For example, the
state program involvement in the Bustang program grew out of a statewide Regional and Intercity Bus Plan that
provided a classification of services and identified regional gaps in the statewide network. In Kansas, the
statewide process that was part of the KDOT Regional Transit Business Model Implementation Plan included a
needs analysis that called for development of regional services. In some cases statewide intercity bus plans
identified routes or gaps that are regional in nature. In Minnesota, the Greater Minnesota Transit Investment
Plan set the stage for the Transit for Our Future rural regional transit program, including regional services. Often
such planning studies help to identify the types of markets needing service, and whether the need is for medical
services, employment trips, or intercity connections.
Other Sources
Some of the case studies identified sources of information that helped to define the market. In Iowa, the
closure of a local meatpacking plant led the Region XII Council of Governments to identify a regional commuter

Lessons Learned—Toolkit
154
service as a way to address the needs of displaced workers. Similarly, a business retention and expansion survey
in Prairie du Chien, Wisconsin was a factor in determining that the regional transit concept had to include
commuters as well as medical and human service trips.
In Alger County, Michigan, the initial impetus for regional service into Marquette came from user requests
for a commuter route, which the transit system was then able to expand with additional services focused on
education and medical trip needs.
Estimating Demand for Individual Markets
Demand for rural regional services can be estimated by looking at data sources that are appropriate for each
market that has been identified, and then summing the likely ridership. Potential methods for individual markets
include:
Employment trips: Potential methods include:
o Census data. The Census Bureau’s Longitudinal Employer-Household Dynamics (LEHD) data
source provides annual employment statistics (LEHD Origin Destination Statistics or LODES)
linking home and work locations all the way to the Census Block level, which can be accessed
through the Census Bureau’s OnTheMap interface. If there is no existing regional transit, this
information will not reflect any transit mode share, but a reasonable, conservative potential
transit mode share can be applied to develop a range of estimated work trips for a regional
service.
o Employer-provided data. Commuter trips focused on a particular employer might be estimated
by obtaining data from that employer on the zip code of residence of existing employees, and
applying a conservative transit mode share estimate. Another potential option is to work through
the human resources offices at particular employers to identify needs or demand.
o Survey data. Surveys aimed at general public commuters can be used, including surveys left on
vehicles, at park and ride lots, well-publicized open online surveys through planning agency
websites, or surveys distributed to employees at particular employers thought to have potential
for regional transit commuter services.
Medical trips. For human service or medical trips, information on specific groups may be obtained
from agencies that fund or contract for these services, such as appropriate agencies that fund Medicaid
NEMT transportation, or the Veterans Transportation Service mobility manager at the regional
Veteran’s Administration medical centers.
Educational trips. Community colleges, colleges and universities can provide data on the residence of
commuting studies, providing numbers of students by zip code of residence. For schools with a resident
population, data on numbers of students by home residence location can be used with an estimate of trip
frequency (every weekend, only at holidays) to estimate ridership. In some cases, potential ridership
from an educational institution includes students, staff and faculty.
Intercity trips. Demand for trips making intercity connections can be estimated using the TCRP Report
147 Rural Intercity Bus Demand Model.
Other trips. There may be trip purposes that are related to local market conditions that would add
ridership to a local route. Examples include trips for retail purposes if a local retail is no longer
available, or trips to recreational destinations such as parks, cycling routes or ski areas. Some case study
providers (Northwest Connector, Flathead Transit) make visitors one of their key ridership groups.

Lessons Learned—Toolkit
155
Consulting Assistance
A number of the case study projects used consultant assistance to assess the feasibility of regional services and
to help design or refine services. For example, early in the process of developing SMRT service, the City of
Prairie du Chien contracted with a consulting firm to conduct a feasibility study. In Minnesota, the state transit
program provides funding for consulting assistance in identifying regional trip demand and developing regional
providers as part of the Transit for Our Future Initiative. The Northwest Connector has used consulting
assistance as part of its planning process. Often state transit programs can provide funding for studies, providing
resources to consider all potential markets, and help design and cost services to determine the most feasible
options.
Lesson Five: An Appropriate Service Design Will Attract More Riders
Designing services that can attract riders with this wide variety of trip purposes is a difficult task, because
each market has its own specific requirements in terms of route coverage, schedule, frequency, and span of
service. Themes identified through case studies for service planning for effective regional services included:
Schedule service to meet the needs of multiple markets
Minimize transfers with through-routing
Provide vehicle amenities
Schedule Service to Meet the Needs of Multiple Markets
Regional service should be scheduled to meet the needs of multiple user groups to make most effective use of
limited resources and attract ridership from multiple markets. The following transit needs are good candidates
upon which to build a schedule for regional service:
Employment trips require morning and evening peak hour service—all weekdays at a minimum.
Medical appointments may require early morning trips, and multiple mid-day return trips—with even
more specific schedule needs for dialysis.
Trips to/from educational institutions can require morning peak service, with afternoon and evening
return trips.
Connections to intercity bus or rail services can require very particular schedules at any hour of the
day, to provide connections within a limited window of time around the intercity schedule, and yet
allowing for late services. The busiest intercity trip times are typically afternoons and evenings on
Fridays and Sundays.
In addition to being important for effective service design (and passenger convenience), meaningful
connections are a federal requirement for Section 5311(f) funding. Greyhound (the source of most in-
kind match used for the local/state share of Section 5311(f) rural intercity and regional services)
provides in-kind match only for services that make a connection with their schedules at a common
terminal within a two-hour window on either side of the Greyhound schedule.

Lessons Learned—Toolkit
156
Providing services that meet the requirements of these varied markets, yet are financially feasible, is a key
aspect of creating a viable rural regional transit service. Otherwise the likely ridership of one or two groups may
not be enough to make the service feasible. The case studies from Mississippi, California, New Mexico, Iowa,
and Michigan provide examples of effective scheduling to meet the needs of specific user groups.
Scenic Mississippi Regional Transit Multiple Markets
SMRT services are designed to provide three
daily round-trips on each route: a morning
commute time run, a mid-day trip, and a late
afternoon/evening return trip, with routings
designed to be inbound to the main regional
employment center (La Crosse) over several
different routings serving different rural
towns. Stops are located at major employers,
medical facilities, educational campuses,
major shopping destinations, Amtrak stops
and intercity bus stops. Shared stop locations
with local transit facilitate connections.
Lake Transit Educational, Intercity and Medical Trips on the Same Route
Lake Transit’s Route 7 operates four times per day
between Lakeport and Ukiah. In Ukiah there are
connections to Greyhound (at the airport), Amtrak and
Mendocino Transit Authority. Other stops include
Mendocino College and the Veterans Clinic in Ukiah.
Schedules are designed to make the intercity connections
and college schedules. Other regional and intercity routes
include more frequency to better serve employment trips,
and provide connections to routes serving a casino and a
major regional hospital. These services do not need to be
scheduled around intercity schedules to make
connections.
South Central Council of Governments Transit Medical Trips
South Central Council of Governments Transit in Colorado operates a long regional route from Trinidad to
Pueblo. Services operate three days per week, and schedules are designed to provide an arrival around 10:30
a.m. and a return leaving Pueblo around 3:30 p.m., with drop-off and pick-up at key medical facilities.
Though the primary market is medical trips, the service is open to the general public, and there are passengers
who travel for other trip purposes.
Altran Schedules to Serve Commuters, Students, Medical
Appointments and Dialysis Trips
Altran’s Munising to Marquette Connection makes
three round-trips per day with inbound trips at 6:15
a.m., 11:15 a.m. and 3:15 p.m.; and outbound trips
at 8:00 a.m., 1:00 p.m. and 5:00 p.m. This allows
workers and students to arrive early at Marquette
destinations, and dialysis patients to return home at
1:00 p.m. after treatment.
Iowa Region XII COG Work Trips Service
This regional service is designed to serve work
trips to a particular employer, with schedules
serving shifts with services leaving Denison at
5:00 a.m., 6:45 a.m. and 2:30 p.m., and return trips
at 3:45 p.m. and 12:45 a.m. Although the service is
open to the general public, serving these work trips
requires service at shift changes, including the
early morning trip home after the late shift.

Lessons Learned—Toolkit
157
Minimize Transfers with Through-Routing
Another aspect of service design found in several of the case study services is a focus on minimizing
transfers, limiting them to the connections with intercity or local services in the destination city. Examples are
provided from the Vermont and Oregon case studies.
Provide Vehicle Amenities
A number of the case studies mentioned that vehicles used were specified to include amenities such as on-
board Wi-Fi with electrical plug-ins, more comfortable seating, and bike racks—in addition to meeting ADA
requirements for wheelchair access and positions. User surveys reveal that because regional services require a
longer ride, passengers appreciate being able to access the internet, whether for work or pleasure, making use of
their travel time. The benefit to users of comfortable seating for a trip of longer duration is obvious. Bike racks
on the front of the bus offer the possibility of making first-mile, last-mile connections on their own bikes.
Although many rural regional services have multiple stops in origin and destination locations, not all riders can
be served, and the bicycle option is one way they can access more distant destinations without waiting for a local
transit connection.
Another aspect of vehicle selection is the need to consider space for baggage. If the project will be utilizing
Section 5311(f) rural intercity funding, it needs to offer passengers the capability of carrying baggage for
overnight trips. While large over-the-road coaches typically offer baggage space under the package deck, the
smaller body-on-chassis vehicles used for rural regional connections are most likely to require a rear door with
baggage space in the rear of the bus, or internal baggage racks like those found on rental-car shuttles. Some
vehicles of this type can be specified with an under-floor luggage locker, but the space is limited. Both the
under-floor locker and the baggage space at the rear will require the driver to provide access and load/unload
baggage. At least one of the case studies found that bus package express (freight) is another potential source of
revenue. In Montana, the Flathead Transit buses tow a 12-foot trailer to carry express freight from their intercity
connection—meeting additional local needs and providing additional revenue.
Northwest Connector Through Service
The Northwest Connector’s Tillamook to Lincoln
City service presents a regional service designed to
minimize transfers. Formerly, making this
connection required a transfer between a Tillamook
County Transit District (TCTD) bus and a Lincoln
County Transit (LCT) bus at Otis, on the county
line. Now, the TCTD bus runs all the way through
to Lincoln, and LCT shares in the cost. Elimination
of the transfer allows passengers to reach a casino
in Lincoln County for both work and recreation.
Following the change, ridership on this route
doubled, and has continued to increase.
Vermont Joint Schedules
Several of the Vermont regional connections
have avoided transfers by having transit
providers share operation of the route, with
each providing trips over the full length of the
route. On the Route 2 Commuter between
Montpelier and St. Johnsbury some trips are
operated by Rural Community Transit (RCT)
and some by Green Mountain Transit
Authority (GMTA). Shared service between
Wilmington and Bennington includes one
daily trip operated by Green Mountain
Community Network (GMCN) and two by
Deerfield Valley Transit Association (DVTA).

Lessons Learned—Toolkit
158
Lesson Six: Connectivity and Information Are Important
Many of the case study operations have designed services and schedules to provide for a high level of
connectivity between the regional service, other local transit services, available Amtrak service, and Greyhound
or other intercity bus services. If the regional service is funded in part with Section 5311(f) rural intercity
funding, connectivity with Greyhound is required if the project uses the value of in-kind miles from Greyhound
for match. Connectivity and information lessons learned can be grouped into the following categories:
Spatial connections: shared stops, park and ride lots, and first-mile/last-mile deviations
Interline ticketing: single ticket to ride local transit connecting with intercity service
Marketing and service information: cross-marketing of connecting services, Google Transit maps
Spatial Connections: Shared Stops, Park and Ride Lots, and First-Mile/Last-
Mile Deviations
Depending on the service design, a rural regional service will likely originate in a small town, and terminate in
a larger activity center that offers more regional destinations. At the origin end the riders may need to be picked
up at their homes or at key stops such as a senior center. Opportunities for passengers to park their own vehicles
and ride the regional service should be provided, whether by using official state park and ride lots, arranging for
the use of parking at public facilities (a downtown lot, a senior center), or at private facilities (a church parking
lot, or excess parking at a retail or business location. At stop locations on the route, connectivity is facilitated by
identifying and serving park and ride locations. In destination cities passengers may need multiple stops at
various locations, but mobility can be enhanced if the regional service shares stops with local public transit.
Connections with more local routes can be made if the rural regional service uses the same main transfer point as
local transit. If there are multiple regional routes, scheduling and shared stops can increase access and ridership
by connecting more destinations. The Mississippi and California case studies provide examples.
Interline Ticketing
Some regional services are designed to make connections with intercity services, bus or rail. If Section
5311(f) funding is used, the regional service should make a meaningful connection with the national intercity
Scenic Mississippi Regional Transit Connectivity at Stop Locations
In the City of La Crosse, Scenic Mississippi
Regional Transit (SMRT) shares stops with the
local urban transit system, (Municipal Transit
Utility (MTU) at locations that are served by both.
In addition, SMRT will serve the Amtrak station
in La Crosse on request. The Jefferson Lines
intercity service is located in MTU’s La Crosse
Downtown Transit Center which is two blocks
from the SMRT stop in downtown La Crosse.
Lake Transit Interlined Regional Routes with Local Transit Connections
Lake Transit’s Route 7 connects with Mendocino
Transit Authority and Amtrak Thruway buses at the
Pear Tree Center in Ukiah, and with Greyhound at the
Ukiah Airport. At the other end of the route, it is
interlined with Lake Transit Route 4 to Clearlake. In
Clearlake there is a scheduled connection with Lake
Transit Route 3 which provides a connection to Napa
County and the VINE Route 10 Calistoga Shuttle or
the St. Helena Shuttle.

Lessons Learned—Toolkit
159
bus network, meaning that it serves the intercity bus stop and is scheduled to provide a convenient connection. A
higher level of connectivity with intercity services is provided if the regional service offers interline ticketing
with the intercity service.
Greyhound provides the value of its connecting unsubsidized service, which can be used as match under the
Section 5311(f) program, but it requires that the regional feeder service serve the same stop as the unsubsidized
service, be scheduled within a two-hour window around the intercity service, and offer interline ticketing.
Through interline ticketing agreements, the rural regional provider can receive a proportionate share of the
ticket revenue for intercity trips that originate or terminate on its service. The rural regional schedules appear in
the Greyhound national website and Greyhound can sell tickets that include the rural regional service, providing
for increased ridership (and revenue) from inbound passengers who would otherwise not be aware of the service.
The Maine and Montana case studies provide examples of interline ticketing arrangements.
Rural regional providers should be aware that interlining with intercity bus carriers triggers some
administrative requirements including registration as an interstate carrier with the Federal Motor Carrier
Administration (FMCSA1).
Another opportunity for rural regional providers able to connect with Amtrak rail passenger service is
joining with Amtrak as an Amtrak Thruway bus feeder connector. Under a thruway agreement, the provider’s
connecting schedules are included in Amtrak timetables, and Amtrak can sell tickets that include the regional
carrier’s services—however, there must be a rail component to the combined trip. None of the case study sites
are currently listed as Amtrak Thruway carriers, though a number offer pick-up and drop-off at Amtrak stations.
1 More details on these requirements can be found in Federal Motor Carrier Safety Administration Regulations and Interlining Transportation for Rural Transit Providers, National Rural Transit Assistance Program (National RTAP) Technical Brief, 11/20/2008, available at: demopro.nationalrtap.org/emailResource.aspx?design=1&fileid=177 and Van and Bus Service Across State Lines, National Resource Center for Human Service Transportation Coordination, Community Transportation Association of America (CTAA), 6/1/2010, available at: http://web1.ctaa.org/webmodules/webarticles/articlefiles/FMCSA_MythsAndRealities_20100713.pdf
Flathead Transit Greyhound Interline
Connection
The Flathead Transit connection
between Missoula and Whitefish,
Montana offers interline ticketing
with Greyhound lines. Inbound
passengers can get schedule
information and tickets from
Greyhound.
Shuttlebus-Zoom Portland Intercity Service/Greyhound Interline Ticketing
A customer in Boston (or anywhere on the Greyhound
network) traveling to Biddeford, Maine, can obtain schedule
information and purchase their ticket for the entire trip
(including the Shuttlebus-Zoom portion) on the Greyhound
website. In Portland, Maine, the passenger transfers from the
Greyhound bus to the ShuttleBus-Zoom vehicle at the
Greyhound station, which is served by both carriers. The
transfer wait time is between ten and fifty minutes, depending
on the trip.
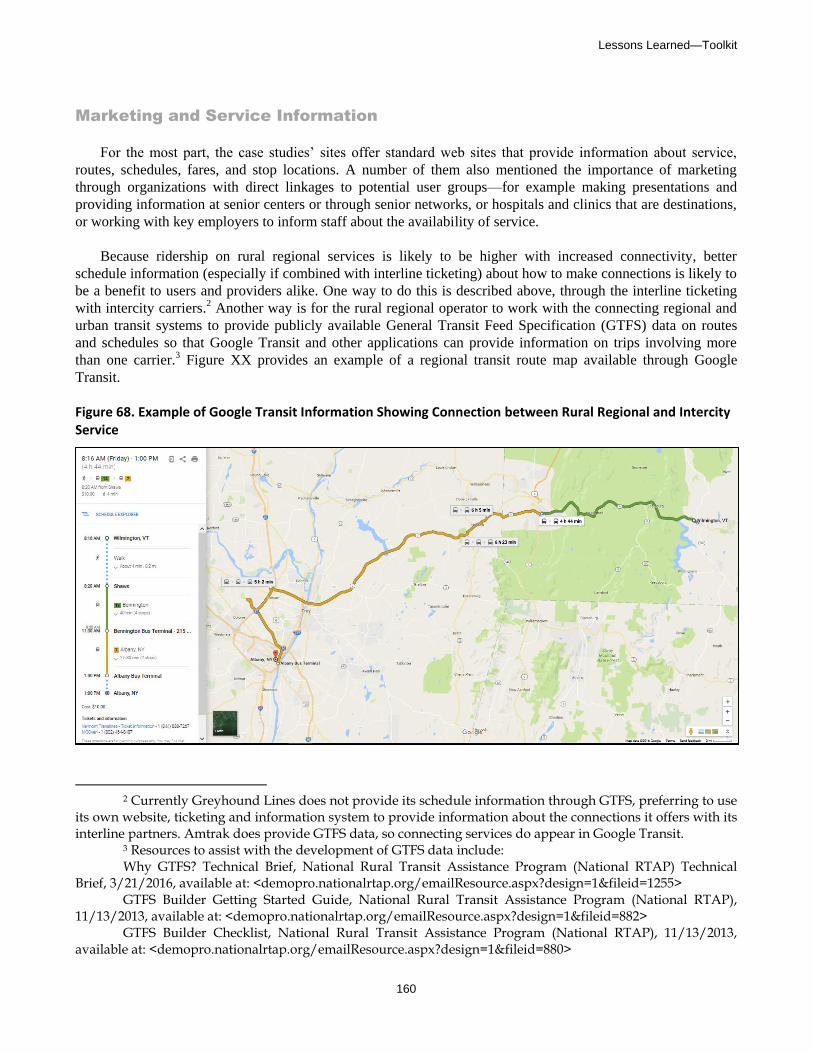
Lessons Learned—Toolkit
160
Marketing and Service Information
For the most part, the case studies’ sites offer standard web sites that provide information about service,
routes, schedules, fares, and stop locations. A number of them also mentioned the importance of marketing
through organizations with direct linkages to potential user groups—for example making presentations and
providing information at senior centers or through senior networks, or hospitals and clinics that are destinations,
or working with key employers to inform staff about the availability of service.
Because ridership on rural regional services is likely to be higher with increased connectivity, better
schedule information (especially if combined with interline ticketing) about how to make connections is likely to
be a benefit to users and providers alike. One way to do this is described above, through the interline ticketing
with intercity carriers.2 Another way is for the rural regional operator to work with the connecting regional and
urban transit systems to provide publicly available General Transit Feed Specification (GTFS) data on routes
and schedules so that Google Transit and other applications can provide information on trips involving more
than one carrier.3 Figure XX provides an example of a regional transit route map available through Google
Transit.
Figure 68. Example of Google Transit Information Showing Connection between Rural Regional and Intercity Service
2 Currently Greyhound Lines does not provide its schedule information through GTFS, preferring to use
its own website, ticketing and information system to provide information about the connections it offers with its interline partners. Amtrak does provide GTFS data, so connecting services do appear in Google Transit.
3 Resources to assist with the development of GTFS data include: Why GTFS? Technical Brief, National Rural Transit Assistance Program (National RTAP) Technical
Brief, 3/21/2016, available at: <demopro.nationalrtap.org/emailResource.aspx?design=1&fileid=1255> GTFS Builder Getting Started Guide, National Rural Transit Assistance Program (National RTAP),
11/13/2013, available at: <demopro.nationalrtap.org/emailResource.aspx?design=1&fileid=882> GTFS Builder Checklist, National Rural Transit Assistance Program (National RTAP), 11/13/2013,
available at: <demopro.nationalrtap.org/emailResource.aspx?design=1&fileid=880>

Lessons Learned—Toolkit
161
The Vermont and Oregon case studies provide examples of marketing and service information indicative of
regional connectivity.
Lesson Seven: Creative Funding May Be Needed
One of the most significant things demonstrated by the rural regional case studies is that such services are
likely to require a creative approach to funding. To some extent the case studies were selected to demonstrate a
wide variety of funding, but the variety of sources and combinations is particularly noteworthy.
Regional services often require a special approach because there is no federal source that is designated or
set-aside for services with a particular “regional” classification—though there is nothing that prevents funds
allocated to a particular jurisdiction from being used for regional services. Those proposing a regional service
often encounter a major barrier in that local policy-makers providing match may insist that the match not be
used to transport residents outside their jurisdiction, fearing that there will be a loss of economic activity or that
local tax dollars (and associated state/federal funds) will benefit someone in another jurisdiction.
The following sources and approaches to funding regional services are discussed:
Section 5311 – Formula Grants for Rural Areas
Section 5311(f) – FTA Rural Intercity Bus Program
Section 5311(f) In-kind Match
Congestion Mitigation and Air Quality (CMAQ)
State Funding/Special Programs Supporting Regional Organizations or Regional Service
Special Funding Sources
Medicaid NEMT
Partnerships – Sponsorships from Local Businesses
Combining Sources
Section 5311 – Formula Grants for Rural Areas
Not surprisingly many of the case study sites rely on Federal Transit Administration Section 5311 funding for
capital and/or operating funding (including job access and reverse commute projects). This program provides
Oregon Department of Transportation Support for GTFS Data
As part of its goal of providing a statewide network of connected
services, ODOT has contracted for a firm to work with transit and
intercity providers statewide to develop and update GTFS data and
make it publicly available to developers for use in information
systems such as Google Transit. Three of the five local systems
participating in the Northwest Connector have their GTFS data
included in the statewide program. The Northwest Oregon Transit
Alliance is current conducting a website development project that
includes trip planning functionality to present Northwest Connector
routes as prioritized routes in Google Transit.
Go!Vermont Bus Information
The Vermont Agency of
Transportation provides statewide
information on bus services, car- and
van-pooling, car share services,
bicycles, ferries and trains. This
includes a direct link to Google
Transit, where Vermont’s local,
regional and intercity bus and rail
service information is provided to
facilitate multi-modal trip planning.

Lessons Learned—Toolkit
162
funding for capital, planning and operating assistance to support public transportation in non-urbanized areas
(less than 50,000 population).4
Funding is provided to the state departments of transportation on a formula basis based on land area,
population, revenue vehicle miles and rural low-income population. Federally recognized Indian Tribes are also
eligible recipients. Eligible subrecipients include state or local public bodies, non-profit organizations, and
operators of public transportation or intercity bus service (including private for-profit operators of rural intercity
bus service).
There are limits on the federal share for different types of projects. The maximum federal share for capital
projects (such as vehicle purchases) is 80 percent, with the remainder from local funds (provided by the state,
locality or carrier). The 80 percent maximum federal share also applies to the net operating cost of paratransit
(demand responsive) services required by the Americans with Disabilities Act. On other operating projects the
maximum federal share is 50 percent of the net operating deficit (costs less fare and other revenue). States are
given a great deal of discretion in the distribution and allocation of Section 5311 funds, with a major
requirement being that it is fair and equitable.
There is no federal requirement that Section 5311 funds be used within a particular jurisdiction’s boundaries.
Section 5311 funded services can operate from non-urbanized rural areas into and out of urbanized areas (over
50,000 population) as long as the primary purpose is to provide access to rural residents.
There is no requirement or set-aside in the overall Section 5311 program that favors regional services, but one
could view the requirement that each state spend no less than 15 percent of the annual apportionment on rural
intercity bus services (the Section 5311(f) program) as potential support for non-local rural transit.
Section 5311(f) – FTA Rural Intercity Bus Program
One element of the overall Section 5311 program is the Intercity Bus Program.5 A state is required to spend at
least 15 percent of its overall Section 5311 apportionment on intercity bus projects, unless the Governor of the
state certifies to the Secretary of Transportation that the intercity bus needs of the state are met. In order to make
this certification, the state must conduct and document a consultation process that assesses the needs, with input
from the intercity service providers and other stakeholders and analysis of current services and needs. In a
number of states this consultation process has helped to identify the need for rural regional services as well.
The definition of intercity service in the Section 5311 circular describes it as regularly scheduled bus service
open to the general public, operating with limited stops on fixed routes connecting two or more urban areas not
in close proximity, with the capacity to transport passenger baggage, and making meaningful connections to the
national network of intercity bus service. It specifically excludes commuter service, and the FTA guidance has
language that excludes service providing extensive circulation within a region as opposed to regular but
infrequent service to limited points in the destination community. Another provision allows for the provision of
“feeder service,” which does not need to have the same characteristics as intercity bus service, and may provide
4 U.S. Department of Transportation, Federal Transit Administration, Formula Grants for Rural Areas:
Program Guidance and Application Instructions, Circular C 9040.1G, 10/24/14. 5 U.S. Department of Transportation, Federal Transit Administration, Formula Grants for Rural Areas:
Program Guidance and Application Instructions, Circular C 9040.1G, Chapter VIII, Intercity Bus, 10/24/14.

Lessons Learned—Toolkit
163
access to intercity connections to rail or air services. The need to prioritize a meaningful connection with the
national intercity bus network is apparent for both rural intercity and feeder services under the FTA guidance.
The requirement for a meaningful connection never specifies what constitutes a meaningful connection, but
language describing eligible services implies that it includes the use of common stop locations and facilities, and
scheduling that facilitates connections to national intercity services.
Section 5311(f) In-kind Match
One of the unique features of the FTA Section 5311(f) program is the ability to use the value of connecting
unsubsidized intercity bus services as in-kind match for the intercity segment requiring assistance, and this
approach is seen in at least two of the case study sites. The project is redefined (as compared to conventional
Section 5311 funding) as a combination of a route segment that requires subsidy and a connecting unsubsidized
service into a single project. The connecting unsubsidized service is valued in terms of the operating cost per
mile for the connecting schedules, and this value is counted as match for the federal funds needed to subsidize
operations of the other segment that has an operating deficit. The approach is described in detail in the FTA
Circular.6
By careful definition of the connecting unsubsidized segment, it is often possible to obtain enough Section
5311(f) funding to cover the entire operating deficit of the subsidized segment. One condition of this funding
approach is that the carrier operating the subsidized service must obtain an agreement from the carrier operating
the subsidized segment designating the connecting services and providing a valuation to be used as match.
While there are several private intercity bus companies that are willing to provide the value of in-kind match
for connecting services requiring subsidy, in most cases Greyhound Lines is the operator with unsubsidized
service. Greyhound has several requirements for operators seeking to obtain in-kind miles, most of which are
designed to facilitate connections between the services and generate feed traffic for the national network.
Greyhound requests that the connections be in their terminal or stops (this may require a bus terminal agreement
with Greyhound), that the services be scheduled within a two-hour window of the connecting Greyhound
schedule(s), that the service operates daily at least five days per week, and that the operator of the subsidized
service agrees to interline ticketing.
Obviously the ability to use the in-kind match depends a great deal on being able to develop routes and
schedules that meet regional needs and also provide connectivity to intercity bus services, which may not be
possible in all cases.
66 U.S. Department of Transportation, Federal Transit Administration, Formula Grants for Rural Areas:
Program Guidance and Application Instructions, Circular C 9040.1G, 10/24/14. Chapter VIII, Intercity Bus, Section 5.p VIII-4.
Lake Transit Use of Section 5311(f) Funding
In California Lake Transit uses Section 5311(f) funding to support operating expenses on services that make
meaningful connections, and for vehicle capital. In the hierarchy of Lake Transit services, Routes 3, 4, and 7
are classified as intercity routes, and are funded with FTA Section 5311(f) funding, matched with local and
state funding. Under California’s Section 5311(f) program, additional new services could use toll credits as
local match.

Lessons Learned—Toolkit
164
Congestion Mitigation and Air Quality
Another federal funding program used in a case study site is the Congestions Mitigation and Air Quality
Program (CMAQ) program. Originally authorized in 1991 and administered by the Federal Highway
Administration, the program was designed to support surface transportation projects that contribute to air quality
improvements and/or provide for reduced traffic congestion. The funding is provided to areas in nonattainment
status with regard to ozone, carbon monoxide and/or particulates. Even states that have no nonattainment or
maintenance areas receive a minimum apportionment.
Under the CMAQ program all operating costs of new transportation services can be funded, with the non-
federal share requirements appropriate to the FTA program. Recent changes in the program allow a new start to
utilize CMAQ for operations for up to five years rather than the three year limitation previously in place. The
third year of funding can now be spread over years four and five to taper to a source of ongoing support.7
7 U.S. Department of Transportation, Federal Highway Administration, Office of Planning, Environment
& Realty, Air Quality-Congestion Mitigation and Air Quality Improvement (CMAQ) Program, Revised Interim Guidance on CMAQ Operating Assistance under MAP-21, July 2014, found at: http://www.fhwa.dot.gov/environment/air_quality/cmaq/policy_and_guidance/cmaq13ig.cfm
ShuttleBus-Zoom Portland Intercity Route Use of In-Kind
Match
In Maine, the Portland Intercity Service operated
by ShuttleBus-Zoom is funded with Section
5311(f) operating assistance through the Maine
Department of Transportation, with the local
match provided with the value of unsubsidized
Greyhound service. The ShuttleBus-Zoom route
connects with Greyhound in Portland. No local
cash match is required for this service as a result
of using the in-kind match. The six local trips are
timed to serve Greyhound to permit passengers
to transfer to and from the four daily schedules.
Flathead Transit Use of In-Kind Match
The Flathead Transit service operated by the
Confederated Salish and Kootenai Tribes (CKST)
operates between Missoula and Whitefish, Montana
on a daily (seven days per week) round-trip
schedule. In Missoula, the Flathead Transit service
stops at the Missoula Bus Station, which is the
Greyhound stop. Greyhound contributes the value of
the miles it operates on its connecting schedules
from Missoula to Moses Lake, Washington. The
11:30a.m. arrival of Flathead Transit in Missoula
picks up inbound passengers from the 11:15 a.m.
Greyhound arrival.
Vermont Agency of Transportation Use of Flexible Funding
The Vermont Agency of Transportation (VTrans) uses Congestion Mitigation and Air Quality (CMAQ)
funding to support transit operations for new, primarily regional routes. Vermont is an attainment area under
the CMAQ program, providing the state with greater flexibility in using CMAQ funds for transit. The CMAQ
operating funds are used to support new starts, which then have three years to achieve performance goals
required to obtain continued support in the baseline transit program. In addition VTrans flexes Surface
Transportation Program funding into the transit program for capital, administrative and maintenance expenses.
The flexed funding has been a significant factor supporting the statewide development of regional services.

Lessons Learned—Toolkit
165
State Funding/Special Programs Supporting Regional Organizations or
Regional Service
Several of the case study sites made use of state funding, but there were also specific examples of state
programs that provided funding on a competitive basis for projects that had a regional focus. These programs
were described earlier in the chapter. Such programs may include funding for feasibility studies, planning and or
technical assistance in support of developing regional entities and services; or capital for vehicles to provide
regional service; or funding for technology or marketing. In many cases the states already provide funding that
can be used for such purposes, but the state has not set aside any particular amount to support the goal of
regional service. In the case of Wisconsin, it supported the SMRT service by funding a feasibility study, and
later capital for vehicles and ongoing operating assistance—though there is no particular program supporting
regional service. Other state programs with a particular regional focus include the Kansas DOT funding
available under T-Works used by the Flint Hills Area Transportation Association for regional services, and the
Minnesota Transit for Our Future Initiative which has funded studies and technical assistance supporting the
development of regional systems such as Central Community Transit and feasibility studies addressing the need
for and feasibility of regional routes.
Special Funding Sources
At least two of the case study sites initiated service using funding sources quite different from those usually
used for transit—funding from the U.S. Department of Energy and funding from Community Economic
Development Block Grant from the U.S. Department of Housing and Urban Development.
Northwest Oregon Connector Alliance Use of Energy Funding
This consortium of five rural systems began the
development of the regional system under a grant from the
U.S. Department of Energy’s Energy Efficiency and
Conservation Block Grant Program (EECBG) under the
General Innovation Fund category. This provided funding
for the development of an Intergovernmental Grant
Agreement, a consultant to help assist in analysis of needs,
service planning, implementation of the regional concept,
and development of a centralized website for public
information and project coordination including
development of a visitor pass program. The funding also
was used for project management expenses, development
of a brand, and marketing. The $3.5 million EECBG grant
was supplemented by Oregon DOT funding from the
Section 5311(f) rural intercity program for new routes and
Mobility Management, and Statewide Transportation
Improvement Program funding for improved stops, access
and shelters; and Section 5304 planning funds. The
EECBG funding may represent a unique opportunity in
that it was part of the 2009 American Recovery and
Reinvestment Act, and so is not an ongoing funding
source.
Region XII Council of Governments Use of
Community Development Block Grant Funding
This funding source is a block grant
provided to the state by the Department of
Housing and Urban Development, and
administered by the Iowa Economic
Development Authority (IEDA). Crawford
County, Iowa was awarded a CareerLink
transportation grant by the IEDA to fund a
portion of operating expenses for rural
regional services linking Dennison, Iowa
to Harlan, Iowa, providing service to the
Monogram Foods plant. The IEDA grant is
paying 50% of the cost of service,
Monogram Foods 37.5%, and fares are
expected to cover 12.5%. There are
eligibility requirements for this grant
funding including income guidelines and
residence in “non-entitlement” cities with
populations under 50,000.

Lessons Learned—Toolkit
166
These sources may not be available for other projects, but their use demonstrates that rural regional services
may benefit from or require funding innovation, at least for part of the funding mix.
Medicaid NEMT
At least one of the case studies, the South Central Council of Governments in Colorado, operates a regional
service that is open to the general public but is using Medicaid Non-Emergency Medical Transportation
(NEMT) funding for a substantial amount of support. In part this is possible because the NEMT program in that
location has a payment schedule for services for multiple riders on a multi-passenger vehicle that pays for client
transportation on a multi-passenger vehicle by paying the full rate for the first member riding the longest
distance, the member traveling the second furthest is reimbursed at half the rate, and additional members are
reimbursed at one-quarter of the full rate/longest distance rider. The NEMT program benefits from having
clients share the ride, and the transit provider has a major contribution to the expenses of the regional route.
Long-distance medical transportation needs are likely to be a major element of the need for rural regional
services, whether or not funded by Medicaid. If Medicaid client trips are likely to be a significant part of the
ridership, those designing the service should make an effort to work with the Medicaid program or broker to
include them in the service design and funding mix. It is likely, however, that in many cases the Medicaid
program will only pay the fares of clients who are using a general public service.
Partnerships – Sponsorships from Local Businesses
One part of the funding mix that can be considered is working with local business and community institutions
to obtain funding support as well as political support. It is unlikely that such sponsorships will generate enough
funding to cover the entire local operating cost, or even the entire local share, but they have been used by at least
one of the case study sites.
Combining Sources
One last finding is that virtually all of the case studies involve a combination of funding sources, whether it be
Section 5311 federal rural transit funding, Section 5311(f) rural intercity funding, private carrier in-kind match,
CMAQ/STP flexible funding, economic development funding, energy funding, business and community
sponsorships, local match, or dedicated tax revenue plus state/federal funding. In many cases the role of the state
transit program is critical in making the federal funding available, assisting in finding other sources, or in
providing state funds (or local taxing authority) in such a way that regional services can be implemented.
Scenic Mississippi Regional Transit Local Sponsorships
The Scenic Mississippi Regional Transit service in southwestern Wisconsin has obtained support from a
number of local businesses and institutions, including the Organic Valley dairy company, Dairyland Power
Cooperative, Gundersen Health System, Vernon Memorial Healthcare, Crossing Rivers Health, and, the Otto
Bremer Foundation. In addition, the Ho-Chunk Nation tribal government provides funding through Vernon
County. All of this sponsorship funding is combined with Section 5311 funding from the Wisconsin
Department of Transportation and match from local governments to support the service. The system requests
funding from each jurisdiction served but local contributions are not required from each in order to obtain
service.

Lessons Learned—Toolkit
167
Summary of Lessons Learned
To recap, here are the key takeaways from the lessons learned in this research:
Lesson One: State Policies Can Make a Difference
Effective approaches include:
o Direct state provision of regional services
o State programs providing demonstration or incentive funding
o State legislation allowing local revenues
o Section 5311(f)
o Case-by-case support
Lesson Two: Different organizational approaches can work
Factors that determine appropriate approaches include:
o Legal authority
o Role of regional planning agencies
o Need for regional input/oversight
o Who operates the service
Lesson Three: Local champions are required
They have an important multifaceted role and can be found in various organizations.
Lesson Four: The needs of multiple markets should be addressed
o Sources of data can include
Planning for rural regional services
Coordination planning process
Statewide planning studies
Other sources such as major employer requests, strategic surveys, and transit user
requests
o Consider the demand for individual markets
Employment trips
Medical trips
Education trips
Intercity trips
Other trips (e.g., retail, recreational)
o Consider if consulting assistance may be appropriate
Lesson Five: An appropriate service design will attract more riders
o Schedule service to meet the needs of multiple markets. Core markets should include:
Employment trips
Medical trips
Education trips
Intercity trips
o Minimize transfers with through-routing
o Provide vehicle amenities (e.g., bike racks, baggage, Wi-Fi)
Lesson Six: Connectivity and information are important
This can be achieved through:

Lessons Learned—Toolkit
168
o Spatial connections: shared stops, park and ride lots, and first-mile/last-mile deviations
o Interline ticketing: single ticket to ride local transit connecting with intercity service
o Marketing and service information: cross-marketing of connecting services, Google Transit
maps
Lesson Seven: Creative funding may be needed
Potential funding sources and approaches include:
o Section 5311 – Formula grants for rural areas
o Section 5311(f) – FTA Rural Intercity Bus Program
o Section 5311(f) In-kind match
o Congestion Mitigation and Air Quality (CMAQ)
o State funding/special programs supporting regional organizations or regional service
o Special funding sources
o Medicaid NEMT
o Partnerships – sponsorships from local businesses
o Combining sources

Developing a Rural Regional Route: Checklist
169
C H A P T E R 6 : D E V E L O P I N G A R U R A L R E G I O N A L R O U T E : C H E C K L I S T
The checklist is organized in the following major steps:
Step 1: Identify Needs
Step 2: Establish Planning Leadership
Step 3: Goals/Vision—Public and Stakeholder Input
Step 4: Identify Resources
Step 5: Develop Alternatives
Step 6: Assess Feasibility
Step 7: Prioritize—Recommended Plan
Step 8: Detailed Service Plan
Step 9: Detailed Organizational Plan
Step 10: Implementation Plan/Action Items
Step 11: Initiate Service
Step 12: Evaluate and Fine Tune—Iterative Process

Developing a Rural Regional Route: Checklist
170
Step 1: Identify Needs
Identify sources of information
Statewide studies
Local coordination plans
Local transit development plans
Regional planning organizations
External events (plant closing, loss of intercity bus service, parking issues)
Define needs
Demographic analysis
Specific populations needing service—numbers of persons/trips
Trip characteristics—schedule requirements, seasonality, weekday/weekend
Special needs—accessibility, key destinations, maximum ride time

Developing a Rural Regional Route: Checklist
171
Step 2: Establish Planning Leadership
Identify potential sources of support
Local coordination committees
Metropolitan and rural regional planning organizations
Local transit providers
Local planning staff
Business community
Elected officials
Identify lead agency—define roles
Identify lead individual/team
Create regional steering committee
Define role
Set expectations

Developing a Rural Regional Route: Checklist
172
Step 3: Goals/Vision—Public and Stakeholder Input
Community input
On-line surveys
Public meetings and workshops
Presentations at other community meetings
Pop-up surveys at transportation hubs or community events.
Interview stakeholders
Human service agencies
Health-medical community
College and university staff
Employers/business community
Local governments—planning, economic development, public works staff
Elected officials
Surveys
General public
Existing transit users
Carpool and vanpool riders
Park and ride lot users
Employees of specific destinations
Seniors
Students—community college, college and university

Developing a Rural Regional Route: Checklist
173
Step 4: Identify Resources
Inventory existing services
Transit
Ridesharing—carpool and vanpool
Intercity bus
Passenger rail
Identify potential funding and partners
Federal transit funding programs
o Section 5311 rural
o Section 5311(f) intercity
Potential for use of Section 5311(f) in-kind (based on schedules, potential connectivity)—intercity bus companies
State transit funding programs
o Special incentives for regional organizations/services
Potential for innovative funding sources
Local match sources
o Local governments
o Sponsorships—businesses, community institutions, foundations

Developing a Rural Regional Route: Checklist
174
Step 5: Develop Alternatives
Estimate ridership--Develop range for each target submarket
Work trips
Human service trips
Intercity connections
Personal business, shopping
Social and recreational
School, community college, college and university trips
Develop potential routes and schedules—alternatives
Weekday morning and evening for work trips
Dialysis
Other Medical trip needs (including Medicaid non-emergency transportation)
Connections to intercity schedules
Evening work/school trip requirements
Weekend needs
o Work trips
o Dialysis trips
Identify key stops
Estimate required hours and miles of service
Estimate number and size of vehicles required

Developing a Rural Regional Route: Checklist
175
Determine infrastructure needs
Park and ride lots
Maintenance facilities
Secure storage
Fares and information technology
Propose likely fare levels
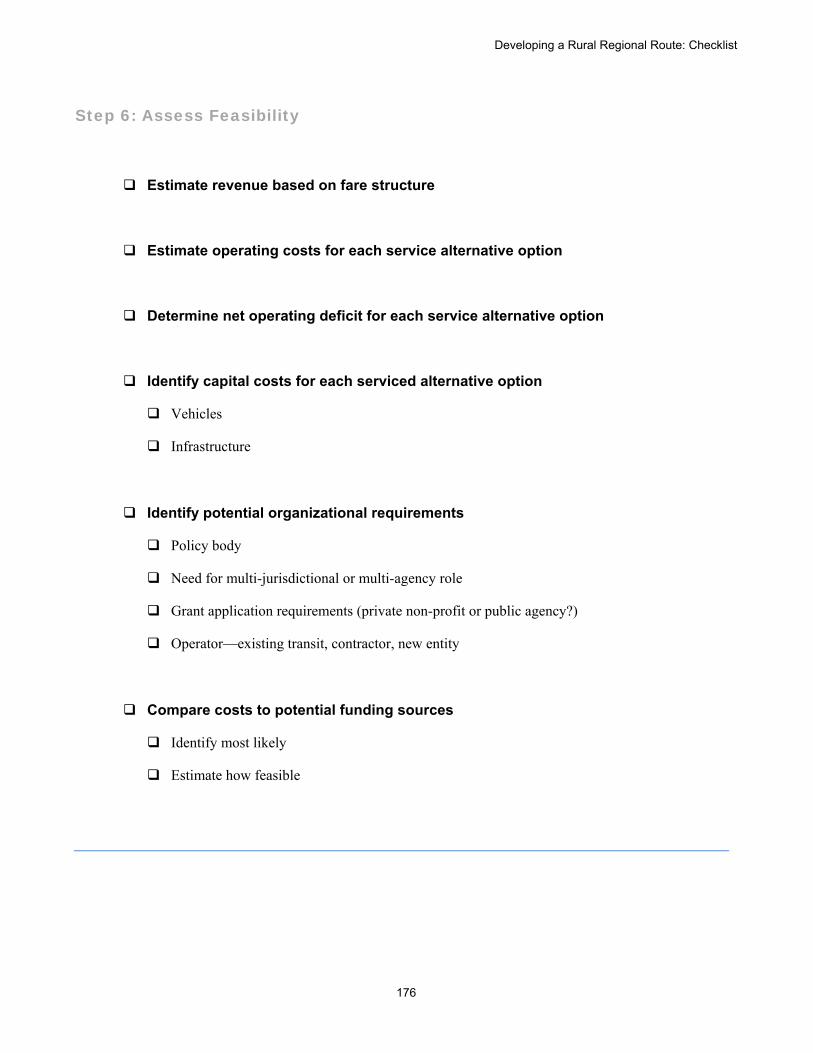
Developing a Rural Regional Route: Checklist
176
Step 6: Assess Feasibility
Estimate revenue based on fare structure
Estimate operating costs for each service alternative option
Determine net operating deficit for each service alternative option
Identify capital costs for each serviced alternative option
Vehicles
Infrastructure
Identify potential organizational requirements
Policy body
Need for multi-jurisdictional or multi-agency role
Grant application requirements (private non-profit or public agency?)
Operator—existing transit, contractor, new entity
Compare costs to potential funding sources
Identify most likely
Estimate how feasible

Developing a Rural Regional Route: Checklist
177
Step 7: Prioritize—Recommended Plan
Present alternatives and feasibility assessment to leadership
Refine options, present to stakeholders
Refine based on input, present to policy-makers
Present to public—refine

Developing a Rural Regional Route: Checklist
178
Step 8: Detailed Service Plan
Develop final routes, stop locations, timetable
Develop fare structure and level
Develop procedures to maximize connectivity
Transfers
Shared stops
Information
Regulatory and insurance requirements
Fleet needs
Infrastructure
Operating facility
Secure vehicle storage
Stop locations, signs, shelters
Staffing needs
Budget and funding plan
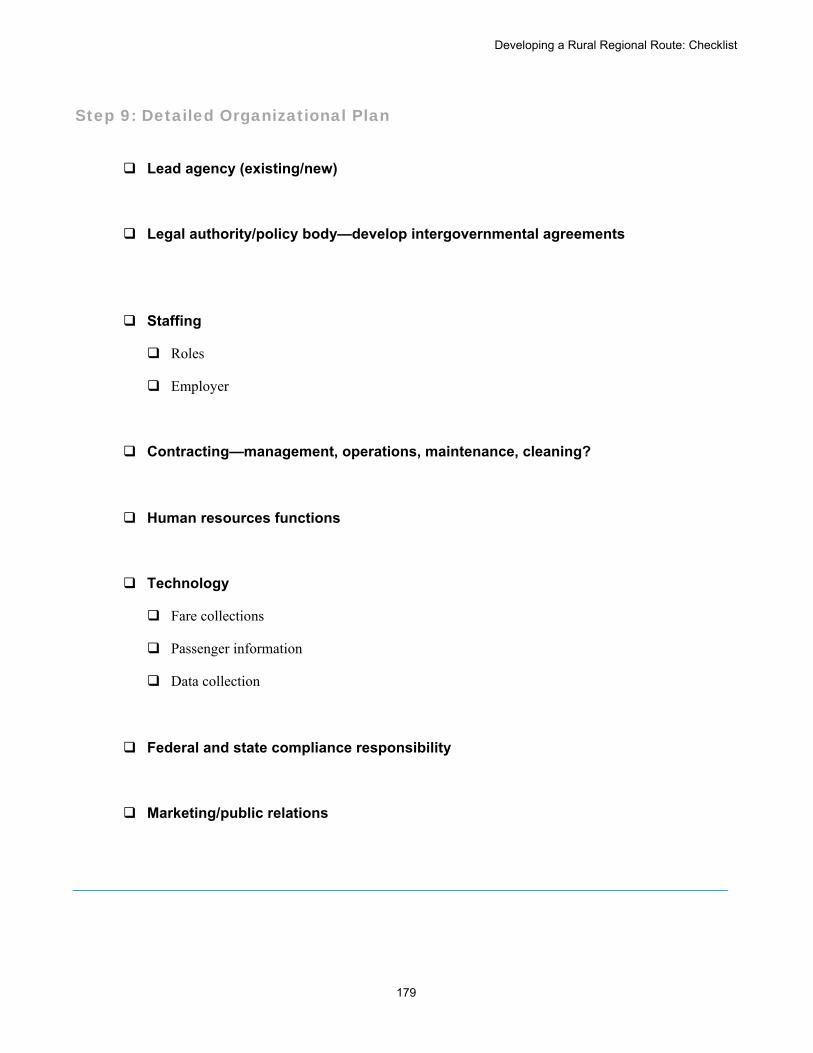
Developing a Rural Regional Route: Checklist
179
Step 9: Detailed Organizational Plan
Lead agency (existing/new)
Legal authority/policy body—develop intergovernmental agreements
Staffing
Roles
Employer
Contracting—management, operations, maintenance, cleaning?
Human resources functions
Technology
Fare collections
Passenger information
Data collection
Federal and state compliance responsibility
Marketing/public relations

Developing a Rural Regional Route: Checklist
180
Step 10: Implementation Plan/Action Items
Identify tasks
Institutional arrangements (MOU’s, contacts)
Vehicle procurement
Office space
Operations facility
Infrastructure arrangements
Contracting or hiring staff, administrative and operating
Branding and marketing
Assign responsibilities
Identify timeframes and interdependencies—phasing if appropriate

Developing a Rural Regional Route: Checklist
181
Step 11: Initiate Service
Branding
Marketing campaign
Initiate operations
Step 12: Evaluate and Fine Tune—Iterative Process

This page intentionally left blank.

A-1
A P P E N D I X A : R A T I O O F I N T E R C I T Y 5 3 1 1 S U B R E C I P I E N T S A N D S U B R E C I P I E N T S T H A T S E R V E M U L T I S T A T E A R E A S

This page intentionally left blank.

A-2
State
Total Number of
5311 Subrecipients
Number of Intercity 5311 Subrecipients
Ratio of Subrecipients
that are Intercity
Number of 5311 Subrecipients that Report a Multi-County Service Area
Ratio of 5311 Subrecipients that Report a Multi-County Service Area
Number of 5311 Subrecipients that Report a Multi-State Service Area
Ratio of Subrecipients that Serve Multi-State
Areas
AK 30 1 3% 6 20% 0 0%
AL 32 2 6% 4 13% 1 3%
AR 9 0 0% 7 78% 0 0%
AZ 32 0 0% 6 19% 0 0%
CA 94 0 0% 16 17% 0 0%
CO 30 0 0% 9 30% 1 3%
CT 5 0 0% 3 60% 0 0%
DC 1 1 100% 0 0% 0 0%
DE 1 0 0% 0 0% 0 0%
FL 44 1 2% 7 16% 0 0%
GA 84 1 1% 4 5% 1 1%
GU 1 0 0% 0 0% 0 0%
HI 3 0 0% 0 0% 0 0%
IA 27 2 7% 17 63% 0 0%
ID 18 1 6% 9 50% 0 0%
IL 42 0 0% 11 26% 0 0%
IN 44 0 0% 10 23% 0 0%
KS 89 2 2% 8 9% 1 1%
KY 25 1 4% 17 68% 0 0%
LA 32 0 0% 0 0% 0 0%
MA 13 2 15% 3 23% 0 0%
MD 18 1 6% 2 11% 0 0%
ME 19 2 11% 10 53% 0 0%
MI 73 3 4% 5 7% 2 3%
MN 69 9 13% 22 32% 2 3%
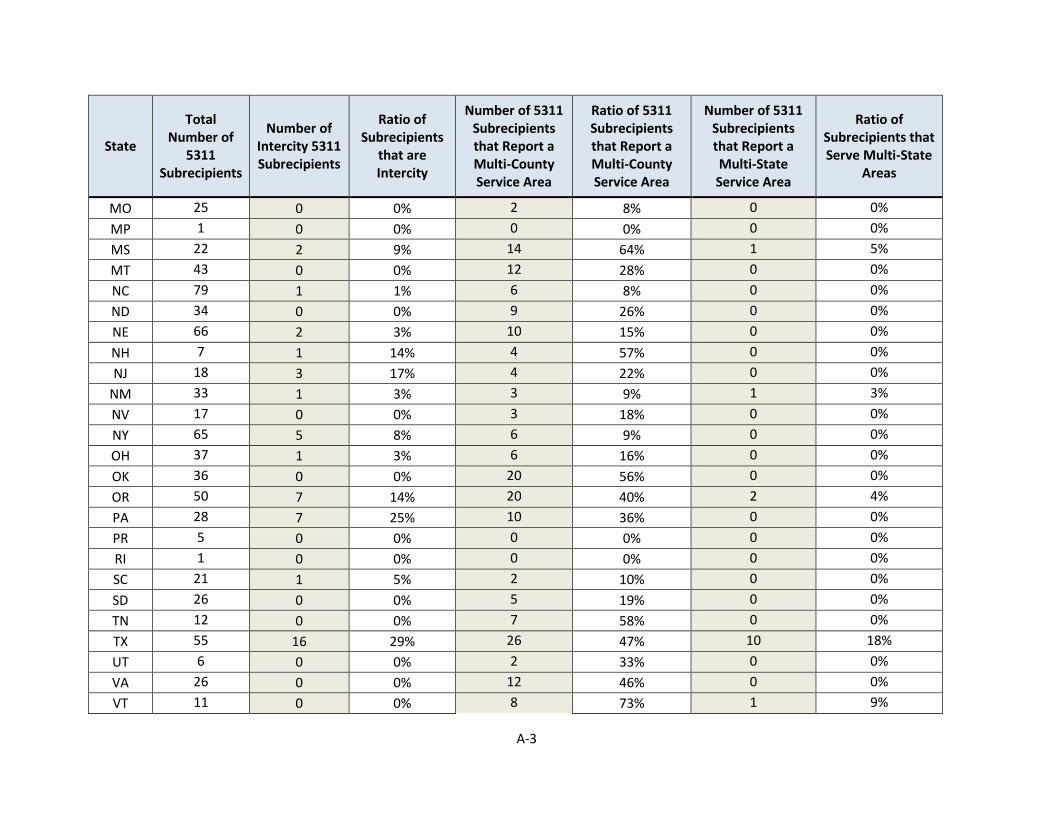
A-3
State
Total Number of
5311 Subrecipients
Number of Intercity 5311 Subrecipients
Ratio of Subrecipients
that are Intercity
Number of 5311 Subrecipients that Report a Multi-County Service Area
Ratio of 5311 Subrecipients that Report a Multi-County Service Area
Number of 5311 Subrecipients that Report a Multi-State Service Area
Ratio of Subrecipients that Serve Multi-State
Areas
MO 25 0 0% 2 8% 0 0%
MP 1 0 0% 0 0% 0 0%
MS 22 2 9% 14 64% 1 5%
MT 43 0 0% 12 28% 0 0%
NC 79 1 1% 6 8% 0 0%
ND 34 0 0% 9 26% 0 0%
NE 66 2 3% 10 15% 0 0%
NH 7 1 14% 4 57% 0 0%
NJ 18 3 17% 4 22% 0 0%
NM 33 1 3% 3 9% 1 3%
NV 17 0 0% 3 18% 0 0%
NY 65 5 8% 6 9% 0 0%
OH 37 1 3% 6 16% 0 0%
OK 36 0 0% 20 56% 0 0%
OR 50 7 14% 20 40% 2 4%
PA 28 7 25% 10 36% 0 0%
PR 5 0 0% 0 0% 0 0%
RI 1 0 0% 0 0% 0 0%
SC 21 1 5% 2 10% 0 0%
SD 26 0 0% 5 19% 0 0%
TN 12 0 0% 7 58% 0 0%
TX 55 16 29% 26 47% 10 18%
UT 6 0 0% 2 33% 0 0%
VA 26 0 0% 12 46% 0 0%
VT 11 0 0% 8 73% 1 9%

A-4
State
Total Number of
5311 Subrecipients
Number of Intercity 5311 Subrecipients
Ratio of Subrecipients
that are Intercity
Number of 5311 Subrecipients that Report a Multi-County Service Area
Ratio of 5311 Subrecipients that Report a Multi-County Service Area
Number of 5311 Subrecipients that Report a Multi-State Service Area
Ratio of Subrecipients that Serve Multi-State
Areas
WA 56 5 9% 15 27% 1 2%
WI 59 1 2% 3 5% 1 2%
WV 12 0 0% 6 50% 0 0%
WY 19 2 11% 3 16% 0 0%
Total Number of 5311 Subrecipients - Taken from the Sub Form column in the 2013 Subrecipient Contact Info (.xlsx) table in the 2013 - Rural NTD Data
Intercity Bus Provider - Under §5311(f) funding, the FTA requires States to set aside 15 percent of §5311 apportionment for intercity bus providers, unless the State’s Governor certifies that intercity bus needs of that State are already being met. In most cases, a State DOT will report on behalf of the Intercity Bus provider.
Intercity Bus (IB)(Rural Module) - Regularly scheduled public service using an over-the-road bus that operates with limited stops between two urbanized areas or that connects rural areas to an urbanized area. Intercity bus mode should only be used by private, intercity bus providers. Can be found in: RU Introduction, RU-20
Multi State Service Area -
FTA Other Than Urbanized Area Formula Program (Section 5311) - Financial assistance from Section 5311 of the Federal Transit Act. This program provides formula funding to States and Indian Tribes for the purpose of supporting public transportation in areas with a population of less than 50,000. Funding may be used for capital, operating, State administration, and project administration expenses. Under Section 5311, SAFETEA-LU also includes provisions for Growing States and High Density States Factors. Can be found in: Introduction, F-10, S&S Introduction, RU Introduction, RU-20

This page intentionally left blank.

B-1
A P P E N D I X B : B U S F A C I L I T I E S S E R V I N G I N T E R C I T Y A N D L O C A L R E G I O N S

This page intentionally left blank.

B-2
State # of Facilities with Intercity Bus Service
# of Facilities with Local Bus
Service
# of Bus Facilities in Rural Regions that Serve both
Intercity Bus and Local Bus Service
# of Bus Facilities in METRO and
MICRO Regions that Serve Both
Intercity Bus and Local Bus Service
AK
28 17
0 7 Urban Rural Urban Rural
20 8 17 0
AL
13 6
0 3 Urban Rural Urban Rural
12 1 6 0
AR
20 16
0 4 Urban Rural Urban Rural
14 6 16 0
AZ
47 50
0 18 Urban Rural Urban Rural
44 3 49 1
CA
219 721
0 151 Urban Rural Urban Rural
192 27 720 1
CO
52 44
4 12 Urban Rural Urban Rural
22 30 38 6
CT
31 53
0 23 Urban Rural Urban Rural
31 0 53 0
DC
10 47
0 9 Urban Rural Urban Rural
10 0 47 0
DE
7 11
0 7 Urban Rural Urban Rural
7 0 11 0
FL
57 10
0 34 Urban Rural Urban Rural
54 3 110 0

B-3
GA
37 45
0 13 Urban Rural Urban Rural
31 6 45 0
HI
0 2
0 0 Urban Rural Urban Rural
0 0 2 0
IA
44 16
0 15 Urban Rural Urban Rural
30 14 16 0
ID
40 8
1 4 Urban Rural Urban Rural
26 14 6 2
IL
55 368
0 38 Urban Rural Urban Rural
22 3 368 0
IN
55 28
0 23 Urban Rural Urban Rural
50 5 28 0
KS
26 8
0 7 Urban Rural Urban Rural
20 6 8 0
KY
17 9
0 7 Urban Rural Urban Rural
14 3 9 0
LA
23 29
0 9 Urban Rural Urban Rural
13 0 29 0
MA
62 225
0 48 Urban Rural Urban Rural
62 0 220 5
MD
41 122
0 27 Urban Rural Urban Rural
40 1 122 0
ME
39 22
0 13 Urban Rural Urban Rural
22 17 18 4
MI
112 42
0 30 Urban Rural Urban Rural
72 40 42 0

B-4
MN
87 44
0 27 Urban Rural Urban Rural
68 19 44 0
MO
45 32
0 16 Urban Rural Urban Rural
37 8 32 0
MS
27 6
0 6 Urban Rural Urban Rural
20 7 6 0
MT
40 7
0 6 Urban Rural Urban Rural
19 21 6 1
NC
60 51
0 30 Urban Rural Urban Rural
56 4 51 0
ND
23 4
0 4 Urban Rural Urban Rural
16 7 4 0
NE
16 1
0 1 Urban Rural Urban Rural
14 2 1 0
NH
34 17
0 14 Urban Rural Urban Rural
28 6 17 0
NJ
23 159
0 16 Urban Rural Urban Rural
23 0 159 0
NM
24 11
0 6 Urban Rural Urban Rural
17 7 11 0
NV
13 16
0 10 Urban Rural Urban Rural
11 2 16 0
NY
277 633
1 134 Urban Rural Urban Rural
237 40 632 1
OH
55 55
0 22 Urban Rural Urban Rural
49 6 55 0

B-5
OK
19 5
0 4 Urban Rural Urban Rural
17 2 5 0
OR
92 84
1 33 Urban Rural Urban Rural
80 12 83 1
PA
143 262
1 66 Urban Rural Urban Rural
132 12 261 1
RI
8 14
0 6 Urban Rural Urban Rural
8 0 14 0
SC
32 15
0 14 Urban Rural Urban Rural
31 1 15 0
SD
21 3
0 3 Urban Rural Urban Rural
14 7 3 0
TN
29 30
0 20 Urban Rural Urban Rural
29 0 30 0
TX
159 143
0 41 Urban Rural Urban Rural
120 39 143 0
UT
36 50
0 21 Urban Rural Urban Rural
30 6 50 0
VA
50 77
1 34 Urban Rural Urban Rural
42 8 76 1
VT
10 11
3 6 Urban Rural Urban Rural
7 3 8 3
WA
88 106
1 45 Urban Rural Urban Rural
71 17 100 6
WI
81 40
0 31 Urban Rural Urban Rural
69 12 40 0

B-6
WV
7 7
0 4 Urban Rural Urban Rural
6 1 7 0
WY
26 4
0 4 Urban Rural Urban Rural
11 15 4 0
Source: Bureau of Transportation Statistics, Intermodal Passenger Connectivity Database, Passenger Connectivity Table
The Passenger Connectivity data table consists of passenger transportation terminals, with data on the availability of connections among the various scheduled public transportation modes at each facility. The database is complete and includes data for terminals serving the scheduled public
transportation system in the 50 state and the District of Columbia. Transit buses are shown only at locations where they serve a terminal served by another mode.
There are 7,239 Records in the Table
The Intermodal Passenger Connectivity Database (IPCD) is a nationwide data table of 7,000 rail, air,
bus and ferry passenger transportation terminals. The objective of the IPCD is to provide data to use in measuring the degree of intermodal connectivity in the passenger transportation system. Therefore, each terminal record in the data base describes the availability of intercity and transit rail, bus and ferry service along with airline service as well. This data has been collected from various public sources to provide the only nationwide measurement of the degree of connectivity available in the national transportation system. Data collection was complete in mid-2012. The data for all modes
is updated periodically.
Data collection has been ongoing since mid-2006. Data is as of the 'updated date' shown in the record for each terminal.
Intercity Bus Service - Facility is primarily served by intercity bus.

This page intentionally left blank.

C-1
A P P E N D I X C : R U R A L R E G I O N A L M O B I L I T Y S U R V E Y

This page intentionally left blank.

Thank you for electing to participate in this NCHRP study Best Practices in Rural Regional Mobility(Project 20-65, Task 56) conducted by KFH Group. The following text will help you define the typesof rural regional transit examples that we are looking for. We hope to find examples to use as casestudies for a national toolbox on improving rural regional mobility.
BackgroundTo support efforts to improve rural regional mobility, the Transportation Research Boardcommissioned the KFH Group to identify and evaluate practices being used by state departmentsof transportation (DOTs), rural transit providers and rural regional planning agencies to plan andprovide for rural regional transit, facilitating the travel of people from rural areas to locations inother jurisdictions that offer a range of opportunities and services not available in their homecommunities.
Definition of Rural Regional TransitAs presented in NCHRP’s Preliminary Scope for the study, rural regional transit is a service thatfalls in the middle ground between rural public transportation and intercity bus service. ThePreliminary Scope suggests that rural regional transit is typically “intra-state, cross-countytransportation” that is open to the general public. It could include, for example, services that couldbe used for day trips to a regional medical center (e.g., a Veterans Administration Medical Center)for non-emergency services, a community college, as well as trips to access other transportationmodes for longer distance travel (e.g., to an intercity bus terminal or airport). Or it could includeservices designed to provide work trips.
Building on the definitions of both rural public transportation and intercity bus service, we aredefining a rural regional transit service, also referred to as rural regional mobility, as one thatprovides transportation open to the general public from a rural area across county or otherjurisdictional boundaries[1] to a destination that has services (e.g., medical, educational,employment, retail, government, etc.) not available in the rural area. The rural regional mobilityservice may be supported with FTA S. 5311 and/or S. 5311(f) and S. 5311(c) funds and may besupplemented with other federal, state, or local funds in addition to passenger fares.
For the purposes of this study, the focus will be on regional services that address the kinds of tripsthat can be made in a day, rather than overnight (or longer trips), while considering the possibilitiesfor also meeting intercity needs (and using intercity funding). The intercity program may well be atool in the toolbox used to create regional services, but the focus of this study is on services thatmeet a different distinct need (even if they can sometimes be designed to qualify as intercityservices).
NCHRP 20-65 (56) Rural Regional Mobility
C-2
If you have questions or if you would like to provide your comments via phone or email pleasecontact:
Lucinda ShannonTransportation PlannerKFH Group, Inc.Phone 301-951-8660Email [email protected]
[1] Although the study scope referred to such services as intra-state, we anticipate that somesystems or providers have developed regional services that cross-state lines, and so we may welldocument such cases and include relevant best practices needed for such services (for examplemeeting Federal Motor Carrier Safety Administration requirements).
C-3

As part of the NCHRP study, Task 56, Best Practices in Rural Regional Mobility, the KFH Group issurveying state transit program managers and others to determine if they:
1) Have identified an unmet need for rural regional transit services (as defined above),2) Have addressed these needs through any state program actions, policies, or programs, and3) Are aware of any local or regional efforts to address these needs that we should contact aspotential case studies.
We hope to identify practices being used by state departments of transportation (DOTs), ruraltransit providers and rural regional planning agencies to plan and provide for rural regionalmobility, facilitating the daily travel of people from rural areas to locations in other jurisdictions thatoffer a range of opportunities and services not available in their home communities. The examplesyou provide may be selected as case studies in a national toolkit.
Please share information about how your state identifies unmet rural regional needs. How are theseneeds identified? Do you have examples of innovative processes to identify these needs? Pleaseshare details about these processes by answering the questions below.
NCHRP 20-65 (56) Rural Regional Mobility
1. Have unmet needs for rural regional transit services been identified in your state?*
Yes
No
C-4

Please share the relevant details about your innovative approach to identify unmet rural regionalmobility needs.
NCHRP 20-65 (56) Rural Regional Mobility
1. Do you know of any statewide transit studies or plans that would be good examples for this study?*
Yes
No
C-5

Remarkable statewide transit needs studies or plans
NCHRP 20-65 (56) Rural Regional Mobility
What is the name of thestudy or plan?
How can we find out moreinformation about thestudy? Is there a link to thereport?
Who should we contact tolearn more about thisstudy or plan? Pleaseinclude name, phonenumber and email.
1. Please share details about your example of statewide transit studies or plans:
C-6

Remarkable statewide transit needs studies or plans
NCHRP 20-65 (56) Rural Regional Mobility
1. Do you know of a statewide intercity bus study or consultation process that is a good example of how toidentify rural regional transit needs?
*
Yes
No
C-7

Remarkable statewide transit needs studies or plans details
NCHRP 20-65 (56) Rural Regional Mobility
Name of the study orprocess
How we find moreinformation about thisprocess? Is there a link tothe study?
Who should we contact tolearn more about thisstudy? Please includename, phone number andemail address.
1. Please share more details about your example of intercity bus studies or consultation process foridentifying rural regional mobility needs.
C-8

Coordinated planning
NCHRP 20-65 (56) Rural Regional Mobility
1. Do you know of a good example of identifying rural regional transit needs through coordinatedtransportation plans?
*
Yes
No
C-9

Coordinated planing details
NCHRP 20-65 (56) Rural Regional Mobility
The title and/or locality ofthe plan?
Why is it an exemplaryexample?
How can we learn moreabout this plan orprocess?
Who should we contactabout the plan? Pleaseinclude a name, phonenumber and emailaddress.
1. Please share more details about your example of the coordinated planning process.
C-10

Transit development plans
NCHRP 20-65 (56) Rural Regional Mobility
1. Do you have a good example of how a transit development plan or similar study helped identify unmetrural regional transportation needs in your state?
*
Yes
No
C-11

transit development plans details
NCHRP 20-65 (56) Rural Regional Mobility
Name of the study or plan?
Is there a link to moreinformation about this planor study?
Who should we contact formore information aboutthis transit developmentplan? Please include aname, phone number andemail address.
1. Please share details about your example of local transit development plans.
C-12

Advisory or policy groups
NCHRP 20-65 (56) Rural Regional Mobility
1. Do you have an example of how advisory or policy groups helped identify unmet rural regional transitneeds in your state?
*
Yes
No
C-13

Advisory or policy groups
NCHRP 20-65 (56) Rural Regional Mobility
What group or group?
Please share details aboutthe process used and whyit worked.
Can we get a copy of theircomment? Are theyavailable online? Link?Website?
1. Please share more information about your example of how advisory or policy groups helped identifyunmet rural regional transit needs in your state.
C-14

Input through meetings or surveys
NCHRP 20-65 (56) Rural Regional Mobility
1. Do you have any exemplary examples of meetings or surveys that helped identify unmet needs for ruralregional transportation in your state?
*
Yes
No
C-15

Input through meetings or surveys
NCHRP 20-65 (56) Rural Regional Mobility
Was this part of a study? Ifso, what study was it?
Why was thisexample/processinstrumental in identifyingrural regional transitneeds?
How can we find out moreinformation about thisprocess?
Who can we contact to findout more informationabout this process?Please include name,phone number and emailaddress.
1. Please share more information about the survey or public meeting process that helped identify unmetneeds.
C-16

We hope to identify practices being used by state departments of transportation (DOTs), ruraltransit providers and rural regional planning agencies to plan and provide for rural regionalmobility, facilitating the daily travel of people from rural areas to locations in other jurisdictions thatoffer a range of opportunities and services not available in their home communities. The examplesyou provide may be selected as case studies in a national toolkit.
NCHRP 20-65 (56) Rural Regional Mobility
Have unmet needs for rural regional transit service been identified in your state, and if so through what process? Please share detailsabout any processes that you think would be good examples to share with other states.
1. Briefly describe the unmet need as it has been identified. Be as specific as possible, e.g. work trips tourban areas, transportation to Veteran’s Administration medical facilities, access to community colleges,long-distance medical trips, etc.
Other (please specify)
2. Has the state transit program addressed these needs through changes in policies, programs or funding?
Yes
No
C-17

NCHRP 20-65 (56) Rural Regional Mobility
1. Do you have an example of enabling legislation that provides authority for jurisdictions to jointly fund andoperate rural regional transit services?
Yes
No
C-18

NCHRP 20-65 (56) Rural Regional Mobility
The legislation title? andURL?
What were the results ofthe legislation related torural regional service?
Why is this a goodexample?
How can we learn moreabout this initiative?
Who should we contact tolearn more about thelegislation and its effectson rural regional mobility?Please include name,phone number and emailaddress.
1. Please provide details about your example of enabling legislation that provides authority for jurisdictionsto jointly fund and operate rural regional transit services.
C-19
NCHRP 20-65 (56) Rural Regional Mobility
1. Has providing funding earmarked for rural regional transit services (either state funds or state prioritiesfor the use of available federal funding) helped improve rural regional transportation?
Yes
No
C-20

NCHRP 20-65 (56) Rural Regional Mobility
Other (please specify)
1. Please check which funds are used by your state to help improve rural regional transportation?
Section 5311
Section 5311(f)
Section 5307
CMAQ
State funds (not local match for federal funds)
State funds for local match for federal funds
If you provide state funds,what is the sources ofthose funds?
If you use federal funds tosupport regional transit,which funds and whatpercent of them areallocated for regionaltransit?
Who can we contact tolearn more about thisinitiative? Please include aname, organization, phonenumber and emailaddress.
2. Please share more details about how your state uses/allocates resources to support rural regionaltransit.
3. Are there any other details about this process used to support rural regional transit? Why would it makea good case study? What can other states learn from this example?
C-21

NCHRP 20-65 (56) Rural Regional Mobility
Other (please specify)
1. Does your state or organization provide technical support to assist jurisdictions in planning and operatingrural regional transit? Including funding for planning or feasibility studies of rural regional transit services.
Yes
No
C-22

NCHRP 20-65 (56) Rural Regional Mobility
Does the technical supportinclude funding forplanning or feasibilitystudies of rural regionaltransit services? If yes,how?
Does the technical supportinclude feasibility studiesof regional services? How?
Does the technical supportinclude studies or plans insupport of developingregional organizations?
1. Please describe the technical support provided to assist jurisdictions in planning and operating ruralregional transit?
2. Do you have an example of technical support you think would help other states support rural regionalmobility? Please describe the program, explain why it is a good example and who to contact for moreinformation about the program.
Name:
Organization:
Phone number:
Email address:
Other comments:
3. Who should we contact to learn more about this example of technical support, either on the state orrecipient side.
C-23

NCHRP 20-65 (56) Rural Regional Mobility
Other (please specify)
1. Does your state fund demonstration projects that feature rural regional transit?
Yes
No
C-24

NCHRP 20-65 (56) Rural Regional Mobility
Who runs thedemonstration projects?
Would one of the projectsmake a good case studyfor a rural regional mobilitytoolkit?
What is the name of thisproject?
Where is it located?
Who operates the project?
What regions does itcover?
Why would it make a goodcase study for ruralregional mobility?
Is there a website or otheravailable source for moreinformation about thisproject?
Who should we contact tolearn more about thisproject? Please includename, phone number andemail address.
1. Please tell us more about these state funded demonstration projects for rural regional transit.
C-25

NCHRP 20-65 (56) Rural Regional Mobility
Other (please specify)
1. Has your state developed policy, guidance and principles that support rural regional transit efforts?
Yes
No
C-26

NCHRP 20-65 (56) Rural Regional Mobility
What is the name of thispolicy and or guidance?
When was it established?
How has it helped tosupport rural regionalmobility?
How do we find out moreabout thispolicy/guidance? Is there alink to it?
Who should we contact tolearn more about how ithelped rural regionalmobility? Please include aname, phone number andemail address.
1. Please share more information about this policy or guidance.
2. Please share any other information about this policy, guidance and/or principles that you think wouldhelp build a case study about it. Why and how did it support rural regional mobility? What worked and whatdidn't work? Were there key partners in its implementation?
C-27
NCHRP 20-65 (56) Rural Regional Mobility
1. Do you have examples of other state-level strategies to support rural regional transportation that youthink should be included in the toolkit on rural regional mobility?
Name:
Organization:
Phone number:
Email address:
Other comments:
2. Who should we contact to learn more about this example, either on the state or recipient side.
C-28

NCHRP 20-65 (56) Rural Regional Mobility
1. Do you have examples of other state-level strategies to support rural regional transportation that youthink should be included in the NCHRP toolkit on rural regional transportation?
C-29

Example 1Name of the system oroperation:
Brief description ofservice:
Contact name, e-mail andphone contact:
Example 2Name of the system oroperation:
Brief description ofservice:
Contact name, e-mail andphone contact:
Example 3Name of the system oroperation:
Brief description ofservice:
Contact name, e-mail andphone contact:
2. Please identify any rural systems or operations in your state that have developed or implementedregional transportation for the general public from a rural area across county or other jurisdictionalboundaries to serve a destination that has services (e.g., medical, educational, employment, retail,government, etc.) not available in the rural area in your state (whether or not as a result of a state programinitiative).
3. Any other examples and comments:
C-30

Thank you for helping KFH Group identify and evaluate practices being used by state departmentsof transportation (DOTs), rural transit providers and rural regional planning agencies to plan andprovide for rural regional mobility, facilitating the daily travel of people from rural areas to locationsin other jurisdictions that offer a range of opportunities and services not available in their homecommunities.
Last Question!
NCHRP 20-65 (56) Rural Regional Mobility
Name
Company
Address
Address 2
City/Town
State/Province -- select state --
ZIP/Postal Code
Email Address
Phone Number
1. Please share your contact information so we may follow up with you. The results of this study will bepublished in a NCHRP toolkit on rural regional transportation. Your state program and its rural providerscould be a model for the rest of the country.
If you have questions or would like to provide further comments via phone or email please contact:
Lucinda ShannonTransportation PlannerKFH Group, Inc.Phone: 301-951-8660Email: [email protected]
C-31