Embed Size (px)
Citation preview

Best Practices for Stress Testing your Private Firm C&I Portfolio
Douglas Dwyer, Managing Director – RiskCalc ResearchMehna Raissi, Director, RiskCalc Product ManagementChristian Henkel, Director, Enterprise Risk Solutions
Originally presented and recorded as a Moody’s Analytics webinar | July 2013

• Overview and impact(s) of stress testing
• Risk management and stress testing for private C&I portfolio
• RiskCalc™ Plus stress testing solutionso PD & LGD Approacho Ratio Based Approach
• Q&A
Agenda

Overview and Impact(s) of Stress Testing
Christian Henkel, Director – Enterprise Risk Services1

As a result of the financial crisis, the Fed has adopted rules for stress testing and, in turn, capital adequacy
» Regulators now expect banks to demonstrate they will be able hold sufficient capital to enable them to continue lending even under adverse economic conditions
» Accordingly, stress testing is a tool that helps banks and supervisors measure capital adequacy through periods of stressed economic conditions
» The Dodd-Frank Wall Street Reform and Consumer Protection Act (“Dodd-Frank”) requires annual stress tests for banks with assets greater than $10b:
– Comprehensive Capital Analysis and Review (“CCAR”) for the top (18) BHCs
– Capital Plan Review (“CapPR”) for non-CCAR BHCs > $50b
– Banks $10b - $50b
» The stress test cycle (year) is the period between October 1st and September 30th; with the requirements for non-CCAR banks coming into play this fall
4

“A company will be required to calculate for each scenario, over each quarter of the planning horizon, pre-provision net revenue, losses, provision for loan and lease losses, and net income; and the potential impact of the scenarios on pro forma regulatory capital levels and pro forma capital ratios”
- Federal Reserve
5
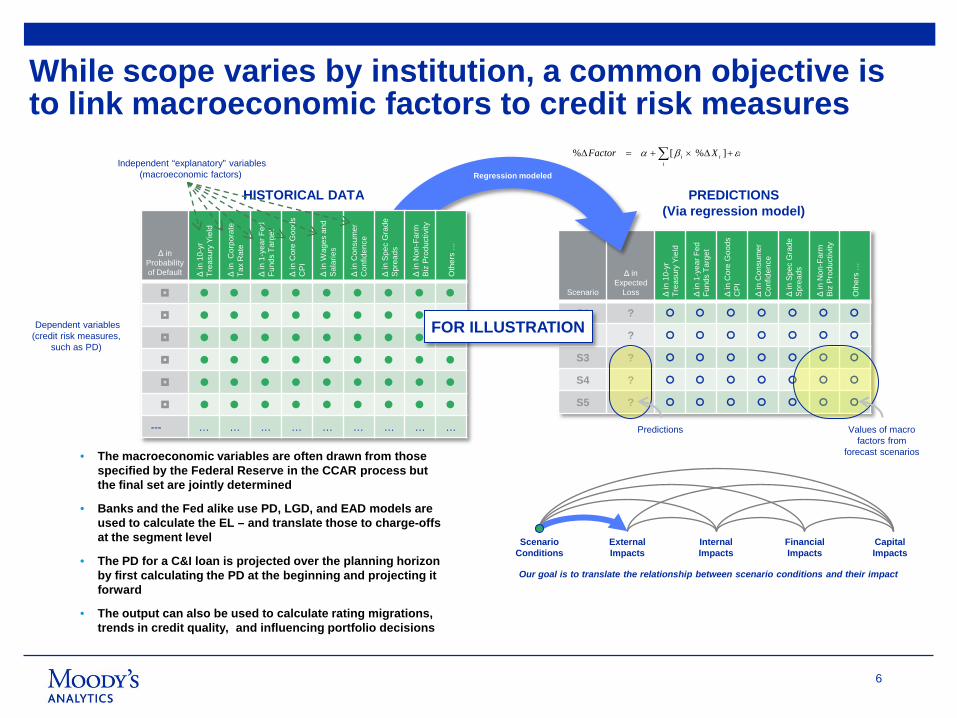
While scope varies by institution, a common objective is to link macroeconomic factors to credit risk measures
Scenario
Δ in Expected
Loss Δin
10-
yr
Trea
sury
Yie
ld
Δin
1-y
earF
ed
Fund
s Ta
rget
Δin
Cor
e G
oods
C
PI
Δin
Con
sum
er
Con
fiden
ce
Δin
Spe
c G
rade
Sp
read
s
Δin
Non
-Far
mBi
z Pr
oduc
tivity
Oth
ers
…
S1 ?
S2 ?
S3 ?
S4 ?
S5 ?
ScenarioConditions
External Impacts
Internal Impacts
Financial Impacts
CapitalImpacts
Δ inProbability of Default Δ
in 1
0-yr
Tr
easu
ry Y
ield
Δin
Cor
pora
te
Tax
Rat
e
Δin
1-y
earF
ed
Fund
s Ta
rget
Δin
Cor
e G
oods
C
PI
Δin
Wag
es a
nd
Sala
ries
Δin
Con
sum
er
Con
fiden
ce
Δin
Spe
c G
rade
Sp
read
s
Δin
Non
-Far
mBi
z Pr
oduc
tivity
Oth
ers
…
--- … … … … … … … … …
• The macroeconomic variables are often drawn from those specified by the Federal Reserve in the CCAR process but the final set are jointly determined
• Banks and the Fed alike use PD, LGD, and EAD models are used to calculate the EL – and translate those to charge-offs at the segment level
• The PD for a C&I loan is projected over the planning horizon by first calculating the PD at the beginning and projecting it forward
• The output can also be used to calculate rating migrations, trends in credit quality, and influencing portfolio decisions
HISTORICAL DATA PREDICTIONS (Via regression model)
Independent “explanatory” variables(macroeconomic factors) Regression modeled
Predictions Values of macro factors from
forecast scenarios
iii
i XFactor εβα +∆×+=∆ ∑ ]%[%
Our goal is to translate the relationship between scenario conditions and their impact
Dependent variables(credit risk measures,
such as PD)
6
FOR ILLUSTRATION

Federal Reserve Supervisory Scenarios 2012 (Real GDP)
-8.0
-6.0
-4.0
-2.0
0.0
2.0
4.0
6.0
Q3 2012
Q4 2012
Q1 2013
Q2 2013
Q3 2013
Q4 2013
Q1 2014
Q2 2014
Q3 2014
Q4 2014
Q1 2015
Q2 2015
Q3 2015
Q4 2015
Rea
l GD
P G
row
th (%
)
Baseline
Adverse
Severely Adverse

Federal Reserve Supervisory Scenarios 2012 (DJIA)
0
2,000
4,000
6,000
8,000
10,000
12,000
14,000
16,000
18,000
20,000
Q3 2012
Q4 2012
Q1 2013
Q2 2013
Q3 2013
Q4 2013
Q1 2014
Q2 2014
Q3 2014
Q4 2014
Q1 2015
Q2 2015
Q3 2015
Q4 2015
Dow
Jon
es T
otal
Sto
ck M
arke
t Ind
ex
Baseline
Adverse
Severely Adverse

CCAR Bank
» Development of challenger models following Fed methodology described in the CCAR disclosures
» C&I loan portfolio» PD, LGD, EAD framework» Use of Moody’s analytical resources and data
Regional Bank
CCAR Bank
» Development of a stress testing framework for C&I portfolio
» Stressed at the ratio-level (i.e., stressed financial statement items)
» Used RiskCalc v3.1 US (and v4.0 Corporate) as primary engine for generating stressed NCOs
» Development of a stress testing framework for a wholesale portfolio of a top 5 U.S. bank
» Creation of challenger models using Moody’s data and analytical resources
» Development of primary models using combined Moody’s and client datasets
» Support through model validation, regulatory review
Recent representative engagements in the US
1 2
3
Stress Testing Engagements (where RiskCalc was included)

RiskCalc Plus and stress testing for private C&I portfolios
Mehna Raissi, Director, RiskCalc Product Management2
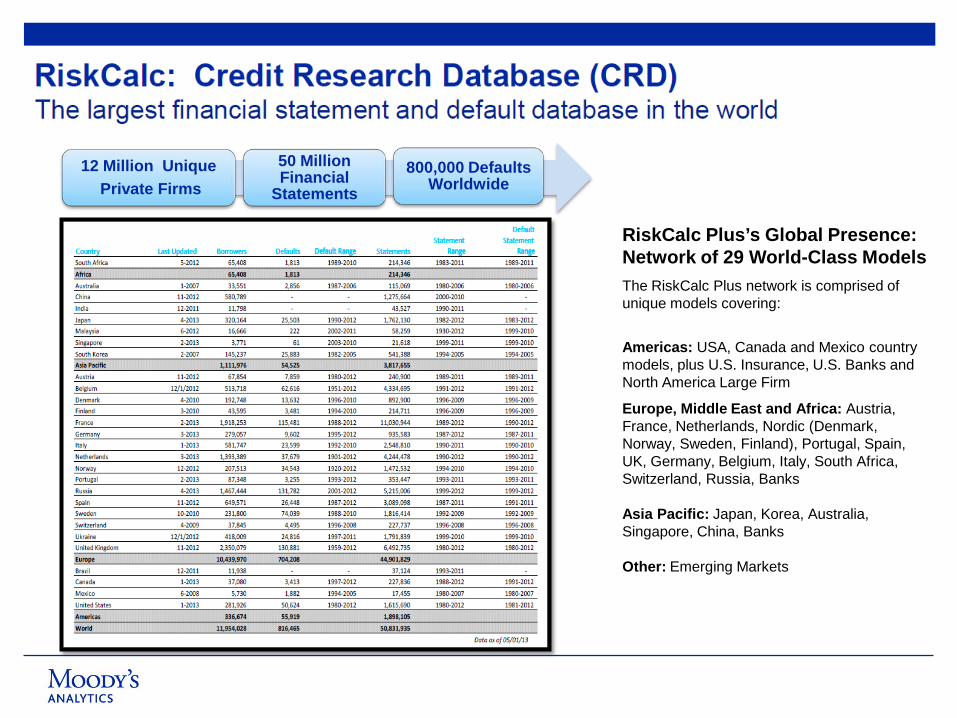
RiskCalc Plus’s Global Presence: Network of 29 World-Class ModelsThe RiskCalc Plus network is comprised of unique models covering:
Americas: USA, Canada and Mexico country models, plus U.S. Insurance, U.S. Banks and North America Large Firm
Europe, Middle East and Africa: Austria, France, Netherlands, Nordic (Denmark, Norway, Sweden, Finland), Portugal, Spain, UK, Germany, Belgium, Italy, South Africa, Switzerland, Russia, Banks
Asia Pacific: Japan, Korea, Australia, Singapore, China, Banks
Other: Emerging Markets
12 Million UniquePrivate Firms
50 Million Financial
Statements800,000 Defaults
Worldwide

Collect Financials and Default Data
Select Relevant Ratios
Compute the Model Output
Calibrate the Model Output to Actual Defaults: Financial Statement Only EDF™ (Expected Default Frequency)
Incorporate a market signal to determine the Credit Cycle Adjusted EDF
1
2
3
4
5
RiskCalc™ Modeling Process
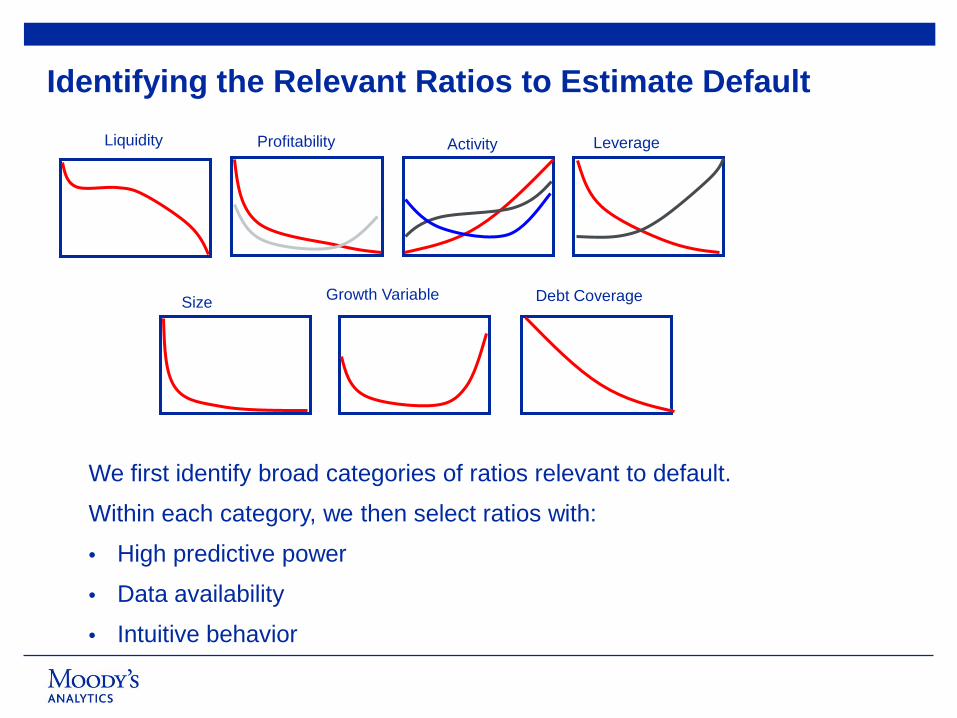
Identifying the Relevant Ratios to Estimate Default
We first identify broad categories of ratios relevant to default.
Within each category, we then select ratios with:
• High predictive power
• Data availability
• Intuitive behavior
Liquidity Profitability Activity
Debt Coverage
Leverage
Size Growth Variable

0%
2%
4%
6%
8%
10%
12%
14%
Feb-
98
Mar
-98
Apr-9
8
May
-98
Jun-
98
Jul-9
8
Aug-
98
Sep-
98
Oct
-98
Nov-
98
Dec-
98
Jan-
99
Feb-
99
Mar
-99
Apr-9
9
FSO Mode (Financial Data)
The impact of industry effects
Finl Statement Only EDF
The Impact of Industry Market Information
0%
2%
4%
6%
8%
10%
12%
14%
Feb-
98
Mar
-98
Apr-9
8
May
-98
Jun-
98
Jul-9
8
Aug-
98
Sep-
98
Oct
-98
Nov-
98
Dec-
98
Jan-
99
Feb-
99
Mar
-99
Apr-9
9
Industry Median EDF
FSO Mode (Financial Data)
The impact of industry effectsThe Impact of Industry Market Information
Industry Market Factor
Finl Statement Only EDF
0%
2%
4%
6%
8%
10%
12%
14%
Feb-
98
Mar
-98
Apr-9
8
May
-98
Jun-
98
Jul-9
8
Aug-
98
Sep-
98
Oct
-98
Nov-
98
Dec-
98
Jan-
99
Feb-
99
Mar
-99
Apr-9
9
EDF
Industry Median EDFFSO Mode (Financial Data)
The impact of industry effects
Industry Market FactorFin. Statement Only EDF
RiskCalc CCA EDF
The Impact of Industry Market Information
Credit Cycle Adjustment (CCA)
Update the Risk Assessment Without New Financial Statement Information
Sep Oct Nov Dec Jan Feb Mar Apr May JunAugJulJunMayApr2001 2002
14
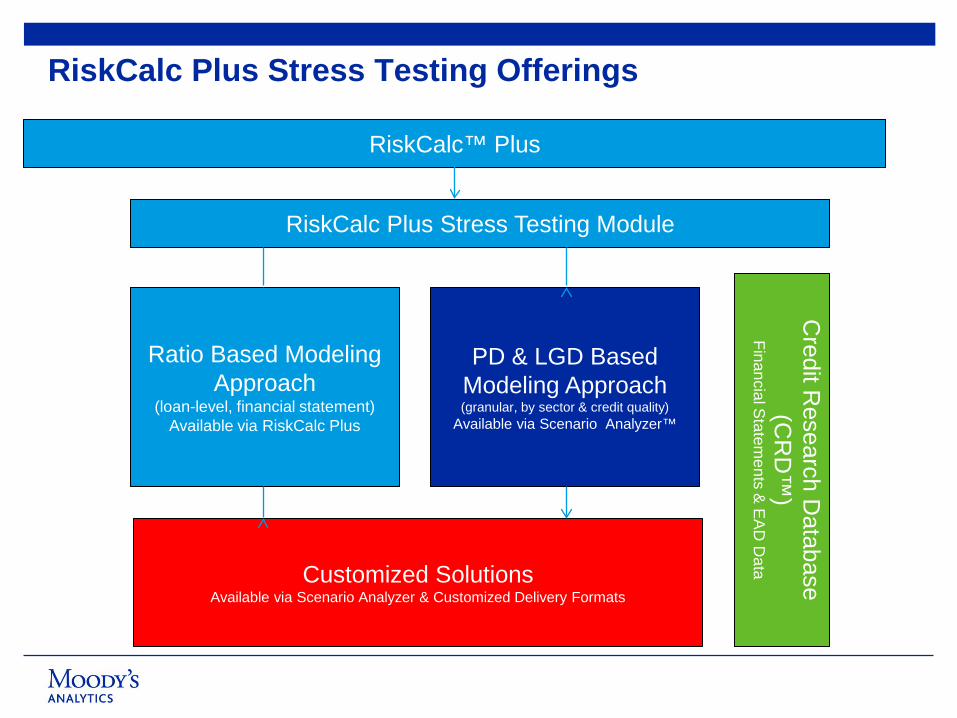
RiskCalc Plus Stress Testing Offerings
RiskCalc Plus Stress Testing Module
Ratio Based Modeling Approach
(loan-level, financial statement)Available via RiskCalc Plus
PD & LGD Based Modeling Approach(granular, by sector & credit quality)
Available via Scenario Analyzer™
Customized Solutions Available via Scenario Analyzer & Customized Delivery Formats
Credit R
esearch Database
(CR
D™
)Financial S
tatements &
EA
D D
ata
RiskCalc™ Plus
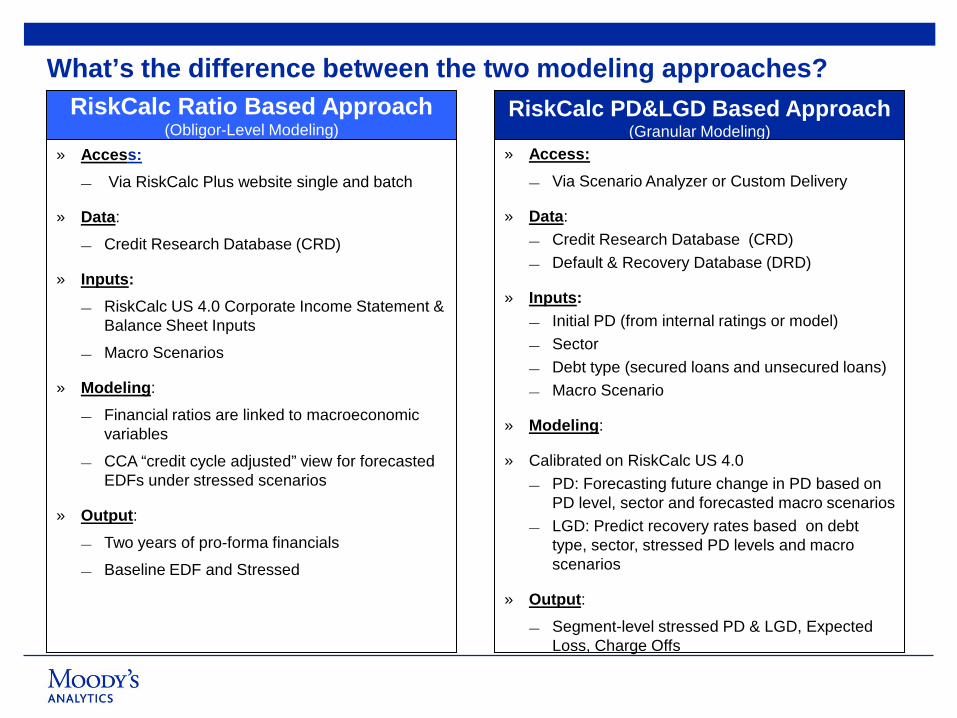
What’s the difference between the two modeling approaches?RiskCalc PD&LGD Based Approach
(Granular Modeling)» Access:
— Via Scenario Analyzer or Custom Delivery
» Data: — Credit Research Database (CRD)— Default & Recovery Database (DRD)
» Inputs: — Initial PD (from internal ratings or model)— Sector— Debt type (secured loans and unsecured loans)— Macro Scenario
» Modeling:
» Calibrated on RiskCalc US 4.0— PD: Forecasting future change in PD based on
PD level, sector and forecasted macro scenarios— LGD: Predict recovery rates based on debt
type, sector, stressed PD levels and macro scenarios
» Output: — Segment-level stressed PD & LGD, Expected
Loss, Charge Offs
RiskCalc Ratio Based Approach (Obligor-Level Modeling)
» Access:— Via RiskCalc Plus website single and batch
» Data:
— Credit Research Database (CRD)
» Inputs: — RiskCalc US 4.0 Corporate Income Statement &
Balance Sheet Inputs
— Macro Scenarios
» Modeling:
— Financial ratios are linked to macroeconomic variables
— CCA “credit cycle adjusted” view for forecasted EDFs under stressed scenarios
» Output: — Two years of pro-forma financials
— Baseline EDF and Stressed
Stress testing models for your private C&I portfolioDouglas Dwyer, Managing Director – RiskCalc Research3
Stress Testing with RiskCalcPD&LGD and A Ratio Based Approach

Overview1

Stressed PDs can be computed with different degrees of granularity in RiskCalc
The PDs of private firms change due to changes in both the financial statements and changes in the credit cycle adjustment
When the economy goes into a recession
» The financial statements of private firms get worse
» The cyclical risk of private firms increases as measured by the Credit Cycle Adjustment in RiskCalc
One can stress the PD and LGD of a rating bucket/sector combination (PD/LGD)
» More top-down
Alternatively, one can start at the financial statement level (bottom-up)
» One can estimate the impact of the adverse business environment on the financial statements
» Further model the Credit Cycle Adjustment factor

PD & LGD2.1

22
» A model with the following features
» Similar to Fed’s CCAR model
"... estimation of a series of equations relating historical changes in the median PD for 12 different borrower industries, six credit quality categories, and countries of incorporation to macroeconomic variables, including changes in stock price volatility and the spread on BBB‐rated corporate bonds ...“--Comprehensive Capital Analysis and Review 2012: Methodology and Results for Stress Scenario Projections
» Generic: can be applied to any portfolio with initial PD assigned (“scenario analyzer” in CE+)
» Granularity: Different impact of macroeconomic variables for different sectors and credit qualities
» Most important: produce reasonable stress numbers
Overview

– Dependent variable: the shift of EDF distribution for each sector/rating bucket. » Change of Log-median EDF:
– Main Model: Two-way Fixed Effect Model
» s denotes sectors, r denotes ratings, t denotes time points.
» Xs are macroeconomic variables.
» Different variations of the main model: sector or rating effect only
» 1st lag of dependent variable: high persistency of dependent variable
Model Specification
23
Credit Migration Shift of EDF distribution Sector Effect Rating Effect
Macro Variables GDP Unemployment DJX, VIX Credit Spread
1t tmEDF mEDF+ −
, , , , 1 , , , 1 , ,1( ) ,M
s r t s r t s r i s i r i t s r tiy y Xρ α α β β ε− +=
= + + + + +∑
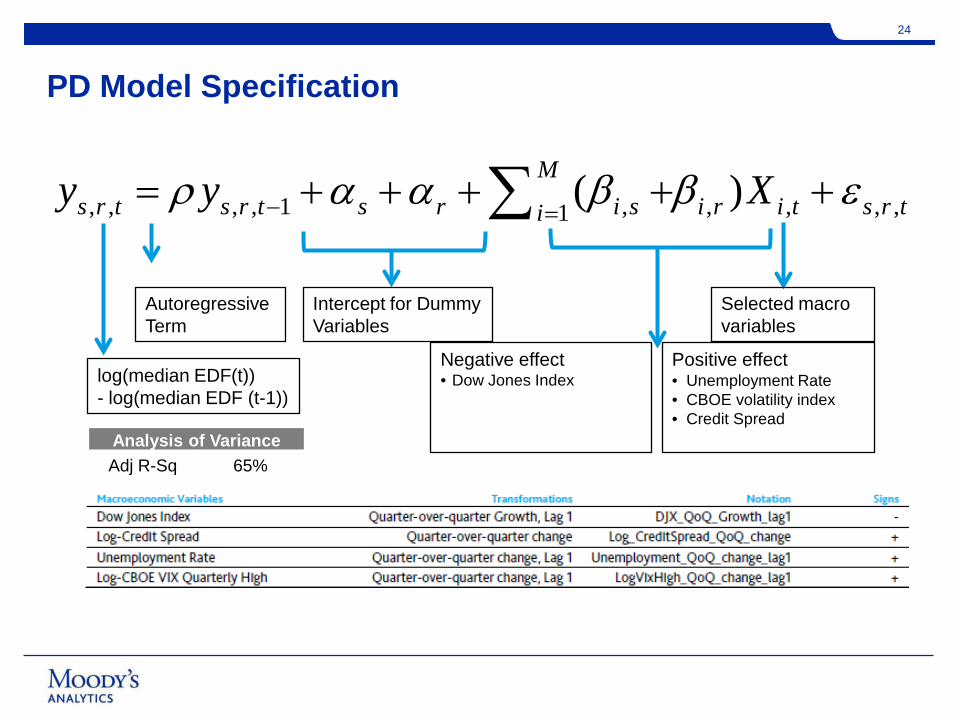
PD Model Specification
24
Analysis of VarianceAdj R-Sq 65%
Autoregressive Term
Intercept for DummyVariables
Negative effect• Dow Jones Index
Positive effect• Unemployment Rate• CBOE volatility index• Credit Spread
log(median EDF(t))- log(median EDF (t-1))
Selected macro variables
, , , , 1 , , , , ,1( )M
s r t s r t s r i s i r i t s r tiy y Xρ α α β β ε− =
= + + + + +∑

25
Historical & CCAR 2012 & CCAR 2013

LGD Model2.2
Moody’s Default Recovery Database (DRD)
27
» The DRD contains information for defaulted debts. It is updated on a monthly basis and contains default events going all the way back to 1883. The data contains post-default prices from the market as well as ultimate recovery values.
» Definition of Default and Recovery» Default types: Bankruptcy, Chapter 11, Chapter 7, Missed principal payment, Distressed exchange
and Dividend omission for preferred stocks
» Post default price: the trading price of the default debt, expressed as a percentage of par, as of the default date for distressed exchanges or 30 days after defaults for all other types of default.
» Ultimate recovery: the discounted value (at the defaulted instrument’s effective interest rate) of these items where the bonds and the equity are marked to market using the first observable trading price
Information Used For LGD modeling28
» Use data going from 1990 to 2011 Q3 and US only.
» Default
» PID (Moody’s public company identifier)
» Issue rating
» Default date
» Recovery: 30-day Trading Prices with base =100
» Industry Classifications
» Debt type
Additional information:
» EDF (Moody’s PD) information based on PD
» Rating-implied PD for companies without available EDF
» Industry classification to sector mapping
» Macroeconomic variables and time series

» Start with a linear model to ensure the predicted recoveries are corrected on average. Then adjust fit in the tails to further improve the in-sample fit and bound the predicted recovery prices between 0 and 100.
» Function form:.
where y_(i,t) is the recovery price based on par of 100 of instrument at time t; DebtType_j is the debt type dummy; Sector_k is the sector dummy; X_m is the (transformed) CCAR macro variables ; EDF_(i,t-1) is the EDF of the instrument i one quarter prior to default. F is certain non-linear transformation.
29
LGD Model Overview
, , 1 ,i t j j k k m m i t i tj k m
y F DebtType Sector X EDFα β γ δ κ ε−
= + ⋅ + ⋅ + ⋅ + ⋅ +
∑ ∑ ∑
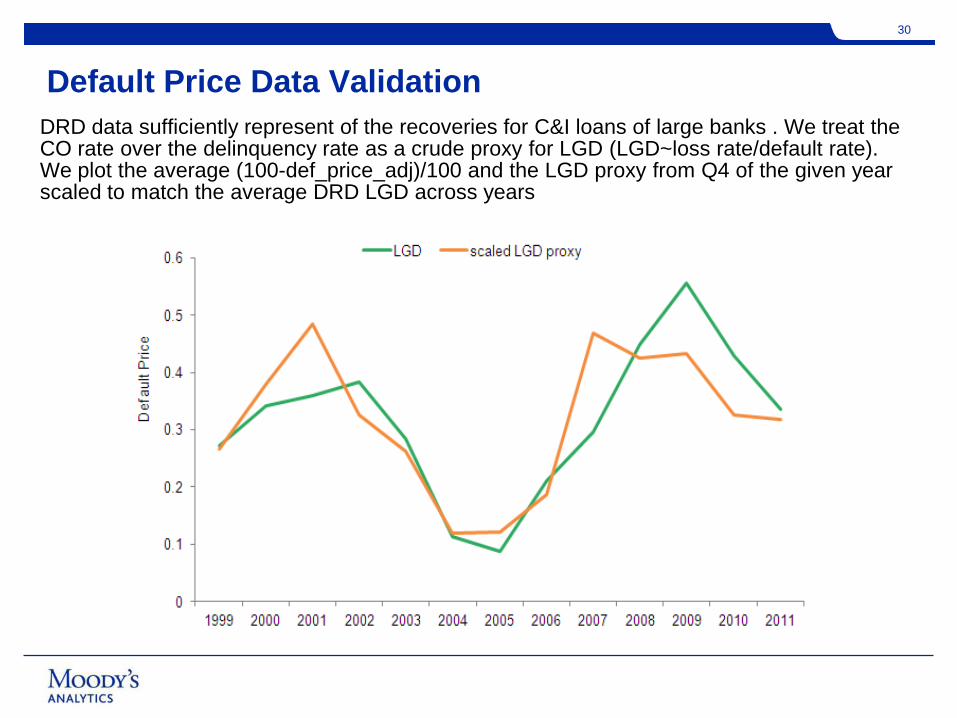
DRD data sufficiently represent of the recoveries for C&I loans of large banks . We treat the CO rate over the delinquency rate as a crude proxy for LGD (LGD~loss rate/default rate). We plot the average (100-def_price_adj)/100 and the LGD proxy from Q4 of the given year scaled to match the average DRD LGD across years
30
Default Price Data Validation
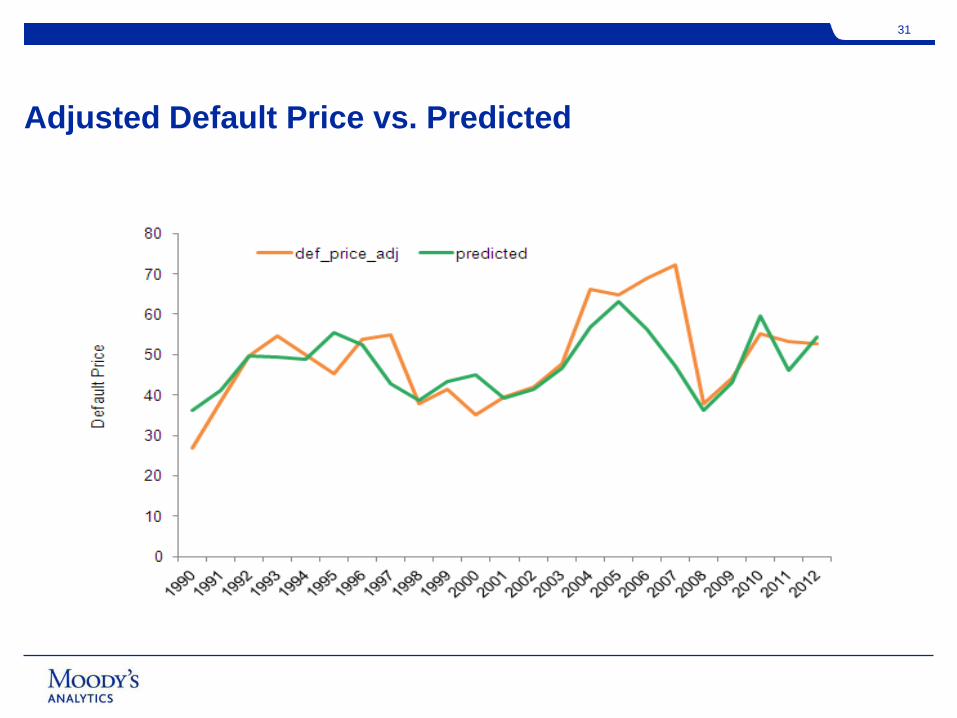
Adjusted Default Price vs. Predicted
31
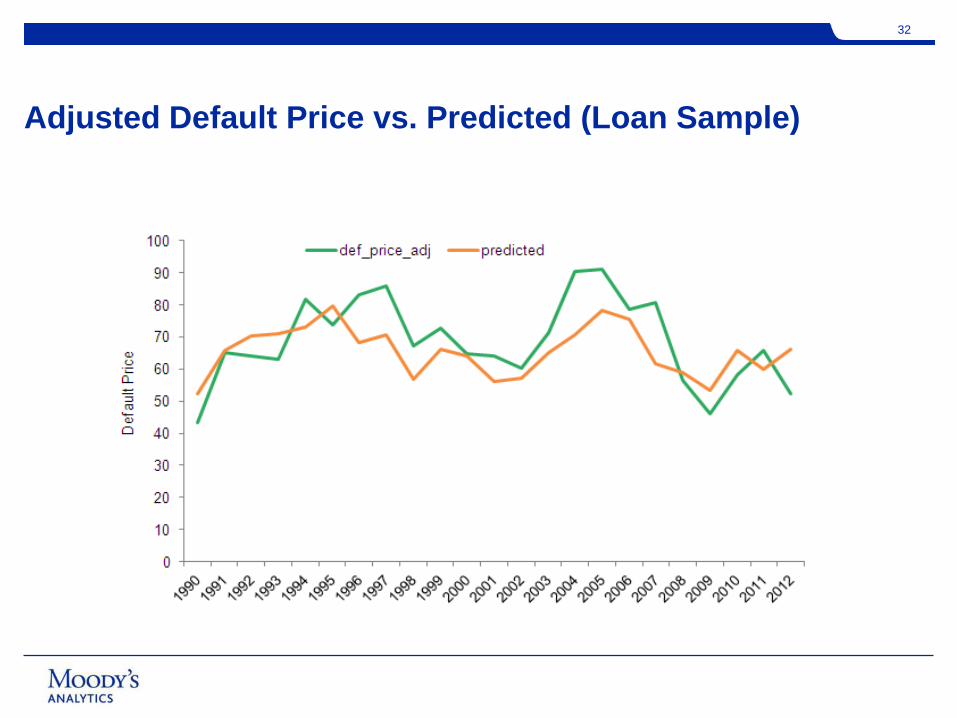
Adjusted Default Price vs. Predicted (Loan Sample)
32

Ratio Based Approach3

Ratio Based Approach
Links the key financial statement items to macro variables
Demonstrates how different balance sheet inputs behave under different hypothetical stress scenarios
Captures which types of firms are more vulnerable to a specific stress scenarioFirms with tight margins are vulnerable to business downturnsFirms with high leverage are vulnerable to increases in interest rates
Captures how different sectors respond to the credit cycle differently
Accommodate flexible stress testing scenarios
Good validation results both at the intermediate FSO level and at the final stressed EDF level
34

Modeling Stressed EDFs Using RiskCalc
Macroeconomic
Scenarios
CCAR/MEDC/Custom
Proforma 1 & 2 Statements Intermediate FSO EDFs
CCA Factors
Stressed EDF
Financial
Statements
35
FSO Model3.1

Different Cyclical Behavior across Sectors
37
1995 2000 2005 2010Year
1995 2000 2005 2010Year
1995 2000 2005 2010Year
1995 2000 2005 2010Year
1990 1995 2000 2005 2010Year
Construction Consumer Products Health Care
Services Trade
Rat
es (%
)
-10
-5
0
5
1
0
Rat
es (%
)
-1
0
-5
0
5
10
Rat
es (%
)
-1
0
-5
0
5
10
Rat
es (%
)
-10
-5
0
5
1
0
Rat
es (%
)
-10
-5
0
5
1
0
Sales Growth Rates
GDP Growth Rates

We use Economic and Accounting Theory to Guide the Exercise
» During a recession, both sales and costs decline with GDP
» Interest expense increases if interest rates go up
» One can estimate the effects of the credit cycle on an income statement, which flows through to the balance sheet
38
1990 1995 2000 2005 2010Year
Rat
es (%
)
-10
-5
0
5
1
0
Sales Growth Rates
GDP Growth Rates

A Pro-Forma Income Statement Relates Changes in Sales to Changes in Income
Income Statement
Sales/Revenue
-Cost of Goods Sold (COGS)
-Selling, General and Administrative Expense (SGA)
-Depreciation/Amortization (AMORT)
-Other Operating Expense (OthrExp)
Total Operating Profit
+Financial Income
-Interest Expenses
Profit before Tax
-Tax
Net Income
Responds to the Cycle
Responds to Interest Rates
Variable costs such as Cost of Goods Sold move together with changes in Sales.
Fixed costs, such as Depreciation/Amortization move slowly when Sales decrease.
Sales Growth COGS Changes SGA ChangesInterest Expense Changes

We Modify the Balance Sheet to Be Consistent with the Income Statement
40
If losses exceed cash and marketable securities:Assets Liability + Equity
∆Cash = -Casht
∆ LossCarryFwd = -tax*PreTaxLosst
∆CL= -preTaxLoss – Casht
∆TL= -preTaxLoss - Casht
∆Retained Earnings = (1-tax)*preTaxLoss
∆Total Assets = -tax * preTaxLoss – Casht ∆ (Liability + Equity) = -tax * preTaxLoss –Casht
In doing the pro forma financial statements, there is discretion in the treatment of income: is it reinvested in the firm or distributed to equity holders? More conservative assumptions lead to more stressed EDFsNote: ∆PreTaxNIt+1= (∆SGR – ∆COGs – ∆SGA)* Salest – ∆IntExpt+1preTaxNIt+1 = NI/(1-tax) + ∆PreTaxNIpreTaxLoss = Min(preTaxNI,0)

» Clear theoretical justification
» RSQ (or Adj. RSQ)
» The sign and magnitude of coefficients are economically meaningful
» Significantly correlated with dependant variables
Model Selection Guidelines
41
g: identifies sector groups: identifies statet: identifies timesX: macroeconomic variablesY: SGR, COGS, SGA, or Interest Expense changes
, , , ,1
Ng g g gs t j j s t s t
j
y Xα β ε=
= + +∑
One computes a Pro-Forma EDF
Starts with this year’s financial statement
Computes a pro-forma financial statement using next year’s macro variables that are supplied by the scenario.
This does not adjust for the stage of the cycle
42
CCA FACTOR MODEL3.2
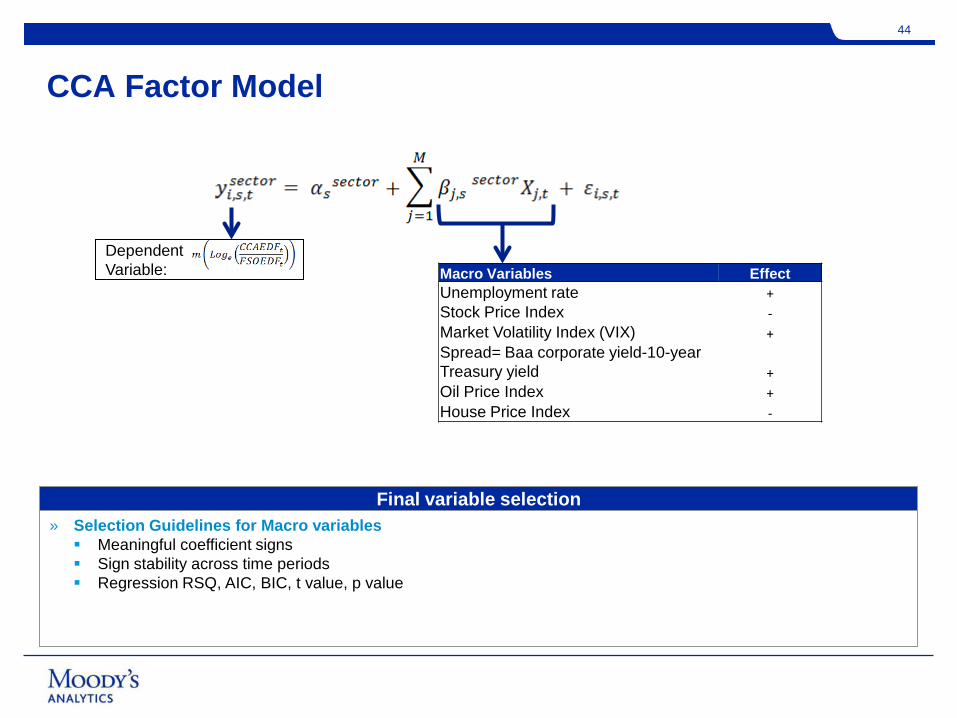
CCA Factor Model
Macro Variables EffectUnemployment rate +Stock Price Index -Market Volatility Index (VIX) +Spread= Baa corporate yield-10-year Treasury yield +Oil Price Index +House Price Index -
Dependent Variable:
Final variable selection» Selection Guidelines for Macro variables Meaningful coefficient signs Sign stability across time periods Regression RSQ, AIC, BIC, t value, p value
44

45
Regression ModelsDifferent sectors respond differently to macro-scenarios
Agriculture Estimate Std. Error*lag(Unemployment, 1) 0.17 0.0074***
lag(Dow Jones_R, 1) -0.17 0.0642***
lag(Log_VIX, 1) 0.21 0.0283***
lag(WTI, 2) 0.08 0.0228***R-Squared 0.55
Adj. R-Squared 0.54 Sample Size 1150
Trade Estimate Std. Error*Unemployment 0.18 0.0027 ***
lag(Dow Jones, 1) -0.21 0.0205 ***Log_VIX 0.27 0.0085 **
R-Squared 0.80Adj. R-Squared 0.79
Sample Size 3500
0.000.501.001.502.002.503.00 CCAR 2012: CCA Factor
Agriculture Trade* Robust Standard Errors
45
Fitte
d C
CA
Fac
tor (
%)

VALIDATION RESULTS4
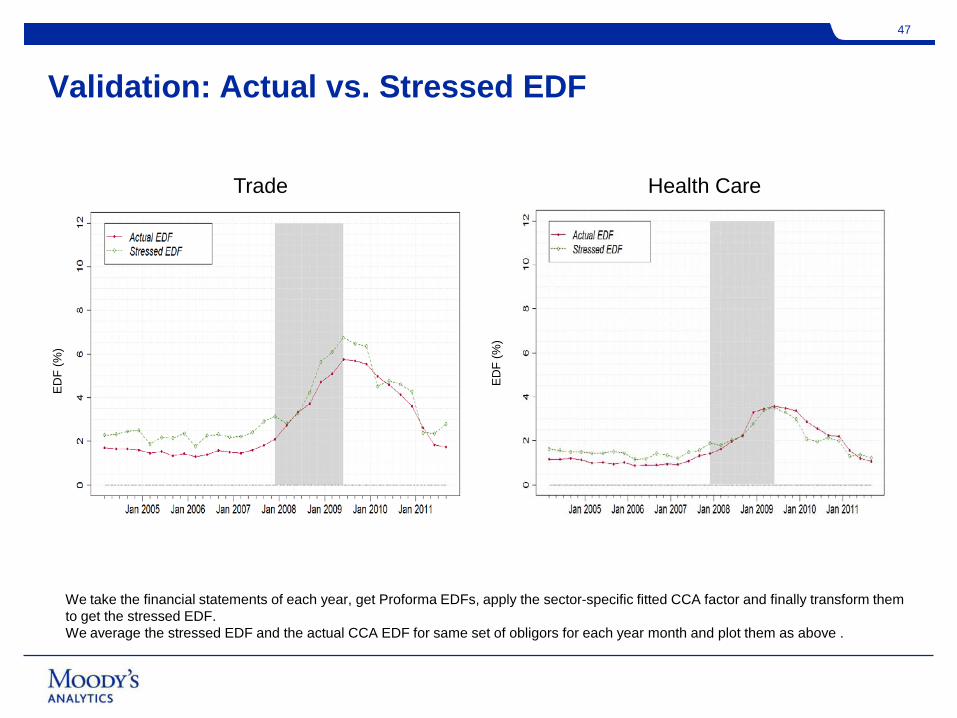
Validation: Actual vs. Stressed EDF
Trade Health Care
47
ED
F (%
)
ED
F (%
)
We take the financial statements of each year, get Proforma EDFs, apply the sector-specific fitted CCA factor and finally transform them to get the stressed EDF.We average the stressed EDF and the actual CCA EDF for same set of obligors for each year month and plot them as above .

Validation: Actual vs. Stressed EDF
Services Transportation
48
ED
F (%
)
ED
F (%
)

Validation: Actual vs. Stressed EDF
49E
DF
(%)
ED
F (%
)
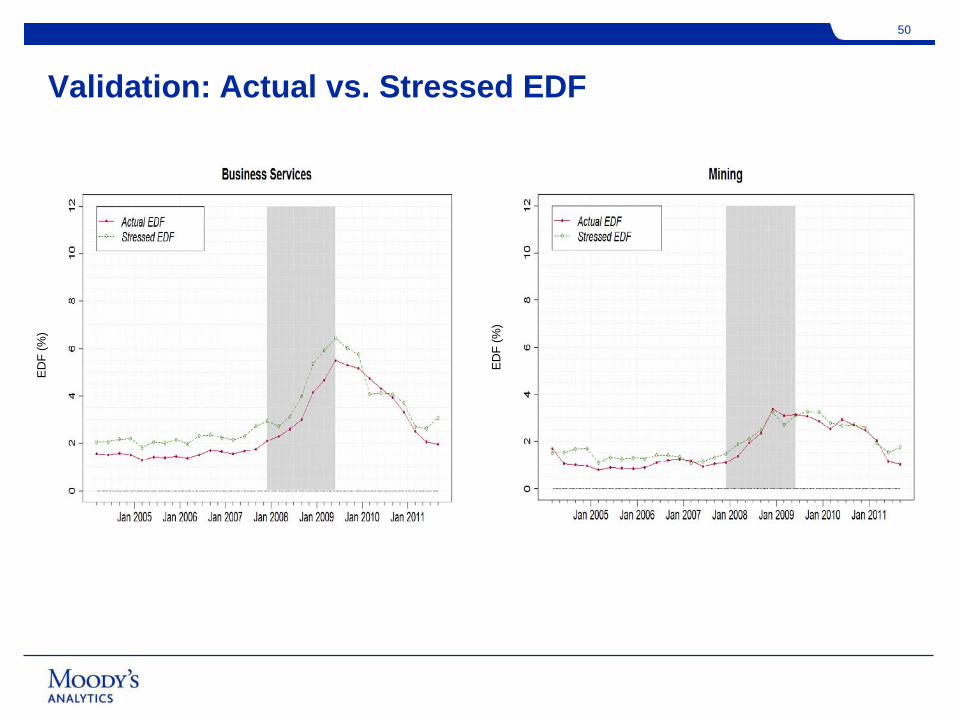
Validation: Actual vs. Stressed EDF
50E
DF
(%)
ED
F (%
)
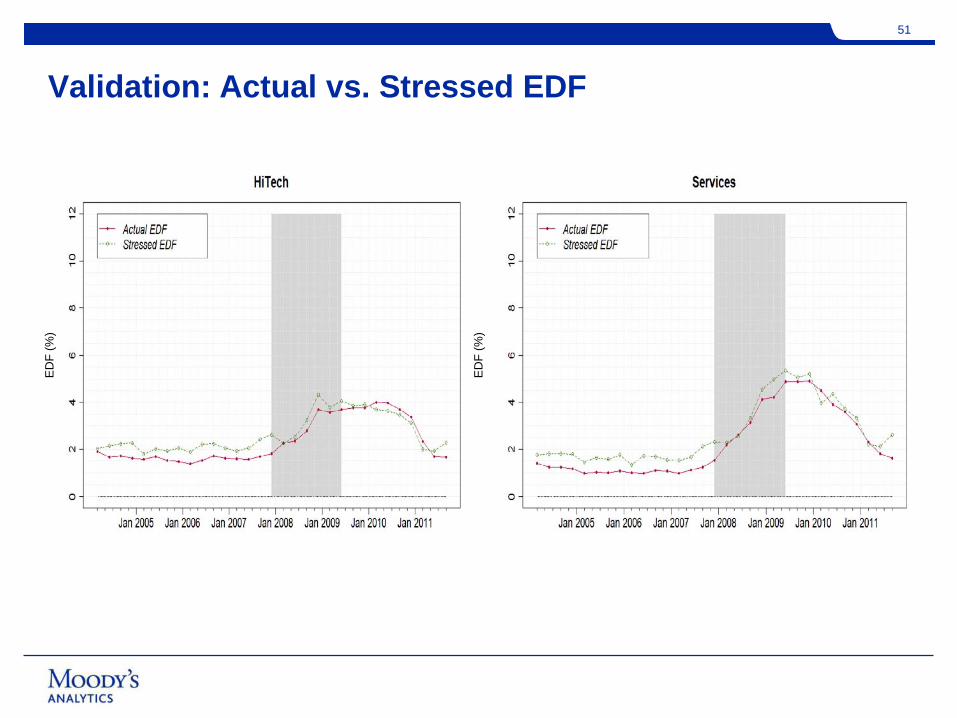
Validation: Actual vs. Stressed EDF
51E
DF
(%)
ED
F (%
)

Validation: Actual vs. Stressed EDF
52E
DF
(%)
ED
F (%
)
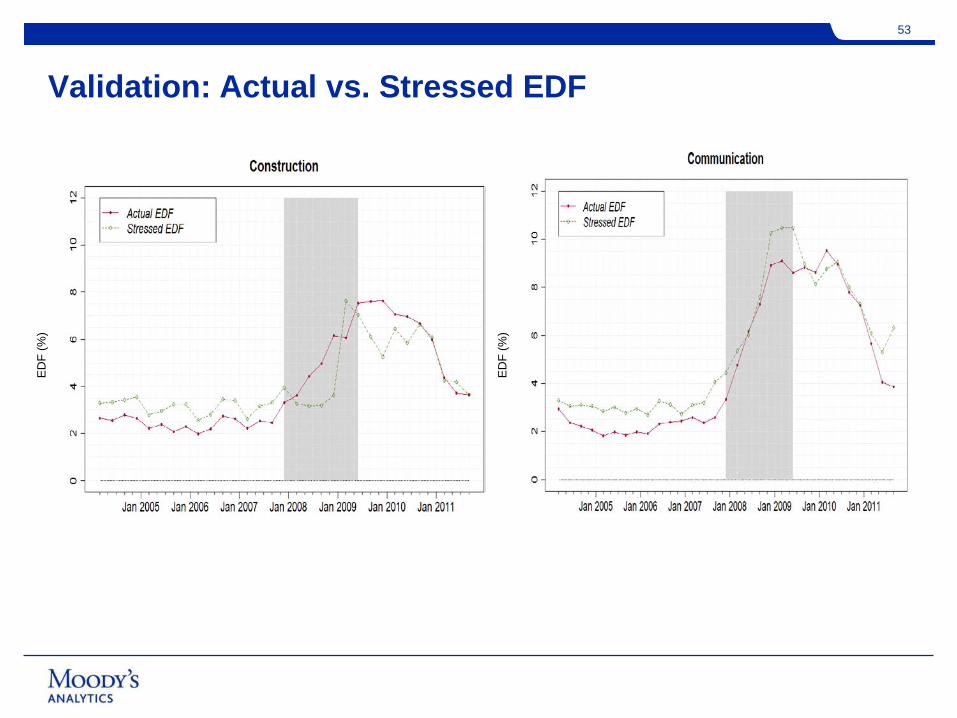
Validation: Actual vs. Stressed EDF
53E
DF
(%)
ED
F (%
)
54
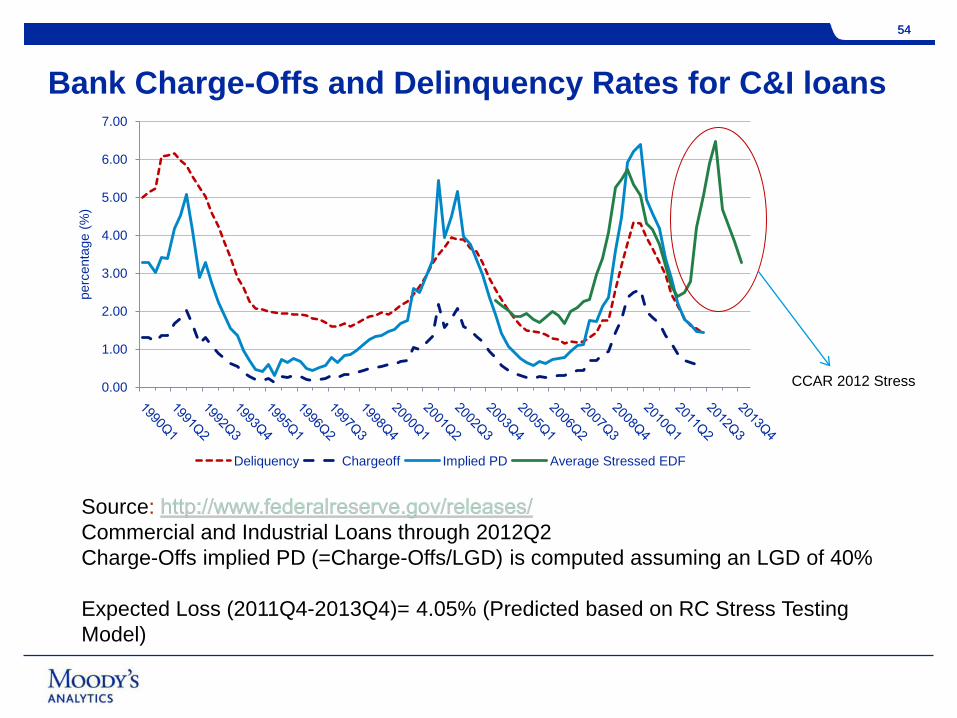
Bank Charge-Offs and Delinquency Rates for C&I loans
SourceCommercial and Industrial Loans through 2012Q2Charge-Offs implied PD (=Charge-Offs/LGD) is computed assuming an LGD of 40%
Expected Loss (2011Q4-2013Q4)= 4.05% (Predicted based on RC Stress Testing Model)
CCAR 2012 Stress
54
0.00
1.00
2.00
3.00
4.00
5.00
6.00
7.00
perc
enta
ge (%
)
Deliquency Chargeoff Implied PD Average Stressed EDF

A top down approach stresses both PD and LGD
Broadly applicable
Reasonable Results
A bottom up approach based on RiskCalc Corporate model
Link the financial statement inputs as well as CCA factors to macro variables
Validation results show that the predicted values line up well with the realized values
The model provide meaningful variations across different stress scenarios
Users can provide customized scenarios
Conclusion
55

Q&A
4

57
Join us this year for our largest conference yet!
• Learn from your peers how regulation has driven risk management best practices within their organizations
• Hear from industry, regulatory, academic and economic experts how a firm’s practices can produce business benefits well beyond compliance
• Network with 250+ senior risk management executives from the industry
• Build knowledge and gain CPE Credits
• Explore Moody’s Analytics award-winning solutions, and roadmap for future enhancements
New Location for 2013 – Beautiful Scottsdale, Arizona!

moodys.com
Douglas Dwyer, Ph.D.Managing Director, RiskCalc Research [email protected]
Christian HenkelDirector, Enterprise Risk [email protected]
Mehna RaissiDirector , RiskCalc Product [email protected]

moodys.com
© 2013 Moody’s Analytics, Inc. and/or its licensors and affiliates (collectively, “MOODY’S”). All rights reserved. ALL INFORMATION CONTAINED HEREIN IS PROTECTED BY COPYRIGHT LAW AND NONE OF SUCH INFORMATION MAY BE COPIED OR OTHERWISE REPRODUCED, REPACKAGED, FURTHER TRANSMITTED, TRANSFERRED, DISSEMINATED, REDISTRIBUTED OR RESOLD, OR STORED FOR SUBSEQUENT USE FOR ANY SUCH PURPOSE, IN WHOLE OR IN PART, IN ANY FORM OR MANNER OR BY ANY MEANS WHATSOEVER, BY ANY PERSON WITHOUT MOODY’S PRIOR WRITTEN CONSENT. All information contained herein is obtained by MOODY’S from sources believed by it to be accurate and reliable. Because of the possibility of human or mechanical error as well as other factors, however, all information contained herein is provided “AS IS” without warranty of any kind. Under no circumstances shall MOODY’S have any liability to any person or entity for (a) any loss or damage in whole or in part caused by, resulting from, or relating to, any error (negligent or otherwise) or other circumstance or contingency within or outside the control of MOODY’S or any of its directors, officers, employees or agents in connection with the procurement, collection, compilation, analysis, interpretation, communication, publication or delivery of any such information, or (b) any direct, indirect, special, consequential, compensatory or incidental damages whatsoever (including without limitation, lost profits), even if MOODY’S is advised in advance of the possibility of such damages, resulting from the use of or inability to use, any such information. The credit ratings, financial reporting analysis, projections, and other observations, if any, constituting part of the information contained herein are, and must be construed solely as, statements of opinion and not statements of fact or recommendations to purchase, sell or hold any securities. NO WARRANTY, EXPRESS OR IMPLIED, AS TO THE ACCURACY, TIMELINESS, COMPLETENESS, MERCHANTABILITY OR FITNESS FOR ANY PARTICULAR PURPOSE OF ANY SUCH RATING OR OTHER OPINION OR INFORMATION IS GIVEN OR MADE BY MOODY’S IN ANY FORM OR MANNER WHATSOEVER. Each rating or other opinion must be weighed solely as one factor in any investment decision made by or on behalf of any user of the information contained herein, and each such user must accordingly make its own study and evaluation of each security and of each issuer and guarantor of, and each provider of credit support for, each security that it may consider purchasing, holding, or selling.