Embed Size (px)
Citation preview

Best Practices for Monitoring VMware with SCOMAlec King
Cameron Fuller
Pete Zerger
Vice President Product Management at Veeam Software
Microsoft System Center MVP
Microsoft System Center MVP
Best Practices for Monitoring VMware with SCOM
2© 2015 Veeam Software
ContentsMonitor with the Private Cloud Fabric in Mind . . . . . . . . . . . . . . . . . . . . . . . . . . . . . . . . . . . . . . . . . . . 4
Consider Data Sources and Solution Architectures . . . . . . . . . . . . . . . . . . . . . . . . . . . . . . . . . . . . . . . 8
Sort the Actionable Alerts from Alert Noise . . . . . . . . . . . . . . . . . . . . . . . . . . . . . . . . . . . . . . . . . . . . . 10
Understand OpsMgr Override Behavior and Best Practices . . . . . . . . . . . . . . . . . . . . . . . . . . . . . . 11
Override Precedence . . . . . . . . . . . . . . . . . . . . . . . . . . . . . . . . . . . . . . . . . . . . . . . . . . . . . . . . . . . . . . . . . . . . . . . . . . 11
Best Practices . . . . . . . . . . . . . . . . . . . . . . . . . . . . . . . . . . . . . . . . . . . . . . . . . . . . . . . . . . . . . . . . . . . . . . . . . . . . . . . . . . 12
Create a Dynamic User Experience . . . . . . . . . . . . . . . . . . . . . . . . . . . . . . . . . . . . . . . . . . . . . . . . . . . . . 13
Provide Reporting for Trending, Capacity Planning and Forecasting . . . . . . . . . . . . . . . . . . . . . . 15
Types of Reports . . . . . . . . . . . . . . . . . . . . . . . . . . . . . . . . . . . . . . . . . . . . . . . . . . . . . . . . . . . . . . . . . . . . . . . . . . . . . . 16
Veeam VMware Capacity Planning Reports . . . . . . . . . . . . . . . . . . . . . . . . . . . . . . . . . . . . . . . . . . . . . . . . . . . . 16
Analysis Reports . . . . . . . . . . . . . . . . . . . . . . . . . . . . . . . . . . . . . . . . . . . . . . . . . . . . . . . . . . . . . . . . . . . . . . . . . . . . . . . 17
The Importance of Right-sizing . . . . . . . . . . . . . . . . . . . . . . . . . . . . . . . . . . . . . . . . . . . . . . . . . . . . . . . . . . . 20
Veeam VMware Performance History Report . . . . . . . . . . . . . . . . . . . . . . . . . . . . . . . . . . . . . . . . . . . . . . . . . . . 22
Conclusion . . . . . . . . . . . . . . . . . . . . . . . . . . . . . . . . . . . . . . . . . . . . . . . . . . . . . . . . . . . . . . . . . . . . . . . . . . . 22
About the Authors . . . . . . . . . . . . . . . . . . . . . . . . . . . . . . . . . . . . . . . . . . . . . . . . . . . . . . . . . . . . . . . . . . . . 23
About Veeam Software . . . . . . . . . . . . . . . . . . . . . . . . . . . . . . . . . . . . . . . . . . . . . . . . . . . . . . . . . . . . . . . 23
Best Practices for Monitoring VMware with SCOM
3© 2015 Veeam Software
When it comes to deploying VMware vSphere as the foundation of a private cloud infrastructure, a
primary objective is to reduce costs through increased operational efficiency and capital utilization .
When an organization deploys an enterprise management system such as Microsoft System Center
OpsMgr (Operations Manager), it makes substantial capital and operational investments in order to
reduce downtime and keep the IT infrastructure running smoothly . When introducing VMware vSphere,
it is incumbent on OpsMgr administrators to integrate monitoring and management of the new private
cloud infrastructure and applications with minimal impact . An ideal solution provides physical and
virtual system monitoring from the comfort of the OpsMgr interface . Leveraging a vSphere monitoring
solution that eliminates the need for OpsMgr administrators and operators to learn yet another tool can
also eliminate the need for a separate VMware monitoring team, a separate monitoring platform and
additional training investments .
For OS (operating system), application software and health monitoring, OpsMgr uses the Microsoft
Monitoring Agent, which is called the OpsMgr agent in this white paper . The assumption is that
through OS monitoring, the OpsMgr agent can determine the utilization of the underlying hardware .
However, with virtualization, the one-to-one OS/hardware link is broken . This means an OpsMgr agent
running in the OS can no longer determine the performance of the underlying hardware system . Only
the hypervisor can provide a true picture of hardware utilization and the resources provided to each
VM (virtual machine) and guest OS . While deploying an OpsMgr agent on a VM can provide valuable
information about application performance, it provides an incomplete picture of the VM and guest OS
because the OpsMgr agent treats the VM as a physical machine .
In addition, there are many aspects of the virtual infrastructure that are not visible to the OpsMgr agent
and, therefore, not visible to OpsMgr, including:
• vSphere-specific metrics for the VM, such as balloon memory and CPU (central processing unit) wait time
• Important components of vSphere, including ESX(i) hosts, clusters and vCenter Server
• Automation within vSphere directly affecting VMs, such as DRS (Distributed Resource Scheduler),
vMotion and HA (High Availability)
Without visibility of vSphere as a whole, it is impossible to monitor ESX(i) host performance, physical
hardware status, VM status and location (e .g ., the ESX(i) host where a VM is running, where a VM’s
storage is located), and other critical aspects of vSphere .
When choosing and implementing a vSphere monitoring solution for OpsMgr, approach the challenge
with these tenants in mind to ensure success:
1 . Monitor with the private cloud fabric in mind
2 . Consider data sources and solution architectures
3 . Sort actionable alerts from alert noise
4 . Understand OpsMgr override behavior and best practices
5 . Create a dynamic user experience
6 . Provide reporting for trending, capacity planning and forecasting
Best Practices for Monitoring VMware with SCOM
4© 2015 Veeam Software
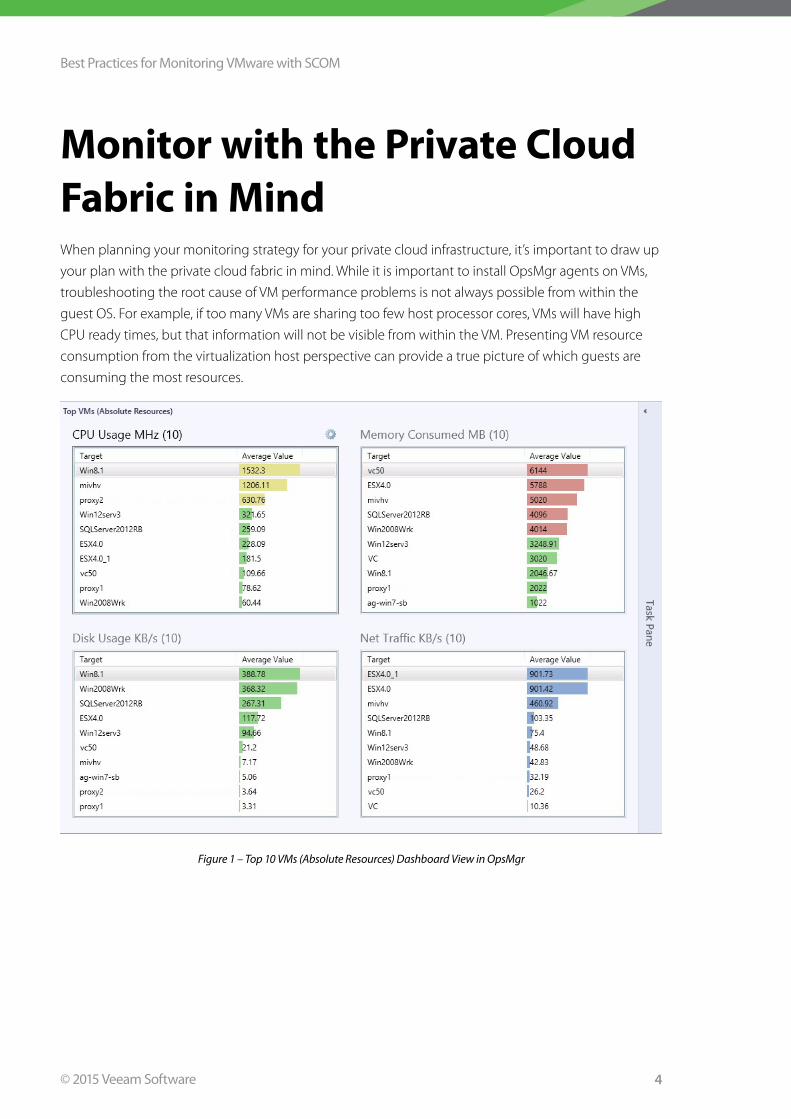
Monitor with the Private Cloud Fabric in MindWhen planning your monitoring strategy for your private cloud infrastructure, it’s important to draw up
your plan with the private cloud fabric in mind . While it is important to install OpsMgr agents on VMs,
troubleshooting the root cause of VM performance problems is not always possible from within the
guest OS . For example, if too many VMs are sharing too few host processor cores, VMs will have high
CPU ready times, but that information will not be visible from within the VM . Presenting VM resource
consumption from the virtualization host perspective can provide a true picture of which guests are
consuming the most resources .
Figure 1 – Top 10 VMs (Absolute Resources) Dashboard View in OpsMgr
Best Practices for Monitoring VMware with SCOM
5© 2015 Veeam Software
To spot VM performance problems resulting from a vSphere configuration issue, you have to monitor
VM performance from a host perspective . vSphere contains a number of performance counters that
can be used to identify configuration issues based on guest performance .
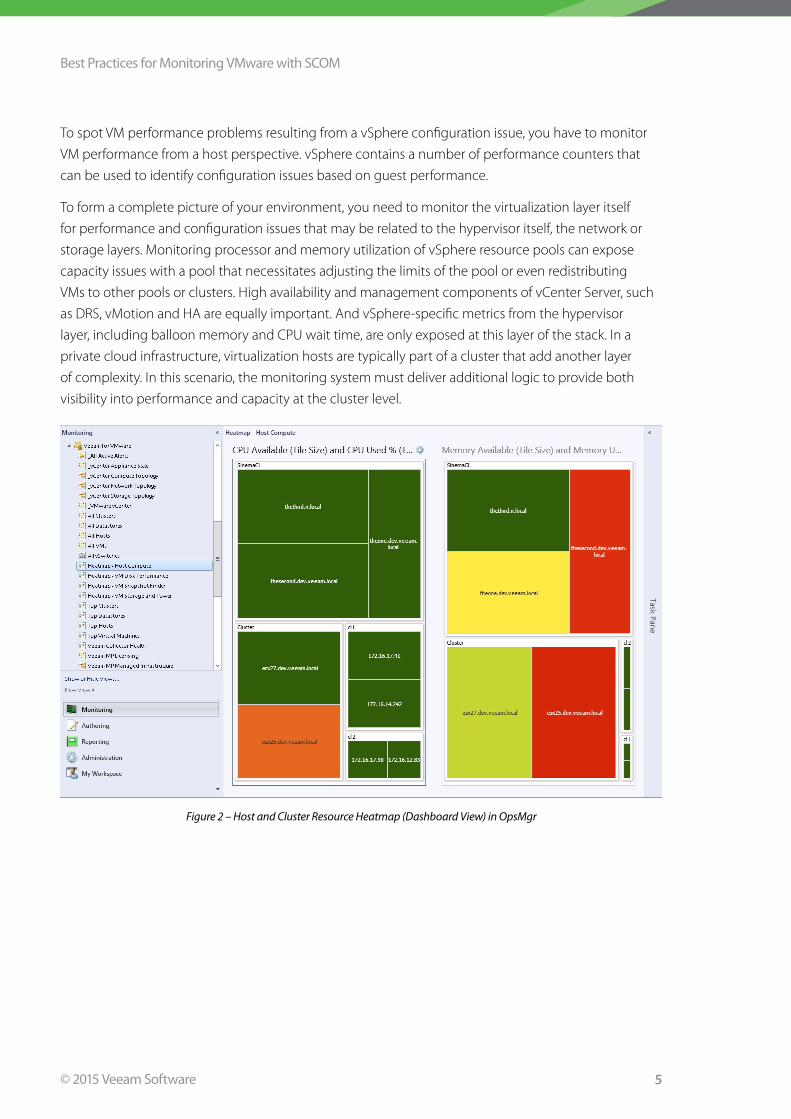
To form a complete picture of your environment, you need to monitor the virtualization layer itself
for performance and configuration issues that may be related to the hypervisor itself, the network or
storage layers . Monitoring processor and memory utilization of vSphere resource pools can expose
capacity issues with a pool that necessitates adjusting the limits of the pool or even redistributing
VMs to other pools or clusters . High availability and management components of vCenter Server, such
as DRS, vMotion and HA are equally important . And vSphere-specific metrics from the hypervisor
layer, including balloon memory and CPU wait time, are only exposed at this layer of the stack . In a
private cloud infrastructure, virtualization hosts are typically part of a cluster that add another layer
of complexity . In this scenario, the monitoring system must deliver additional logic to provide both
visibility into performance and capacity at the cluster level .
Figure 2 – Host and Cluster Resource Heatmap (Dashboard View) in OpsMgr
Best Practices for Monitoring VMware with SCOM
6© 2015 Veeam Software
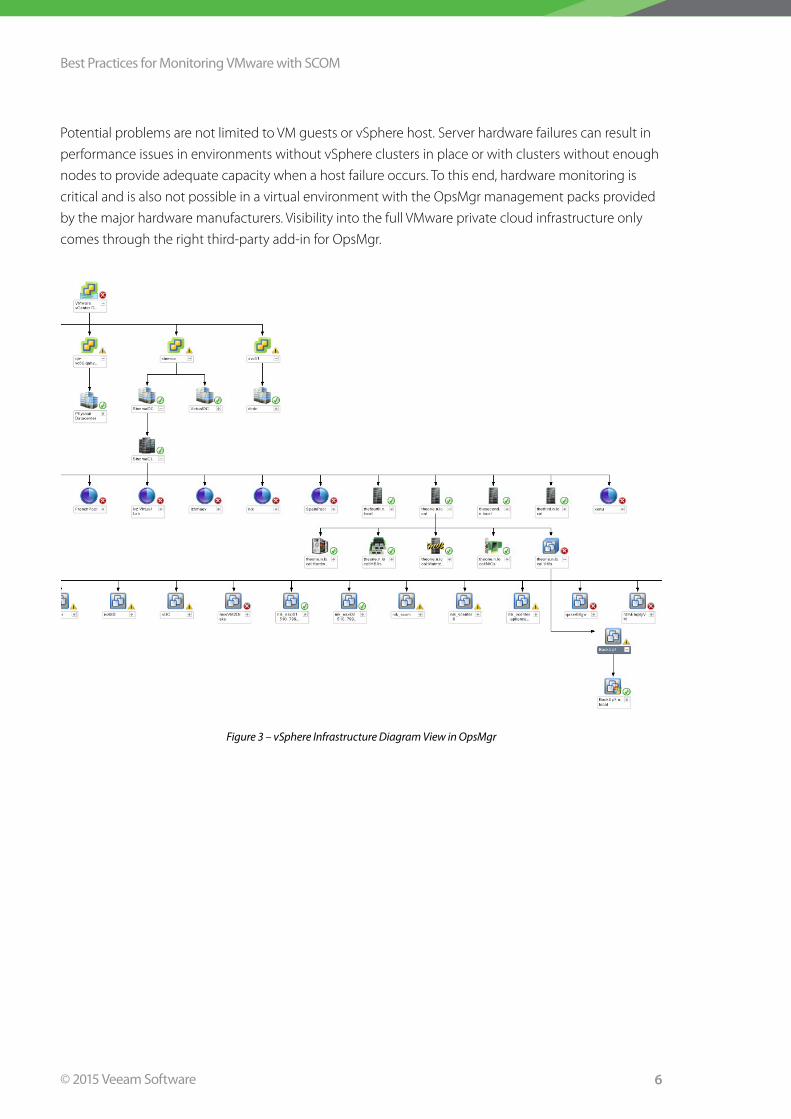
Potential problems are not limited to VM guests or vSphere host . Server hardware failures can result in
performance issues in environments without vSphere clusters in place or with clusters without enough
nodes to provide adequate capacity when a host failure occurs . To this end, hardware monitoring is
critical and is also not possible in a virtual environment with the OpsMgr management packs provided
by the major hardware manufacturers . Visibility into the full VMware private cloud infrastructure only
comes through the right third-party add-in for OpsMgr .
Figure 3 – vSphere Infrastructure Diagram View in OpsMgr
Best Practices for Monitoring VMware with SCOM
7© 2015 Veeam Software
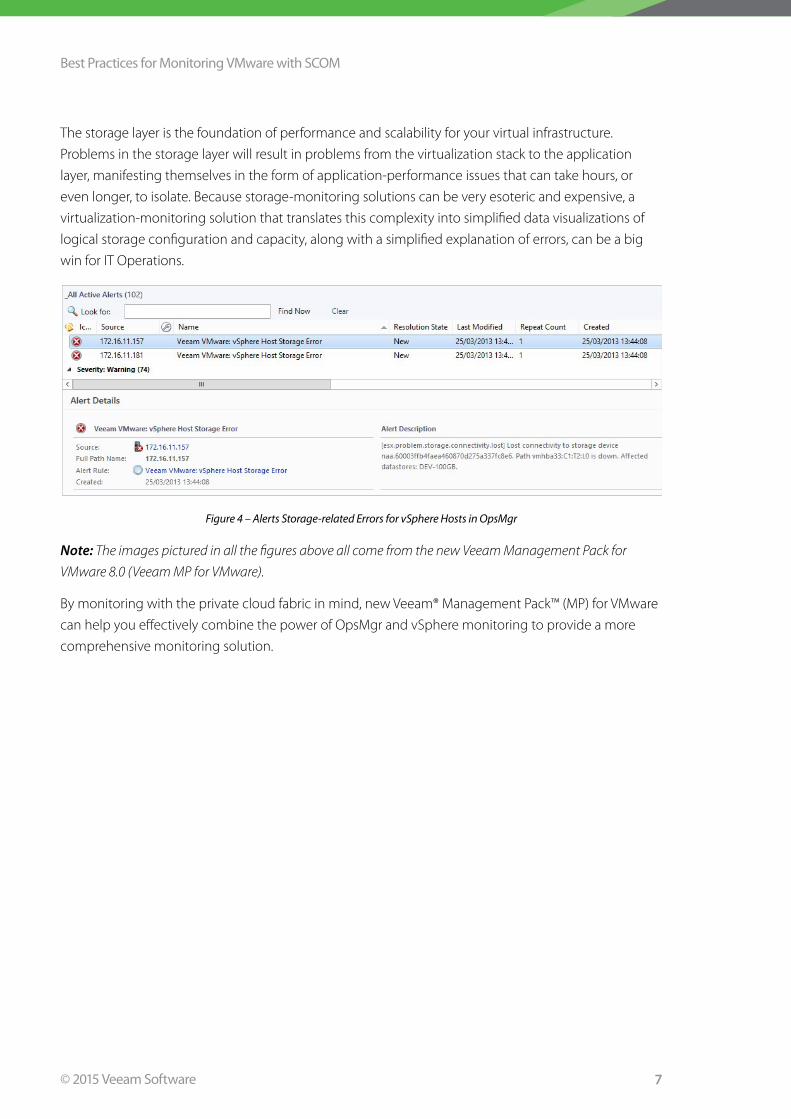
The storage layer is the foundation of performance and scalability for your virtual infrastructure .
Problems in the storage layer will result in problems from the virtualization stack to the application
layer, manifesting themselves in the form of application-performance issues that can take hours, or
even longer, to isolate . Because storage-monitoring solutions can be very esoteric and expensive, a
virtualization-monitoring solution that translates this complexity into simplified data visualizations of
logical storage configuration and capacity, along with a simplified explanation of errors, can be a big
win for IT Operations .
Figure 4 – Alerts Storage-related Errors for vSphere Hosts in OpsMgr
Note: The images pictured in all the figures above all come from the new Veeam Management Pack for
VMware 8.0 (Veeam MP for VMware).
By monitoring with the private cloud fabric in mind, new Veeam® Management Pack™ (MP) for VMware
can help you effectively combine the power of OpsMgr and vSphere monitoring to provide a more
comprehensive monitoring solution .
Best Practices for Monitoring VMware with SCOM
8© 2015 Veeam Software
Consider Data Sources and Solution Architectures As a critical component of the dynamic datacenter, vSphere requires the same level of monitoring as the
Microsoft Windows infrastructure . To access information about vSphere, there are a variety of data sources
you can tap into . It is important to understand which sources expose the data needed to quickly identify and
isolate common issues, and do so in an efficient manner . Below is a summary of the available data sources for
extracting vSphere performance data, as well as the pros and cons of each approach:
• SNMP — vSphere is SNMP-enabled, and SNMP monitoring is configurable through the System
Center Operations Console UI (user interface) . However, many vSphere 5.x and 6.x events and
performance metrics are not exposed via SNMP. VMware is no longer focusing on management via SNMP.
• Syslog — Syslog messages from vSphere are a rich source of hardware monitoring data, and rules
that utilize Syslog can be configured using the UI wizards in the System Center Operations Console .
However, messages tend to be cryptic, and most (if not all) are of little use to most operators without
translation to a human-interpretable error message. This interpretation can be a time-consuming process.
• vmcontrol-based APIs (including vmPerl / vmCOM) — COM was deprecated some years ago, so
you should avoid using this altogether . While vSphere does offer an SDK for Perl, Perl is not a Windows-
friendly option, and is probably the least-documented, in terms of samples on the internet.
• VSphere API (a web service, requires vCenter Server) — This is the richest source of vSphere
performance data with the lowest impact on host and guest performance . It provides the most complete
picture of infrastructure/application performance and health, with the best scalability from a vSphere perspective.
Although there are also various methods available for monitoring servers in the virtual infrastructure, it
is crucial to choose a technical solution that is both supported by VMware and also scalable . Here are
characteristics of common technical approaches, plus their pros and cons:
• Using only SSH, SNMP or Syslog presents problems, including:
• Incomplete picture of system health
• Impact on hypervisor stability
• No assurance of future compatibility with VMware innovations
Best Practices for Monitoring VMware with SCOM
9© 2015 Veeam Software
• Solutions based on installing a Linux-style agent in the ESX Host COS (Console Operating System)
result in the issues mentioned above . They also take you to territory that’s unsupported by VMware .
VMware dropped development of ESX in the 4 .x releases and now uses ESXi . Because ESXi does not
include a Linux kernel, it makes this strategy untenable . .
• Standalone solutions for vSphere monitoring often only provide limited, out of-the-box integration
with OpsMgr, and require additional consoles, databases and configuration utilities to work . This breeds
inefficiency in administrative effort, contributes to console sprawl and results in swivel-chair management
due to multiple management consoles . Too many consoles and you’ll risk a sprained neck!
Understanding what data sources and solution architectures are available provides key insights into
how vSphere should be monitored in OpsMgr .
Best Practices for Monitoring VMware with SCOM
10© 2015 Veeam Software
Sort the Actionable Alerts from Alert NoiseWhy do we need to tune OpsMgr? One of the primary goals of OpsMgr is to provide proactive
monitoring . This basically means to catch the little problems before they become major issues that
cause service interruptions . This approach leads to increased key application and physical or virtual
server availability and an overall better user experience . To provide proactive monitoring, OpsMgr
needs to identify potential problems and provide administrators with a mechanism to receive
notifications when these conditions occur .
Despite OpsMgr providing actionable alerts that are serious enough to spur corrective action, OpsMgr
is often criticized because the actionable alerts are too noisy . This is a real Catch-22 for Microsoft . The
goal of OpsMgr is to notify admin about issues and Microsoft accomplishes this goal by sending alerts
about smaller issues before they become major problems . On the one hand, if OpsMgr does not provide
alerts for these situations, it is not doing its job . Yet, at the same time, and in some environments at
least, if OpsMgr does provide these alerts, it’s criticized for being too noisy . Hard to win .
Noise is generated when alerts (usually sent by email) are created by OpsMgr for situations that are not
actionable, relevant or unique (or are duplicates) .
When someone tells you OpsMgr is noisy, keep the following in mind:
1 . Not all alerts generated by OpsMgr are sent to recipients by email . Alerts can be generated that are only
displayed in the OpsMgr console and not included in subscriptions for OpsMgr notifications . These alerts might
be relevant for the OpsMgr admin, but would not necessarily require email notification when they occur .
2 . One organization’s noise might be another organization’s critical alerts . OpsMgr management packs are
designed to be used by organizations that range from relatively small to large enterprise environments .
For example, in the Exchange management pack, a queue threshold of 10 might be valid for a small
organization, yet not for a large one . Likewise, the loss of a default website might be critical for one
organization, but totally irrelevant for another because it did not use the default website .
The bottom line? The definition of noise varies widely from one environment to another . To get your OpsMgr
infrastructure in a happy state, it’s necessary to establish your own definition of noise and then tune accordingly .
3 . Proper OpsMgr tuning that meets the needs of your organization is a requirement that takes time . Using
groups is a key component to effectively tune your environment . By creating groups of VMs and VM
hosts that correspond to various support teams in your organization, you can limit the alerts presented
in the console and sent by email only to those groups emanating from the vSphere infrastructure used
applications and services under the care of a specific support team . We’ll discuss tips and techniques for
implementing this principal in the section titled Creating a Dynamic User Experience .
Tuning OpsMgr can limit the noise in the environment and generate more actionable notifications . By
providing actionable alerting, you’ll increase the likelihood that notifications will be both sent and acted on .
Best Practices for Monitoring VMware with SCOM
11© 2015 Veeam Software
Understand OpsMgr Override Behavior and Best Practices Overrides are used to enable, disable or modify monitoring elements in a management pack such
as rules, monitors, discoveries and more . As mentioned above, while groups can be used to provide
granularity within OpsMgr notification subscriptions, they are good for more than just notifications .
While groups are an integral part of OpsMgr environment tuning, it’s also possible to overuse groups
when tuning your OpsMgr infrastructure .
To most effectively follow Microsoft best practices, it helps to understand the rules of the road for override
behavior when multiple overrides are present on a single rule, monitor or discovery, which is known as
override precedence . There are also a few field-tested best practices for working with overrides in OpsMgr .
Override Precedence The RMS (root management server) emulator uses the following criteria to determine which override
takes precedence when multiple overrides apply to a specific target’s workflow for:
• The most-specific override takes precedence.
• An override targeted to a group takes precedence over an override targeted to a class. For
example, an override targeted to Windows Server 2008 Computers group wins over an override
targeted to the Windows Server 2008 class, because the group contains a subset of the instances
of the class and is a more specific target .
• An override targeted to an instance takes precedence over an override targeted to a
group. For example, an override targeted to Server1 wins over an override targeted to the
Windows Server 2012 Computers group, because the instance is the more specific object .
• An enforced override takes precedence over a non-enforced override. For example, an
enforced override targeted to a class wins over a non-enforced override targeted to a class .
• Overrides in unsealed management packs take precedence over overrides in sealed
management packs. This allows the administrator to better control settings in cases when an
author has included overrides in a sealed management pack .
• Class overrides from contained or hosted instances take precedence over class overrides
of the instance. For example, assume you have a database called Orders, in the class Database,
which is hosted in a distributed application called OrderSystem (which is also a single class called
OrderSystem) . If you have a separate class that overrides a targeted to Database and OrderSystem,
the OrderSystem class takes precedence . In this case, the database is specialized because it is a
database in the OrderSystem that’s a distributed application, which makes it a more specific target
than the database by itself .
Best Practices for Monitoring VMware with SCOM
12© 2015 Veeam Software
• Instance overrides with the greater relative depth take precedence over those with
a lower depth. An override for a class such as a Windows Server 2012 Hardware Component wins
over an instance override of a Windows Server Hardware Component, again because Windows
Server 2012 Hardware Component is more specific .
• Random Selection. When all arbitration criteria is exhausted, the RMS emulator will choose an
override at random . It’s very important to never create so many similar overrides that random
selection is the only way OpsMgr can choose an effective override . One way to prevent this from
happening is to avoid creating group overrides for multiple groups containing some of the same
computers as members .
Overrides are the method by which OpsMgr is customized to better meet your environment’s
specific requirements . Understanding overrides and how their precedence works is important when
customizing your OpsMgr environment .
Best Practices The following best practices apply to tuning OpsMgr using overrides:
• Use classes where possible. If a class already exists that meets your requirements, use the
class instead of a custom group, unless you need to create the group for other reasons such as
customizing the user experience .
• Target overrides to a group versus an entity. Target overrides to a group whenever possible .
Using groups allows these overrides to be portable so that they can be moved between OpsMgr
environments . This approach also minimizes the number of overrides required by gathering similar
systems and applying a single override to the group .
• Use dynamic groups when possible. Static groups require maintenance to add and remove
members of the group as agents are deployed or removed from the environment . Dynamic groups
do not require this added maintenance, as group membership is updated automatically as new
infrastructure is added to OpsMgr for monitoring .
Follow Microsoft best practices on overrides. You can view Microsoft’s best practices on
overrides by visiting the Microsoft website here: Best practices to use when you configure
overrides in System Center Operations Manager,
• Create groups for entities that are relevant to your environment. Groups can contain any entity
type and not just servers . Once the IIS (Internet Information Services) management pack has been
installed, OpsMgr will automatically provide an alert when the default application pool or website
is not running . While it is recommended to remove these websites and application pools, another
option is to generate a group containing entities that match the name and then disable the monitor
for that group of entities .
Following best practices and targeting overrides to groups are important when it comes to tuning
your OpsMgr environment .
Best Practices for Monitoring VMware with SCOM
13© 2015 Veeam Software
Create a Dynamic User ExperienceThe OpsMgr console needs to be targeted so that when a user accesses the console, the user only sees
information that’s relevant to him or her, including servers and applications . The same user groups are
utilized in notifications .
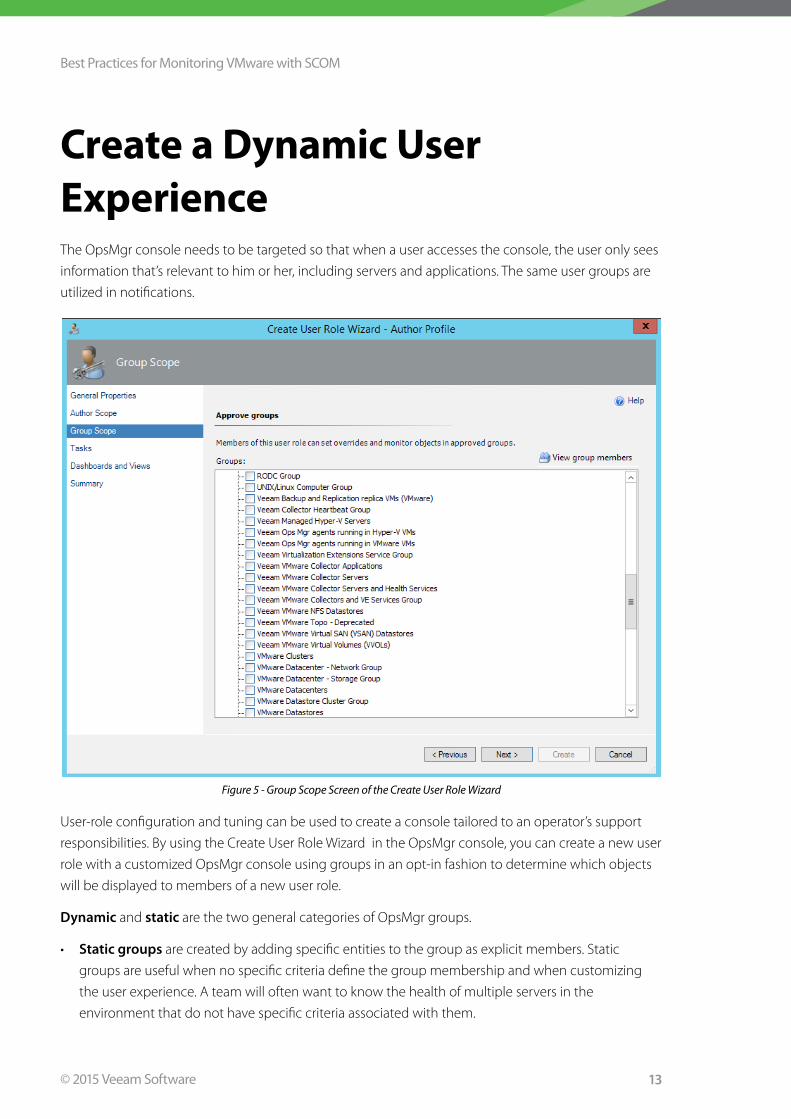
Figure 5 - Group Scope Screen of the Create User Role Wizard
User-role configuration and tuning can be used to create a console tailored to an operator’s support
responsibilities . By using the Create User Role Wizard in the OpsMgr console, you can create a new user
role with a customized OpsMgr console using groups in an opt-in fashion to determine which objects
will be displayed to members of a new user role .
Dynamic and static are the two general categories of OpsMgr groups .
• Static groups are created by adding specific entities to the group as explicit members . Static
groups are useful when no specific criteria define the group membership and when customizing
the user experience . A team will often want to know the health of multiple servers in the
environment that do not have specific criteria associated with them .
Best Practices for Monitoring VMware with SCOM
14© 2015 Veeam Software
• Dynamic groups are created by identifying criteria that define what entities are members of the
group . Entities matching those criteria are automatically added to the group . Dynamic groups allow
you to adjust a setting once and then take comfort in knowing it will be applied automatically
as new entities are added and removed . Most Microsoft-authored management packs contain
dynamic groups . For example, the IIS management pack identifies servers that have IIS installed
and then adds them to the IIS Computer Group . Groups in OpsMgr can contain more than just
computers . You can create dynamic groups containing objects of any type, such as websites or SQL
Server databases .
For more field-tested tips and tricks for creating a customized console experience, read the blog:
How to Use Customized Groups to Simplify the OpsMgr Console for Server Owners .
Veeam MP for VMware includes multiple dynamic groups that populate based on the entities
available in the environment, such as vSphere clusters, ESX(i) Host Servers, guests, vCenter Servers
and Virtual Applications .
Groups in OpsMgr are extremely flexible and can provide functionality critical to an OpsMgr environment .
For tips and tricks in leveraging the power of groups in OpsMgr, check out the 2011 white paper, How
to manage System Center Operations Manager using Groups, available on the Veeam website . Even
though the white paper was published a few years ago, the strategies are still relevant .
Best Practices for Monitoring VMware with SCOM
15© 2015 Veeam Software
Provide Reporting for Trending, Capacity Planning and ForecastingThe OpsMgr Data Warehouse provides the ability to generate reports, which show trends over a
significant period of time . Although the Data Warehouse retrains performance data by default for 400
days (approximately 1 year and one month), retention periods can be altered to match your business
requirements . In some organizations such as those in the retail industry, for example, 400 days may
not be sufficient since it may be required to provide trending over multiple holiday shopping seasons .
To meet this requirement, the data retention could be increased to store data for 800 days or more, as
long as the Data Warehouse has been sized on the correct hardware and it has sufficient storage space .
A solution for monitoring a VMware environment should retain data in the Data Warehouse to identify
VMware environment trends and determine when additional capacity will be required . For example,
by integrating performance data from VMware into Operations Manager, you can use the existing
reporting functionality to provide a trend for custom metrics, such as CPU Wait Time, and determine if
additional capacity is required .
OpsMgr is also designed to provide proactive monitoring to identify and resolve issues before they impact
users . For example, it’s always better to know if the drive that contains your Exchange server mailbox stores is
about to run out of space beforehand, as opposed to finding out it has run out of space and is dismounting
the mailbox stores . For OpsMgr, this translates into a need to not only see trends on performance metrics,
but also to forecast on metrics based upon the history of the data . In the end, OpsMgr was not designed or
instrumented to provide a rich capacity planning and forecasting solution . There are no off-the-shelf reports in
OpsMgr that provide projections of future-resource consumption .
Veeam MP for VMware, however, maintains a complete history of all objects, settings and changes .
Veeam MP helps you take the guesswork out of capacity planning by forecasting when CPU, memory
and storage utilization will reach your defined thresholds . Armed with knowledge of your virtual
environment’s configuration and its past and current utilization, Veeam MP for VMware makes
recommendations for resource allocations and acquisitions . You can even perform what-if analyses
to evaluate the impact of adding or removing hosts and VMs . When new hardware purchases are
necessary, Veeam MP also gives you recommendations, justifications and the confidence you need to
go to management for funding .
Through the OpsMgr framework, coupled with the data from VMware, and supplemented with the
forecasting and capacity planning capabilities of Veeam MP for VMware, you can take a more proactive
approach to planning your capacity and identifying and resolving bottlenecks before they impact your
environment .
Best Practices for Monitoring VMware with SCOM
16© 2015 Veeam Software
Types of Reports Veeam MP for VMware includes a comprehensive set of proprietary reports with rich functionality,
exceeding that of native Ops Mgr reports . There are three report packs included with the Veeam MP for
VMware, which are described here below .
Veeam VMware Capacity Planning Reports
This report pack contains performance forecasting, trending and modeling reports . The capacity
planning reports will help you avoid possible bottlenecks, maintain a sufficient resource level and
ensure your virtual environment stays in a healthy state .
Veeam VMware Analysis Reports
This report pack contains valuable reports for analyzing and optimizing your vSphere environment
such as right-sizing VMs, finding Idle VMs and finding misused and overprovisioned storage .
Veeam VMware Performance History Reports
This report pack contains a full library of reports about the many available metrics in Veeam MP for
VMware, featuring Top/Bottom Contained Objects . Performance history reports are designed to help
you evaluate resource utilization efficiency and quickly detect top or bottom resource consumers .
Veeam VMware Capacity Planning Reports This report pack includes reports that help you to analyze health and performance of virtual
infrastructure objects, evaluate the efficiency of resource utilization and optimize resource provisioning .
The Veeam VMware Capacity Planning Reports contains the following reports:
• Host Failure Modeling
• Performance Forecast for Datastores
• Performance Forecast for vSphere Clusters
• What-if VM Deployment Planning for VMware (manual resource entry)
• What-If VM Deployment Planning for VMware (model existing VMs)
Best Practices for Monitoring VMware with SCOM
17© 2015 Veeam Software
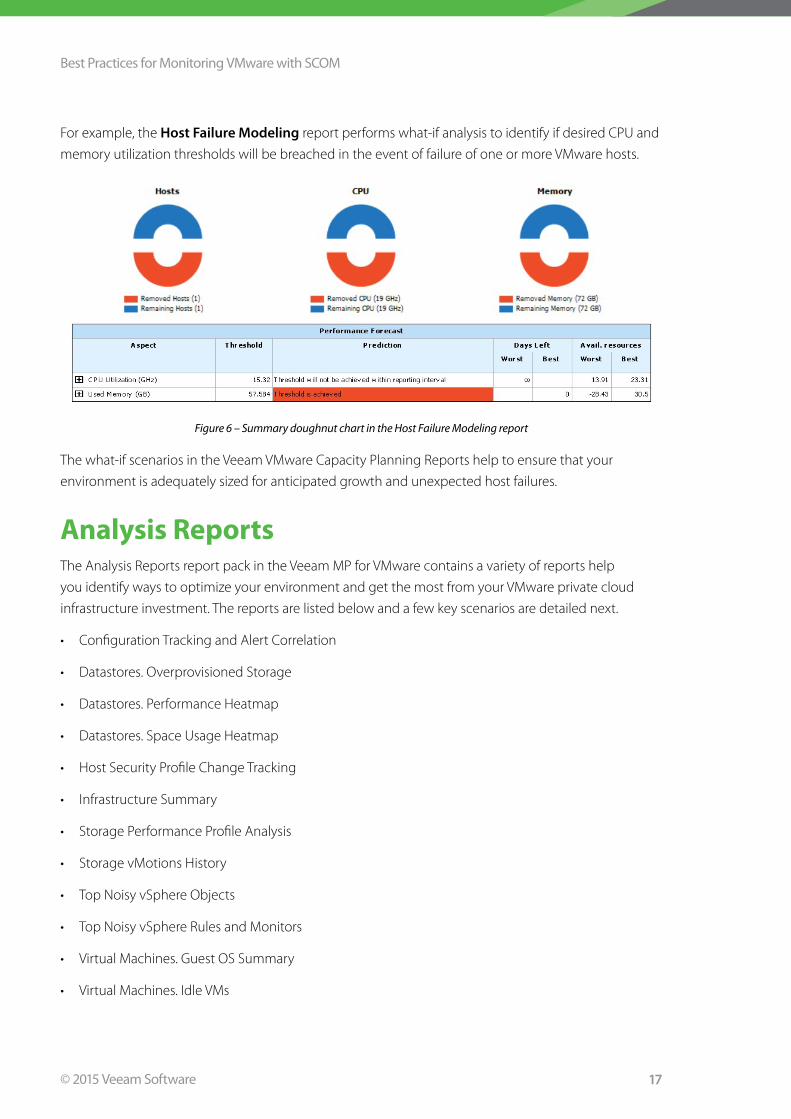
For example, the Host Failure Modeling report performs what-if analysis to identify if desired CPU and
memory utilization thresholds will be breached in the event of failure of one or more VMware hosts .
Figure 6 – Summary doughnut chart in the Host Failure Modeling report
The what-if scenarios in the Veeam VMware Capacity Planning Reports help to ensure that your
environment is adequately sized for anticipated growth and unexpected host failures .
Analysis Reports The Analysis Reports report pack in the Veeam MP for VMware contains a variety of reports help
you identify ways to optimize your environment and get the most from your VMware private cloud
infrastructure investment . The reports are listed below and a few key scenarios are detailed next .
• Configuration Tracking and Alert Correlation
• Datastores . Overprovisioned Storage
• Datastores . Performance Heatmap
• Datastores . Space Usage Heatmap
• Host Security Profile Change Tracking
• Infrastructure Summary
• Storage Performance Profile Analysis
• Storage vMotions History
• Top Noisy vSphere Objects
• Top Noisy vSphere Rules and Monitors
• Virtual Machines . Guest OS Summary
• Virtual Machines . Idle VMs
Best Practices for Monitoring VMware with SCOM
18© 2015 Veeam Software
• Virtual Machines . Right-sizing – VMs Oversized for Memory and CPU
• Virtual Machines . Right-sizing – VMs Oversized for Memory and CPU (Ops Mgr agent data)
• Virtual Machines . Right-sizing – VMs Undersized for Memory and CPU
• Virtual Machines . Right-sizing – VMs Undersized for Memory and CPU (Ops Mgr agent data)
• Virtual Machines . Snapshot Summary
• Virtual Machines . Switched-off VMs
• Virtual Machines . Uptime Statistics
• vMotions History
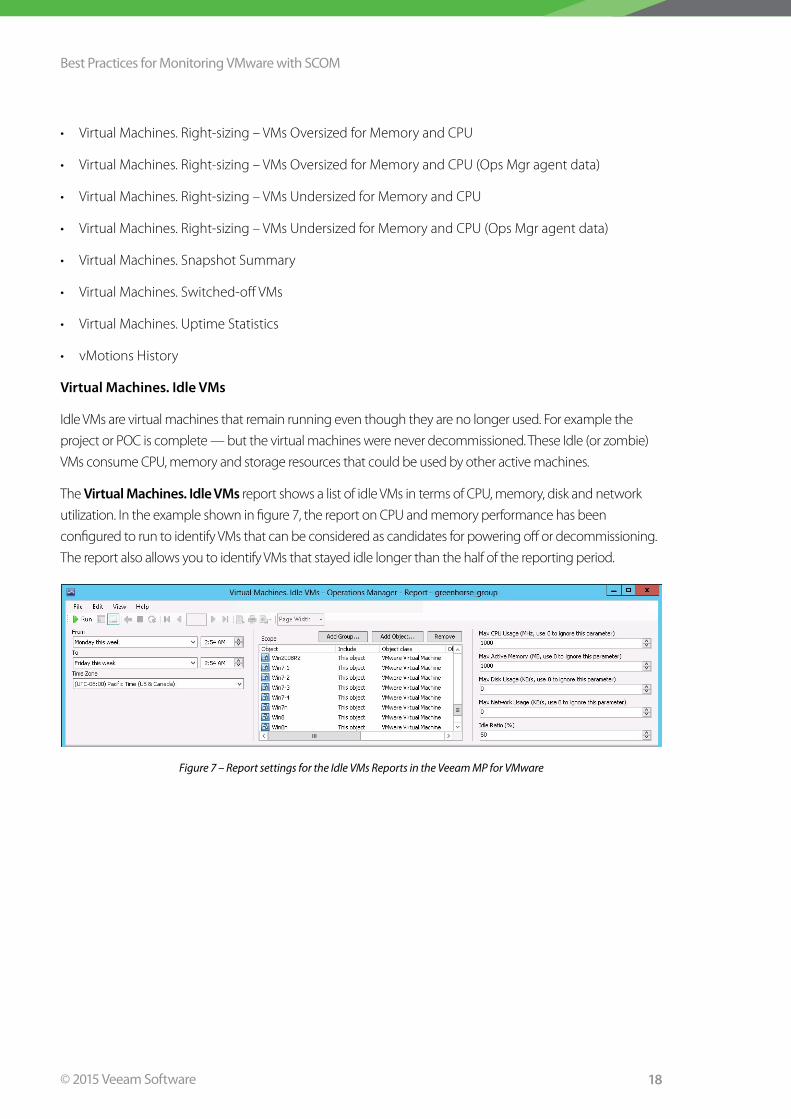
Virtual Machines. Idle VMs
Idle VMs are virtual machines that remain running even though they are no longer used . For example the
project or POC is complete — but the virtual machines were never decommissioned . These Idle (or zombie)
VMs consume CPU, memory and storage resources that could be used by other active machines .
The Virtual Machines. Idle VMs report shows a list of idle VMs in terms of CPU, memory, disk and network
utilization . In the example shown in figure 7, the report on CPU and memory performance has been
configured to run to identify VMs that can be considered as candidates for powering off or decommissioning .
The report also allows you to identify VMs that stayed idle longer than the half of the reporting period .
Figure 7 – Report settings for the Idle VMs Reports in the Veeam MP for VMware
Best Practices for Monitoring VMware with SCOM
19© 2015 Veeam Software
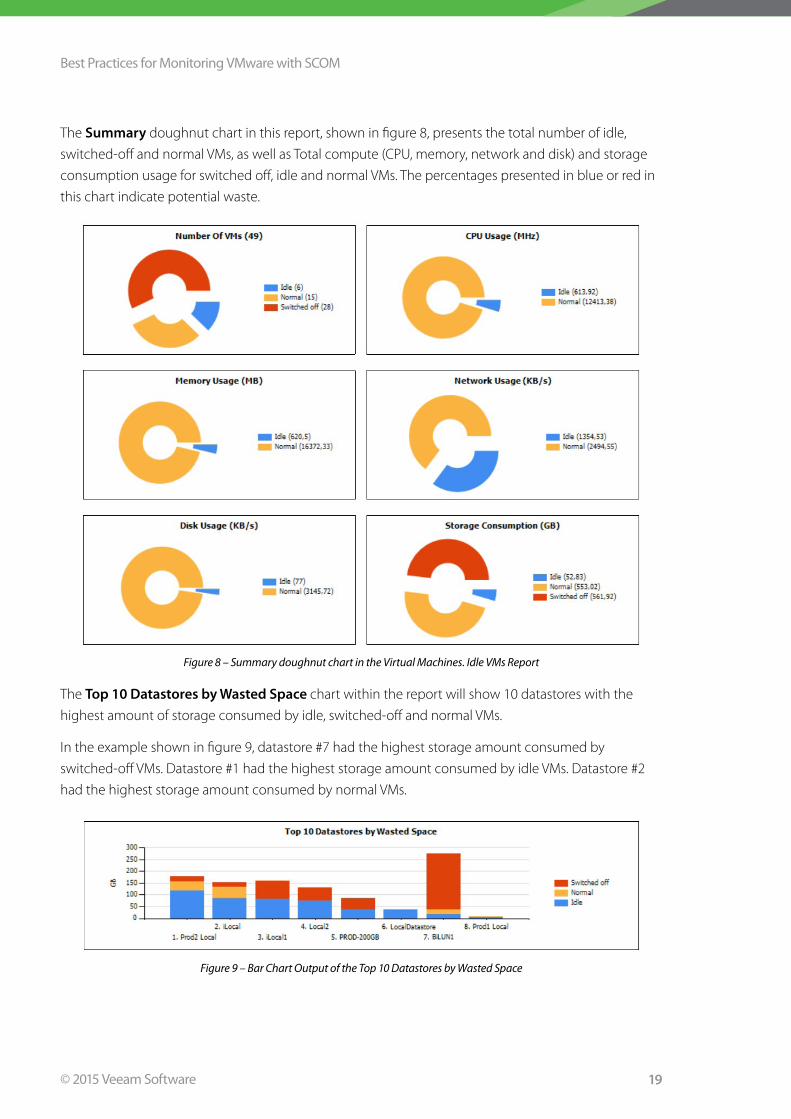
The Summary doughnut chart in this report, shown in figure 8, presents the total number of idle,
switched-off and normal VMs, as well as Total compute (CPU, memory, network and disk) and storage
consumption usage for switched off, idle and normal VMs . The percentages presented in blue or red in
this chart indicate potential waste .
Figure 8 – Summary doughnut chart in the Virtual Machines. Idle VMs Report
The Top 10 Datastores by Wasted Space chart within the report will show 10 datastores with the
highest amount of storage consumed by idle, switched-off and normal VMs .
In the example shown in figure 9, datastore #7 had the highest storage amount consumed by
switched-off VMs . Datastore #1 had the highest storage amount consumed by idle VMs . Datastore #2
had the highest storage amount consumed by normal VMs .
Figure 9 – Bar Chart Output of the Top 10 Datastores by Wasted Space
Best Practices for Monitoring VMware with SCOM
20© 2015 Veeam Software
The Importance of Right-sizing
Allocating to many resources to a VM is just as harmful as allocating too few resources . Over-allocation
of CPU and memory forces the hypervisor to work harder to distribute time slices of resources to each
guest allocated . This results in higher host resource utilization and lower host scalability . Widespread
over-allocation of resources has been shown to reduce data throughput in a wide variety of enterprise
applications, such as System Center Configuration Manager .
To get the most out of your private cloud investment, allocate only the necessary resources to your
VMware guests . This is where Veeam MP for VMware’s Right-sizing Reports can help you optimize
performance and eliminate waste .
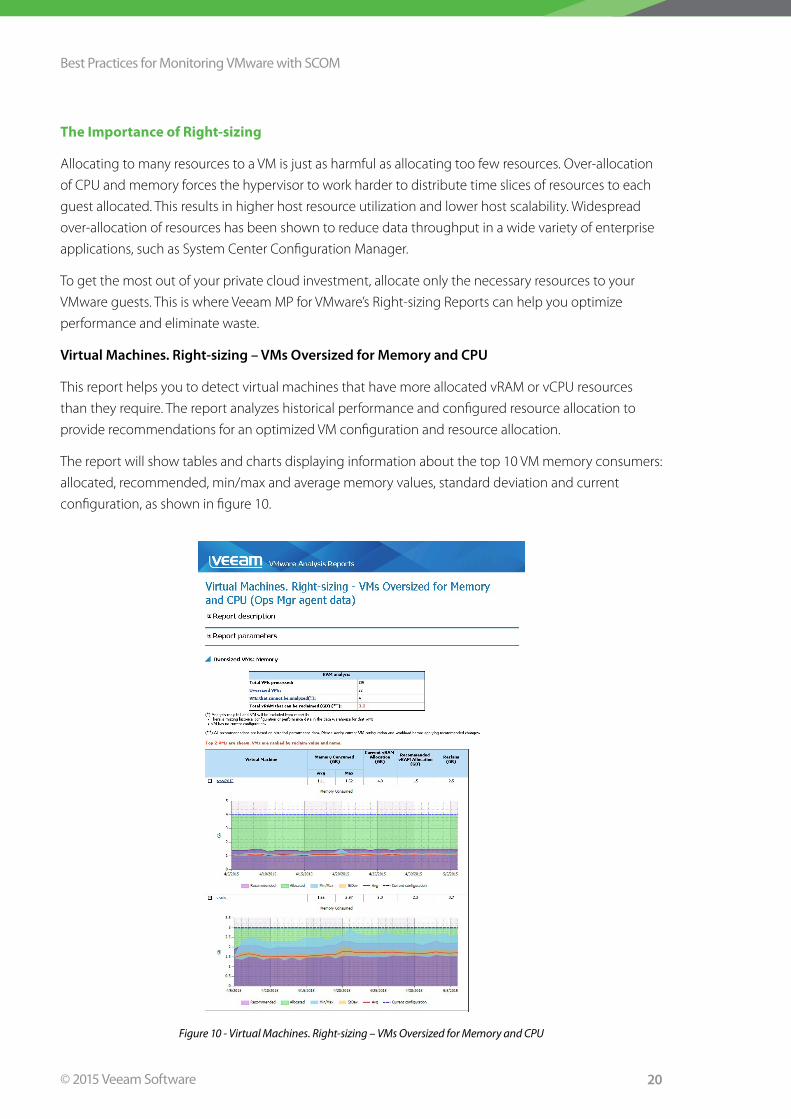
Virtual Machines. Right-sizing – VMs Oversized for Memory and CPU
This report helps you to detect virtual machines that have more allocated vRAM or vCPU resources
than they require . The report analyzes historical performance and configured resource allocation to
provide recommendations for an optimized VM configuration and resource allocation .
The report will show tables and charts displaying information about the top 10 VM memory consumers:
allocated, recommended, min/max and average memory values, standard deviation and current
configuration, as shown in figure 10 .
Figure 10 - Virtual Machines. Right-sizing – VMs Oversized for Memory and CPU
Best Practices for Monitoring VMware with SCOM
21© 2015 Veeam Software
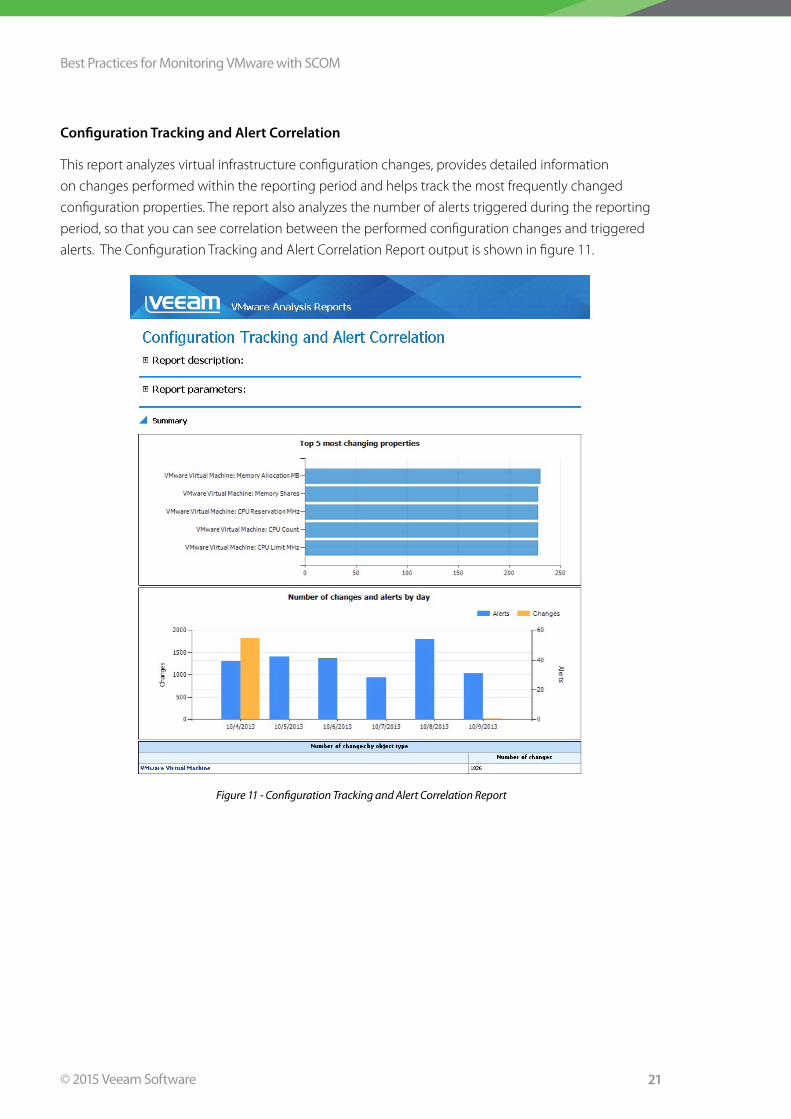
Configuration Tracking and Alert Correlation
This report analyzes virtual infrastructure configuration changes, provides detailed information
on changes performed within the reporting period and helps track the most frequently changed
configuration properties . The report also analyzes the number of alerts triggered during the reporting
period, so that you can see correlation between the performed configuration changes and triggered
alerts . The Configuration Tracking and Alert Correlation Report output is shown in figure 11 .
Figure 11 - Configuration Tracking and Alert Correlation Report
Best Practices for Monitoring VMware with SCOM
22© 2015 Veeam Software
Veeam VMware Performance History Report The Veeam VMware Performance History Report pack contains the following report types:
Top/Bottom N Contained Objects or Instances
Analyze the top resource users, for example — Top 10 VMs for IOPS in a Datastore .
Performance History
Detailed analysis of all available performance metrics for any object .
Number of Virtual Machines
Track the number of VMs and their states, for example — all powered-on VMs per Cluster .
The pack cover all types of virtual infrastructure objects — Veeam Collectors, vCenter Servers, vSphere clusters,
hosts, resource pools and vApps, VMs, datastores and datastore clusters and virtual network switches .
Together, Veeam MP for VMware report packs allow you to maximize your private cloud investment
throughout the service delivery lifecycle .
ConclusionThis white paper explains six key concepts to consider when monitoring vSphere with OpsMgr, including:
1 . Monitoring, with the private cloud fabric in mind
2 . Considering data source and solution architectures
3 . Sorting actionable alerts from alert noise
4 . Understanding OpsMgr override behavior and best practices
5 . Creating a dynamic user experience
6 . Providing reporting for trending, capacity planning and forecasting
Understanding VMware monitoring best practices will help you choose the VMware monitoring
solution that’s best suited to your organization’s monitoring and management requirements .
Best Practices for Monitoring VMware with SCOM
23© 2015 Veeam Software
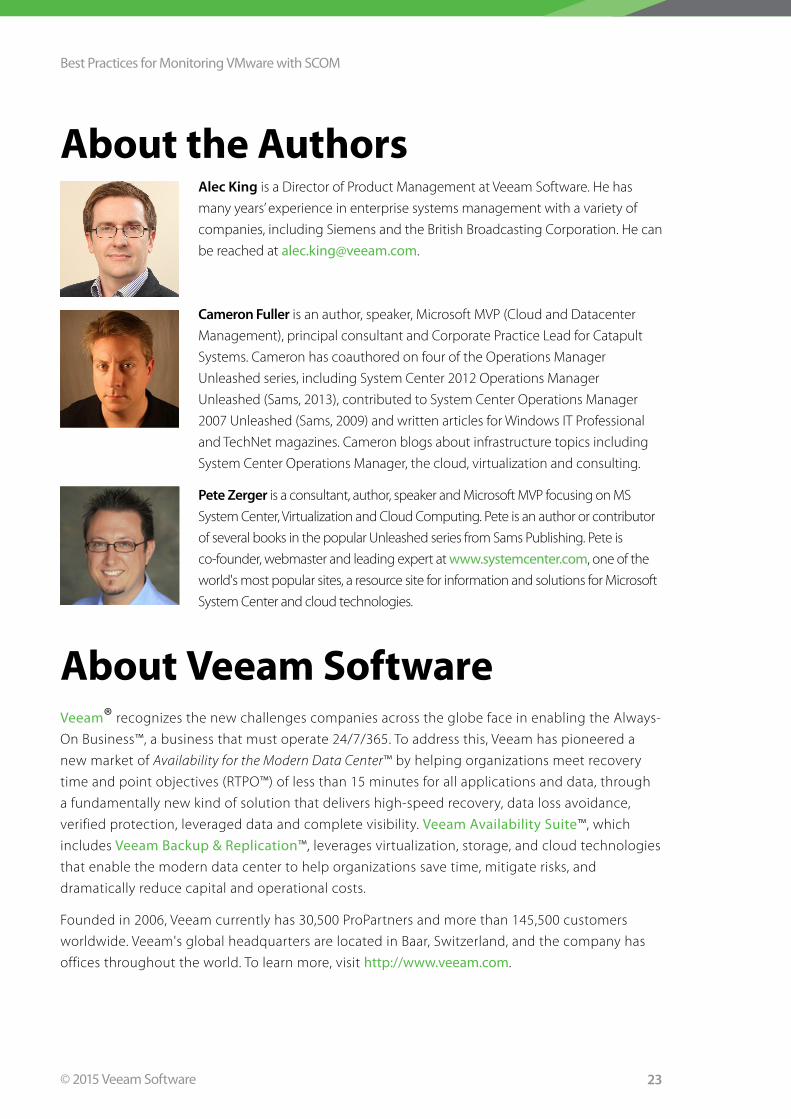
Alec King is a Director of Product Management at Veeam Software . He has
many years’ experience in enterprise systems management with a variety of
companies, including Siemens and the British Broadcasting Corporation . He can
be reached at [email protected] .
Cameron Fuller is an author, speaker, Microsoft MVP (Cloud and Datacenter
Management), principal consultant and Corporate Practice Lead for Catapult
Systems . Cameron has coauthored on four of the Operations Manager
Unleashed series, including System Center 2012 Operations Manager
Unleashed (Sams, 2013), contributed to System Center Operations Manager
2007 Unleashed (Sams, 2009) and written articles for Windows IT Professional
and TechNet magazines . Cameron blogs about infrastructure topics including
System Center Operations Manager, the cloud, virtualization and consulting .
Pete Zerger is a consultant, author, speaker and Microsoft MVP focusing on MS
System Center, Virtualization and Cloud Computing . Pete is an author or contributor
of several books in the popular Unleashed series from Sams Publishing . Pete is
co-founder, webmaster and leading expert at www.systemcenter.com, one of the
world's most popular sites, a resource site for information and solutions for Microsoft
System Center and cloud technologies .
About Veeam Software Veeam® recognizes the new challenges companies across the globe face in enabling the Always-
On Business™, a business that must operate 24/7/365 . To address this, Veeam has pioneered a
new market of Availability for the Modern Data Center™ by helping organizations meet recovery
time and point objectives (RTPO™) of less than 15 minutes for all applications and data, through
a fundamentally new kind of solution that delivers high-speed recovery, data loss avoidance,
verified protection, leveraged data and complete visibility . Veeam Availability Suite™, which
includes Veeam Backup & Replication™, leverages virtualization, storage, and cloud technologies
that enable the modern data center to help organizations save time, mitigate risks, and
dramatically reduce capital and operational costs .
Founded in 2006, Veeam currently has 30,500 ProPartners and more than 145,500 customers
worldwide . Veeam's global headquarters are located in Baar, Switzerland, and the company has
offices throughout the world . To learn more, visit http://www.veeam.com .
About the Authors
Best Practices for Monitoring VMware with SCOM
24© 2015 Veeam Software
NEW Veeam® Availability Suite™ v9
COMING SOON
RTPOTM<15 minutes for ALL applications and data Enabling the Always-On BusinessTM
with Availability for the Modern Data CenterTM
To learn more, visit www.veeam.com


![Home [docs.media.bitpipe.com]docs.media.bitpipe.com/io_12x/io_120848/item_1154936/CWE_260515_ezine.pdfHome News Can OpenStack free up enterprise IT? DevOps approach keeps cab firm](https://img.dokumen.tips/doc/110x75/5ed474ce64cb9d0fda7470a5/home-docsmedia-docsmedia-home-news-can-openstack-free-up-enterprise-it-devops.jpg)