Embed Size (px)
Citation preview

Bernstein’s 32nd Annual Strategic Decisions Conference
Bob Patel CEO June 2-3, 2016

Cautionary Statement
2
The statements in this presentation relating to matters that are not historical facts are forward-looking statements. These forward-looking statements are based upon assumptions of management which are believed to be reasonable at the time made and are subject to significant risks and uncertainties. Actual results could differ materially based on factors including, but not limited to, the business cyclicality of the chemical, polymers and refining industries; the availability, cost and price volatility of raw materials and utilities, particularly the cost of oil, natural gas, and associated natural gas liquids; competitive product and pricing pressures; labor conditions; our ability to attract and retain key personnel; operating interruptions (including leaks, explosions, fires, weather-related incidents, mechanical failure, unscheduled downtime, supplier disruptions, labor shortages, strikes, work stoppages or other labor difficulties, transportation interruptions, spills and releases and other environmental risks); the supply/demand balances for our and our joint ventures’ products, and the related effects of industry production capacities and operating rates; our ability to achieve expected cost savings and other synergies; our ability to successfully execute projects and growth strategies; legal and environmental proceedings; tax rulings, consequences or proceedings; technological developments, and our ability to develop new products and process technologies; potential governmental regulatory actions; political unrest and terrorist acts; risks and uncertainties posed by international operations, including foreign currency fluctuations; and our ability to comply with debt covenants and service our debt. Additional factors that could cause results to differ materially from those described in the forward-looking statements can be found in the “Risk Factors” section of our Form 10-K for the year ended December 31, 2015, which can be found at www.lyondellbasell.com on the Investor Relations page and on the Securities and Exchange Commission’s website at www.sec.gov.
The illustrative results or returns of growth projects are not in any way intended to be, nor should they be taken as, indicators or guarantees of performance. The assumptions on which they are based are not projections and do not necessarily represent the Company’s expectations and future performance. You should not rely on illustrated results or returns or these assumptions as being indicative of our future results or returns.
This presentation contains time sensitive information that is accurate only as of the date hereof. Information contained in this presentation is unaudited and is subject to change. We undertake no obligation to update the information presented herein except as required by law.
24681012141618$20
2,000
4,000
6,000
8,000
$10,000
2011 2012 2013 2014 2015
EBITDA($ in millions)
EBITDA as Reported EPS as Reported Excluding LCM
Chemicals Global N Am EU(4)
Ethylene #5 #2 #5
Propylene* #5 #3 #6
Propylene Oxide (PO) #2 #2 #2
Polymers
Polyolefins (PE+PP) #3 #3 #1
Polypropylene #2 #1 #1
Polyethylene #6 #3 #1
Polypropylene Compounds #1 - -
Fuels
Oxyfuels #1 #1 #1
Technology and R&D
Polyolefin Licensing #1 #2 #1
*Excluding Refinery Grade Propylene
EBITDA / EPS Performance
World-Class Scale With Leading Positions
(1) As of December 31, 2015 (2) LCM stands for “lower of cost or market”. Further detail regarding LCM adjustments can be found in the Appendix under “Information Related to Financial Measures.” (3) Source: LYB, IHS as of December 31, 2015. Only pro rata ownership of joint venture facilities. (4) EU includes Central and Western Europe for all products except Technology and R&D which is all of Europe
Who We Are Our Products (3) Capacity Position
3
• $40 billion market capitalization (1)
• Global independent chemical company, incorporated under Dutch law
• Executive offices in London, Rotterdam, and Houston
• Products sold in ~100 countries, with 56 manufacturing sites across 18 countries
(2)
EPS ($/share)

Durable / Non-Durable Revenue(1) World PE and PP Demand
Durable
Non-Durable
Diversified Geographically and Across End Markets
Source: Internal LYB Estimates and IHS. (1) Based on 2014 annual revenues. Excludes Technology segment revenues and intersegment eliminations.
Revenue by End Use(1) 2015 Revenue by Geography
0
50
100
150
200
250
1990 1995 2000 2005 2010 2015
B Lbs
PP PE
’90 – ’14 PE: 4.4% PP: 6.6%
’11 – ’14 PE: 3.4% PP: 4.3%
’14 – ’15 PE: 4.4% PP: 5.0%
4
North AmericaEurope
ROW

LYB’s Focused Approach is Yielding Results
5
Maximize value through a focus on operations Safe operations → reliable operations → maximum profit The best/most leveraging investment is in your existing
assets
Cost discipline remains a priority Most chemical markets are mature Overhead and spending management must be consistent
over time
Invest in advantaged positions, sustain others Raw material advantages Technology and structure create areas of differentiation
Shareholders own the company Transparency Shareholder friendly cash deployment policy

0%
5%
10%
15%
20%
LYB LYB ex. Ref WLK DOW EMN HUN CE DD
2010 2015LYB is best in class
0%
25%
50%
75%
100%
2008 2009 2010 2011 2012 2013 2014 2015
Operating Reliability and Cost Management: Key Priorities and an LYB Advantage
6
LYB continues to have intense focus on reliability and cost discipline, resulting in industry leading performance
Source: Capital IQ and LYB. 1) Fixed costs are adjusted for annual bonuses and selected items, and to 2015 FX.
Fixed Costs(1)
SG&A as Percent of Revenue – LYB vs. Peer Companies
2015 LYB Operating Reliability
85%
90%
95%
100%
U.S. Ethylene EAIEthylene
PO
Operating Rate (Indexed to 2008)

Commodities – naphtha based, with cyclical upside
Advantaged feedstock
Differentiated polymers
Large, heavy crude refinery
Processing Canadian crude
Proprietary technologies
Natural gas advantage
US Shale NGL advantage
Increasing capacity
Refining
Intermediates & Derivatives (I&D)
Olefins & Polyolefins (O&P) – EAI
Olefins & Polyolefins (O&P) – Americas
Technology Strong technology position
Maintain leadership
Segment LYB Market Position Priority
Invest
Optimize
Invest
Optimize
Focus
$3.8 B
$1.9 B
$1.7 B
$0.5 B
$0.2 B(1)
Each Business is Operated to Maximize Results 2015 EBITDA
(ex. LCM)
(1) The Technology Segment was not impacted by the LCM adjustment.
7

O&P - Americas and EAI Our Strategy is Generating Differential Results
• Safe & Reliable Operations
• Cost Focused
• Feedstock Advantaged and Flexibility
• Differentiated Products
8
O&P Americas vs. Americas Peers EBITDA excluding LCM per Pound of Ethylene Capacity
O&P EAI vs. EAI Peers EBITDA excluding LCM per Pound of Ethylene Capacity
Source: Company Filings, Capital IQ, IHS, and LYB Estimates. Capacities: Ethylene capacities include pro-rata JV capacities and are averages based on company reports and IHS. Dow capacity is global. Americas EBITDA: CP Chemical is consolidated using: income before taxes + depreciation – equity income. Westlake Olefins is operating income + depreciation. INEOS O&P North America and
Dow Performance Plastics EBITDA is as reported before exceptional/extraordinary items. LYB O&P EAI EBITDA excludes the impacts of LCM adjustments. EAI EBITDA: INEOS O&P Europe is as reported EBITDA before exceptional/extraordinary items. Borealis is operating income + depreciation + equity income. LYB O&P EAI EBITDA
excludes the impacts of LCM adjustments.
10
20
30
40
50
2011 2012 2013 2014 2015
¢ / lb
LYB O&P Americas
Peer Avg
10
20
30
40
2011 2012 2013 2014 2015
LYB O&P EAI
Peer Avg
¢ / lb

O&P: Strong Operating Rate and High Cost Supply Sources Support Global Ethylene Industry Pricing
9
1) Source: IHS 2016 Balance Update 2) Source: IHS and LYB analysis
Global Ethylene Supply / Demand (1) March 2016 Global Ethylene Cash Cost and Prices (2)
50%
55%
60%
65%
70%
75%
80%
85%
90%
95%
100%
200
250
300
350
400
450
500
2010 2015 2020
Billion Lbs.Capacity Demand Effective Operating Rate
Forecast
1,000
2,000
3,000
4,000
$5,000
2011 2012 2013 2014 2015
As Reported Excluding LCM
USD, millions
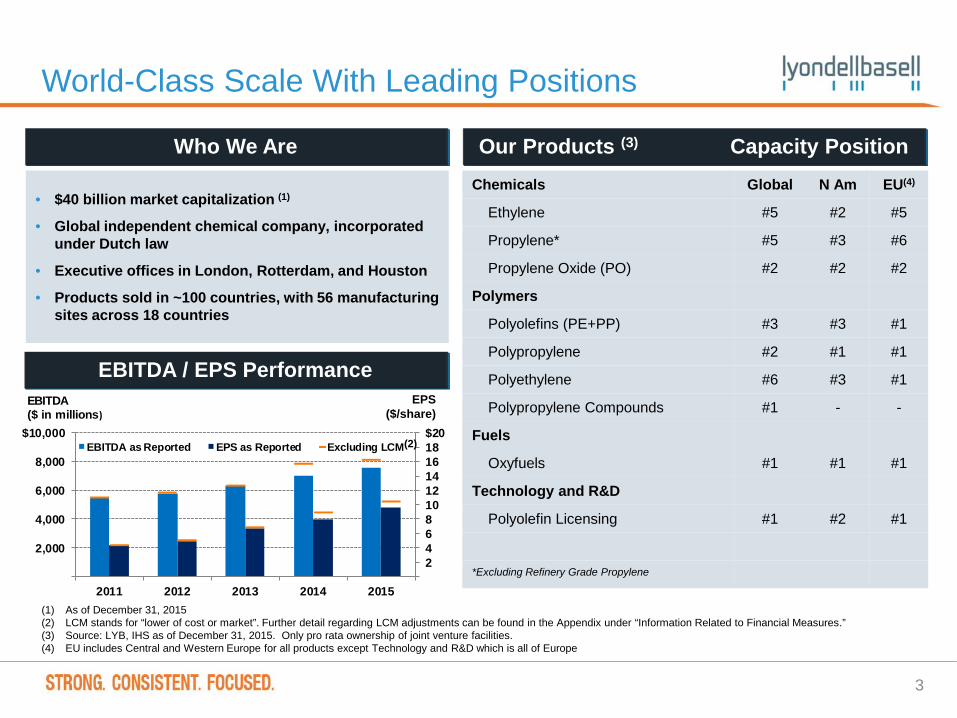
O&P Americas NGL Advantage with Flexible, Reliable Operations
EBITDA Performance
Cost of Ethylene Production LYB Flexibility Maximum % Ethylene from Feedstock
Feed System
NGL ~90%
Ethane ~80%
Propane ~20%
Butane ~15%
Liquids ~55%
Minimum Liquids ~10%
Operating Reliability vs. U.S. Industry
05
1015202530354045
2011 2012 2013 2014 2015
Ethane Propane Butane¢/Lb
10
95%
97%
90%
92%
94%
96%
98%
100%
'11-'15 Avg.
U.S. Industry LYB(1)
(1) U.S. Industry excluding LYB

0%
50%
100%
2010 2015
Advantaged Feedstock Naphtha
O&P – EAI Record EBITDA and a Restructured Business Approach
Source: LYB. (1) O&P EAI trough, mid-cycle and peak EBITDA values are based on LYB estimates. 2014 and 2015 LTM EBITDA excludes the impact of the LCM adjustment.
Indexed O&P EAI EBITDA(1)
Producing from Advantaged Feedstock
~18 % pts.
EBITDA Performance
500
1,000
1,500
$2,000
2011 2012 2013 2014 2015
As Reported Excluding LCM
USD, millions
Western Europe Olefins Operating Rate
11
0.5
1.0
1.5
2.0
2012 2013 2014 2015
Commodity / Cyclical Olefins & PolyolefinsDifferentiated / Stable Businesses
(EBITDA Indexed, Mid-Cycle = 1.0)
70%
100%
2010 2011 2012 2013 2014 2015
EU Industry LYB

0
15
30
45
2010 2011 2012 2013 2014 2015
I&D Segment Diversity: a Platform for Stable Profitability
12
Contracting Strategy(1)
Differentiated Proprietary Technology (2015 EBITDA)
Source: LYB, Chemical Data (PG Raw Material Margin) (1) Internal LYB estimates derived from forecasted third party sales, 2015.
Differentiated / Stable U.S. Shale
Cyclical
¢ / lb
Propylene Glycol Raw Material Margin
EBITDA Performance
500
1,000
1,500
$2,000
2011 2012 2013 2014 2015
As Reported Excluding LCM
USD, millions
Cost Plus
Market

20 40 60 80
100
2010-2013 2014 2015
¢//b (PG) or ¢/gal (MTBE) Propylene Glycol MTBE
60%
65%
70%
75%
80%
85%
90%
95%
100%
-
5
10
15
20
25
30
35
40
2010 2011 2012 2013 2014 2015 2016 2017 2018 2019 2020
Pounds, billions
Effective Capacity LYB PO/TBA Addition
Demand % Utilization
I&D Expanding with Leading Technology
13
Sources: LYB, IHS. (1) Source: CDI (propylene glycol) and Platts. (2) Source: IHS NWE MTBE spot prices.
Global Propylene Oxide (PO) Supply/Demand Propylene Oxide (PO) Cost Curve
LYB Processes
Propylene Glycol and MTBE Raw Material Margins (1) MTBE / RBOB Octane Spread (2)
20
40
60
2010 2011 2012 2013 2014 2015
¢/gal MTBE - RBOB Spread

Cash Deployment Hierarchy
2015 Comments
~ $800 million Base Capex First priorities for cash
~ $600 million Growth Capex High-return in advantaged businesses
~ $1.4 billion Interim Dividend Fund through the cycle with cash flow from operations
Balance of cash generated
Share Repurchases /
Special Dividend / Acquisitions
Discretionary cash returned to shareholders
M&A if strategic and meaningfully accretive
~ $310 million Interest Expense
Source: LYB
Foundation
Discretionary Opportunities
14

-
2,000
4,000
6,000
8,000
10,000
12,000
14,000
Before After
MM
Lbs
.
Significantly Expanding our Advantaged Positions
Methanol
MTBE Equivalent Propylene Oxide
U.S. Ethylene / Polyethylene
15
Note: “Before” refers to the capacity prior to the initiation of our growth program in 2013.
-
100
200
300
400
500
Before After
MM
Gal
. Per
Yea
r
- 500
1,000 1,500 2,000 2,500 3,000 3,500 4,000
Before After
MM
Lbs
.
-
20
40
60
80
100
120
Before After
MBP
D
Ethylene ~60% Complete / PE ~20% Complete Complete
~ 35% ~ 40%
~ 130% ~ 20%

27%
9%5%
12% 11%
LYB Large Peers Other Peers S&PChemicals
S&P 500
3.6%3.0%
2.1%2.5%
2.2%
LYB Large Peers Other Peers S&PChemicals
S&P 500
38%
17% 15% 17%
LYB Large Peers Other Peers S&P Chemicals
Leading in Dividends and Share Repurchases
16
Source: Capital IQ and LYB. For definitions and peer group definitions, please see the Glossary in the Appendix to this presentation. (1) S&P data calculated based upon individual constituent data as of May 23, 2016 (2) Excludes special dividends paid in 2012 of $2.75 per share. (3) Capital IQ as of December 31, 2015 (4) Capital IQ as of March 31, 2016
Growing LYB Annual Dividend (per Share) (2)
Q1’16 Dividend Yield in Top 15% of S&P 500 (4) 2011-2015 Share Repurchases as % Avg. 2015 Enterprise Value (3)
2011-2015 Free Cash Flow as % Avg. 2015 Enterprise Value (1)
$1.45 $2.00
$2.70 $3.04
2012 2013 2014 2015

2,000
4,000
6,000
$8,000
2012 2013 2014 2015
Interim DividendsSpecial DividendsShare Repurchases
Outperformance Coupled with a Shareholder Friendly Approach
17
Industry leading performance and statistics at a lagging multiple
Diluted Earnings Per Share Free Cash Flow
Multiples (trailing 12 months as
of 12/31/15) LYB
S&P Chemical
Index
S&P 500
EV/EBITDA
Excluding LCM(1) 5.7x 11.1x 10.5x
P/E(2) 8.8x 22.0x 21.6x
Dividends and Share Repurchases Multiples
Source: Capital IQ, Bloomberg, LYB (1) EV/EBITDA = Enterprise Value / Earnings Before Interest, Taxes and D&A as calculated by Capital IQ and Bloomberg, except for LYB, which is based on EBITDA ex. LCM for the trailing 12 months. (2) PE = Price to Earnings as calculated by Capital IQ and Bloomberg, except for LYB, which is based on as reported earnings for the trailing 12 months.
$ millions
$ millions per share
2
4
6
8
10
$12
2011 2012 2013 2014 2015
As Reported Excluding LCM
1,000
2,000
3,000
4,000
$5,000
2011 2012 2013 2014 2015

Appendix

LyondellBasell in 2015
19
(1) LCM stands for “lower cost or market”. Further detail regarding LCM adjustments can be found under “Information Related to Financial Measures.” (2) Share repurchases ranked as a percentage of LTM Average Enterprise Value.
EARNINGS CASH FLOW SHAREHOLDER RETURNS
RETURN MEASURES
EBITDA ex. LCM
$8.1 Billion Free Cash Flow
$4.4 Billion Total Shareholder
Return vs. S&P 500
1 year: 13% vs. -1%
3 years: 67% vs. 47%
5 years: 254% vs. 65%
Share Repurchases $4.7 Billion
52 million shares
11% of shares outstanding
Top 3% of the S&P 500(2)
Cash from Operations $5.8 Billion
Diluted EPS ex. LCM(1)
$10.35
Return on Invested Capital
34%
Dividends $1.4 Billion
3.6% Dividend Yield
Top 16% of the S&P 500

0.50
1.00
1.50
2.00
2.50
3.00
3.50
Q4'14 Q1'15 Q2'15 Q3'15 Q4'15
As Reported Excluding LCM
500
1,000
1,500
2,000
$2,500
4Q'14 1Q'15 2Q'15 3Q'15 4Q'15
As Reported Excluding LCM
Highlights
20
EBITDA ($ in millions) Diluted Earnings Per Share
(1) LCM stands for “lower cost or market”. Further detail regarding LCM adjustments can be found under “Information Related to Financial Measures.”
($ in millions, except per share data) FY 2013(As Reported)
FY 2014(As Reported)
FY 2015(As Reported)
FY 2014(ex. LCM)(1)
FY 2015(ex. LCM)
EBITDA $6,311 $7,050 $7,533 $7,810 $8,081
Income from Continuing Operations $3,860 $4,172 $4,479 $4,655 $4,830
Diluted Earnings ($ / share) from Continuing Operations $6.76 $8.00 $9.60 $8.92 $10.35
Record Annual EBITDA ex LCM: $8.1 Billion 2015 Diluted EPS Growth ex LCM >15% vs. 2014

0.00
0.50
1.00
1.50
2.00
2.50
$3.00
1Q 2015 2Q 2015 3Q 2015 4Q 2015 1Q 2016
As Reported Excluding LCM
1Q 2016 Highlights
21
(1) LCM stands for “lower cost or market”. Further detail regarding LCM adjustments can be found under “Information Related to Financial Measures.” Note: All results include $78 million after-tax gain on sale of Petroken: $57 million gain for O&P Americas for polypropylene assets and $21 million gain for O&P EAI for compounding assets.
($ in millions, except per share data) 1Q15 4Q15 1Q16 1Q15 4Q15 1Q16
EBITDA $1,952 $1,394 $1,807 $2,044 $1,678 $1,875
Income from Continuing Operations $1,167 $797 $1,030 $1,225 $982 $1,077
Diluted Earnings ($ / share) from Continuing Operations $2.42 $1.78 $2.37 $2.54 $2.20 $2.48
As Reported Excluding LCM (1)
Strong EPS Performance Highlights
• Polyolefins capturing strong O&P chain margins
• Improving seasonal markets
• Completed refinery turnaround
• Completed sale of Argentine subsidiary Petroken with gain of $78 million; Completed second India PP compounding acquisition (Zylog) during early April
• Issued €750 million six-year euro bonds at 1.875% rate
• $1.3 billion in 1Q16 share repurchases and dividends

2014 $100 Per Barrel
$4.50 Per MMBtu
~9 ¢/Lb. N.A. HDPE
Margin
10.7 B Annual
Lbs. Ethylene
63.3 MM shares, 12%
2015 $52 Per Barrel
$2.76 Per MMBtu
~18 ¢/Lb. N.A. HDPE
Margin
10.9 B2
Annual Lbs. Ethylene
51.8 MM shares, 11%
Strong 2015 EPS Despite Oil Decline
22
EPS is supported by low U.S. natural gas prices, tightened market conditions, our expansion program, and share repurchases
Source: LYB, IHS as of year end 2015. (1) Share repurchase percentage is calculated off of the outstanding shares as of Dec. 31, 2013 and 2014, respectively. (2) Capacity for 2015 includes the full annual capacity addition of 250 MM pounds completed at our Channelview site during 2015.
2014 Conditions
Natural Gas Oil Expansion
Program Share
Repurchases(1) Industry
S/D

2011 2012 2013 2014 2015
500
1,000
1,500
$2,00020112011 20122012 20132013 20142014 20152015
I&D I&D - Excluding LCM Tech
USD, Millions
A High Performing Portfolio: EBITDA Across Time Olefins & Polyolefins - Americas Olefins & Polyolefins - EAI
Intermediates and Derivatives and Technology Refining
23
1,000
2,000
3,000
4,000
$5,000
2011 2012 2013 2014 2015
As Reported Excluding LCM
USD, millions
500
1,000
1,500
$2,000
2011 2012 2013 2014 2015
As Reported Excluding LCM
USD, millions
250
500
750
$1,000
2011 2012 2013 2014 2015
As Reported Excluding LCM
USD, millions

Healthy Oil to Gas Ratio
24
Historic Oil/Gas Ratio
Current oil to gas ratio remains healthy and well above the pre-shale average Historic equivalent value of crude oil to gas implies a price of ~ $15-20 per barrel
Source: NYMEX, ICE.
Current:~20x
0x
10x
20x
30x
40x
50x
60x
'99 - '09 Average: 8.5x
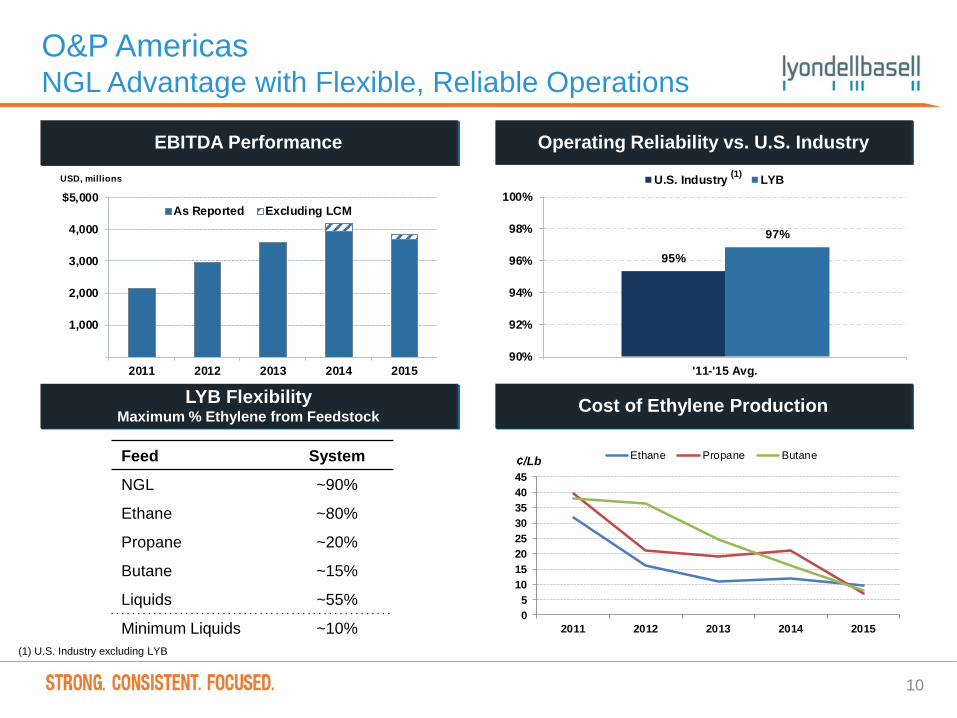
Status of Growth Projects Potential EBITDA(1)
($ million / year)
Source: LYB, Chemical Data and IHS. (1) Potential EBITDA assumes 100% utilization and is based on third party consultant industry margins for 2015, and 2011-2015 average as of January 13, 2016. (2) The EU Butadiene expansion benefits from a fixed margin and thus the potential EBITDA benefit has not changed.
25
COMPLETED
PROGRESSING
Scope Cost 2011-15 2015(million Lbs.) ($ million) Avg. Margins Margins
Increase Ethane Capability 500 2012 ~$25 $60 – 80 $30 – 50
Midwest Ethylene / PE 120 2012 ~$25 $30 – 40 $20 – 30
EU Butadiene Expansion(2) 155 Mid 2013 ~$100 $40 – 50 $40 – 50
Methanol Restart 250 MM Gal. Dec. 2013 ~$180 $210 – 230 $170 – 190
Matagorda PE Debottleneck 220 Early 2014 ~$20 $5 – 10 $40 – 50La Porte Ethylene
Expansion 800 Mid 2014 ~$500 $190 – 250 $150 – 220
Channelview Ethylene Expansion (I) 250 Mid 2015 ~$200 $60 – 80 $50 – 70
Completed Projects ~$1,050 $595 – 740 $500 – 660
Corpus Christi Ethylene Expansion 800 Q3 2016 In Progress $190 – 250 $150 – 220
New PO/TBA Plant1,000 PO
29 MBPD Oxyfuels 2020 In Progress $500 – 550 $450 – 500
PE Capacity 1000 2019 / 2020 In Progress $25 – 75 $150 - 200
Remaining Projects $715 – 875 $750 – 920
Total $1,310 – 1,615 $1,250 – 1,580
Project Start-up

Information Related to Financial Measures
26
This presentation makes reference to certain “non-GAAP” financial measures as defined in Regulation G of the U.S. Securities Exchange Act of 1934, as amended. The non-GAAP measures we have presented include income from continuing operations excluding LCM, diluted earnings per share excluding LCM, EBITDA and EBITDA excluding LCM. LCM stands for “lower of cost or market,” which is an accounting rule consistent with GAAP related to the valuation of inventory. Our inventories are stated at the lower of cost or market. Cost is determined using the last-in, first-out (“LIFO”) inventory valuation methodology, which means that the most recently incurred costs are charged to cost of sales and inventories are valued at the earliest acquisition costs. Market is determined based on an assessment of the current estimated replacement cost and selling price of the inventory. In periods where the market price of our inventory declines substantially, cost values of inventory may be higher than the market value, which results in us writing down the value of inventory to market value in accordance with the LCM rule, consistent with GAAP. This adjustment is related to our use of LIFO accounting and the recent decline in pricing for many of our raw material and finished goods inventories. We report our financial results in accordance with U.S. generally accepted accounting principles, but believe that certain non-GAAP financial measures, such as EBITDA and earnings and EBITDA excluding LCM, provide useful supplemental information to investors regarding the underlying business trends and performance of the company's ongoing operations and are useful for period-over-period comparisons of such operations. Non-GAAP financial measures should be considered as a supplement to, and not as a substitute for, or superior to, the financial measures prepared in accordance with GAAP.
EBITDA, as presented herein, may not be comparable to a similarly titled measure reported by other companies due to differences in the way the measure is calculated. We calculate EBITDA as income from continuing operations plus interest expense (net), provision for (benefit from) income taxes, and depreciation & amortization. EBITDA should not be considered an alternative to profit or operating profit for any period as an indicator of our performance, or as an alternative to operating cash flows as a measure of our liquidity. We have also presented financial information herein exclusive of adjustments for LCM.
While we also believe that free cash flow is a measure commonly used by investors. Free cash flow, as presented herein, may not be comparable to similarly titled measures reported by other companies due to differences in the way the measures are calculated. For purposes of this presentation, free cash flow means net cash provided by operating activities minus capital expenditures.
Reconciliations for our non-GAAP measures can be found on the following slides.

Glossary and Peer Groups • COGS: Cost of Goods Sold
• D&A: Depreciation and Amortization
• EBITDA (as used for peers): Earnings before Interest, Taxes and Depreciation and Amortization = Revenue - COGS - SG&A - R&D + D&A + Equity Income
• EV: Enterprise Value calculated using the average daily closing share price for the last 12 months ended December 31, 2015 multiplied by the common shares outstanding as of December 31, 2015.
• Free Cash Flow = Cash from Operations – Capital Expenditures
• R&D: Research and Development
• SG&A: Sales, General and Administrative
Peer Groups • Americas Peers: Dow, CP Chemical, Ineos and Westlake
• EAI Peers: Borealis and Ineos
• Large Peers: Dow, DuPont
• Other Peers: Celanese, Eastman, Huntsman and Westlake
• Peer Companies: Celanese, Dow, DuPont, Eastman, Huntsman and Westlake
• U.S. Public Petrochemical Peers: Celanese, Dow, Eastman, Huntsman and Westlake
27
* See reconciliations at end of presentation.

EBITDA Excluding LCM Adjustments 2011 - 2015
28
Reconciliation of EBITDA Excluding LCM Adjustments to EBITDA - 2011 Through 2015
In Million of Dollars 2011 2012 2013 2014 2015EBITDA Excluding LCM Adjustments: Olefins & Polyolefins - Americas $ 2,137 2,968$ 3,573$ 4,190$ 3,821$ Olefins & Polyolefins - EAI 865 548 839 1,410 1,855 Intermediates & Derivatives 1,410 1,621 1,492 1,552 1,656 Refining 977 481 182 409 519 Technology 191 197 232 232 243 Other (111) (7) (7) 17 (13) Total 5,469 5,808 6,311 7,810 8,081
Less:LCM Adjustments: Olefins & Polyolefins - Americas - - - 279 160 Olefins & Polyolefins - EAI - - - 44 30 Intermediates & Derivatives - - - 93 181 Refining - - - 344 177 Technology - - - - - Other - - - - - Total - - - 760 548
EBITDA: Olefins & Polyolefins - Americas 2,137 2,968 3,573 3,911 3,661 Olefins & Polyolefins - EAI 865 548 839 1,366 1,825 Intermediates & Derivatives 1,410 1,621 1,492 1,459 1,475 Refining 977 481 182 65 342 Technology 191 197 232 232 243 Other (111) (7) (7) 17 (13) Total 5,469$ 5,808$ 6,311$ 7,050$ 7,533$
For the Twelve Months Ended December 31,

Net Income to EBITDA 2011 - 2015
29
Reconciliation of Net Income to EBITDA
In Million of Dollars 2011 2012 2013 2014 2015Net Income $ 2,140 $ 2,834 $ 3,853 $ 4,168 $ 4,474
(Income) Loss from Discontinued Operations 332 24 7 4 5
LCM Adjustments, After Tax - - - 483 351
Income from Continuing Operations Excluding LCM Adjustments 2,472 2,858 3,860 4,655 4,830
Less:
LCM Adjustments, After Tax - - - (483) (351)
Income from Continuing Operations 2,472 2,858 3,860 4,172 4,479
Provision for Income Taxes 1,059 1,327 1,136 1,540 1,730
Depreciation and Amortization 931 983 1,021 1,019 1,047
Interest expense, net 1,007 640 294 319 277
Add:
LCM Adjustments, Before Tax - - - 760 548
EBITDA Excluding LCM Adjustments 5,469 5,808 6,311 7,810 8,081
Less:
LCM Adjustments, Before Tax - - - 760 548
EBITDA 5,469$ 5,808$ 6,311$ 7,050$ 7,533$
For the Twelve Months Ended December 31,

EBITDA Excluding LCM Adjustments to Reported EBITDA
30
Reconciliation of EBITDA Excluding LCM Adjustments to EBITDA
Year Ended Year EndedThree Months
Ended
In Millions of DollarsMarch 31,
2014June 30,
2014September 30,
2014December 31,
2014December 31,
2014March 31,
2015June 30,
2015September 30,
2015December 31,
2015December 31,
2015March 31,
2016
EBITDA Excluding LCM Adjustments:
Olefins & Polyolefins - Americas $ 736 $ 978 $ 1,202 1,274$ 4,190$ 1,074$ 993$ 920$ 834$ 3,821$ 878$
Olefins & Polyolefins - EAI 356 319 343 392 1,410 357 492 555 451 1,855 549
Intermediates & Derivatives 375 430 383 364 1,552 381 483 506 286 1,656 354
Refining 129 137 110 33 409 154 154 143 68 519 14
Technology 76 71 41 44 232 76 57 45 65 243 83
Other (4) 6 1 14 17 2 (2) 13 (26) (13) (3)
Total 1,668 1,941 2,080 2,121 7,810 2,044 2,177 2,182 1,678 8,081 1,875
Less:
LCM Adjustments:
Olefins & Polyolefins - Americas - - 45 234 279 43 (21) 79 59 160 -
Olefins & Polyolefins - EAI - - - 44 44 - - 6 24 30 40
Intermediates & Derivatives - - - 93 93 44 17 46 74 181 28
Refining - - - 344 344 5 (5) 50 127 177 -
Technology - - - - - - - - - - -
Other - - - - - - - - - - -
Total - - 45 715 760 92 (9) 181 284 548 68
EBITDA:
Olefins & Polyolefins - Americas 736 978 1,157 1,040 3,911 1,031 1,014 841 775 3,661 878
Olefins & Polyolefins - EAI 356 319 343 348 1,366 357 492 549 427 1,825 509
Intermediates & Derivatives 375 430 383 271 1,459 337 466 460 212 1,475 326
Refining 129 137 110 (311) 65 149 159 93 (59) 342 14
Technology 76 71 41 44 232 76 57 45 65 243 83
Other (4) 6 1 14 17 2 (2) 13 (26) (13) (3) Total 1,668$ 1,941$ 2,035$ 1,406$ 7,050$ 1,952$ 2,186$ 2,001$ 1,394$ 7,533$ 1,807$
Three Months Ended Three Months Ended
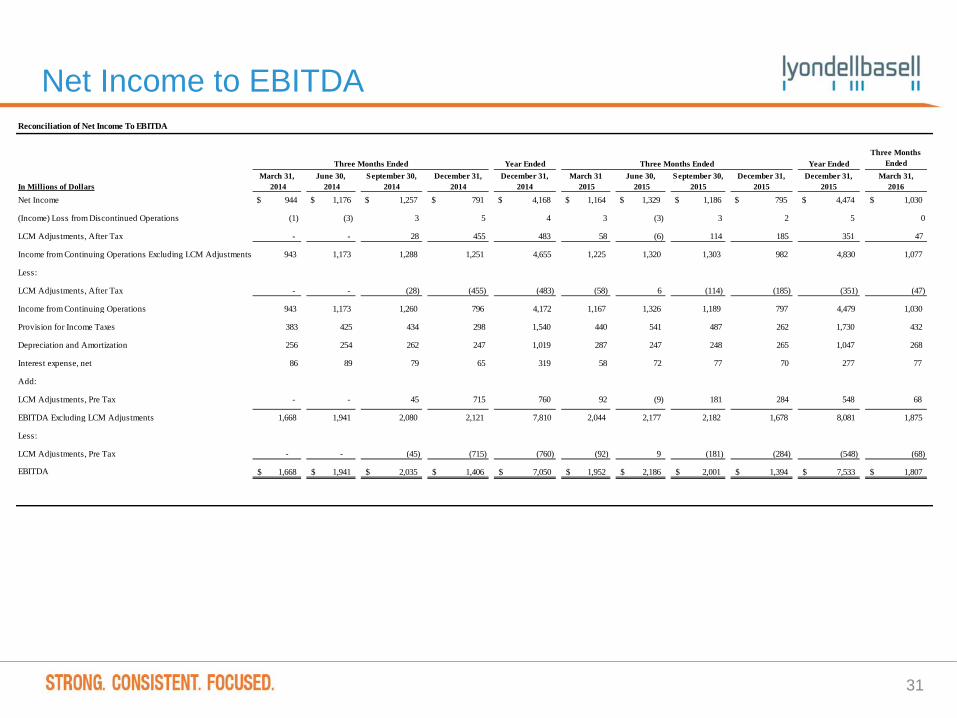
Net Income to EBITDA
31
Reconciliation of Net Income To EBITDA
Year Ended Year EndedThree Months
Ended
In Millions of DollarsMarch 31,
2014June 30,
2014September 30,
2014December 31,
2014December 31,
2014 March 31
2015June 30,
2015September 30,
2015December 31,
2015December 31,
2015 March 31,
2016
Net Income $ 944 $ 1,176 $ 1,257 $ 791 $ 4,168 $ 1,164 $ 1,329 $ 1,186 $ 795 $ 4,474 1,030$
(Income) Loss from Discontinued Operations (1) (3) 3 5 4 3 (3) 3 2 5 0
LCM Adjustments, After Tax - - 28 455 483 58 (6) 114 185 351 47
Income from Continuing Operations Excluding LCM Adjustments 943 1,173 1,288 1,251 4,655 1,225 1,320 1,303 982 4,830 1,077
Less:
LCM Adjustments, After Tax - - (28) (455) (483) (58) 6 (114) (185) (351) (47)
Income from Continuing Operations 943 1,173 1,260 796 4,172 1,167 1,326 1,189 797 4,479 1,030
Provision for Income Taxes 383 425 434 298 1,540 440 541 487 262 1,730 432
Depreciation and Amortization 256 254 262 247 1,019 287 247 248 265 1,047 268
Interest expense, net 86 89 79 65 319 58 72 77 70 277 77
Add:
LCM Adjustments, Pre Tax - - 45 715 760 92 (9) 181 284 548 68
EBITDA Excluding LCM Adjustments 1,668 1,941 2,080 2,121 7,810 2,044 2,177 2,182 1,678 8,081 1,875
Less:
LCM Adjustments, Pre Tax - - (45) (715) (760) (92) 9 (181) (284) (548) (68)
EBITDA 1,668$ 1,941$ 2,035$ 1,406$ 7,050$ 1,952$ 2,186$ 2,001$ 1,394$ 7,533$ 1,807$
Three Months Ended Three Months Ended
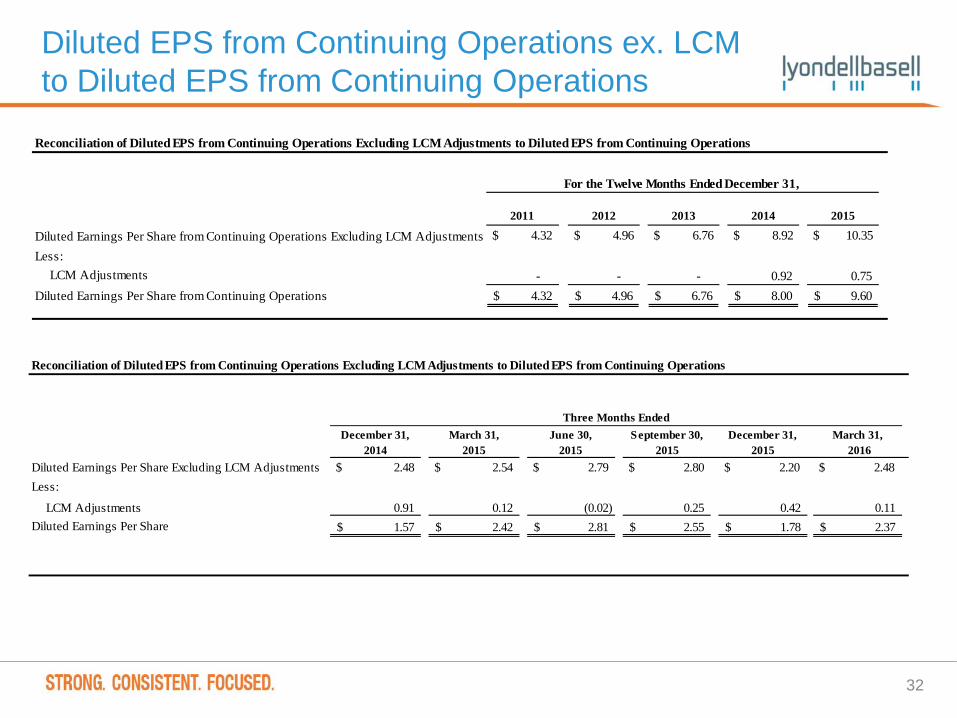
Diluted EPS from Continuing Operations ex. LCM to Diluted EPS from Continuing Operations
32
Reconciliation of Diluted EPS from Continuing Operations Excluding LCM Adjustments to Diluted EPS from Continuing Operations
2011 2012 2013
2014
2015
Diluted Earnings Per Share from Continuing Operations Excluding LCM Adjustments $ 4.32 $ 4.96 $ 6.76 $ 8.92 $ 10.35 Less: LCM Adjustments - - - 0.92 0.75 Diluted Earnings Per Share from Continuing Operations 4.32$ 4.96$ 6.76$ 8.00$ 9.60$
For the Twelve Months Ended December 31,
Reconciliation of Diluted EPS from Continuing Operations Excluding LCM Adjustments to Diluted EPS from Continuing Operations
December 31, 2014
March 31, 2015
June 30,2015
September 30, 2015
December 31, 2015
March 31, 2016
Diluted Earnings Per Share Excluding LCM Adjustments $ 2.48 $ 2.54 $ 2.79 $ 2.80 $ 2.20 $ 2.48 Less:
LCM Adjustments 0.91 0.12 (0.02) 0.25 0.42 0.11 Diluted Earnings Per Share 1.57$ 2.42$ 2.81$ 2.55$ 1.78$ 2.37$
Three Months Ended

Free Cash Flow to Net Cash Provided by Operating Activities
33
Reconciliation of Free Cash Flow to Net Cash Provided by Operating Activities
In Million of Dollars 2011 2012 2013 2014 2015
Free Cash Flow $ 1,810 $ 3,727 $ 3,274 $ 4,549 $ 4,402 Add:Capital Expenditures 1,050 1,060 1,561 1,499 1,440 Net Cash Provided by Operating Activities 2,860$ 4,787$ 4,835$ 6,048$ 5,842$
For the Years Ended December 31,

LYB Enterprise Value to EBITDA
34
Calculation of Ratio of LYB Enterprise Value (EV) to EBITDA Excluding LCM
In Million of Dollars except for common shares outstanding
Common Shares Outstanding, December 31, 2015 440,150,069 Multiplied by:Average Daily Closing Share Price, LTM December 31, 2015 $ 91.47
Market Capitalization $ 40,261 Add:Current Maturities of Long-Term Debt 4 Short-Term Debt 353 Long-Term Debt 7,671 Less: Cash 924 Short-Term Investments 1,064 Net Debt 6,040
Non-Controlling Interests 24 Enterprise Value $ 46,325 Divided by:2015 EBITDA Excluding LCM $ 8,081 Ratio of Enterprise Value to EBITDA Excluding LCM 5.7
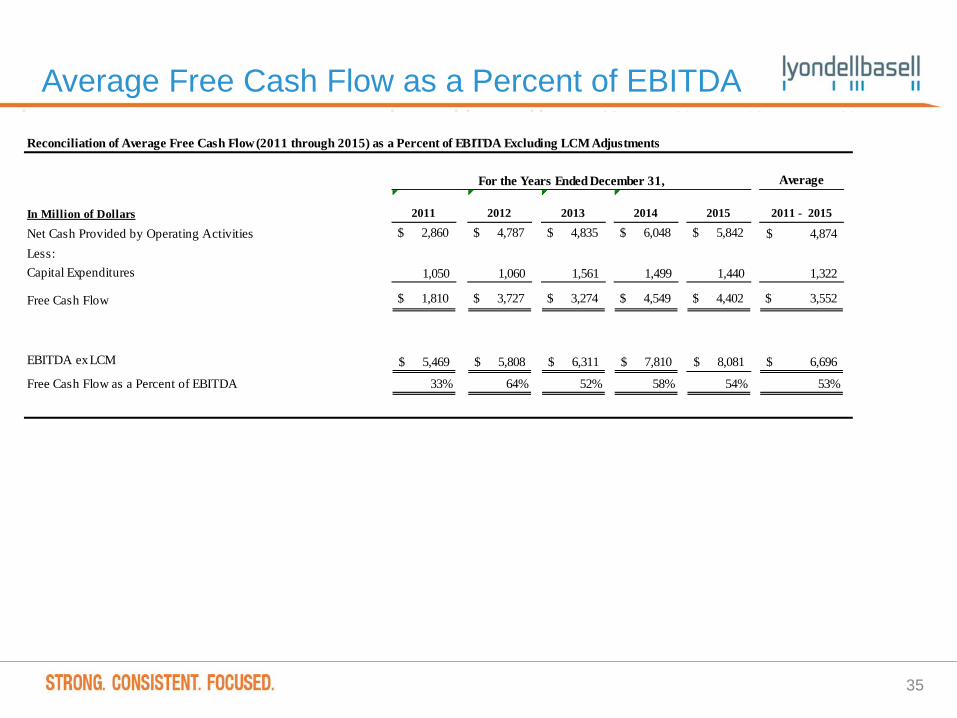
Average Free Cash Flow as a Percent of EBITDA
35
Reconciliation of Average Free Cash Flow (2011 through 2015) as a Percent of EBITDA Excluding LCM Adjustments
Average
In Million of Dollars 2011 2012 2013 2014 2015 2011 - 2015
Net Cash Provided by Operating Activities $ 2,860 $ 4,787 $ 4,835 $ 6,048 $ 5,842 4,874$ Less:Capital Expenditures 1,050 1,060 1,561 1,499 1,440 1,322
Free Cash Flow $ 1,810 $ 3,727 $ 3,274 $ 4,549 $ 4,402 $ 3,552
EBITDA ex LCM 5,469$ 5,808$ 6,311$ 7,810$ 8,081$ 6,696$
Free Cash Flow as a Percent of EBITDA 33% 64% 52% 58% 54% 53%
For the Years Ended December 31,

Free Cash Flow to Average Enterprise Value
36
Calculation of Ratio of Free Cash Flow to Average Enterprise Value (EV)
In Million of Dollars except for common shares outstanding
Free Cash Flow (2011-2015) $ 17,762
Average 2015 Enterprise Value
Common Shares Outstanding, December 31, 2015 440,150,069 Multiplied by:Average Daily Closing Share Price, 2015 91.47
Market Capitalization $ 40,261 Add:Current Maturities of Long-Term Debt 4 Short-Term Debt 353 Long-Term Debt 7,671 Less: Cash 924 Short-Term Investments 1,064 Net Debt 6,040
Non-Controlling Interests 24 Enterprise Value $ 46,325
Ratio of Free Cash Flow to Average Enterprise Value 38%

Free Cash Flow as a Percent of Market Capitalization
37
Reconciliation of Free Cash Flow as a Percent of Market Capitalization - 2011 Through 2015
Average
In Million of Dollars 2011 2012 2013 2014 2015 2011 - 2015
Net Cash Provided by Operating Activities $ 2,860 $ 4,787 $ 4,835 $ 6,048 $ 5,842 4,874$ Less:Capital Expenditures 1,050 1,060 1,561 1,499 1,440 1,322
Free Cash Flow $ 1,810 $ 3,727 $ 3,274 $ 4,549 $ 4,402 $ 3,552
Market Capitalization at December 31, 2015 40,261$
Free Cash Flow as a Percent of Market Capitalization 9%
For the Years Ended December 31,

Return on Invested Capital
38
Calculation of LYB Return on Invested Capital (ROIC)
In Million of Dollars 2014 2015
Income from Continuing Operations $ 4,479 Add:Interest Expense, Net 277 Effective Tax Rate 27.9%Interest Expense, Net, After Tax 200 Adjusted Income from Continuing Operations 4,679
Divided by:Average Invested Capital:Property, Plant & Equipment, Net 8,758$ 8,991 Current Assets 11,645 9,789 Less:
Current Liabilities 5,437 4,349 Cash and Cash Equivalents 1,031 924
$ 13,935 13,507 Average Invested Capital $ 13,721
Return on Invested Capital 34%
Years Ended December 31,

Dividends and Share Repurchases
39
In Millions of Dollars 2012 2013 2014 2015
Interim Dividends $ 833 $ 1,127 $ 1,403 $ 1,410 Special Dividends 1,582 - - - Total Dividends 2,415 1,127 1,403 1,410
Repurchases of Ordinary Shares - 1,949 5,788 4,656
Total 2,415$ 3,076$ 7,191$ 6,066$
Schedule of Spending for Dividends and Share Repurchases
Years Ended December 31,

Ratio of Shareholder Returns of Capital to Average Enterprise Value
40
Calculation of Ratio of Shareholder Returns of Capital (2011 - 2015) to Average Enterprise Value (EV)
In Million of Dollars except for share data
Shareholder Returns of Capital (2011 - 2015)Share Repurchases $ 12,393 Special Dividends 4,162 Interim/Regular Dividends 5,086
21,641
Average 2015 Enterprise Value
Common Shares Outstanding, December 31, 2015 440,150,069 Multiplied by:Average Daily Closing Share Price, 2015 91.47
Market Capitalization $ 40,261 Add:Current Maturities of Long-Term Debt 4 Short-Term Debt 353 Long-Term Debt 7,671 Less: Cash 924 Short-Term Investments 1,064 Net Debt 6,040
Non-Controlling Interests 24 Enterprise Value $ 46,325
Ratio of Shareholder Returns of Capital (2011 - 2015) to Average Enterprise Value
Share Repurchases 27%Special Dividends 9%Interim/Regular Dividends 11%Total 47%
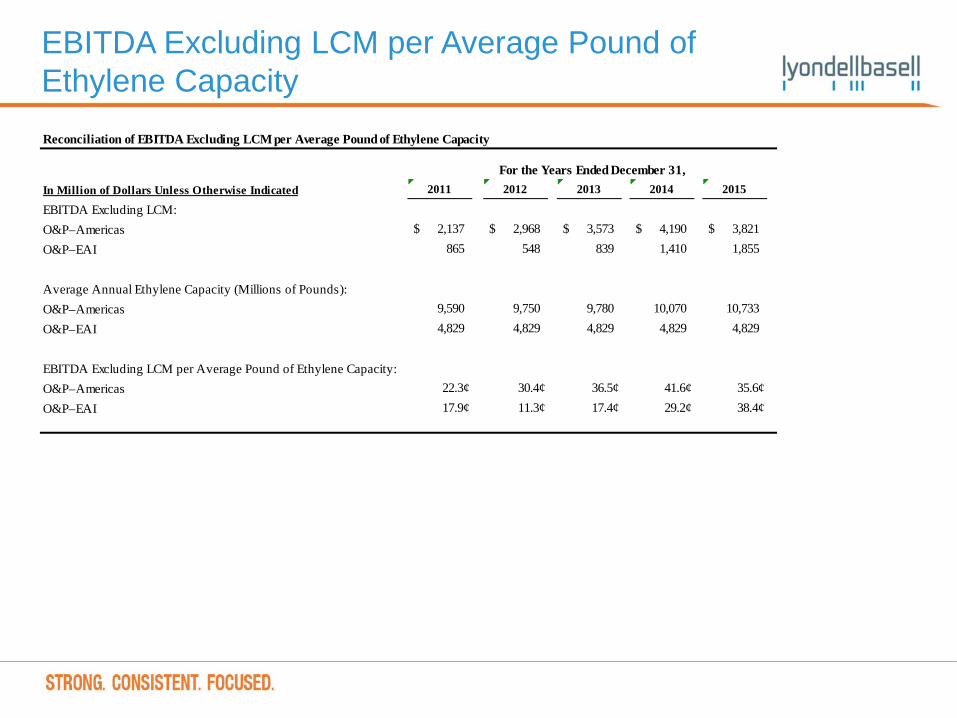
EBITDA Excluding LCM per Average Pound of Ethylene Capacity Reconciliation of EBITDA Excluding LCM per Average Pound of Ethylene Capacity
In Million of Dollars Unless Otherwise Indicated 2011 2012 2013 2014 2015
EBITDA Excluding LCM:O&P–Americas $ 2,137 $ 2,968 $ 3,573 $ 4,190 $ 3,821 O&P–EAI 865 548 839 1,410 1,855
Average Annual Ethylene Capacity (Millions of Pounds):O&P–Americas 9,590 9,750 9,780 10,070 10,733 O&P–EAI 4,829 4,829 4,829 4,829 4,829
EBITDA Excluding LCM per Average Pound of Ethylene Capacity:O&P–Americas 22.3¢ 30.4¢ 36.5¢ 41.6¢ 35.6¢ O&P–EAI 17.9¢ 11.3¢ 17.4¢ 29.2¢ 38.4¢
For the Years Ended December 31,