Embed Size (px)
Citation preview

Imaging biomarkers in oncologic liver disease
Bernard Van Beers
Laboratory of Imaging Biomarkers
INSERM UMR1149
University Paris Diderot
Department of Radiology
Beaujon University Hospital Paris Nord
Imaging biomarkers
• Imaging characteristics that are objectively measured as indicators of pathogenic processes or pharmacologic responses to therapeutic interventions: quantitative imaging
• Advantages of imaging biomarkers relative to serum or tissue biomarkers
– Non invasive
– Spatially and temporally resolved
• Diagnostic biomarkers: cross-sectional relationship between predictor and outcome
• Prognostic biomarkers: longitudinal relationship between predictor and outcome
Biomarkers Definition Working Group, 2001Collins GS et al. Ann Intern Med 2015

Imaging biomarkers: RECIST criteria
• RECIST: response evaluation criteria in solid tumors
• Measurement of tumor diameter at CT
– Complete response: disappearance of the lesions
– Objective response: decrease ≥ 30%
– Stable disease
– Progressive disease: increase ≥ 20%
• Used since more than 10 years to assess response to treatment in drug development studies
Therasse P et al. JNCI 2000; 92: 205-216
Jain RK et al. J Clin Oncol 2013; 266: 812-821

Limitations of RECIST criteria
• RECIST : semi-quantitative score with arbitrary cutoffs
• Decrease in size is not always observed because tumor tissue may be completely replaced with necrosis or fibrosis, especially when targeted treatments are used
Chun YS et al. JAMA 2009; 302: 2338-2344
Colorectal liver metastases treated with chemotherapy and bevazucimab

Ronot M et al. Oncologist 2014; 19: 394-402
Size criteria in HCC treated with sorafenib

Ronot M et al. Oncologist 2014; 19: 394-402
Size criteria in HCC treated with sorafenib

Limitations of mRECIST/EASL
• 2D measurements in very heterogeneous tumors
March JuneApril
Hanahan D et al. Cell 2011; 144: 646-674
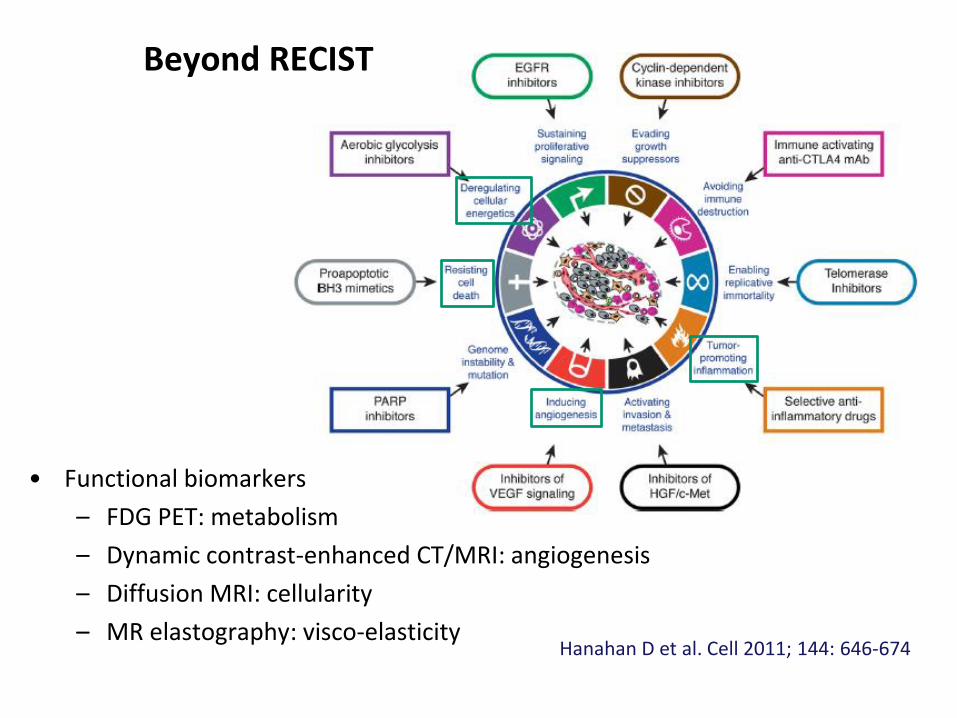
Beyond RECIST
• Functional biomarkers
– FDG PET: metabolism
– Dynamic contrast-enhanced CT/MRI: angiogenesis
– Diffusion MRI: cellularity
– MR elastography: visco-elasticity

ADC: distinction between benign and malignant lesions
• High ADC in benign lesions with high
fluid content such as hemangiomas
• No significant difference in ADC
between benign hepatocellular lesions
and malignant tumors
Doblas S et al. Invest Radiol 2013;48: 722-728

Garteiser P. et al. Eur Radiol 2012; 22: 2169-2177
Visco-elastic properties

Areas under ROC curves
• AUROCADC = 0.71
• AUROC Gl = 0.76
• AUROC malignancy index = 0.84
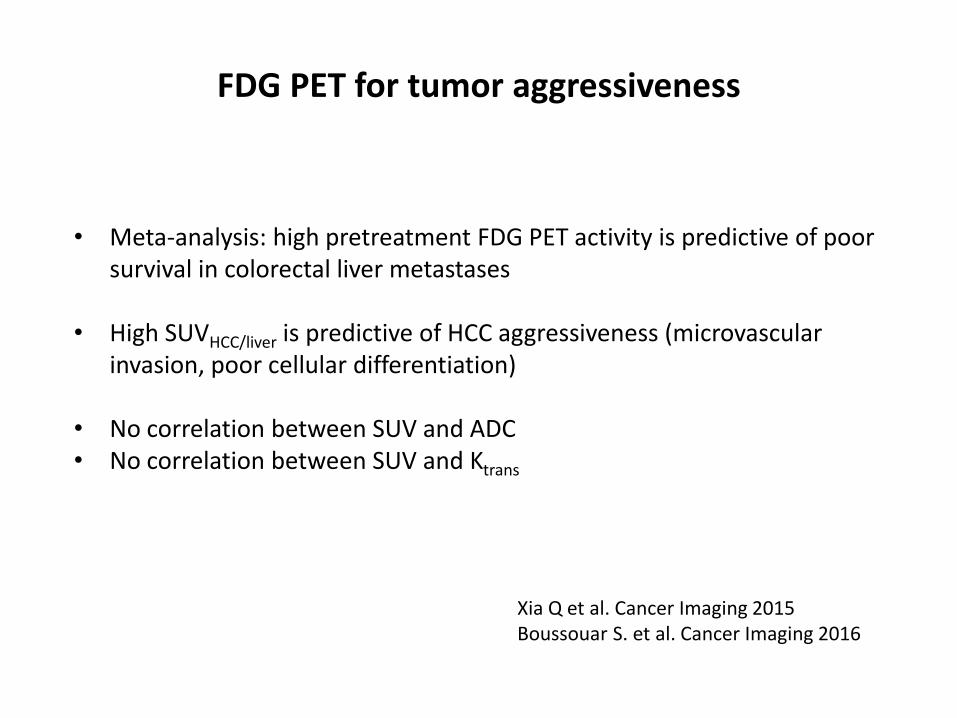
FDG PET for tumor aggressiveness
• Meta-analysis: high pretreatment FDG PET activity is predictive of poor survival in colorectal liver metastases
• High SUVHCC/liver is predictive of HCC aggressiveness (microvascular invasion, poor cellular differentiation)
• No correlation between SUV and ADC• No correlation between SUV and Ktrans
Xia Q et al. Cancer Imaging 2015Boussouar S. et al. Cancer Imaging 2016

Response to treatment: volumetric assessment of
ADC and enhancement
Bonekamp S et al: Radiology 2013; 268: 431-439

HCC after TACE
Bonekamp S et al: Radiology 2013; 268: 431-439
Volumetric ADC increase ≥ 25% and portal venous enhancement increase
≥ 65% 3 – 4 weeks after TACE are better predictors of survival than
RECIST, mRECIST and EASL criteria

Early diffusion and perfusion changes after TACE of HCC
Diffusion and perfusion changes are already observed at MR imaging one week after TACE
Boustany G et al. 2015

Perfusion MRI changes after treatment in liver metastases
Improvement of disease free survival in patients with liver colorectal metastases treated with chemotherapy and bevacuzimab when perfusion increase < 40% after one week and perfusion decrease > 40% after 10 weeks
De Bruyne S et al. Br J Cancer 2012
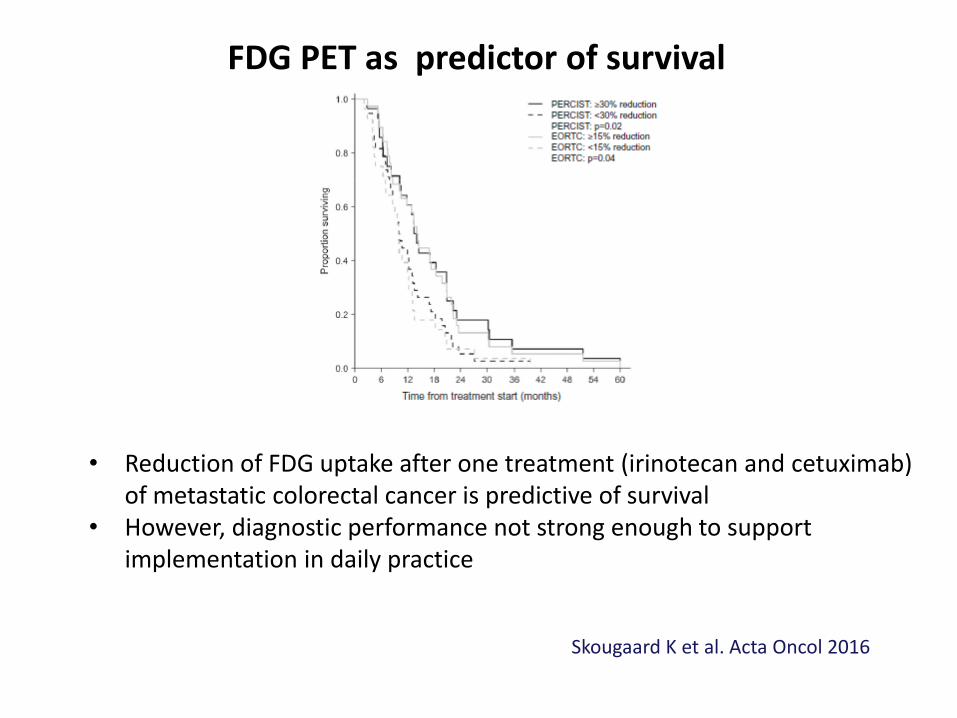
FDG PET as predictor of survival
• Reduction of FDG uptake after one treatment (irinotecan and cetuximab) of metastatic colorectal cancer is predictive of survival
• However, diagnostic performance not strong enough to support implementation in daily practice
Skougaard K et al. Acta Oncol 2016

Improvement of diagnostic performance with functional MRIrelative to RECIST
• Shift from morphological to functional parameters
• Shift from manual one-dimensional to automatic three-dimensional approach• Tumor heterogeneity is better taken into account• Reproducibility is improved
Bonekamp D et al. Eur J Radiol 2014

Radiomics
• Radiomics is defined as the conversion of images to higher dimensional data and the subsequent mining of these data for improved decision support
• Three characteristics
– Shape
– Signal intensity
– Texture: spatial variations of voxel intensity related to tumor heterogeneity
Aerts H. et al. Nat Commun 2014

Tumor heterogeneity
• Spatial and temporal tumor heterogeneity that creates local habitats
• Random genetic mutations
• Importance of microenvironment
• Genomic heterogeneity within tumors is a major cause of treatment failure
• Correlations between radiomics and histopathological phenotype
• Correlations between radiomics and genomics: radiogenomics
Gatenby RA et al. Radiology 2013Lee G et al. Eur J Radiol 2016

Radiomics
• Standardized acquisition
• Segmentation
• Feature extraction
• Feature selection
• Data analysis: statistical (logistic regression) or machine learning methods
Gillies RJ et al. Radiology 2016

Diagnostic value of radiomics
• In HCC, combinations of 28 imaging traits at CT can reconstruct 78% of the global gene expression profiles, revealing cell proliferation, liver synthetic function, and patient prognosis
• T2-weighted MRI and diffusion MRI in prostate cancer
– Radiomics: accuracy of 93% for diagnosing Gleason 6 versus ≥ 7
– ADC mean: 63%
• More validation studies are needed
Segal E. et al. Nature Biotech 2007Fehr et al. PNAS 2015

Advanced method: oscillating gradient DW imaging
• Very short diffusion times
• Sensitive to intracellular changes
• Characterization of high dysplastic nodules and early HCC
RN / LGDN HGDN / WDHCC MDHCC / PDHCC0.0
0.5
1.0
AD
C P
GS
E (
x10
-3 m
m2/s
)
GROUP 1 GROUP 2 GROUP 3
RN / LGDN HGDN / WDHCC MDHCC / PDHCC0.0
0.5
1.0
AD
C O
GS
E (
x1
0-3
mm
2/s
)
GROUP 1 GROUP 2 GROUP 3
Wagner M et al. 2015
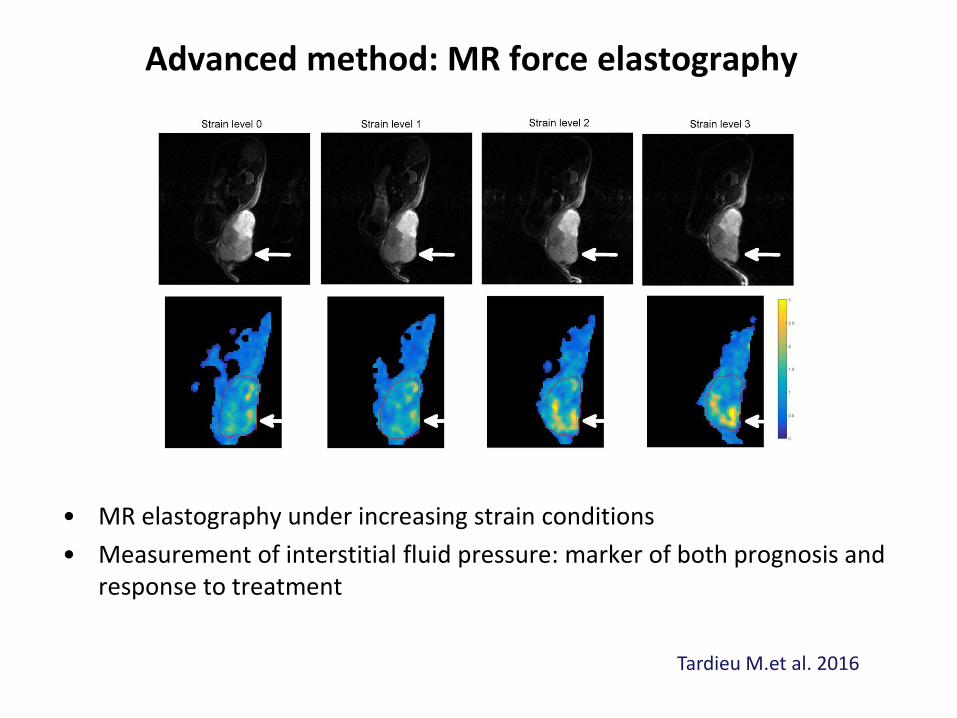
Advanced method: MR force elastography
• MR elastography under increasing strain conditions
• Measurement of interstitial fluid pressure: marker of both prognosis and response to treatment
Tardieu M.et al. 2016

Conclusions
• Imaging biomarkers, especially functional imaging biomarkers, help in liver tumor characterization and assessment of treatment response
• Integration of multiple predictors• Multiparametric MR imaging
• DW MR imaging• Perfusion MR imaging• MR elastography
• Multimodal approach• PET-MRI
• Radiomics• Regional assessment of tumors
• Data integration• Radiomics• Genomics, metabolomics• Clinical data
• Development of new biomarkers• Need for validation (reproducibility, accuracy) and standardization• Increasing need of biostatistics