Embed Size (px)
Citation preview
F
eder
al R
eser
ve B
ank
of C
hica
go
Benefits of Relationship Banking: Evidence from Consumer Credit Markets
Sumit Agarwal, Souphala Chomsisengphet, Chunlin Liu, and Nicholas S. Souleles
WP 2010-05
Benefits of Relationship Banking: Evidence from Consumer Credit Markets
Sumit Agarwala, Souphala Chomsisengphetb, Chunlin Liuc, and Nicholas S. Soulelesd
May, 2009
Abstract This paper empirically examines the benefits of relationship banking to banks, in the context of consumer credit markets. Using a unique panel dataset that contains comprehensive information about the relationships between a large bank and its credit card customers, we estimate the effects of relationship banking on the customers’ default, attrition, and utilization behavior. We find that relationship accounts exhibit lower probabilities of default and attrition, and have higher utilization rates, compared to non-relationship accounts, ceteris paribus. Such effects become more pronounced with increases in various measures of the strength of the relationships, such as relationship breadth, depth, length, and proximity. Moreover, dynamic information about changes in the behavior of a customer’s other accounts at the bank, such as changes in checking and savings balances, helps predict and thus monitor the behavior of the credit card account over time. These results imply significant potential benefits of relationship banking to banks in the retail credit market. JEL Classification: Key Words: Relationship Banking; Credit Cards, Consumer Credit, Deposits, Investments; Household Finance.
For helpful comments, we would like to thank Bert Higgins, Wenli Li, Anjan Thakor, and seminar participants at the ASSA meetings, the Bank Structure Conference at the Federal Reserve Bank of Chicago, the Conference on Research in Economic Theory and Econometrics, and the Federal Reserve Bank of Philadelphia. We also thank Jim Papadonis and Joanne Maselli for their support of this research project. We are grateful to Diana Andrade, Ron Kwolek, and Greg Pownell for excellent research assistance. The views expressed in this paper are those of the authors alone, not those of the Office of the Comptroller of the Currency or the Federal Reserve Bank of Chicago. Corresponding author: Nicholas Souleles at [email protected] a Federal Reserve Bank of Chicago b Office of the Comptroller of the Currency c Finance Department, University of Nevada - Reno d Finance Department, The Wharton School, University of Pennsylvania and NBER
1
1. Introduction
According to recent theories of financial intermediation, one of the main roles of a bank
is serving as a relationship lender.1 As a bank provides more services to a customer, it creates a
stronger relationship with the customer and gains more private information about him or her.
Such relationships can potentially benefit both banks and their customers. For instance,
relationship banking can help banks in monitoring the default risk of borrowers, providing the
banks with a comparative advantage in lending. Relationship banking can also lower banks’ cost
of information gathering over multiple products. Depending on the competitiveness of the
banking sector, such benefits to banks can lead to increased credit supply to customers, through
either greater quantities and/or lower prices of credit (e.g., Boot and Thakor, 1994).2
Empirical studies of the benefits of the relationship banking have largely focused on the
benefits to customers, corporate customers in particular. Early studies documented that the
existence of a bank relationship increases the value of a firm (e.g., Billett et al., 1985; Slovin et
al., 1993). Subsequent studies have sought to measure the effects of relationships on credit
supply to firms. These studies have emphasized different aspects of relationships, such as their
breadth (e.g., number of services provided), depth, length, and proximity. However, the results of
the studies have been mixed. For example, Petersen and Rajan (1994) find that relationship
lending affects the quantity of credit more than the price, while other studies find that customers
get either lower future contract prices (e.g., Burger and Udell, 1995; Chakravarty and Scott,
1999) or higher future contract prices (e.g., Ongena and Smith, 2002).
1 Boot (2000) provides an excellent review of the literature on relationship banking. 2 There can also be costs to relationship lending. For example, it can potentially create a “soft budget-constraint” problem, in which the customer exploits the relationship in bad times (Dewatripont and Maskin, 1995; and Bolton and Scharfstein, 1996). Or, relationship lending can potentially create a hold-up problem, providing a bank with an information monopoly that could allow it to price contracts at non-competitive terms (Sharpe, 1990; Rajan, 1992; and Wilson, 1993).

2
There has been limited empirical research on the underlying benefits of relationships to
banks.3 One exception is Mester, Nakamura, and Renault (2005), who use a sample of 100
Canadian small-business borrowers to investigate the benefits of particular relationship
information in monitoring the risk of corporate loans. They find that information about
customers’ collateral, in particular their inventory and accounts receivable, which might not be
available to banks outside of a relationship, is useful for loan monitoring. Also, changes in
transaction account balances are informative about changes in this collateral.
While the above studies analyze relationship banking in the context of firm-lender
relationships, it can also potentially matter for consumer-lender relationships. Using the Survey
of Consumer Finance [SCF], Chakravarty and Scott (1999) conclude that relationship lending
not only lowers the probability of credit rationing but also lowers the price of credit for consumer
loans. While this study provides evidence that banks pass on some the benefits of relationship
lending to consumers, it does not directly measure the underlying benefit to the banks in the first
place. We fill this gap in the literature by analyzing the economic benefits of relationship
banking to banks, in the context of retail banking.
Credit cards provide a good setting for analyzing retail relationship banking. Credit cards
are consumers’ most important source of unsecured credit, in addition to being one of the most
important means of payment. By the late 1990s, almost three-fourths of U.S. households had at
least one credit card, and of these households about three-fifths were borrowing on their cards
(1998 SCF). Aggregate credit card balances are large, currently amounting to about $900 billion
(Federal Reserve Board 2007).
3 The review by Boot (2000) concludes that “existing empirical work is virtually silent on identifying the precise sources of value in relationship banking.”
3
One important advantage of studying the credit card market, as opposed to most other
credit markets, is that it is easier to identify the information actually used by credit card issuers in
managing their accounts. This is because the issuers rely on “hard” information. Since they have
millions of accounts to manage, the issuers use automated decision rules that are functions of a
given set of variables. A special feature of our dataset is that it contains the variables used to
manage the credit card accounts in our sample. While different issuers can use somewhat
different sets of such variables, issuers generally rely very heavily on credit-risk scores (e.g.,
Moore, 1996). The scores can be thought of as the issuers’ own summary statistics for the default
risk and profitability of each account. As we discuss below, there are two main types of scores,
based on different sets of information available to the issuers, both public and private. Hence we
can use the scores to conveniently summarize the public and private information traditionally
used by credit card issuers.
Such comprehensive summaries of banks’ information have not been available in
previous studies of bank lending, especially in markets where unobserved “soft” information can
be important. Given the information used by banks to manage their accounts, we can more
cleanly test whether additional information, in this case relationship information, provides
additional predictive power.
Specifically, we examine the implications of bank relationships for key aspects of credit
card behavior, such as default, attrition and utilization rates. We use a unique, representative
dataset of about a hundred thousand credit card accounts, linked to information about the other
relationships that the account-holders have with the bank that issued their credit card accounts.
Previous studies (Gross and Souleles, 2002) have analyzed the usefulness of other, non-
relationship types of information in predicting consumer default, including macroeconomic and
4
geographic-average demographic variables, “public” credit bureau information that is available
to all potential lenders, and lenders’ “private” within-account (as opposed to across-account)
information about the past behavior of the accounts at issue. The key contribution of this study is
to use cross-account relationship information, to test whether a bank’s private information
regarding the behavior of the other accounts held by a customer at the bank provides additional
predictive power regarding the account at issue. Since our dataset samples credit card accounts,
we focus on predicting credit card behavior.
The cross-account relationship information that we use is rich and comprehensive. It
includes measures of the breadth of the relationships (number of relationships), the types of
relationships (e.g., deposit, investment, and loan accounts), the length of the relationships (age in
months), the proximity of the relationships (distance from a branch), and the depth of the
relationships (balances in dollars).
The previous corporate literature has discussed a number of different explanations as to
why such relationship information could be informative, but it is difficult to empirically
distinguish between these explanations. Some explanations tend to emphasize what can roughly
be thought of as selection mechanisms. For example, when considering loan applications, banks
might be better at screening applications from existing relationship customers. Or, perhaps
customers with multiple relationships are different in otherwise-hard-to-observe ways than non-
relationship customers. (E.g., relationship customers might be wealthier or more sophisticated, or
might face larger costs of switching to another lender.) By contrast, other explanations in the
literature tend to emphasize more dynamic mechanisms related to information production over
time and the ongoing monitoring of loans. While multiple explanations might simultaneously be
at work, we will consider some relationship information that is inherently dynamic, such as high-
5
frequency changes in the level and in the volatility of the balances in other relationships. That is,
are there informational benefits to monitoring such relationship balances over time? Such
dynamic relationship information has not generally been available in the previous literature.
While dynamic information is potentially available from any relationship, some authors have
noted the potential value of checking relationships in particular (e.g. Black 1975, Fama 1985).
Accordingly, we consider extensions regarding checking balances, such as the implications of
very low checking balances and of recent transfers in and out of checking.
Our data allows us to estimate some of the most important potential benefits of
relationship information to retail banks. First, we examine if the various measures of
relationships can help banks better predict the default behavior of credit card accounts. Second,
we also examine the implications of relationships for attrition and utilization rates. To our
knowledge, this is the first comprehensive analysis of relationships in the retail banking market.
Previewing the main results, we find substantial potential benefits from relationship
lending, through lower default risk, lower attrition, and increased utilization. Using Cox
proportional hazard models, the relationship information is found to significantly help predict
default and attrition, above and beyond all the other variables used by the bank – both public
information and private non-relationship information based only on the behavior of the credit
card account. For example, for credit card accounts with at least one other relationship with the
bank, the marginal probabilities of default and attrition are about 10% and 12% lower than those
of accounts without other relationships, ceteris paribus. More generally, the benefits to the bank
tend to increase with various measures of the strength of the relationships, including measures
analogous to those used in the prior corporate literature, such as relationship breadth, depth,
length, and proximity. Further, explicitly dynamic information about changes in the behavior of

6
the account-holders’ other relationships at the bank, such as changes in checking and savings
balances, help predict the behavior of the credit card account over time. This suggests that one
important advantage of relationships, among the various other advantages that have been
discussed in the literature, is that they can help improve the monitoring of borrowers over time.
Also, we find that relationship banking is associated with higher utilization rates. For instance,
relationship accounts have a 7 percentage point higher utilization rate compared to non-
relationship accounts, ceteris paribus.
The remainder of the paper is organized as follows. Section 2 describes the data. Section
3 discusses the empirical methodology and results. Section 4 concludes.
2. Data
We use a unique, proprietary panel dataset of credit card accounts, with associated
relationship information, from a large, national financial institution. The dataset contains a
representative sample of about a hundred thousand accounts open as of October 2001, followed
monthly for the next 24 months.
The dataset includes the key information used by the bank in managing its credit card
accounts. The dataset contains the main billing information listed on each account's monthly
statement, including total payments, spending, balances, and debt, as well as the credit limit and
APR.
The dataset also includes the two key credit-risk scores for each account, which are
lenders’ traditional summary statistics for the risk and profitability of the account. The “external”
credit score (the industry-standard FICO score) is estimated based on the credit bureau data
available for each consumer. While the credit bureaus contain some information about the full

7
range of a consumer’s credit relationships, across all lenders, the individual lenders report only a
subset of their own information about each relationship to the bureaus. The external scores
summarize this “public” information, which is available to all potential lenders. The “internal”
credit score is estimated by the lenders using their private, in-house information. Traditionally
(and true for our sample), that information has been limited to the behavior of the individual
account in question -- here the sample credit card accounts -- not the other accounts or
relationships the account-holder has at the same bank. Thus the two scores conveniently
summarize the non-relationship (private within-account and public) information used by banks in
managing credit cards.
In addition to the external credit score, the dataset also includes the subset of the
underlying credit bureau information that the bank directly collected from the credit bureaus: the
total number of bankcards held by the account-holder, across all lenders, and the balances and
limits on those cards; the number and balances on other, non-bank credit cards (such as store
cards); total balances and limits on home equity lines of credit (Helocs); total mortgage balances
(including both first and second mortgages); and total balances on student loans and auto loans.
The credit bureau variables are updated quarterly.
This data has been augmented with a number of other data sources. First, and most
importantly for our purposes, the dataset was linked to a systematic summary of the other
accounts the credit card account-holders have at the bank. Specifically, we have information
about the following types of deposit, investment, and loan relationships: checking; savings;
CD’s; mutual funds; brokerage; mortgages; home equity loans (second mortgages); and home
8
equity lines of credit.4 For each relationship type, we know the length of the relationship (age in
months) and the depth of the relationship (balances in dollars). This relationship information is
updated monthly over the sample period.5
Second, this credit data is also augmented with macroeconomic and geographic-average
demographic information based on each account-holder’s location, including: the state
unemployment rate, average state income, the fraction of people in the state lacking healthcare
coverage, and local house prices.6 Some of these variables are updated monthly while others are
updated annually. The dataset also includes the self-reported level of account-holder income
when available from the account application7, as well as an account-holder specific estimate of
wealth (based on marketing/geographic data, and coded as “high”, “medium”, or “low”) as of the
time of the origination of the account.
The sample includes credit card accounts that were open as of the start of the sample
period in October 2001.8 To focus on the effects of relationships and minimize any potential
endogeneity, for credit card account-holders with other relationships, in the reported results we
require that these other relationships have been opened before the credit card account; that is, we
exclude account-holders that initiated new relationships within our sample period subsequent to
opening the credit card account.
4 The dataset does not include a few smaller relationships, such as student loans, personal loans, and auto loans. Thus our results represent a lower bound on the total possible value of relationships, though some of this information (student and auto loans) will be partly captured by the credit bureau data that we use. 5 The exception is that balances information is not available for brokerage accounts. 6 We use the OFHEO MSA-level house prices when available; otherwise we use the state average prices. In preliminary work, we also considered additional variables, such as the state divorce rate (which however is not available for some states, such as California) and the bankruptcy exemption levels in the state (which are subsumed by our state dummies). 7 This income variable is available for slightly under half of the accounts. To avoid reducing the sample size, we include a dummy variable indicating when application income is missing, and in those cases set the value of income to zero. 8 That is, accounts that are closed at the start of the sample, due to attrition or default, have been excluded. Furthermore, to simplify the hazard analysis of account age, in the reported results we focus on accounts originated after October 1999.
9
Table 1 provides summary statistics for the key variables used below, averaged over the
two years of the sample period. The table distinguishes “relationship accounts,” which have at
least one other relationship (56% of the sample), and “non-relationship accounts,” which have no
other relationships (44%). The relationship account-holders have higher income and higher
wealth on average. They also have less debt on their account and higher internal and external
credit scores. Overall, based on the public and private within-account information, the
relationship accounts generally appear to be less risky than the non-relationship accounts. (The
credit scores are calibrated such that higher scores correspond to lower probabilities of default.)
Consistently, the relationship accounts received higher credit limits and lower APRs. Turning to
their performance over the sample period, the relationship accounts do in fact have lower default
rates, and also lower attrition rates and higher utilization rates, on average. The open question is
whether these results can be explained by the differences in their other (non-relationship)
characteristics, as opposed to their relationships.
The next section undertakes a multivariate analysis of the accounts’ behavior,
emphasizing the role of the private, cross-account relationship variables, conditional on
controlling for the other characteristics like the credit scores.
3. Empirical Results
3.1 Relationship Banking and Credit Card Default and Attrition
3.1.1 Methodology
To test if relationship banking can help banks in assessing the default and attrition risk of
credit card loans, we estimate Cox proportional hazard models for default and for attrition.9 We
use a standard industry definition of default as going bankrupt or three months delinquent,
10
whichever comes first (e.g., as in Gross and Souleles, 2002). Attrition is based on account
closing without default.
The Cox model allows for a non-parametric baseline hazard rate as well as potentially
time-varying explanatory variables. We estimate specifications of the following form:
),(lationshipReauCreditBure
manceLoanPerforMacroDemogesStateDummiTimeY
ititt,i
t,it,iitt,i
16665
646321
where Yi,t is a dummy variable indicating whether account i defaulted (or attrited) in month t.
We group the main explanatory variables into six categories: Timet represents a complete
set of month dummies, one for each month in the sample period. StateDummiesi represents a set
of dummy variables corresponding to the state in which account-holder i lives. MacroDemogi,t-6
represents the macroeconomic and demographic characteristics, such as the local unemployment
rate, plus the account-holder specific estimates of income and wealth. LoanPerformancei,t-6
includes the internal measures of the performance of the sample credit card account over the
sample period, including monthly purchases, payments, and debt, and the credit limit, interest
rate, and internal credit-risk score. CreditBureaui,t-6 represents the external credit score and the
other variables from the credit bureaus, such as total balances on credit cards, Helocs, and
mortgages.10
Such variables have been studied before. Using related duration models, Gross and
Souleles (2002) show that the external scores are very powerful predictors of consumer default.
Even given these scores, the internal scores are also very powerful predictors, which implies that
credit card issuers’ private within-account information is valuable. Nonetheless, even given the
9 We also estimated the baseline results using a multinomial logit model, and the results were qualitatively similar. 10 Unless stated otherwise, the time-varying variables in MacroDemog, LoanPerformance, CreditBureau, and Relationship are generally lagged by six months to minimize endogeneity, as in Gross and Souleles (2002). For instance, by the time an account is already three months delinquent, its credit score would have already severely deteriorated, creating essentially a mechanical relationship with the dependent variable.

11
two scores, macroeconomic and demographic characteristics are also predictive, albeit less so
quantitatively. This result suggests that lenders do not necessarily use all potentially available
information (perhaps due to regulatory or reputational concerns).
The key innovation of this study comes in assessing the incremental predictive power of
Relationship, which represents a broad array of measures of the account-holders’ relationships.
The baseline relationship measure labeled R1 simply uses a dummy variable to identify the credit
card account-holders who have at least one other relationship at the bank at origination. (The
omitted, baseline category is non-relationship accounts). R2 measures the breadth of the
relationship, using dummy variables for the number of relationships (1 to 6+, omitting 0
relationships). R3 focuses on the types of relationship, grouping the relationships into three
broad categories (again using dummy variables): deposit relationships, investment relationships,
and loan relationships. R4 identifies the types of relationships more finely (8 categories):
checking and savings accounts (deposit relationships); CDs, brokerage, and mutual fund
accounts (investment relationships); and mortgages, home equity loans, and home equity lines
(loan relationships). R5 measures the length of the relationships (age in months since opening),
for each of the eight relationship categories separately. R6 focuses on the proximity of the
relationship, using interacted dummy variables to distinguish account-holders that have a
relationship and reside in states with bank branches. R7 measures the depth of the relationships
by the balances of each of the relationship categories (in addition to controlling for the presence
of each relationship as in R4). R8 combines the previous measures simultaneously.
To try to distinguish more specifically the potential benefits of relationships in the
ongoing monitoring of loans, we also consider more dynamic relationship information
(controlling for the level and presence of balances using R4 and R7). R9 considers the effect of

12
changes in the various types of balances (for convenience, between months t-6 and t-5). R10
considers the volatility of balances. (In light of the available sample period, it uses the standard
deviation between t-1 and t-12.) R11 uses instead the change in the volatility of balances (the
standard deviation between t-1 and t-6, minus the standard deviation between t-7 and t-12). R12
focuses more specifically on checking balances, using an indicator for whether these balances
have fallen below $2000. R13 uses instead indicator variables for whether there were matching
balance transfers between the checking account and the other accounts.
In all specifications, the standard errors are clustered to adjust for heteroscedasticity
across accounts and serial correlation within accounts.
3.1.2 Results
We first show how the baseline hazard rates from the Cox model vary with the number of
relationships, without controlling for other covariates. Figure 1a shows the associated survival
curves for (lack of) default. The survival curves are monotonically increasing with the number of
relationships. For example, for accounts with just one other relationship, the probability of not
defaulting within 48 months is about 96%. But for accounts with six or more relationships, that
probability significantly rises, to about 99%. Conversely, the probability of default
monotonically declines with the number of relationships. Figure 1b shows the analogous survival
curves for (lack of) attrition. Again, the curves substantially and monotonically increase with the
number of relationships.
We now estimate the full multivariate Cox model, following equation (1), first for
default. We begin by briefly discussing the results for the non-relationship variables, for our
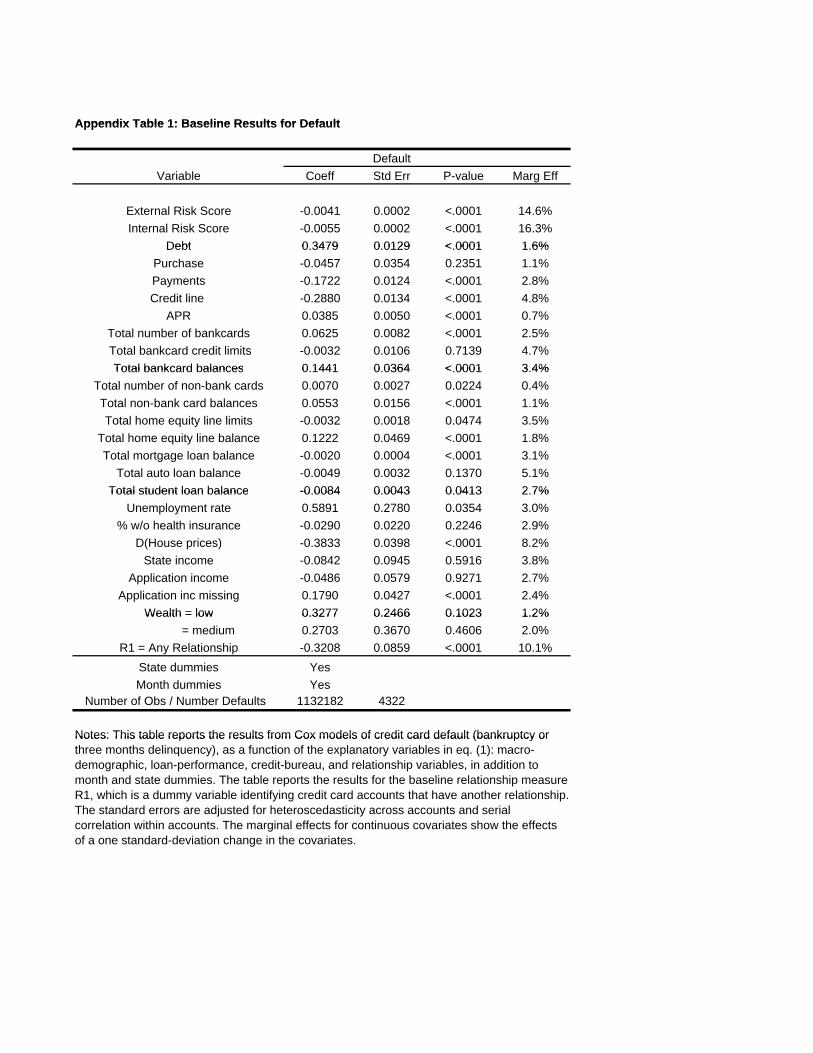
baseline specification R1 (for brevity, reported in Appendix Table 1). Starting with the credit
variables, the external and internal scores have negative and significant coefficients. As
13
expected, higher scores are predictive of lower probabilities of default. The marginal effects for
continuous covariates like the scores show the effects of a one standard-deviation increase in the
covariates. A one standard-deviation larger external (internal) score is associated with a 15%
(16%) reduction in the probability of credit card default relative to the baseline default rate,
ceteris paribus. These are economically significant effects.
Many of the other credit variables are also significant, though their marginal effects are
much smaller. The probability of default significantly increases with the amount of debt on the
credit card account. It also increases with the total number of credit cards held by the account-
holder (both bankcard and non-bankcard), and the balances on those cards. A larger credit limit
or a lower APR on the account is associated with a lower probability of default. As discussed in
the prior literature, this likely reflects the endogeneity of credit supply: on average issuers
extended better credit terms to borrowers that were less risky. Hence the results for such
covariates should not be interpreted as causal. For our purposes it is conservative to control for
such variables, since they are in the issuer’s (non-relationship) information set. Similarly for
Helocs, where one can also distinguish credit demand (balances) and credit supply (credit limits),
larger balances are associated with more default, but larger limits are associated with less default.
Other credit balances where one cannot so readily distinguish credit supply and demand, such as
mortgage balances, have overall negative coefficients. In sum, the public information from the
credit bureaus is predictive of default, and even given this information the bank’s private within-
account information is also predictive.
Turning to the macroeconomic-demographic variables, adverse local economic
conditions are generally associated with more default. Higher local unemployment and lower
house price growth are associated with significantly higher default rates, even given the state and
14
month dummies. A one standard-deviation increase in unemployment (decrease in house price
growth rates) corresponds to a 3% increase (8% increase) in the probability of default. Higher
income and wealth are associated with less default, though these results are not statistically
significant. (This could reflect measurement error in these estimates of income and wealth.
“Low-doc” accounts, for which income was not collected at the time of application, have
significantly higher default rates.) Overall, these (non-relationship) results are generally
consistent with prior research (Gross and Souleles, 2002).
We now focus on the results for the relationship information. The baseline relationship
measure R1 simply uses an indicator variable for having another relationship. The omitted group
is non-relationship accounts. The relationship variable has a significant negative coefficient. This
implies that relationship accounts have a lower probability of default than non-relationship
accounts, ceteris paribus. According to the marginal effect, the probability of default is 10%
lower on average. This is an economically significant effect (and larger than the marginal effects
of all the other covariates apart from the credit scores). Given the rich set of covariates, including
both the public information and private within-account information of the issuer, this result
demonstrates the predictive value of cross-account relationship information.
Table 2 considers the other measures of relationships. Each horizontal panel in the table
shows the results from the Cox model for separate specifications using each of the relationship
measures R1 to R13 separately. (For brevity, only the relationship results are reported. For
reference, the table repeats the results for R1.) R2 measures relationship breadth according to the
number of relationships. As in Figure 1, the probability of default significantly and
monotonically declines with the number of relationships. According to the marginal effects, the
15
probability of default decreases by 2% for the first relationship, and by 18% for the sixth (or
more) relationship.
Relationship measure R3 considers the effects of different types of relationships. The
presence of each of the three broad relationship types is associated with lower probabilities of
default. The magnitude of the effect is largest for investment relationships. The probability of
default decreases by 14% with investments relationships, versus 9% for deposit relationships and
4% for loan relationships. R4 uses a finer partition of the relationship types. Within investment
accounts, CD relationships have the largest (negative) marginal effects. All the other relationship
types also have significant, albeit smaller, negative effects.
Measure R5 focuses on the length of the other relationships (age in months, distinct from
the age of the credit card account which is separately taken into account in the Cox model). For
each relationship type, the probability of default significantly declines with the age of the
relationship. The marginal effects range in size from 3% to 13% declines (for a one standard-
deviation increase in age), with the largest effect arising from the age of a CD relationship.
R6 focuses on the proximity of the relationship, using an indicator for account-holders
that reside in states with bank branches, and the interaction of this variable with the indicator
(R1) for having a relationship.11 The interaction term is significantly negative. This implies that
the (negative) effect of relationships on default risk is stronger when account-holders reside
closer to branches. Thus, even given the other controls for local conditions, proximity to the bank
matters (as in Petersen and Rajan, 2002).
R7 focuses instead on relationship depth, using ln(balances + $1). (The specification also
includes the indicator variables for having the corresponding relationship, as in R4.) For all
11 This specification requires dropping the state dummies in equation (1). Accordingly we focus on the interaction term, not the non-interacted indicator for proximity.
16
relationships, larger balances at the bank are associated with smaller probabilities of default. For
asset balances, the marginal effects range from 7% to 20%. The marginal effects are much
smaller in magnitude for credit balances, though still negative. Recall that the specification
controls for total credit balances for each of the credit relationship types using the credit bureau
data, as well as (a more coarse measure of) wealth. Hence, these results can be interpreted as
indicating that the larger the share of an account-holder’s various balances at this particular
bank, the lower the probability of default on the credit card from the bank.
R8 considers simultaneously the previous measures of relationship, specifically
relationship breadth, type, length, proximity, and depth. Not surprisingly, the marginal effects are
often smaller, but nonetheless the general pattern of results is similar to that above. All of the
relationship measures retain their significant negative coefficients.
Overall, under all the measures of relationship R1-R7, relationship accounts have lower
probabilities of default. Similar measures of relationships have been considered in the previous
literature on corporate lending. To try to distinguish the specifically dynamic notions of the
benefits of relationships, the subsequent specifications consider more explicitly dynamic
measures of relationship information.
Relationship measure R9 focuses on the change in relationship balances (in addition to
the level of balances from R7 and the indicators from R4).12 The specification also includes the
corresponding changes in the external and internal credit scores. Increases in the scores have
negative, statistically and economically significant effects. As expected, upwards revisions in the
scores reflect the arrival of information indicating a reduction in default risk. Even controlling
12 Since our sample excludes relationships opened subsequent to the credit card account, these results are driven by changes in the intensive margin of balances. R9 does not include the (high-frequency) changes in the CD and mortgage and home equity loan balances, since these mostly reflect interest and regular amortization, and so are a priori not as informative.
17
for this, the changes in balances also have significant negative coefficients. Thus increases over
time in relationship balances are associated with declines in default risk, ceteris paribus. The
marginal effects are substantial, ranging from 6%-13% declines. These results show the value of
relationships specifically in the ongoing monitoring of loans.
R10 measures the volatility of balances, across the prior 12 months. The specification
also includes the volatility of the credit scores. Accounts with more volatile scores have higher
probabilities of default (consistent with Musto and Souleles, 2006). In addition, more volatile
relationship balances are also associated with higher default risk, with the marginal effects
ranging between 5% - 12%. R11 considers instead the change in the volatility of the balances,
over the prior two six-month periods. The coefficients are again significantly positive. Increases
in volatility are also associated with higher default risk.
The remaining relationship measures focus on checking balances in particular. R12 uses
an indicator for whether checking balances fall to a low level, here below $2000. Since the
specification also includes the overall level of checking balances (R7), this indicator reflects the
discrete increase in risk associated with low balances per se. The estimated coefficient is
significantly positive. Low checking balances are associated with a 13% marginal increase in the
probability of default. Finally, R13 uses an indicator that identifies matching balance transfers
between the checking account and the other accounts. The first indicator identifies whether
balances were moved to checking from the other accounts. The coefficient is significantly
positive. Further analysis shows that this result is driven mostly by transfers from the savings and
investment accounts. Thus, when account-holders appear to dissave, the probability of default is
higher. This is consistent with their having faced a negative shock. Conversely, the negative
coefficient on the second indicator implies that when account-holders save, transferring balances

18
from checking to the other accounts, the probability of default is lower. This is consistent with a
positive shock. The marginal effect is much larger for dissaving, implying a 13% increase in the
probability of default.
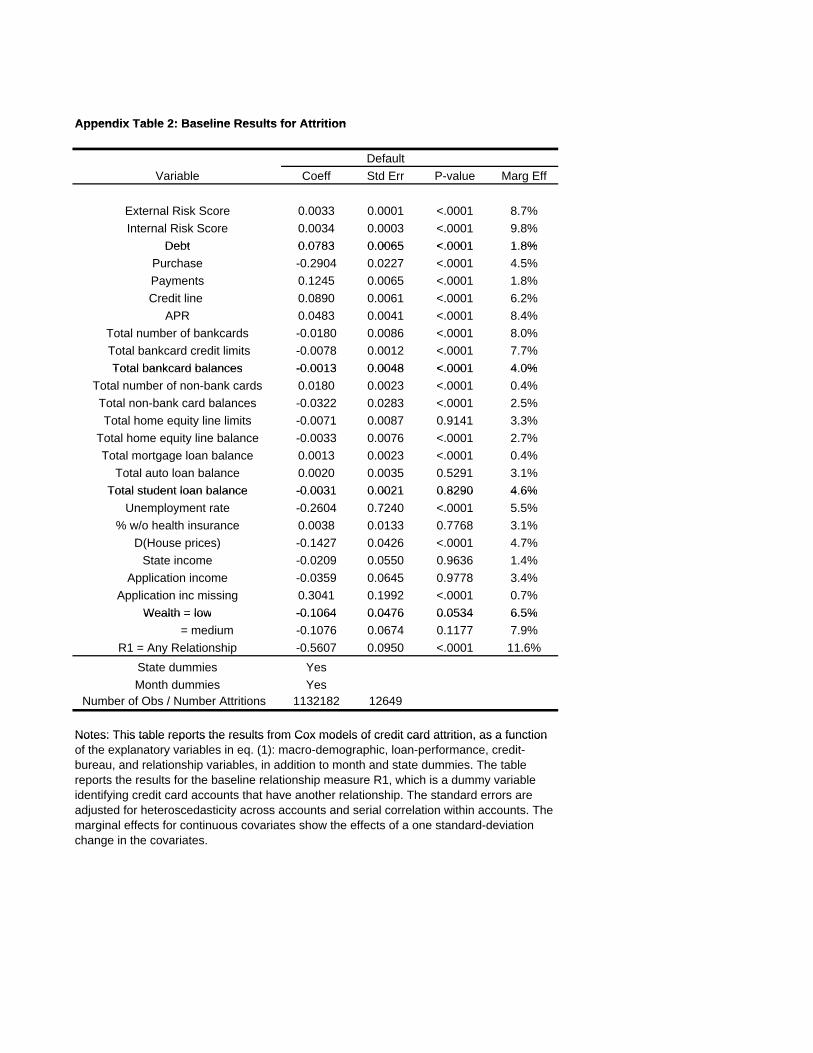
Table 3 presents the results of estimating equation (1) instead for attrition, again focusing
on the relationship measures. (For brevity, the non-relationship results are left to the appendix.)
In general the pattern of the relationship results is qualitatively similar to that in Table 2 (and so
our discussion of them will be brief). That is, the same relationship information that is associated
with lower default rates is also generally associated with lower attrition rates.
For example, using the baseline measure R1, relationship accounts have on average a
12% lower probability of attrition than non-relationship accounts, ceteris paribus. This result is
statistically and economically significant. The effect on attrition is again monotonic with the
number of relationships (R2), ranging from a 3% decline in attrition probability for the first
relationship to a 21% decline for the sixth relationship. The effect is significant for all of the
relationship types (R3 and R4), especially investment and deposit relationships. The probability
of attrition significantly declines with the length of the relationships (R5). The (negative) effect
of relationships on attrition is stronger with proximity (R6). Larger relationship balances (R7 and
R12) and increases in relationship balances (R9) are also associated with lower attrition rates, but
more (and increased) volatility in the balances is associated with higher attrition rates (R10 and
R11). Under R13, balance transfers from checking (i.e., saving) are associated with lower
attrition, but transfers to checking (i.e., dissaving) are associated with higher attrition, with the
marginal effect being larger for the latter.
19
In sum, across the entire rich array of relationship measures that we have considered,
including the dynamic measures, relationship accounts have lower probabilities of default and
attrition, ceteris paribus.
3.2 Relationship Banking and Credit Card Utilization
3.2.1 Methodology
In this section we consider the implications of relationships on a standard measure of
account usage, the account utilization rate (i.e., account balances relative to the account limit).
For consistency, we generally use the same covariates as in equation (1), but replace the
dependent variable Yi,t with the utilization rate of account i in month t.13 We estimate by OLS,
allowing for heteroscedasticity across accounts and serial correlation within accounts.
3.2.2 Results
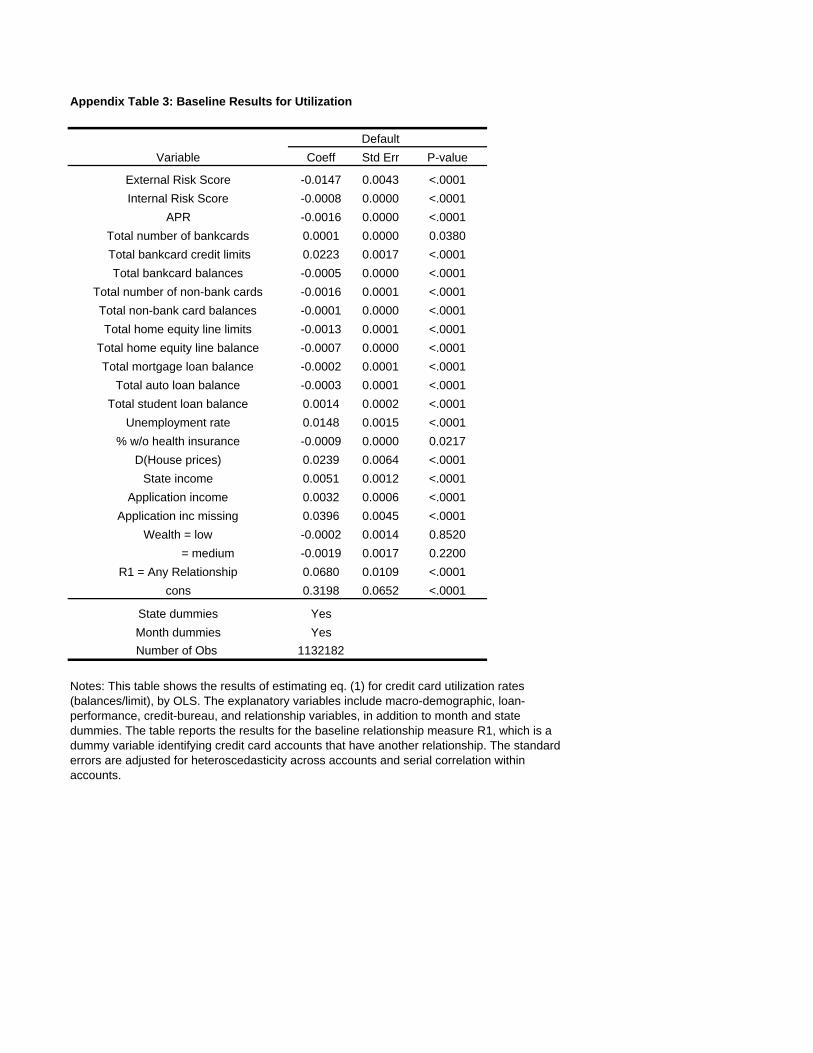
We begin by briefly noting some of the results for the non-relationship variables, which
appear in Appendix Table 3 for the baseline specification using R1. Higher credit scores are
correlated with lower utilization rates. This is not surprising, since the scores are known to take
utilization into account negatively. Credit balances (total bankcard, non-bankcard, home equity
line, mortgage and auto balances, with the exception of student loan balances) come in with
significant negative coefficients, suggesting some substitutability with balances on the sample
credit cards, though the magnitudes of the effects are small. Higher unemployment is associated
with significantly greater utilization, though higher house price growth (and higher income) is
also associated with significantly greater utilization, which is indicative of a wealth effect. The
13 Unlike equation (1), we exclude the account limit, debt, payment and purchase amounts as independent variables, since they are closely related to the dependent variable.
20
effect of house prices is substantial: Each percentage point increase in house price growth is
associated with a 2.4 percentage point (p.p.) increase in the utilization rate.14
Table 4 reports the results for the relationship variables. The coefficient on relationship
measure R1 is significantly positive. Hence relationship accounts have higher utilization rates
than non-relationship accounts, ceteris paribus. Relative to an average utilization rate of about 20
p.p., the average difference of 7 p.p. is substantial.15 Using measure R2, utilization significantly
and monotonically increases with the number of relationships. The utilization rate is 2 p.p. higher
for accounts with one other relationship, and 14 p.p. higher for accounts with at least six
relationships. Under measures R3 and R4, utilization increases with each type of relationship,
especially checking and brokerage relationships (by about 9 p.p.). Under R5, utilization also
increases with the length of each type of relationship.
Under R6, interacting the relationship indicator (R1) with the indicator for proximity
leads to a significant positive coefficient. Thus the effect of relationships on utilization is larger
when account-holders live near a bank branch.
Using R7, the coefficients on relationship balances are significantly positive. Hence,
given total balances, larger shares of balances at the bank are associated with greater usage of the
credit card from the bank. Using R9, changes in relationship balances also generally have
positive effects. The notable exception is that an increase in Heloc balances has a significant
negative effect. This is consistent with a degree of substitutability between home equity lines of
14 This result, as well as the results for the other variables in the table, is similar using debt normalized by the limit as the dependent variable. 15 The conclusion is the same using debt normalized by the limit as the dependent variable, even though unconditionally relationship accounts have lower debt and higher limits than non-relationship accounts. For debt, the coefficient on R1 is accordingly somewhat smaller at .033, but still statistically and economically significant.
21
credit and credit card lines of credit. Under R10 and R11, higher (and increased) volatility of
balances is associated with lower utilization.
Under R12, given the level of checking balances (R7), the indicator for low balances is
not significant. However, under R13, transfers of balances to checking from other accounts (in
particular savings and investment accounts, i.e., dissaving) are associated with significantly
higher credit card utilization, by about 10 p.p. on average. Conversely, transfers from checking
to the other accounts (i.e., saving) are associated with significantly lower utilization, by about 8
p.p. on average. These results are suggestive of the arrival of negative and positive shocks,
respectively, consistent with the previous results for R13 for default and attrition. More
generally, the various results regarding checking relationships imply that dynamic information
from checking accounts in particular can be useful in the ongoing monitoring of loans. Changes
in the behavior of checking accounts can provide indirect information about shocks and other
factors that otherwise are hard for a bank to observe directly.
4. Conclusion
This study provided direct evidence of the potential benefits of relationship banking to
retail banks. The results indicate that, even controlling for traditional sources of bank
information (both public information and private, within-account information) and other
variables, credit card account-holders with other relationships at a bank tend to have higher
utilization rates yet lower default and attrition rates. In particular, dynamic information about
changes in the behavior of an account-holder’s other relationships helps predict the behavior of
the credit card account over time. This is consistent with the view that, among the various

22
potential benefits of relationship banking, relationships can help banks better monitor their loans
over time.
These results imply that relationship information is valuable in a predictive sense, but
how exactly banks should use this information requires additional considerations. The optimal
use of information and optimal contract design, both from the point of view of the bank and
socially, is an important but difficult question that is beyond the scope of this paper. First, banks
need to consider how consumers and their competitors would respond to the use of the
information. Second, government policies can restrict certain uses of information, including
cross-account information. In addition to considering the benefits of such restrictions, a
comprehensive analysis of such policies should also consider the potential efficiency loss from
excluding information that is predictive.

23
References
Agarwal, S., B. W. Ambrose, and C. Liu, 2004, “Credit lines and credit utilization,” Journal of Money, Credit and Banking (forthcoming). Berger, A. N., L. F. Klapper, and G. F. Udell, 2001, “The ability of banks to lend to informationally opaque small businesses,” Journal of Banking and Finance, 25 (12), 2127-2167 Berger, A. N., and G. F. Udell, 1995, “Relationship lending and lines of credit in small firm finance,” Journal of Business 68(3), 351-381 Billet, M. T., and M. J. Flannery, and J. A. Garfinkel, 1995, “The effect of lender identity on a borrowing firm’s equity return,” Journal of Finance, 50(2), 699-718 Black, F., 1975, “Bank funds management in an efficient market,” Journal of Financial Economics, 2, 323-39. Bolton, P., and D. S. Scharfstein, 1996, “Optimal debt structure and the number of creditors,” Journal of Political Economy, 104, 1-25 Boot, A., 2000, “Relationship banking: What do we know?” Journal of Financial Intermediation, 9, 7-25 Boot, A., and A. V. Thakor, 1994, “Moral hazard and secured lending in an infinitely repeated credit market game,” International Economic Review, 35, 899-920 Chakravarty, S., and J. S. Scott, 1999, “Relationships and rationing in consumer loans,” Journal of Business, 72(4), 523-544 Cole, R. A., 1998, “The importance of relationships to the availability of credit,” Journal of Banking and Finance, 22, 959-977 Degryse, H., and P. V. Cayseele, 2000, “Relationship lending within a bank-based system: Evidence from European small business data,” Journal of Financial Intermediation 9, 90-109 Dewatripont, M., and E. Maskin, 1995, “Credit and efficiency in centralized and decentralized economies,” Review of Economic Studies, 62, 541-555 Fama, E., 1985, “What’s different about banks?” Journal of Monetary Economics, 15, 29-39 Gross, D., and N. S. Souleles, 2002, “An empirical analysis of personal bankruptcy and delinquency,” Review of Financial Studies 15(1), 319-347 Machauer, A., and M. Weber, 2000, “Number of bank relationships: An indicator of competition, borrower quality, or just size?” Working Paper, University of Mannheim.
24
Mester, L. J., L. I. Nakamura, and M. Renault, 2005, “Transactions accounts and loan monitoring,” Working Paper, Federal Reserve Bank of Philadelphia. Moore, Mary, 1996, “Credit Scoring’s Uses Expand as It Gains Acceptance,” The American Banker, 4A.
Musto, D., and Souleles, N., 2006, “A Portfolio View of Consumer Credit,” Journal of Monetary Economics, 53(1), January, pp. 59-84.
Ongena, S., and D. Smith, 2002, “Empirical evidence on the duration of banking relationships,” forthcoming, Journal of Financial Economics. Petersen, M. A., and R. G. Rajan, 1994, “The benefits of lending relationships: Evidence from small business data” Journal of Finance, 49(1), 3-37 Petersen, M. A., and R. G. Rajan, 2002, “Does distance still matter? The information revolution in small business lending,” forthcoming, Journal of Finance Rajan, R. G., 1992, “Insiders and outsiders: The choice between informed and arms length debt, Journal of Finance, 47, 1367-1400 Sharpe, S., 1990, “Asymmetric information, bank lending and implicit contracts: A stylized model of customer relationships, Journal of Finance, 45, 1069-1366 Slovin, M. B., M. E. Sushka, J. A. Polocheck, 1993, “The value of bank durability: Borrowers as bank stakeholders, Journal of Finance, 48, 247-266 Wilson, P. F., 1993, “The pricing of loans in a bank-borrower relationship,” Working Paper, Indiana University.

25
Figure 1a Survival Curves for Number of Relationships (Default)
0.93
0.94
0.95
0.96
0.97
0.98
0.99
1.00
0 8 11 14 17 20 23 26 29 32 35 38 41 44 47
Age
Surv
ival
Rat
e
One Rel Two Rel Three Rel
Four Rel Five Rel Six Rel
Figure 1b Survival Curves for Number of Relationships (Attrition)
0.800.820.840.860.880.900.920.940.960.981.00
0 8 11 14 17 20 23 26 29 32 35 38 41 44 47
Age
Surv
ival
Rat
e
One Rel Two Rel Three RelFour Rel Five Rel Six Rel
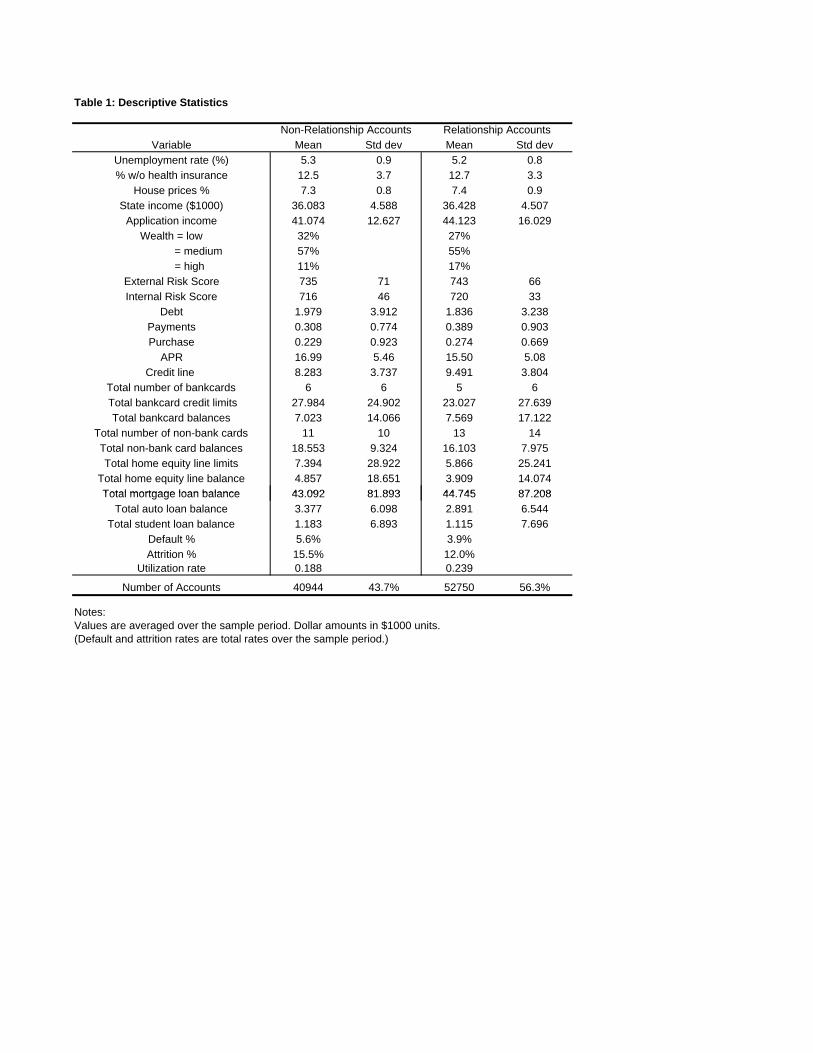
Table 1: Descriptive Statistics
Variable Mean Std dev Mean Std dev
Unemployment rate (%) 5.3 0.9 5.2 0.8
% w/o health insurance 12.5 3.7 12.7 3.3
House prices % 7.3 0.8 7.4 0.9
State income ($1000) 36.083 4.588 36.428 4.507
Application income 41.074 12.627 44.123 16.029
Wealth = low 32% 27%
= medium 57% 55%
= high 11% 17%
External Risk Score 735 71 743 66
Internal Risk Score 716 46 720 33
Debt 1.979 3.912 1.836 3.238
Payments 0.308 0.774 0.389 0.903
Purchase 0.229 0.923 0.274 0.669
APR 16.99 5.46 15.50 5.08
Credit line 8.283 3.737 9.491 3.804
Total number of bankcards 6 6 5 6
Total bankcard credit limits 27.984 24.902 23.027 27.639
Total bankcard balances 7.023 14.066 7.569 17.122
Total number of non-bank cards 11 10 13 14
Total non-bank card balances 18.553 9.324 16.103 7.975
Total home equity line limits 7.394 28.922 5.866 25.241
Total home equity line balance 4.857 18.651 3.909 14.074
Total mortgage loan balance 43 092 81 893 44 745 87 208
Non-Relationship Accounts Relationship Accounts
Total mortgage loan balance 43.092 81.893 44.745 87.208
Total auto loan balance 3.377 6.098 2.891 6.544
Total student loan balance 1.183 6.893 1.115 7.696
Default % 5.6% 3.9%
Attrition % 15.5% 12.0%Utilization rate 0.188 0.239
Number of Accounts 40944 43.7% 52750 56.3%
Notes:Values are averaged over the sample period. Dollar amounts in $1000 units.(Default and attrition rates are total rates over the sample period.)

Table 2: Implications of Relationships for Default
DefaultVariable Coeff Std Err P-value Marg Eff
R 1. Relationship Relationship Indicator -0.3208 0.0859 <.0001 10.1%
R 2. Breadth of RelationshipsNumber of Bank Relationships=1 -0.2628 0.0356 <.0001 1.6%
=2 -0.2307 0.0416 <.0001 3.1% =3 -0.3258 0.1270 <.0001 6.3% =4 -0.2539 0.1221 <.0001 9.4% =5 -0.6404 0.3151 <.0001 10.6%
=6+ -0.6253 0.2465 <.0001 17.9%R 3. Type of Relationships (Broad)
Deposit Relationships -0.2410 0.0672 <.0001 9.3%Investment Relationship -0.3366 0.1199 <.0001 14.1%
Loan Relationship -0.0303 0.0129 <.0001 4.2%R 4. Type of Relationships (Narrow)
Checking Dummy -0.1217 0.0391 <.0001 6.6%Savings Dummy -0.2743 0.0697 <.0001 8.0%
Brokerage Dummy -0.2534 0.0891 <.0001 10.5%CD Dummy -0.4579 0.1237 <.0001 16.6%
Mutual Fund Dummy -0.3714 0.0320 <.0001 14.9%Home Equity Line Dummy -0.0162 0.0047 <.0001 7.4%Home Equity Loan Dummy -0.0107 0.0047 <.0001 2.8%
Mortgage Loan Dummy -0.0167 0.0052 <.0001 3.6%R 5. Length of Relationships
Age of Checking Relationship -0.0013 0.0002 <.0001 3.4%Age of Checking Relationship 0.0013 0.0002 .0001 3.4%Age of Savings Rel -0.0061 0.0004 <.0001 5.8%
Age of Brokerage Rel -0.0108 0.0009 <.0001 9.8%Age of CD Rel -0.0213 0.0054 <.0001 13.2%
Age of Mutual Fund Rel -0.0163 0.0015 <.0001 6.3%Age of Home Equity Line Rel -0.0009 0.0009 <.0001 11.5%Age of Home Equity Loan Rel -0.0018 0.0009 <.0001 9.4%
Age of Mortgage Loan Rel -0.0059 0.0021 <.0001 10.0%R 6. Proximity of Relationship
Relationship Indicator -0.3041 0.0812 0.000 6.0%State with Branch Indicator -0.2728 0.0762 <.0001 7.6%Relationship * Branch State -0.1231 0.0510 <.0001 3.0%

Table 2: Implications of Relationships for Default (ctd)
DefaultVariable Coeff Std Err P-value Marg Eff
R 7. Depth of Relationships (ln(Bal) & R4)Checking Balance -0.0612 0.0139 <.0001 13.2%Savings Balance -0.0731 0.0188 <.0001 7.2%
CD Balance -0.0780 0.0210 <.0001 10.6%Mutual Fund Balance -0.1806 0.0433 <.0001 19.8%
Home Equity Line Balance -0.1173 0.0333 <.0001 3.1%Home Equity Loan Balance -0.0817 0.0344 <.0001 5.8%
Mortgage Loan Balance -0.1984 0.0776 <.0001 3.3%R 8. Combined Relationship Measures
Number of Bank Relationships=1 -0.2551 0.0354 <.0001 0.1% =2 -0.2292 0.0409 <.0001 1.8% =3 -0.3129 0.1262 <.0001 4.7% =4 -0.2453 0.1200 <.0001 7.0% =5 -0.6307 0.3054 <.0001 10.1%
=6+ -0.6189 0.2458 <.0001 17.0%Checking Dummy -0.1169 0.0376 <.0001 4.3%Savings Dummy -0.2573 0.0649 <.0001 5.3%
Brokerage Dummy -0.2417 0.0840 <.0001 7.8%CD Dummy -0.4231 0.1195 <.0001 13.1%
Mutual Fund Dummy -0.3658 0.0308 <.0001 11.7%Home Equity Line Dummy -0.0150 0.0045 <.0001 4.2%Home Equity Loan Dummy -0.0098 0.0045 <.0001 0.5%
Mortgage Loan Dummy -0.0160 0.0048 <.0001 0.7%Age of Checking Relationship -0.0012 0.0002 <.0001 2.6%
Age of Savings Rel -0.0059 0.0004 <.0001 5.1%Age of Savings Rel 0.0059 0.0004 .0001 5.1%Age of Brokerage Rel -0.0108 0.0009 <.0001 8.9%
Age of CD Rel -0.0212 0.0052 <.0001 11.7%Age of Mutual Fund Rel -0.0156 0.0015 <.0001 6.2%
Age of Home Equity Line Rel -0.0009 0.0009 <.0001 11.0%Age of Home Equity Loan Rel -0.0017 0.0008 <.0001 8.6%
Age of Mortgage Loan Rel -0.0058 0.0021 <.0001 8.8%State with Branch Indicator -0.2674 0.0749 <.0001 3.0%Relationship * Branch State -0.1222 0.0507 <.0001 1.8%
Checking Balance -0.0604 0.0137 <.0001 12.5%Savings Balance -0.0720 0.0182 <.0001 5.7%
CD Balance -0.0749 0.0208 <.0001 9.0%Mutual Fund Balance -0.1767 0.0421 <.0001 18.4%
Home Equity Line Balance -0.1147 0.0327 <.0001 4.0%Home Equity Loan Balance -0.0788 0.0339 <.0001 4.2%
Mortgage Loan Balance -0.1974 0.0756 <.0001 2.1%
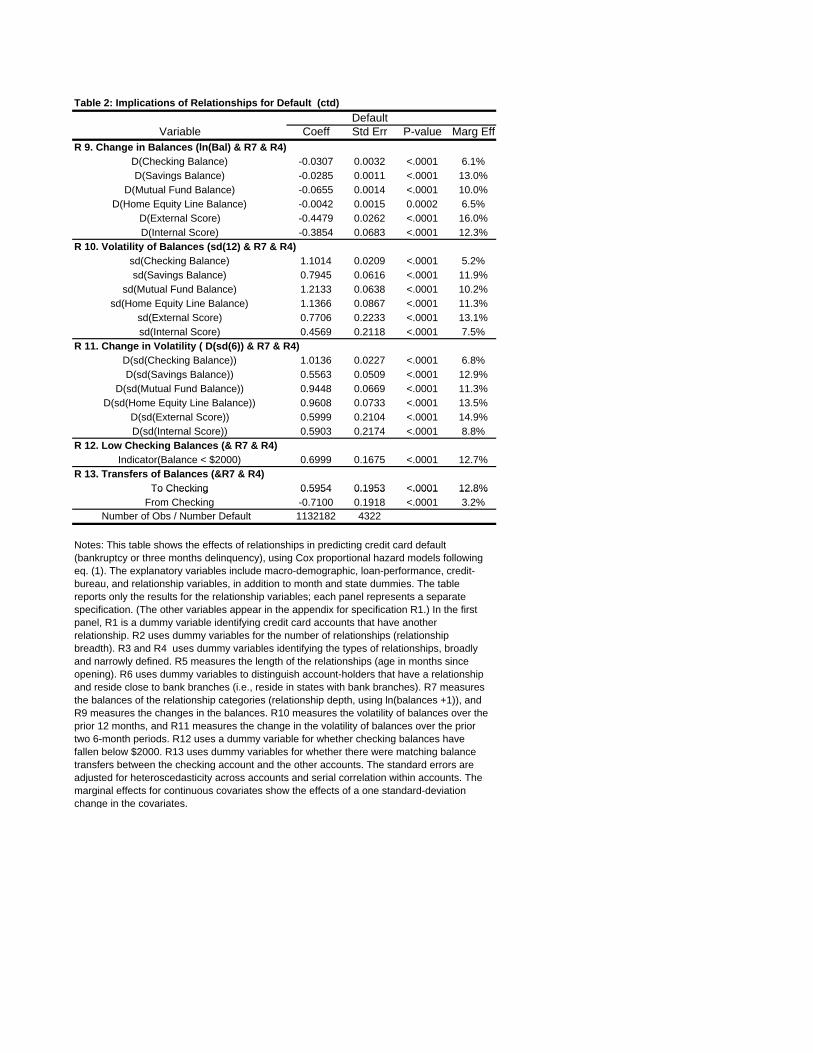
Table 2: Implications of Relationships for Default (ctd)
DefaultVariable Coeff Std Err P-value Marg Eff
R 9. Change in Balances (ln(Bal) & R7 & R4)D(Checking Balance) -0.0307 0.0032 <.0001 6.1%D(Savings Balance) -0.0285 0.0011 <.0001 13.0%
D(Mutual Fund Balance) -0.0655 0.0014 <.0001 10.0%D(Home Equity Line Balance) -0.0042 0.0015 0.0002 6.5%
D(External Score) -0.4479 0.0262 <.0001 16.0%D(Internal Score) -0.3854 0.0683 <.0001 12.3%
R 10. Volatility of Balances (sd(12) & R7 & R4)sd(Checking Balance) 1.1014 0.0209 <.0001 5.2%sd(Savings Balance) 0.7945 0.0616 <.0001 11.9%
sd(Mutual Fund Balance) 1.2133 0.0638 <.0001 10.2%sd(Home Equity Line Balance) 1.1366 0.0867 <.0001 11.3%
sd(External Score) 0.7706 0.2233 <.0001 13.1%sd(Internal Score) 0.4569 0.2118 <.0001 7.5%
R 11. Change in Volatility ( D(sd(6)) & R7 & R4)D(sd(Checking Balance)) 1.0136 0.0227 <.0001 6.8%D(sd(Savings Balance)) 0.5563 0.0509 <.0001 12.9%
D(sd(Mutual Fund Balance)) 0.9448 0.0669 <.0001 11.3%D(sd(Home Equity Line Balance)) 0.9608 0.0733 <.0001 13.5%
D(sd(External Score)) 0.5999 0.2104 <.0001 14.9%D(sd(Internal Score)) 0.5903 0.2174 <.0001 8.8%
R 12. Low Checking Balances (& R7 & R4)Indicator(Balance < $2000) 0.6999 0.1675 <.0001 12.7%
R 13. Transfers of Balances (&R7 & R4)To Checking 0.5954 0.1953 <.0001 12.8%To Checking 0.5954 0.1953 .0001 12.8%
From Checking -0.7100 0.1918 <.0001 3.2%Number of Obs / Number Default 1132182 4322
Notes: This table shows the effects of relationships in predicting credit card default (bankruptcy or three months delinquency), using Cox proportional hazard models following eq. (1). The explanatory variables include macro-demographic, loan-performance, credit-bureau, and relationship variables, in addition to month and state dummies. The table reports only the results for the relationship variables; each panel represents a separate specification. (The other variables appear in the appendix for specification R1.) In the first panel, R1 is a dummy variable identifying credit card accounts that have another relationship. R2 uses dummy variables for the number of relationships (relationship breadth). R3 and R4 uses dummy variables identifying the types of relationships, broadly and narrowly defined. R5 measures the length of the relationships (age in months since opening). R6 uses dummy variables to distinguish account-holders that have a relationship and reside close to bank branches (i.e., reside in states with bank branches). R7 measures the balances of the relationship categories (relationship depth, using ln(balances +1)), and R9 measures the changes in the balances. R10 measures the volatility of balances over the prior 12 months, and R11 measures the change in the volatility of balances over the prior two 6-month periods. R12 uses a dummy variable for whether checking balances have fallen below $2000. R13 uses dummy variables for whether there were matching balance transfers between the checking account and the other accounts. The standard errors are adjusted for heteroscedasticity across accounts and serial correlation within accounts. The marginal effects for continuous covariates show the effects of a one standard-deviation change in the covariates.

Table 3: Implications of Relationships for Attrition
AttritionVariable Coeff Std Err P-value Marg Eff
R 1. Relationship Relationship Indicator -0.5607 0.0950 <.0001 11.6%
R 2. Breadth of Relationships Number of Bank Relationships=1 -0.8552 0.0764 <.0001 3.2%
=2 -0.7798 0.0696 <.0001 3.8% =3 -0.7196 0.0807 <.0001 10.6% =4 -0.9266 0.0968 <.0001 14.6% =5 -0.9731 0.1146 <.0001 18.4%
=6+ -0.6895 0.0799 <.0001 21.4%R 3. Type of Relationships (Broad)
Deposit Relationships -0.1067 0.0474 <.0001 11.3%Investment Relationship -0.2889 0.0396 <.0001 13.3%
Loan Relationship -0.2457 0.1294 <.0001 7.8%R 4. Type of Relationships (Narrow)
Checking Dummy -0.1537 0.0295 <.0001 10.3%Savings Dummy -0.1251 0.0500 <.0001 6.4%
Brokerage Dummy -0.6333 0.0759 <.0001 2.4%CD Dummy -0.2469 0.0764 <.0001 5.7%
Mutual Fund Dummy -0.1103 0.0698 <.0001 12.6%Home Equity Line Dummy -0.2772 0.1006 <.0001 5.0%Home Equity Loan Dummy -0.2178 0.0623 <.0001 2.1%
Mortgage Loan Dummy -0.2079 0.1172 <.0001 1.2%R 5. Length of Relationships
Age of Checking Relationship -0.0004 0.0002 <.0001 5.0%Age of Checking Relationship 0.0004 0.0002 .0001 5.0%Age of Savings Rel -0.0005 0.0003 <.0001 5.9%
Age of Brokerage Rel -0.0064 0.0016 <.0001 5.5%Age of CD Rel -0.0009 0.0002 <.0001 1.7%
Age of Mutual Fund Rel -0.0008 0.0002 <.0001 4.9%Age of Home Equity Line Rel -0.0014 0.0001 <.0001 3.5%Age of Home Equity Loan Rel -0.0015 0.0002 <.0001 1.7%
Age of Mortgage Loan Rel -0.0021 0.0009 <.0001 0.9%R 6. Proximity of Relationship
Relationship Indicator -0.8123 0.0539 <.0001 9.4%State with Branch Indicator -0.9686 0.0805 <.0001 3.7%Relationship * Branch State -0.8668 0.1056 <.0001 2.1%
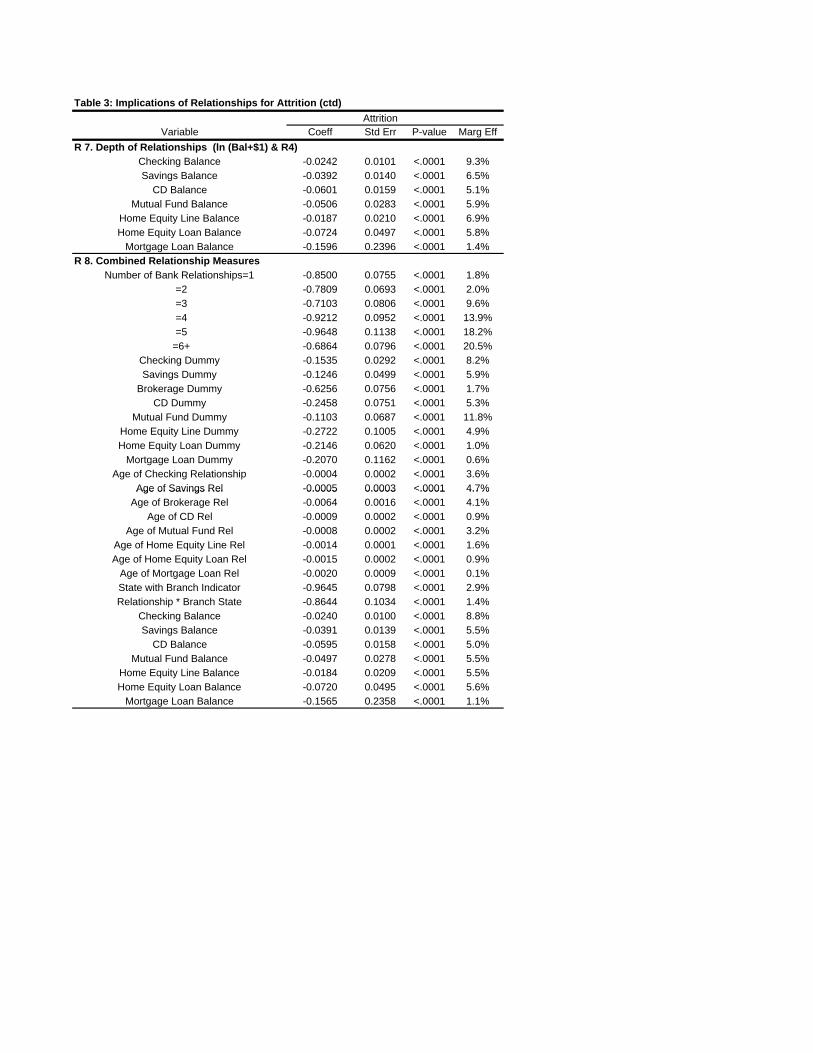
Table 3: Implications of Relationships for Attrition (ctd)
AttritionVariable Coeff Std Err P-value Marg Eff
R 7. Depth of Relationships (ln (Bal+$1) & R4)Checking Balance -0.0242 0.0101 <.0001 9.3%Savings Balance -0.0392 0.0140 <.0001 6.5%
CD Balance -0.0601 0.0159 <.0001 5.1%Mutual Fund Balance -0.0506 0.0283 <.0001 5.9%
Home Equity Line Balance -0.0187 0.0210 <.0001 6.9%Home Equity Loan Balance -0.0724 0.0497 <.0001 5.8%
Mortgage Loan Balance -0.1596 0.2396 <.0001 1.4%R 8. Combined Relationship Measures
Number of Bank Relationships=1 -0.8500 0.0755 <.0001 1.8% =2 -0.7809 0.0693 <.0001 2.0% =3 -0.7103 0.0806 <.0001 9.6% =4 -0.9212 0.0952 <.0001 13.9% =5 -0.9648 0.1138 <.0001 18.2%
=6+ -0.6864 0.0796 <.0001 20.5%Checking Dummy -0.1535 0.0292 <.0001 8.2%Savings Dummy -0.1246 0.0499 <.0001 5.9%
Brokerage Dummy -0.6256 0.0756 <.0001 1.7%CD Dummy -0.2458 0.0751 <.0001 5.3%
Mutual Fund Dummy -0.1103 0.0687 <.0001 11.8%Home Equity Line Dummy -0.2722 0.1005 <.0001 4.9%Home Equity Loan Dummy -0.2146 0.0620 <.0001 1.0%
Mortgage Loan Dummy -0.2070 0.1162 <.0001 0.6%Age of Checking Relationship -0.0004 0.0002 <.0001 3.6%
Age of Savings Rel -0.0005 0.0003 <.0001 4.7%Age of Savings Rel 0.0005 0.0003 .0001 4.7%Age of Brokerage Rel -0.0064 0.0016 <.0001 4.1%
Age of CD Rel -0.0009 0.0002 <.0001 0.9%Age of Mutual Fund Rel -0.0008 0.0002 <.0001 3.2%
Age of Home Equity Line Rel -0.0014 0.0001 <.0001 1.6%Age of Home Equity Loan Rel -0.0015 0.0002 <.0001 0.9%
Age of Mortgage Loan Rel -0.0020 0.0009 <.0001 0.1%State with Branch Indicator -0.9645 0.0798 <.0001 2.9%Relationship * Branch State -0.8644 0.1034 <.0001 1.4%
Checking Balance -0.0240 0.0100 <.0001 8.8%Savings Balance -0.0391 0.0139 <.0001 5.5%
CD Balance -0.0595 0.0158 <.0001 5.0%Mutual Fund Balance -0.0497 0.0278 <.0001 5.5%
Home Equity Line Balance -0.0184 0.0209 <.0001 5.5%Home Equity Loan Balance -0.0720 0.0495 <.0001 5.6%
Mortgage Loan Balance -0.1565 0.2358 <.0001 1.1%

Table 3: Implications of Relationships for Attrition (ctd)
AttritionVariable Coeff Std Err P-value Marg Eff
R 9. Change in Balances (ln(Bal) & R7 & R4)D(Checking Balance) -0.6195 0.0552 <.0001 5.3%D(Savings Balance) -0.3557 0.0018 <.0001 5.8%
D(Mutual Fund Balance) -0.4797 0.1071 <.0001 2.1%D(Home Equity Line Balance) -0.1510 0.0057 <.0001 2.5%
D(External Score) -0.8771 0.2081 <.0001 13.5%D(Internal Score) -0.4872 0.2255 <.0001 14.5%
R 10. Volatility of Balances (sd(12) & R7 & R4)sd(Checking Balance) 0.8699 0.1779 <.0001 12.4%sd(Savings Balance) 0.3015 0.0512 <.0001 3.8%
sd(Mutual Fund Balance) 0.8418 0.2345 <.0001 3.1%sd(Home Equity Line Balance) 0.4405 0.1275 <.0001 8.7%
sd(External Score) 0.7632 0.2051 <.0001 10.9%sd(Internal Score) 0.7232 0.3451 <.0001 16.9%
R 11. Change in Volatility ( D(sd(6)) & R7 & R4)D(sd(Checking Balance)) 0.4981 0.0454 <.0001 5.2%D(sd(Savings Balance)) 0.4849 0.1062 <.0001 14.4%
D(sd(Mutual Fund Balance)) 0.7144 0.2951 <.0001 11.7%D(sd(Home Equity Line Balance)) 0.7132 0.1934 <.0001 11.9%
D(sd(External Score)) 0.8707 0.1991 <.0001 16.4%D(sd(Internal Score)) 0.9569 0.0943 <.0001 12.8%
R 12. Low Checking Balances (& R7 & R4)Indicator(Balance < $2000) 0.5386 0.1412 <.0001 13.0%
R 13. Transfers of Balances (&R7 & R4)To Checking 0.5262 0.2624 <.0001 14.9%To Checking 0.5262 0.2624 .0001 14.9%
From Checking -0.9530 0.3027 <.0001 3.2%Number of Obs / Number Attrition 1132182 12649
Notes: This table shows the effects of relationships in predicting credit card attrition, using Cox proportional hazard models following eq. (1). The explanatory variables include macro-demographic, loan-performance, credit-bureau, and relationship variables, in addition to month and state dummies. The table reports only the results for the relationship variables; each panel represents a separate specification. (The other variables appear in the appendix for specification R1.) The relationship variables are defined in Table 2. The standard errors are adjusted for heteroscedasticity across accounts and serial correlation within accounts. The marginal effects for continuous covariates show the effects of a one standard-deviation change in the covariates.
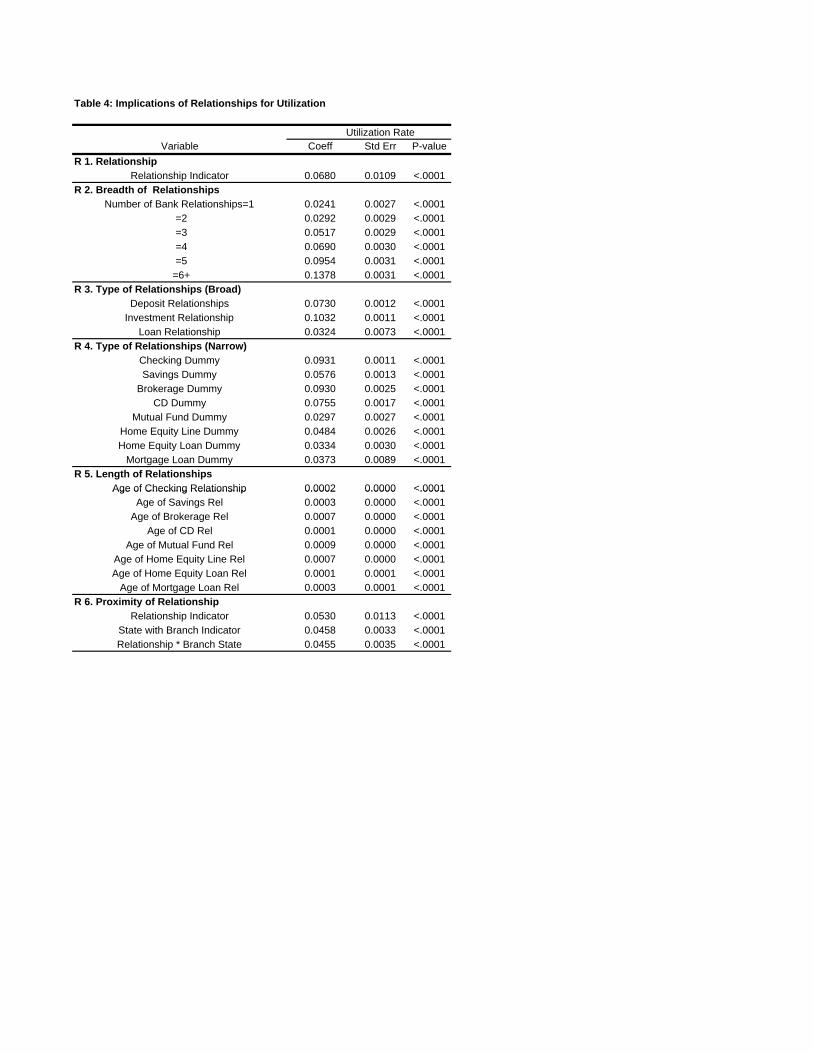
Table 4: Implications of Relationships for Utilization
Utilization RateVariable Coeff Std Err P-value
R 1. Relationship Relationship Indicator 0.0680 0.0109 <.0001
R 2. Breadth of RelationshipsNumber of Bank Relationships=1 0.0241 0.0027 <.0001
=2 0.0292 0.0029 <.0001 =3 0.0517 0.0029 <.0001 =4 0.0690 0.0030 <.0001 =5 0.0954 0.0031 <.0001
=6+ 0.1378 0.0031 <.0001R 3. Type of Relationships (Broad)
Deposit Relationships 0.0730 0.0012 <.0001Investment Relationship 0.1032 0.0011 <.0001
Loan Relationship 0.0324 0.0073 <.0001R 4. Type of Relationships (Narrow)
Checking Dummy 0.0931 0.0011 <.0001Savings Dummy 0.0576 0.0013 <.0001
Brokerage Dummy 0.0930 0.0025 <.0001CD Dummy 0.0755 0.0017 <.0001
Mutual Fund Dummy 0.0297 0.0027 <.0001Home Equity Line Dummy 0.0484 0.0026 <.0001Home Equity Loan Dummy 0.0334 0.0030 <.0001
Mortgage Loan Dummy 0.0373 0.0089 <.0001R 5. Length of Relationships
Age of Checking Relationship 0.0002 0.0000 <.0001Age of Checking Relationship 0.0002 0.0000 .0001Age of Savings Rel 0.0003 0.0000 <.0001
Age of Brokerage Rel 0.0007 0.0000 <.0001Age of CD Rel 0.0001 0.0000 <.0001
Age of Mutual Fund Rel 0.0009 0.0000 <.0001Age of Home Equity Line Rel 0.0007 0.0000 <.0001Age of Home Equity Loan Rel 0.0001 0.0001 <.0001
Age of Mortgage Loan Rel 0.0003 0.0001 <.0001R 6. Proximity of Relationship
Relationship Indicator 0.0530 0.0113 <.0001State with Branch Indicator 0.0458 0.0033 <.0001Relationship * Branch State 0.0455 0.0035 <.0001
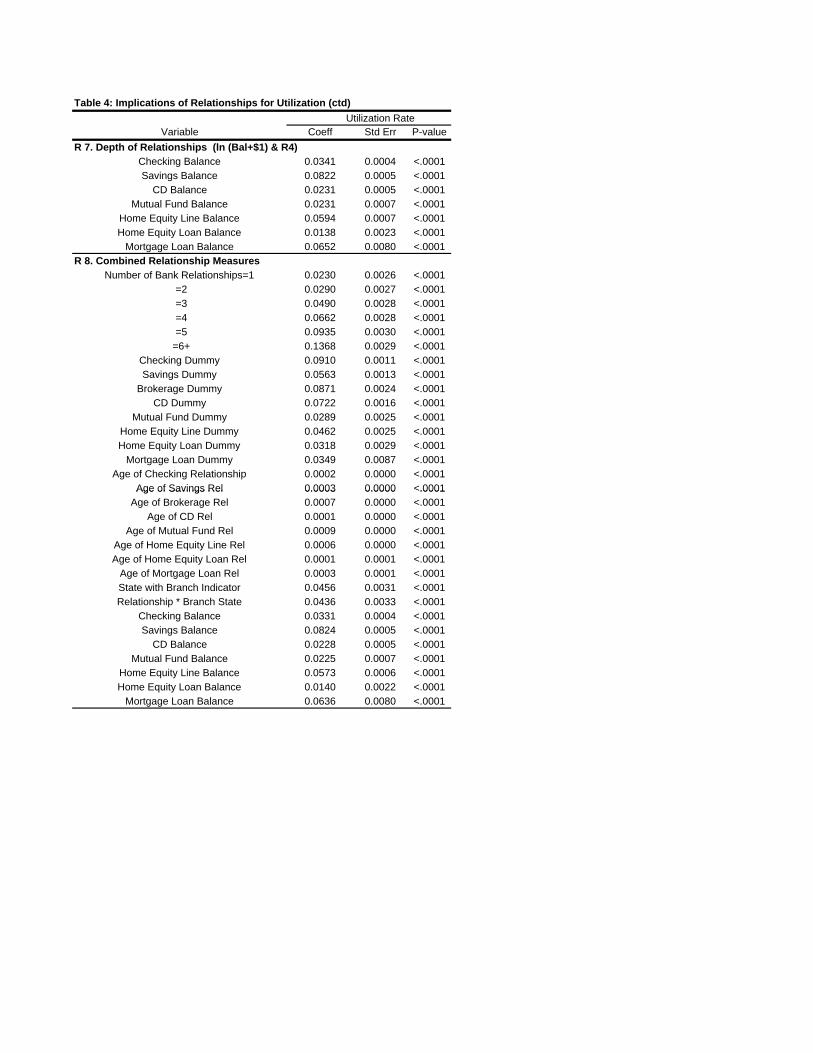
Table 4: Implications of Relationships for Utilization (ctd)
Utilization RateVariable Coeff Std Err P-value
R 7. Depth of Relationships (ln (Bal+$1) & R4)Checking Balance 0.0341 0.0004 <.0001Savings Balance 0.0822 0.0005 <.0001
CD Balance 0.0231 0.0005 <.0001Mutual Fund Balance 0.0231 0.0007 <.0001
Home Equity Line Balance 0.0594 0.0007 <.0001Home Equity Loan Balance 0.0138 0.0023 <.0001
Mortgage Loan Balance 0.0652 0.0080 <.0001R 8. Combined Relationship Measures
Number of Bank Relationships=1 0.0230 0.0026 <.0001 =2 0.0290 0.0027 <.0001 =3 0.0490 0.0028 <.0001 =4 0.0662 0.0028 <.0001 =5 0.0935 0.0030 <.0001
=6+ 0.1368 0.0029 <.0001Checking Dummy 0.0910 0.0011 <.0001Savings Dummy 0.0563 0.0013 <.0001
Brokerage Dummy 0.0871 0.0024 <.0001CD Dummy 0.0722 0.0016 <.0001
Mutual Fund Dummy 0.0289 0.0025 <.0001Home Equity Line Dummy 0.0462 0.0025 <.0001Home Equity Loan Dummy 0.0318 0.0029 <.0001
Mortgage Loan Dummy 0.0349 0.0087 <.0001Age of Checking Relationship 0.0002 0.0000 <.0001
Age of Savings Rel 0.0003 0.0000 <.0001Age of Savings Rel 0.0003 0.0000 .0001Age of Brokerage Rel 0.0007 0.0000 <.0001
Age of CD Rel 0.0001 0.0000 <.0001Age of Mutual Fund Rel 0.0009 0.0000 <.0001
Age of Home Equity Line Rel 0.0006 0.0000 <.0001Age of Home Equity Loan Rel 0.0001 0.0001 <.0001
Age of Mortgage Loan Rel 0.0003 0.0001 <.0001State with Branch Indicator 0.0456 0.0031 <.0001Relationship * Branch State 0.0436 0.0033 <.0001
Checking Balance 0.0331 0.0004 <.0001Savings Balance 0.0824 0.0005 <.0001
CD Balance 0.0228 0.0005 <.0001Mutual Fund Balance 0.0225 0.0007 <.0001
Home Equity Line Balance 0.0573 0.0006 <.0001Home Equity Loan Balance 0.0140 0.0022 <.0001
Mortgage Loan Balance 0.0636 0.0080 <.0001

Table 4: Implications of Relationships for Utilization (ctd)
Utilization RateVariable Coeff Std Err P-value
R 9. Change in Balances (ln(Bal) & R7 & R4)D(Checking Balance) 0.0185 0.0000 <.0001D(Savings Balance) 0.0162 0.0001 <.0001
D(Mutual Fund Balance) 0.0029 0.0003 <.0001D(Home Equity Line Balance) -0.0175 0.0001 <.0001
D(External Score) 0.0178 0.0089 <.0001D(Internal Score) 0.0200 0.0077 <.0001
R 10. Volatility of Balances (sd(12) & R7 & R4)sd(Checking Balance) -0.0157 0.0018 <.0001sd(Savings Balance) -0.0338 0.0023 <.0001
sd(Mutual Fund Balance) -0.0631 0.0009 <.0001sd(Home Equity Line Balance) -0.0240 0.0051 <.0001
sd(External Score) -0.0161 0.0001 <.0001sd(Internal Score) -0.0560 0.0243 <.0001
R 11. Change in Volatility ( D(sd(6)) & R7 & R4)D(sd(Checking Balance)) -0.0004 0.0001 <.0001D(sd(Savings Balance)) -0.0002 0.0003 <.0001
D(sd(Mutual Fund Balance)) -0.0030 0.0002 <.0001D(sd(Home Equity Line Balance)) -0.0004 0.0000 <.0001
D(sd(External Score)) -0.0012 0.0015 <.0001D(sd(Internal Score)) -0.0007 0.0001 <.0001
R 12. Low Checking Balances (& R7 & R4)Indicator(Balance < $2000) -0.0567 0.0590 0.8322
R 13. Transfers of Balances (&R7 & R4)To Checking 0.0958 0.0240 <.0001To Checking 0.0958 0.0240 .0001
From Checking -0.0812 0.0382 <.0001Number of Obs 1132182
Notes: This table shows the effects of relationships on credit card utilization rates (balances/limit), estimating eq. (1) by OLS. The explanatory variables include macro-demographic, loan-performance, credit-bureau, and relationship variables, in addition to month and state dummies. The table reports only the results for the relationship variables; each panel represents a separate specification. (The other variables appear in the appendix for specification R1.) The relationship variables are defined in Table 2. The standard errors are adjusted for heteroscedasticity across accounts and serial correlation within accounts.
Appendix Table 1: Baseline Results for DefaultAppendix Table 1: Baseline Results for Default
Default
Variable Coeff Std Err P-value Marg Eff
External Risk Score -0.0041 0.0002 <.0001 14.6%
Internal Risk Score -0.0055 0.0002 <.0001 16.3%
Debt 0 3479 0 0129 < 0001 1 6%Debt 0.3479 0.0129 <.0001 1.6%
Purchase -0.0457 0.0354 0.2351 1.1%
Payments -0.1722 0.0124 <.0001 2.8%
Credit line -0.2880 0.0134 <.0001 4.8%
APR 0.0385 0.0050 <.0001 0.7%
Total number of bankcards 0.0625 0.0082 <.0001 2.5%
Total bankcard credit limits -0.0032 0.0106 0.7139 4.7%
Total bankcard balances 0 1441 0 0364 < 0001 3 4%Total bankcard balances 0.1441 0.0364 <.0001 3.4%
Total number of non-bank cards 0.0070 0.0027 0.0224 0.4%
Total non-bank card balances 0.0553 0.0156 <.0001 1.1%
Total home equity line limits -0.0032 0.0018 0.0474 3.5%
Total home equity line balance 0.1222 0.0469 <.0001 1.8%
Total mortgage loan balance -0.0020 0.0004 <.0001 3.1% Total auto loan balance -0.0049 0.0032 0.1370 5.1%
Total student loan balance -0 0084 0 0043 0 0413 2 7%Total student loan balance -0.0084 0.0043 0.0413 2.7%
Unemployment rate 0.5891 0.2780 0.0354 3.0%
% w/o health insurance -0.0290 0.0220 0.2246 2.9%
D(House prices) -0.3833 0.0398 <.0001 8.2%
State income -0.0842 0.0945 0.5916 3.8%
Application income -0.0486 0.0579 0.9271 2.7%
Application inc missing 0.1790 0.0427 <.0001 2.4%
Wealth = low 0.3277 0.2466 0.1023 1.2%Wealth = low 0.3277 0.2466 0.1023 1.2%
= medium 0.2703 0.3670 0.4606 2.0%
R1 = Any Relationship -0.3208 0.0859 <.0001 10.1%
State dummies Yes
Month dummies YesNumber of Obs / Number Defaults 1132182 4322
Notes: This table reports the results from Cox models of credit card default (bankruptcy or Notes: This table reports the results from Cox models of credit card default (bankruptcy or three months delinquency), as a function of the explanatory variables in eq. (1): macro-demographic, loan-performance, credit-bureau, and relationship variables, in addition to month and state dummies. The table reports the results for the baseline relationship measure R1, which is a dummy variable identifying credit card accounts that have another relationship. The standard errors are adjusted for heteroscedasticity across accounts and serial correlation within accounts. The marginal effects for continuous covariates show the effects of a one standard-deviation change in the covariates.
Appendix Table 2: Baseline Results for AttritionAppendix Table 2: Baseline Results for Attrition
Default
Variable Coeff Std Err P-value Marg Eff
External Risk Score 0.0033 0.0001 <.0001 8.7%
Internal Risk Score 0.0034 0.0003 <.0001 9.8%
Debt 0 0783 0 0065 < 0001 1 8%Debt 0.0783 0.0065 <.0001 1.8%
Purchase -0.2904 0.0227 <.0001 4.5%
Payments 0.1245 0.0065 <.0001 1.8%
Credit line 0.0890 0.0061 <.0001 6.2%
APR 0.0483 0.0041 <.0001 8.4%
Total number of bankcards -0.0180 0.0086 <.0001 8.0%
Total bankcard credit limits -0.0078 0.0012 <.0001 7.7%
Total bankcard balances -0 0013 0 0048 < 0001 4 0%Total bankcard balances -0.0013 0.0048 <.0001 4.0%
Total number of non-bank cards 0.0180 0.0023 <.0001 0.4%
Total non-bank card balances -0.0322 0.0283 <.0001 2.5%
Total home equity line limits -0.0071 0.0087 0.9141 3.3%
Total home equity line balance -0.0033 0.0076 <.0001 2.7%
Total mortgage loan balance 0.0013 0.0023 <.0001 0.4%
Total auto loan balance 0.0020 0.0035 0.5291 3.1%
Total student loan balance -0 0031 0 0021 0 8290 4 6%Total student loan balance -0.0031 0.0021 0.8290 4.6%
Unemployment rate -0.2604 0.7240 <.0001 5.5%
% w/o health insurance 0.0038 0.0133 0.7768 3.1%
D(House prices) -0.1427 0.0426 <.0001 4.7%
State income -0.0209 0.0550 0.9636 1.4%
Application income -0.0359 0.0645 0.9778 3.4%
Application inc missing 0.3041 0.1992 <.0001 0.7%
Wealth = low -0.1064 0.0476 0.0534 6.5%Wealth = low -0.1064 0.0476 0.0534 6.5%
= medium -0.1076 0.0674 0.1177 7.9%
R1 = Any Relationship -0.5607 0.0950 <.0001 11.6%
State dummies Yes
Month dummies YesNumber of Obs / Number Attritions 1132182 12649
Notes: This table reports the results from Cox models of credit card attrition, as a function Notes: This table reports the results from Cox models of credit card attrition, as a function of the explanatory variables in eq. (1): macro-demographic, loan-performance, credit-bureau, and relationship variables, in addition to month and state dummies. The table reports the results for the baseline relationship measure R1, which is a dummy variable identifying credit card accounts that have another relationship. The standard errors are adjusted for heteroscedasticity across accounts and serial correlation within accounts. The marginal effects for continuous covariates show the effects of a one standard-deviation change in the covariates.
Appendix Table 3: Baseline Results for Utilization
Default
Variable Coeff Std Err P-value
External Risk Score -0.0147 0.0043 <.0001
Internal Risk Score -0.0008 0.0000 <.0001
APR -0.0016 0.0000 <.0001
Total number of bankcards 0.0001 0.0000 0.0380
Total bankcard credit limits 0.0223 0.0017 <.0001
Total bankcard balances -0.0005 0.0000 <.0001
Total number of non-bank cards -0.0016 0.0001 <.0001
Total non-bank card balances -0.0001 0.0000 <.0001
Total home equity line limits -0.0013 0.0001 <.0001
Total home equity line balance -0.0007 0.0000 <.0001
Total mortgage loan balance -0.0002 0.0001 <.0001
Total auto loan balance -0.0003 0.0001 <.0001
Total student loan balance 0.0014 0.0002 <.0001
Unemployment rate 0.0148 0.0015 <.0001
% w/o health insurance -0.0009 0.0000 0.0217
D(House prices) 0.0239 0.0064 <.0001
State income 0.0051 0.0012 <.0001
A li ti i 0 0032 0 0006 0001Application income 0.0032 0.0006 <.0001
Application inc missing 0.0396 0.0045 <.0001
Wealth = low -0.0002 0.0014 0.8520
= medium -0.0019 0.0017 0.2200
R1 = Any Relationship 0.0680 0.0109 <.0001
cons 0.3198 0.0652 <.0001
State dummies Yes
Month dummies Yes
Number of Obs 1132182
Notes: This table shows the results of estimating eq. (1) for credit card utilization rates (balances/limit), by OLS. The explanatory variables include macro-demographic, loan-performance, credit-bureau, and relationship variables, in addition to month and state dummies. The table reports the results for the baseline relationship measure R1, which is a dummy variable identifying credit card accounts that have another relationship. The standard errors are adjusted for heteroscedasticity across accounts and serial correlation within accounts.

1
Working Paper Series
A series of research studies on regional economic issues relating to the Seventh Federal Reserve District, and on financial and economic topics.
Risk Taking and the Quality of Informal Insurance: Gambling and Remittances in Thailand WP-07-01 Douglas L. Miller and Anna L. Paulson
Fast Micro and Slow Macro: Can Aggregation Explain the Persistence of Inflation? WP-07-02 Filippo Altissimo, Benoît Mojon, and Paolo Zaffaroni
Assessing a Decade of Interstate Bank Branching WP-07-03 Christian Johnson and Tara Rice
Debit Card and Cash Usage: A Cross-Country Analysis WP-07-04 Gene Amromin and Sujit Chakravorti
The Age of Reason: Financial Decisions Over the Lifecycle WP-07-05 Sumit Agarwal, John C. Driscoll, Xavier Gabaix, and David Laibson
Information Acquisition in Financial Markets: a Correction WP-07-06 Gadi Barlevy and Pietro Veronesi
Monetary Policy, Output Composition and the Great Moderation WP-07-07 Benoît Mojon
Estate Taxation, Entrepreneurship, and Wealth WP-07-08 Marco Cagetti and Mariacristina De Nardi
Conflict of Interest and Certification in the U.S. IPO Market WP-07-09 Luca Benzoni and Carola Schenone
The Reaction of Consumer Spending and Debt to Tax Rebates – Evidence from Consumer Credit Data WP-07-10 Sumit Agarwal, Chunlin Liu, and Nicholas S. Souleles
Portfolio Choice over the Life-Cycle when the Stock and Labor Markets are Cointegrated WP-07-11 Luca Benzoni, Pierre Collin-Dufresne, and Robert S. Goldstein Nonparametric Analysis of Intergenerational Income Mobility WP-07-12
with Application to the United States Debopam Bhattacharya and Bhashkar Mazumder
How the Credit Channel Works: Differentiating the Bank Lending Channel WP-07-13
and the Balance Sheet Channel Lamont K. Black and Richard J. Rosen
Labor Market Transitions and Self-Employment WP-07-14
Ellen R. Rissman
First-Time Home Buyers and Residential Investment Volatility WP-07-15
Jonas D.M. Fisher and Martin Gervais
2
Working Paper Series (continued) Establishments Dynamics and Matching Frictions in Classical Competitive Equilibrium WP-07-16
Marcelo Veracierto
Technology’s Edge: The Educational Benefits of Computer-Aided Instruction WP-07-17
Lisa Barrow, Lisa Markman, and Cecilia Elena Rouse The Widow’s Offering: Inheritance, Family Structure, and the Charitable Gifts of Women WP-07-18
Leslie McGranahan
Incomplete Information and the Timing to Adjust Labor: Evidence from the Lead-Lag Relationship between Temporary Help Employment and Permanent Employment WP-07-19
Sainan Jin, Yukako Ono, and Qinghua Zhang
A Conversation with 590 Nascent Entrepreneurs WP-07-20
Jeffrey R. Campbell and Mariacristina De Nardi
Cyclical Dumping and US Antidumping Protection: 1980-2001 WP-07-21
Meredith A. Crowley
Health Capital and the Prenatal Environment: The Effect of Maternal Fasting During Pregnancy WP-07-22
Douglas Almond and Bhashkar Mazumder
The Spending and Debt Response to Minimum Wage Hikes WP-07-23
Daniel Aaronson, Sumit Agarwal, and Eric French
The Impact of Mexican Immigrants on U.S. Wage Structure WP-07-24
Maude Toussaint-Comeau
A Leverage-based Model of Speculative Bubbles WP-08-01
Gadi Barlevy
Displacement, Asymmetric Information and Heterogeneous Human Capital WP-08-02
Luojia Hu and Christopher Taber
BankCaR (Bank Capital-at-Risk): A credit risk model for US commercial bank charge-offs WP-08-03
Jon Frye and Eduard Pelz
Bank Lending, Financing Constraints and SME Investment WP-08-04
Santiago Carbó-Valverde, Francisco Rodríguez-Fernández, and Gregory F. Udell
Global Inflation WP-08-05
Matteo Ciccarelli and Benoît Mojon
Scale and the Origins of Structural Change WP-08-06
Francisco J. Buera and Joseph P. Kaboski
Inventories, Lumpy Trade, and Large Devaluations WP-08-07
George Alessandria, Joseph P. Kaboski, and Virgiliu Midrigan

3
Working Paper Series (continued)
School Vouchers and Student Achievement: Recent Evidence, Remaining Questions WP-08-08
Cecilia Elena Rouse and Lisa Barrow
Does It Pay to Read Your Junk Mail? Evidence of the Effect of Advertising on Home Equity Credit Choices WP-08-09
Sumit Agarwal and Brent W. Ambrose
The Choice between Arm’s-Length and Relationship Debt: Evidence from eLoans WP-08-10
Sumit Agarwal and Robert Hauswald
Consumer Choice and Merchant Acceptance of Payment Media WP-08-11
Wilko Bolt and Sujit Chakravorti Investment Shocks and Business Cycles WP-08-12
Alejandro Justiniano, Giorgio E. Primiceri, and Andrea Tambalotti New Vehicle Characteristics and the Cost of the Corporate Average Fuel Economy Standard WP-08-13
Thomas Klier and Joshua Linn
Realized Volatility WP-08-14
Torben G. Andersen and Luca Benzoni
Revenue Bubbles and Structural Deficits: What’s a state to do? WP-08-15
Richard Mattoon and Leslie McGranahan The role of lenders in the home price boom WP-08-16
Richard J. Rosen
Bank Crises and Investor Confidence WP-08-17
Una Okonkwo Osili and Anna Paulson Life Expectancy and Old Age Savings WP-08-18
Mariacristina De Nardi, Eric French, and John Bailey Jones Remittance Behavior among New U.S. Immigrants WP-08-19
Katherine Meckel Birth Cohort and the Black-White Achievement Gap: The Roles of Access and Health Soon After Birth WP-08-20
Kenneth Y. Chay, Jonathan Guryan, and Bhashkar Mazumder
Public Investment and Budget Rules for State vs. Local Governments WP-08-21
Marco Bassetto
Why Has Home Ownership Fallen Among the Young? WP-09-01
Jonas D.M. Fisher and Martin Gervais
Why do the Elderly Save? The Role of Medical Expenses WP-09-02
Mariacristina De Nardi, Eric French, and John Bailey Jones

4
Working Paper Series (continued)
Using Stock Returns to Identify Government Spending Shocks WP-09-03
Jonas D.M. Fisher and Ryan Peters
Stochastic Volatility WP-09-04
Torben G. Andersen and Luca Benzoni The Effect of Disability Insurance Receipt on Labor Supply WP-09-05
Eric French and Jae Song CEO Overconfidence and Dividend Policy WP-09-06
Sanjay Deshmukh, Anand M. Goel, and Keith M. Howe Do Financial Counseling Mandates Improve Mortgage Choice and Performance? WP-09-07 Evidence from a Legislative Experiment
Sumit Agarwal,Gene Amromin, Itzhak Ben-David, Souphala Chomsisengphet, and Douglas D. Evanoff Perverse Incentives at the Banks? Evidence from a Natural Experiment WP-09-08
Sumit Agarwal and Faye H. Wang Pay for Percentile WP-09-09
Gadi Barlevy and Derek Neal
The Life and Times of Nicolas Dutot WP-09-10
François R. Velde
Regulating Two-Sided Markets: An Empirical Investigation WP-09-11
Santiago Carbó Valverde, Sujit Chakravorti, and Francisco Rodriguez Fernandez
The Case of the Undying Debt WP-09-12
François R. Velde
Paying for Performance: The Education Impacts of a Community College Scholarship Program for Low-income Adults WP-09-13
Lisa Barrow, Lashawn Richburg-Hayes, Cecilia Elena Rouse, and Thomas Brock
Establishments Dynamics, Vacancies and Unemployment: A Neoclassical Synthesis WP-09-14
Marcelo Veracierto
The Price of Gasoline and the Demand for Fuel Economy: Evidence from Monthly New Vehicles Sales Data WP-09-15
Thomas Klier and Joshua Linn
Estimation of a Transformation Model with Truncation, Interval Observation and Time-Varying Covariates WP-09-16
Bo E. Honoré and Luojia Hu
Self-Enforcing Trade Agreements: Evidence from Antidumping Policy WP-09-17
Chad P. Bown and Meredith A. Crowley
Too much right can make a wrong: Setting the stage for the financial crisis WP-09-18
Richard J. Rosen

5
Working Paper Series (continued) Can Structural Small Open Economy Models Account for the Influence of Foreign Disturbances? WP-09-19
Alejandro Justiniano and Bruce Preston
Liquidity Constraints of the Middle Class WP-09-20
Jeffrey R. Campbell and Zvi Hercowitz
Monetary Policy and Uncertainty in an Empirical Small Open Economy Model WP-09-21
Alejandro Justiniano and Bruce Preston
Firm boundaries and buyer-supplier match in market transaction: IT system procurement of U.S. credit unions WP-09-22
Yukako Ono and Junichi Suzuki
Health and the Savings of Insured Versus Uninsured, Working-Age Households in the U.S. WP-09-23
Maude Toussaint-Comeau and Jonathan Hartley
The Economics of “Radiator Springs:” Industry Dynamics, Sunk Costs, and Spatial Demand Shifts WP-09-24
Jeffrey R. Campbell and Thomas N. Hubbard
On the Relationship between Mobility, Population Growth, and Capital Spending in the United States WP-09-25
Marco Bassetto and Leslie McGranahan
The Impact of Rosenwald Schools on Black Achievement WP-09-26
Daniel Aaronson and Bhashkar Mazumder
Comment on “Letting Different Views about Business Cycles Compete” WP-10-01
Jonas D.M. Fisher Macroeconomic Implications of Agglomeration WP-10-02
Morris A. Davis, Jonas D.M. Fisher and Toni M. Whited
Accounting for non-annuitization WP-10-03
Svetlana Pashchenko
Robustness and Macroeconomic Policy WP-10-04
Gadi Barlevy
Benefits of Relationship Banking: Evidence from Consumer Credit Markets WP-10-05
Sumit Agarwal, Souphala Chomsisengphet, Chunlin Liu, and Nicholas S. Souleles