Embed Size (px)
Citation preview
Journal of Cleaner Production 15 (2007) 798e813www.elsevier.com/locate/jclepro
Benchmarking to trigger cleaner production in smallbusinesses: drycleaning case study
William Altham*,1
Centre of Excellence in Cleaner Production, Curtin University of Technology, GPO Box U1987, Perth, WA 6845, Australia
Accepted 21 June 2006
Available online 9 November 2006
Abstract
This paper reports on research that investigated and implemented benchmarking as a trigger for cleaner production in the drycleaning in-dustry in Western Australia and applies this knowledge to the small business sector. The critical success factors for environmental benchmarkingare: identifying cleaner production gaps in areas important to the long-term future of the businesses, promoting the drivers to close the perfor-mance gaps, and ensuring managers possess the correct skills to close these gaps. The participants accepted the benchmarks as suitable targetsand committed their businesses to achieving these targets in their action plans. Economic benefits and maintaining their licence to operate werefound to be the important drivers. Program participants on average reduced hazardous waste generation by 48%, perchlorethylene consumptionby 30% and improved their energy efficiency by 9%. Furthermore, managers involved in the program had a significantly higher uptake of cleanerproduction than the general small business community in Western Australia.� 2006 Elsevier Ltd. All rights reserved.
Keywords: Small and micro business; Benchmarking; Cleaner production; Capacity building; Drycleaning
1. Introduction
Cleaner production is about changing behaviour, alteringthe way industry uses resources and manages non-product out-put, with an aim to improve the efficiency of its operation.Changing behaviour generally requires some kind of ‘shock’for management to investigate and implement alternative prac-tices. These shocks are generally in the form of changes in reg-ulation (or its level of enforcement), shift in market conditionsor new information. Furthermore, changing behaviour requires
* Present address: 16 Bilkurra Way, Mount Nasura, WA 6112, Australia.
E-mail address: [email protected] This paper outlines the program and discusses the results of the author’s
PhD projects titled ‘‘Benchmarking to trigger and sustain the introduction of
cleaner production in small to medium-sized enterprises’’. The thesis was
passed in 2004 and was undertaken at Curtin University of Technology, Perth
Western Australia. The author would like to acknowledge the assistance and
advice of his supervisor Prof. Rene van Berkel, Chair in Cleaner Production,
during the three years of this research project.
0959-6526/$ - see front matter � 2006 Elsevier Ltd. All rights reserved.
doi:10.1016/j.jclepro.2006.07.005
some regular reinforcing of the initial ‘shock’ while practicesand culture alter, to prevent reverting to old habits.
This paper investigates the applicability of benchmarkingwhich is a proven business improvement tool backed by ca-pacity building, in a program to achieve greater uptake ofcleaner production in small and micro businesses.2 It then re-ports on a program developed and implemented in collabora-tion with the drycleaning industry in Western Australia. Theprogram uses information imbedded in the benchmarking pro-cess and the ‘shock’ of quantifying the potential cost savingand direct comparison with local peers’ environmental perfor-mance to trigger the introduction of cleaner production withinparticipating businesses.
2 Micro businesses are classified as employing between one and four staff
and small businesses employ between 5 and 19 staff [1]. Non-employing busi-
nesses are also classified as small business. Just over 951,000 or 96% of Aus-
tralian total non-agricultural private sector businesses were classified as small
in 1998e1999. These small businesses employed just over 3.1 million people
or 47% of the total non-agricultural private sector workforce [2].

Essentially, benchmarking is the process of continually
799W. Altham / Journal of Cleaner Production 15 (2007) 798e813
The aim of this research is to assess whether benchmarking,in isolation and in combination with industry specific capacitybuilding, leads to the greater uptake of cleaner production insmall businesses and consequently improved eco-efficiency.Cleaner production uptake is expected to enable participatingbusinesses to continuously improve their plant level environ-mental and economic performance.
The first section of the paper discusses benchmarking andits applicability for cleaner production in small businesses.The next section outlines the program implemented whichcomprised a Cleaner Production Club and a BenchmarkingOnly Group; covering the benchmarking program and the ca-pacity building activities. The last section contains the resultsof the program and is followed by a discussion of the resultsand a brief conclusion.
2. Benchmarking
Benchmarking has proven to be effective for achieving con-tinuous improvement in many diverse areas of managementperformance. It is therefore most likely also suitable for achiev-ing continuous improvement in cleaner production [3]. Re-search data suggests that managers of smaller organisationshave no hesitation in recognising the potential of benchmark-ing as a tool for articulating and sharing their vision and createa clear sense of what is possible [4] and is as relevant to smallbusinesses as to larger businesses. However much less is knownof the experiences of small businesses. Despite this lack ofexperience, many advocates maintain that benchmarking is asrelevant to small businesses as it is to the larger companies[4e6]. Furthermore, because benchmarking, when part ofa program, should be carried out at regular intervals, environ-mental awareness is being increased and this is an importantfirst step towards change. This process enables the progressiveintegration of environmental management into day-to-daymanagement and operation of the business without an undueimpact on core production processes. In addition, each newbenchmarking round can identify additional environmental im-provement options, improve environmental management skills,and further spur the learning process of the participants.
An additional potential advantage of benchmarking is thatit can assist in the early identification of those environmentalaspects that most likely offer the greatest potential for eco-nomic benefits [7e9]. Benchmarking can assist managers byinitially targeting ‘good housekeeping’ options in aspectswhich have the greatest environmental costs and the most po-tential for profitable environmental improvements with limitedcosts. This encourages the notion of ‘start small and seek earlysuccess’, which is important to business managers with littleor no experience in environmental management [10,11]. Fur-thermore, improving the likelihood for early success in cleanerproduction programs may increase the business managers’confidence to engage in more complex and innovative cleanerproduction methods. Business managers will thereby be en-couraged to implement innovations that in the longer termare likely to provide environmentally preferred and economi-cally sound solutions.
searching for the best methods, practices and processes forconducting a task [12]; then adopting or adapting good fea-tures to suit the aims of the organisation. To ‘steal shame-lessly’3 is often advocated [13], while remembering theheart of benchmarking is learning not copying [14]. The great-est advantage of benchmarking is the opportunity for mutuallearning [15], and essential for continuous improvement[16]. A major strength of benchmarking is that it is a structuredprocess with an external focus. Benchmarking is a generic sys-tematic improvement process that promotes ‘thinking outsidethe box’.
It is very important to clarify the difference between bench-marks and benchmarking [17], as the two are often confused[3]. A benchmark is a performance level, while benchmarkingis an improvement process [17]. As the popularity of bench-marking has increased, new benchmarking modus operandihas evolved. These initiatives included facilitated and co-operative benchmarking, which cover benchmarking programsorganised by a third party, with or without direct contact be-tween benchmarking partners. Often these have an electronicscorecard that automatically generates a benchmarking reportthat is delivered electronically within minutes of supplyingyour business’ data. These initiatives act to demonstrate thatbenchmarking is being used to cheaply and quickly identifyperformance gaps, potential areas of improvement, and costssavings. Another relatively new concept is benchcasing [18].The process involves considering a number of case studies si-multaneously to extract more generally applicable practices.This process may also increase the business manager’s confi-dence if a larger number of businesses have adopted a similarpractice or technology. Benchgrafting is a similar conceptwhich uses the published results of benchmarking exercisesto investigate methods to improve current practices without di-rect contact between business [19].
A major weakness with these non-traditional benchmarkingmethods and initiatives is that they assume that business man-agers have the skills and experience to identify and implementthe preferred practice within their operations without outsideassistance or direct contact. The assumption that performancecan be improved without external assistance is hard to justifyin particular in the environmental field for many small busi-nesses [5,20,21]. The majority of surveys report a lack of en-vironmental management skills and experience and concludethat outside assistance is required for the successful imple-mentation of cleaner production in small businesses. Howeverthese approaches can remove some of the concerns over con-fidentiality of material that many business owners and man-agers have with direct sharing of performance data whilestill promoting cleaner production.
Business managers express concerns about confidentialityof information shared in benchmarking programs. Recent
3 This statement possibly creates as much fear and resistance to benchmark-
ing as support because organisations perceive that if they become involved in
benchmarking all their competitive advantage will be stolen.

800 W. Altham / Journal of Cleaner Production 15 (2007) 798e813
research however concludes that successful companies operatein an ‘open’ information environment as part of their manage-ment style [22]. These businesses accept that it is worth therisk, or they have the confidence, to disclose business perfor-mance data (leading to their competitors being better placedto compete with them in the market place) in return for accessto recent developments in their field of business [23]. Thesebusiness managers realise that knowledge and practices arenot readily transferable between businesses, and that tacitknowledge holds the key to future business competitiveness.The benchmarks only provide an indication of industry bestpractice performance levels.
2.1. The benchmarking process
The conducting of a benchmarking program is generallybroken down into a number of phases, steps and tasks withthe number varying greatly between practitioners and advo-cates. The Global Environmental Management Initiative(GEMI) [24] stages as published in Benchmarking: the primer,benchmarking for continuous environmental improvement arelisted below.
1. Project conception2. Planning3. Preliminary data collection4. Best-in-class selection5. Best-in-class data collection6. Assessment7. Implementation planning8. Implementation9. Recalibration
2.2. Practical experience
While benchmarking is widely accepted and implementedby industry in general, success in benchmarking programs isby no means universal. Eighty-two percent of replies to a majorannual survey [25] claim that benchmarking does not deliveras much as it promises. Benchmarking has been shown to in-crease the number of improvement options identified becauseit encourages managers to actively seek information and culti-vate an external focus. However this does not always translateinto greater numbers of options being implemented [26]. Thismay be because many benchmarking programs do not providethe tools to fully or correctly implement the options identified.There is often a lack of employee participation. Benchmarkingneeds follow-up with practical action plans [5,27,28] and thedevelopment of such action plans and transfer of the skills re-quired to develop and implement such action plans is oftenoverlooked [29].
2.3. Barriers to benchmarking for small business
In Australia 51% of businesses employing more that 100employees actively participate in benchmarking while only
15% of businesses employing less than 20 people have bench-marked [30]. Despite their lack of participation, smallbusinesses still appear to consider benchmarking to be anappropriate performance improvement tool [4e6].
The variation in benchmarking between small and largerbusinesses may indicate that smaller businesses face greaterbarriers in conducting benchmarking than larger organisations.These differences may be caused by a number of factors in-cluding lack of available resources, lack of skills within theworkforce, no direct access to specialists, limited networkingopportunities, inability to locate benchmarking partners andthe lack of a critical mass of employees to aid innovation.Smaller businesses are also, less systematic in their approachto problem solving and improvement programs in general.
These barriers are reflected in the small business’ inability toidentify key performance indicators (KPI), select benchmark-ing partners, collect and analyse data, identify performancegaps, establish challenging but achievable improvement targetsand finally in the development and implementation of theiraction plans.
2.4. Capacity building
Successful capacity building programs for small businessesneed to be inexpensive, co-operative, locally based, flexible,unique and accessible [31,32], while ensuring that the deliveryof activities and their associated training is as clear and simpleas possible [33]. An effective capacity building program mustprovide training with clear, concise, dependable sector-specificinformation and ongoing support. The information conveyedmust be relevant and timely [34]. The language and conceptsmust be familiar to participating business managers and offerpractical assistance. Cleaner production’s capacity building ac-tivities have been criticised as creating confusion for small busi-ness managers through providing conflicting information [35].
Before the business manager’s attention is triggered, the ca-pacity building activities need to be in place to capitalise onthis attention and willingness to participate, i.e. utilising ‘thewindow of opportunity’. There are benefits from a large num-ber of active stakeholders participating in the development anddelivery of capacity building activities in a co-ordinated andstrategic manner [31]. This adds credibility, quality and rigourto capacity building activities and assists in recruiting partici-pants if they consider the program has widespread support.
Following the establishment of environmental programs forsmall businesses, funders, government agencies, training pro-viders and policy makers should expect a delay of at least3 years according to Rosenfeld [36], 3e4 years according toEnright [37], and up to 5 years according Hennicke [10] forany significant change in the business’ behaviour and environ-mental performance.
2.5. Critical success factors for small businessbenchmarking
This research project is based on the assumption that suc-cessful benchmarking for cleaner production is conditional

801W. Altham / Journal of Cleaner Production 15 (2007) 798e813
on achieving three conditions: (a) the identification of a perfor-mance gap in areas of the business critical to its future, (b) theexistence of drivers to close the identified performance gaps,and (c) the availability of the skills and experience to use thesetools to close the performance gap. These three conditions arehenceforth referred to as critical success factors (CSF). Withregard to cleaner production, these are understood as: variationin eco-efficiency, the economic and other benefits presented asa result of these variations, and knowledge of the cleaner pro-duction assessment process.
These CSFs have not been stated and reported as such inthe benchmarking and management literature. They are par-tially supported by literature and partially experimentally orpractice derived. All benchmarking texts discuss success fac-tors in conducting benchmarking exercises (for more informa-tion, see [17,38e40].
This research project seeks to operationalise and simplifybenchmarking for the implementation of cleaner productionin small businesses through a facilitated program that:
� investigates ways in which cleaner production perfor-mance gaps between companies can be monitored;� assesses which environmental management drivers will
convince business managers to close such performancegaps, and then promote these drivers; and� pilot tests the use of cleaner production assessment as
a tool for business managers to assist them in closingthe performance gaps.
2.5.1. Investigating cleaner production gapsTo identify cleaner production gaps there must first be some
knowledge of the industry’s major environmental aspects, in-cluding both risks and opportunities. The next stage involvesthe selection and monitoring of key performance indicators,matching with benchmarking partners, analysis of the dataand the establishment of performance gaps. The performancegap is the difference between current practices and best prac-tice and needs to be realistic; that is, both challenging andachievable. When benchmarking programs are conducted insmall businesses some allowance for economies of scalemay be required.
Publicly available cleaner production data show consider-able performance gaps between comparable businesses in thesame industry sector [41]. This variation in performance canbe as great as thirty-fold in cases where poor performance ap-parently does not have a major direct effect on overall businessperformance and viability. Four- to five-fold differences arevery common [42,43]. However many small businesses claimto have no or minimal environmental impacts [44]. This is sup-ported by the findings of a UK survey which found that 51% ofSMEs claimed to have a positive environmental impact anda further 39% to have no environmental impact [45].
Benchmarking should be considered as complementary or‘value adding’ to environmental performance evaluation(EPE) [46]. Unless a business has in place sound managementpractices and suitable EPE systems any effort to instigate en-vironmental benchmarking without the appropriate systems
will meet with questionable and sometimes negative results[47,48]. It therefore follows that businesses must have prac-tices and monitoring equipment in place with which to obtainreliable environmental data and identify trends in resourceconsumption, waste generation and total environmental costs,and be prepared to share this information either directly orindirectly.
2.5.2. Activating drivers to close the performance gapAs this is a topic of much recent research, this paper does
not investigate in detail the drivers for cleaner production. In-stead, this research draws on such work. The foreword orintroduction to any cleaner production manual or training pro-gram’s material, lists many reasons for improving cleaner pro-duction and financial benefits always rank high on these lists.Other major drivers are regulatory drivers and drivers to in-crease market share through product differentiation and greenmarketing schemes.
Variations in performance, particularly when associatedwith reduce energy or chemical use, would be expected tolead to variations in net profits. Economic benefits contributestraight to the bottom-line [49]. However, the direct financialsaving may be eroded in the short-term by capital and staff re-training cost associated with the change in technology or prac-tices. While the financial drivers to close the performance gapcannot be directly created, they can be cultivated and pro-moted through improved environmental management account-ing. Furthermore, a direct driver can be created throughpolicies to strengthen the market, which in turn increase themarket-based or financial incentive for change. Programsthen need to cultivate and reinforce the business case forcleaner production and eco-efficiency to owners and man-agers. To help cultivate the financial drivers to close the per-formance gap, economic benefits should be represented asan increase in net profit rather than savings on operationalcosts to add impact to the figures. Within Australian smallbusinesses the average net profit is in the region of 15%[2,50]. Therefore, a 2% reduction in total costs lifts the profitmargin from 15 to 17% of turnover, which is a 13% increase innet profit.
2.5.3. Promoting tools to close the performance gapFinally, businesses can only close performance gaps if they
have access to improvement tools and possess the skills andexperience to apply those (such as cleaner production). Asstated by Augenstein [51, p. 12] ‘‘performance improvementin any field is driven primarily by people who are given theright tool’’. However, while the cleaner production tools areavailable small businesses often lack the opportunity to de-velop the skill and experience to successfully use these tools.This barrier exists because many business managers have nothad any formal training in cleaner production or similar sys-tematic business improvement programs and they lack theresources, ability or the time to acquire these skills. Manybusiness managers also consider in most instances the costof employing consultants with expertise in cleaner productiontools an unjustifiable expense [52].

802 W. Altham / Journal of Cleaner Production 15 (2007) 798e813
3. Drycleaning industry case study
The dry cleaning industry is a service industry for the con-venient cleaning of clothes, household linen, leather goods,and other items made of fibres including household furnish-ings and drapes. Drycleaners typically use either synthetic ha-logenated or petroleum distillate organic solvents for cleaningpurposes. The drycleaning industry is the source of 94% oftetrachloroethylene (commonly called perchlorethylene andreferred to as perc in this paper) emission in Australia, andover 95% of drycleaning uses this chemical [53].
It is estimated that there are 2200 drycleaning businessescurrently operating in Australia with an estimated turnoverof approximately $400 million per year (average gross turn-over of $182,000 per operation). Eighty percent of drycleaningbusinesses in Australia are independently owned, with the bal-anced franchised [54].
Small business market analysts consider the drycleaning in-dustry as an industry with the potential for healthy profits, withgrowth over the last 15 years of 50%, and employment growthof 5% per year over that period. This trend is expected to con-tinue for a number of reasons including, customer concern thatsupposedly washable garments cannot stand repeated washingat home, the increasing cost of fashionable clothes, and in-creasing number of time-poor two income households. Theimportant factors for profitability in the drycleaning industryare location and service. This feature of the industry makeslocation, parking and well trained staff critical to businesssuccess [54].
The WA Branch of the Drycleaning Institute of Australia(DIA WA) was very interested in collaborating in this researchfor a number of reasons, principally ‘duty of care’ and ‘a li-cence to operate’. Industry leaders were of the opinion that un-less the drycleaning industry becomes more environmentallypro-active it would be under increasing environmental regula-tory and community pressure. As a demonstration of this con-cern, the national body of the DIA obtained a grant fromEnvironment Australia to develop a self-regulatory code ofpractice ‘The Australian Drycleaning Industry RegulationStandard’ [55] which was released in late 1999.
3.1. Twin intervention programs
Two interventions were developed and implemented in thisresearch project: the benchmarking program and a range of ca-pacity building activities. Individual business managers choseto participate in these mechanisms depending on the level ofresources managers were willing and able to commit to im-proving their eco-efficiency. In this way, experimental groupsand their intervention(s) were self-selecting. One groupformed the Cleaner Production Club and the other the Bench-marking Only Group.
The printed material and the cleaner production optionschecklist and benchmarking reports were distributed to all par-ticipating businesses. The remainder of the capacity buildinginputs and resources were restricted to the CP Club. Thiscomprised chiefly of attendance at the five workshops and
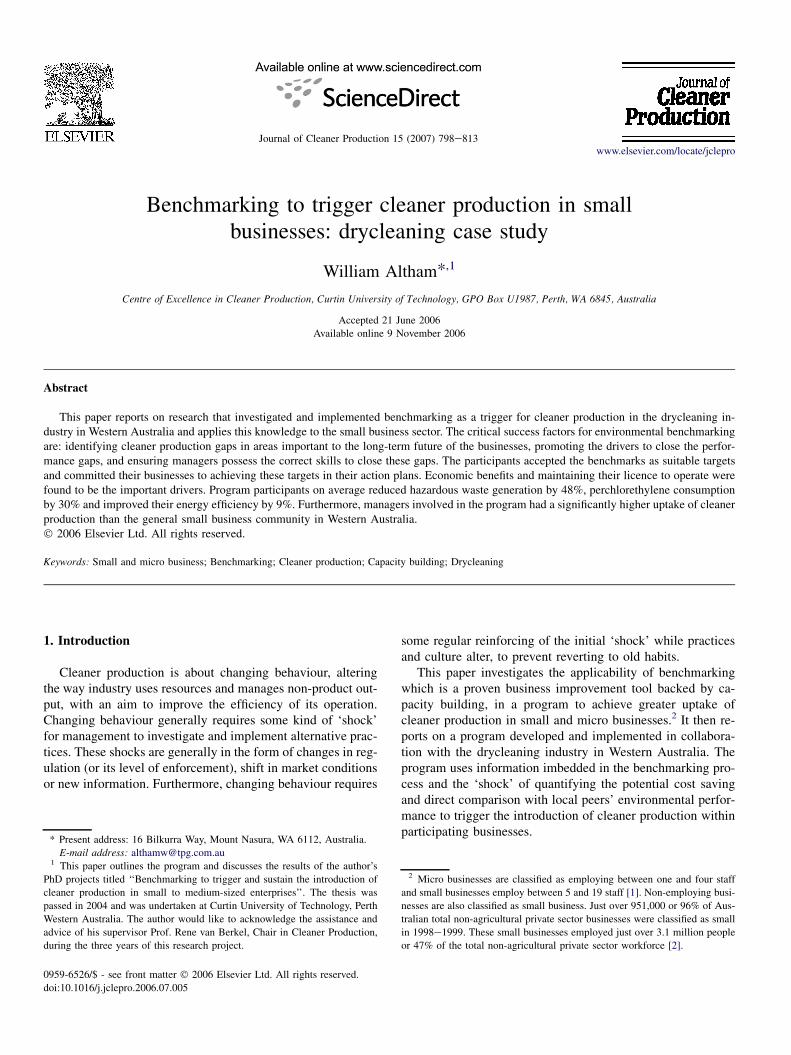
assistance in developing their action plans. The BenchmarkingOnly group thus only received information and was not assis-ted in customising the information to aid the business imple-ment it. Fig. 1 clearly shows the additional activities of theCleaner Production Club, the capacity building activities andthe formal development and approval of their action plans,and indicates the additional commitment by the manages ofthese business.
3.2. Benchmarking program
This section of the paper describes the benchmarking pro-gram in detail including the method of determining successof the program. This method is comprised of two mechanisms;firstly, quantifying any changes in cleaner production as mea-sured by resource use, waste generation, etc., and secondly byidentifying changes in the uptake of cleaner production asmeasured by the cleaner production monitor. This monitormeasures the manager’s (and/or business’s) awareness and un-derstanding of cleaner production, the extent that systems orpractices were in place to support cleaner production, andthe level of implementation of cleaner production reflectedin the adoption of cleaner production practices and technologyto improve the business’s environmental performance; seeAltham [56, p. 273e281] for full details.
3.2.1. Selection of indicatorsThe quantitative information was obtained from partici-
pants using an industry sector specific cleaner productionscorecard. This data was used to calculate the 11 indicatorslisted below. The indicators are a combination of two typesof performance indicators: managerial and operational indica-tors. Success of the program was based on the changes inenergy and chemical efficiency, waste perc and cleanerproduction uptake over the period of the 18 months of theprogram.
� Education and training (hours/employee)� Publications (number/month)� Incidents (number/month)� Perc mileage (kg of garments cleaned per litre of perchlor-
ethylene (perc) consumed)� Perc waste generation (garments cleaned per litre of waste
perc generated)� Energy (cents/garment)� Energy (% of turnover)� kWh/garment� kg GHG/garment� Waste costs (cents/garment)� Waste management practices (recycling cost as a percent-
age of total waste costs)
3.2.2. Data collection and analysisThe required data was incorporated onto a scorecard [56, p.
128], and this scorecard was pilot tested on a small number ofdrycleaners and adapted accordingly. An initial analysis was

803W. Altham / Journal of Cleaner Production 15 (2007) 798e813
SCORECARD
Provision of Indicators
Periodical EcoEfficiency Reporting
BENCHMARKING
Provision of printed material
Benchmarking Reports
Potential Cost Savings Analysis
CAPACITY BUILDING
Cleaner Production Club
Activities
Cleaner Production
Implementation
Improved Eco-Efficency
Performance
Continuous
Improvement
Feedback Loop
Action Plan
CONTROL
Qualitative and Quantatitive TestVariables
Qualitative TestVariables
CP Program
Fig. 1. Program design flow diagram.
made of the completed scorecards to get a feel for the informa-tion. The business managers with the best and poorest perfor-mance levels were contacted, to check the data for accuracy. Inthe case of the better performers, industry best practices wereidentified for inclusion in the capacity building workshops, aswell as to develop the cleaner production option checklist. Thedata for the best performers had to be confirmed because theywere was used to establish the performance standards for theother participants. Hence confidence was needed that theselevels of performance were actually being achieved withinthe program. In subsequent rounds business managers whoseperformance varied markedly from previous rounds were con-tacted to verify data and possibly determine a reason for thevariation (either positive or negative) if the data provedcorrect.
3.2.3. Identification of performance gaps andeconomies of scale
The identification of performance gaps was calculated us-ing an Excel spreadsheet and reported as part of the bench-marking report. Following this the data were analysed todetermine if economies of scale where present.
While normalisation is important to allow benchmarkingbetween businesses, when comparing businesses with many-fold differences in physical output it may prove important to
amend performance targets to allow for economies of scale.In the end business managers must be convinced that perfor-mance targets are achievable. The first stage of this processis to determine what is the ‘primary’ cause of variations ineco-efficiency: i.e. is it physical output or other factors?
Economies of scale are caused by two factors. First thefixed cost�variable cost mix, and secondly through efficiencygains from using larger equipment. In relation to the first,a drycleaning operation will use a relatively fixed amount ofresources just to open the shop before it cleans its first garmentfor the day. These resources will include electricity for lightsand cash register operations, gas to fire the boiler and fuelfor pick-up and delivery services, and as more garments arecleaned for the day, this resource use per garment can be ex-pected to fall. An example of the second cause of economiesof scale, is a 18.5 kg machine, which is 85% bigger thana 10 kg machine, but uses only an additional 47% energy tooperate a comparable cycle [57]. This means that even thoughindividual businesses may have exactly the same equipment,economies of scale will result if the level of output varies.
3.2.4. Establishing if economies of scale are presentTo establish whether economies of scale did influence
performance of individual businesses the data were analysedusing the SPSS statistical program to test for significant

804 W. Altham / Journal of Cleaner Production 15 (2007) 798e813
correlations. If the test indicates that economies of scale arepresent, the performance targets need to be amended to allowfor differences in cleaner production caused by the size of out-put and those created by other factors, (see Altham [56, p.118e121] for a detailed description of this procedure).Fig. 2 reports industry average performance and industrybest practices for variation in output. It is important to notethat this work assumes that the sample population accuratelyreflects the industry performance profile.
3.2.5. Feedback protocol and benchmarking reportsThe benchmarking results were presented to the partici-
pants as a benchmarking report, which consisted of a tableand radar chart graph, and a potential cost savings report cov-ering energy and perc. This report is provided in two parts; thefirst comprises a table and the second contains a radar chartdiagram depicting the individual indicators.
Table 1 is an example, and lists the best, poorest and the av-erage performance levels (unadjusted), and positions the par-ticular business’s performance level among those. It alsocalculates the percentage of the benchmark performance stan-dard achieved. The next line lists a calculation used to calcu-late the area of the radar chart covered. The bottom section ofthe table is used to track the performance history of the indi-vidual business to allow managers to identify trends in theirperformance compared to their peers and to assist in identify-ing the success of this program to improve their cleanerproduction.
The radar charts (see Fig. 3 for an example) gives a graph-ical presentation of performance to assist business managersinterpret their results. This graph illustrates how the businesscompares with its peers, and easily identifies the issues withthe greatest potential for improvement.
3.2.6. Potential economic benefitsThe potential economic benefits report was generated using
the industry best practice performance standard, for energycosts and chemical consumption, amended for economies ofscale if these were identified. The potential economic benefitsare also used to estimate the potential increase in net profit andsaving over an annual and five year period. This conversion to
Energy costs in cents per garment (n=16)
0
10
20
30
40
50
60
70
0 1000 2000 3000 4000 5000 6000 7000 8000 9000Number of garments cleaned per month
Co
st in
cen
ts/g
arm
en
t
Industry Average PerformanceCurve
Industry Best PracticePerformance Curve
Dots Represent Individual Business's Current
Fig. 2. Illustration of IBP performance for variations in physical output.
savings as an increase in net profit, serves two purposes.Firstly it illustrates that economic benefits go straight to thebottom line. Secondly, there is a multiplier effect of cost sav-ing [10], for example if net-profit is 15% of turnover, a 2%reduction in cost equates to a 13% increase in net-profits.The calculation of the potential increase in net profit usesdata collected on Australian businesses and reported throughthe Business Benchmarking Series collated by the Entrepre-neur Business Centre in collaboration with the University ofNew England (Armidale), NSW [50]. These results concludedthat the net profit for a drycleaning business with a turnover ofless than $150,000 is 33.5% of turnover, while for businessesover $150,000 in turnover the net profit is 14.7% of turnover.For this research, it was considered that the use of only twocategories would have distorted the results. An intermediatecategory was therefore included comprising businesses witha turnover of between $150,000 and $250,000 received a netprofit of 24% of turnover (the average between 14.6 and33.5). This process had the effect of reducing the increase innet profit by approximately 45% for businesses in this newlycreated category. However, this value is considered a more re-alistic estimation of likely increases in net profit for businessesof this size. The major cause of the higher profits in thesmaller businesses is lower wage cost, as the owner does themajority of the work.
It is extremely important to once again stress the specula-tive nature of the calculated potential profit increase. The en-thusiasm of business managers involved and the notion thatbenchmarking is a process, at least on the surface, indicatethat the estimated economic benefits were accepted as a realis-tic figure for the possible improvements in eco-efficiency.
3.3. Capacity building activities
The capacity building activities developed and provided aspart of the intervention program to enable greater uptake ofcleaner production are now listed. In line with the focus ofthis paper on three critical success factors for benchmarking,the capacity building activities built on two of these: cultivat-ing the drivers and providing the tools for closing the perfor-mance gap. The facilitated benchmarking program assisted inidentifying and quantifying the performance gaps.
As an aid to the establishment of this program a number ofpopular articles were identified as having potential benefit toparticipants, this material included Best Practice manuals, lo-cal environmental regulations, energy benchmarks, and casestudies. This material was made available at the Centre’swebsite.
As previously mentioned, business managers with the bestperformance standards were contacted to learn about their op-erating practices as compared to their peers. This process, thesearch of industry best practice case studies and site visits al-lowed further development for a cleaner production OptionChecklist. This checklist [56, p. 271-272] was distributed toall participants, with a request for feedback. The feedbackwas incorporated into the final version of the checklist andwas utilised as appropriate in the remainder of the program.

805W. Altham / Journal of Cleaner Production 15 (2007) 798e813
Tab
le1
Su
mm
ary
tab
lefo
rb
ench
mar
kin
gre
port
Gar
men
ts
nu
mb
er
mo
nth
Tra
inin
g
ho
urs
/
empl
oy
Ind
ust
ry
mat
eria
l/m
ags
rece
ive
Inci
den
tsG
arm
ents
clea
ned
per
tli
tre
of
was
te
per
cg
ener
ated
Per
cm
illa
ge
kg
/lit
En
erg
yu
seas
%
of
turn
over
En
erg
yp
er
gar
men
t
ince
nts
Was
te
man
agem
ent
Per
cw
aste
cost
per
gar
men
tce
nts
Are
ao
fw
eb
cove
red
(see
bel
ow)
Bes
t(b
ench
mar
k)
12
000
12
.75
05
83
79
3.5
23
.91
10
00
.34
Po
ore
st5
79
00
12
32
21
2.3
91
.54
22
11
.40
Ave
rage
33
57
2.4
50
.11
37
43
.56
.74
87
93
.81
AB
CD
rycl
ean
ers
33
57
2.4
50
13
74
46
.74
87
93
.8
%o
fb
ench
mar
k1
91
00
10
02
03
86
46
47
36
92
.893
%/1
00
0.1
891
.000
1.0
000
.20
30
.379
0.6
360
.64
40
.73
10
.68
71
.036
Ran
k(1
hig
h)
His
tory
(act
ual
)to
trac
kh
owy
ou
rp
erfo
rman
cech
ang
esov
erti
me
Q2
33
57
2.4
50
13
74
3.5
6.7
48
79
3.8
36
%
Q1
38
00
53
1N
ore
sult
40
74
57
94
.53
1%
A number of site visits were made to the Cleaner Produc-tion Club participants with the aim of:
� familiarising the researchers with the operation of the dry-cleaning industry;� demonstrating the Centre’s commitment to the industry
and this program;� maintaining participation of participants;� verifying cleaner production options checklist; and� assisting in the development of a business specific action
plan.
3.3.1. Workshop programThe training program comprised five workshops. These
were scheduled to occur late afternoon mid week. Arranginga suitable time to conduct workshops for small business man-agers appeared to be difficult because of uncertain businesscommitments, therefore the level of attendance varied consid-erably across the workshops. The timing of a workshop wasa predicament for all organisations involved in small busi-nesses training.
The training material provided included a workbook [58]containing the material covered in each of the workshops.The workbook provided a generic, non-sector specific frame-work for the development and implementation of cleaner pro-duction in small businesses. In the delivery of the drycleanersprogram, sector specific content was added. The workshopprogram started with an introduction to cleaner production, be-fore instruction in the process of developing material balancesand cause identification in the second workshop. The third andfourth workshops investigated materials and waste, and waterand energy respectively, as specific areas for generatingcleaner production options. The final workshop dealt withcleaner production implementation and evaluation of cleanerproduction options. Discussions were also held during theworkshops to encourage business managers to raise theirown issues and concerns and to discuss their personal practicesand experiences. At times this discussion became very infor-mative and many ideas were generated and ‘bounced’ offeach other while on other occasions there was little interaction.Fig. 4 outlines the workshops, modules, and assistance pro-vided to individual businesses and the outcomes expectedfrom the program. For greater details see Altham [56, p.103e132].
3.3.2. Self-assessment worksheets and action plandevelopment
As part of the workshop program, business managers wererequested to complete a set of worksheets to improve environ-mental accounting while assisting in the development of theaction plans. These focused on areas identified by the bench-marks as having the greatest potential for improvements andeconomic benefits. These action plans included general infor-mation on the business, baseline cleaner production perfor-mance, its cleaner production project(s), staff member(s)responsible for the project, estimated time to implement

806 W. Altham / Journal of Cleaner Production 15 (2007) 798e813
Fig. 3. Spiral graph of actual performance rated against the benchmarks.
projects and the expected financial and environmental benefitsof the projects. Projects are divided into, on-going, short, me-dium or longer-term projects to aid business planning.
The targets incorporated into the action plans, were estab-lished as the business size adjusted benchmarks (if economiesof scale were present) with 50% of the improvement allocatedto the first 6 months following the completion of the ActionPlan and the second 50% in the following 12 months. Thiswas done as it was anticipated that the first 50% of cleanerproduction improvements would be the easiest to achieve.All drycleaners were revisited to finalise and sign-off on theircleaner production Action Plans (see Altham [56, p. 135e137]for an example). Following this, Cleaner Production Certifi-cates were presented for display in their workshops; to assistbusinesses’ demonstrate their commitment to environmentalexcellence to their customers and staff. The presentation washeld at an industry function where their peers and staff mem-bers were in attendance.
3.4. Cleaner production monitor
The qualitative assessment of the influence of this researchproject was recorded on the ‘Cleaner Production Monitor’.This monitor was applied to the drycleaning sector for tworeasons, first as a reference group for a cross-sector compara-tive assessment (forming the non-drycleaners control), and
secondly as a control group for this research (forming the dry-cleaners control). The results were reported as an uptake score,which is the combination of three aggregated indicators(awareness, management and implementation) to estimatethe level of uptake of cleaner production within monitorparticipants.
Awareness: This score reflects the level of awareness andunderstanding of cleaner production and eco-efficiency bythe organisation’s owners/operators. It is based on recognitionthat cleaner production should be integrated into managementprograms, and that it is a preventive strategy that creates busi-ness opportunities in both short and longer term.
Management incentives: This score indicates if manage-ment and information systems or their elements are in placeto support cleaner production/eco-efficiency initiatives. Infor-mation was obtained on whether the business has an environ-mental management policy or plan, and if so requested a briefdescription of the policy or plan; who endorses it, if availableto the public, and the level of management involved in devis-ing, implementing and actioning the plan. The survey also in-vestigated knowledge of the business’s environmental costs,i.e. energy and water bills and waste disposal costs.
Implementation: This score indicates if the business has imple-mented management, organisational or technical innovation thathas resulted in cleaner production/eco-efficiency outcomes. Theinterviewer requested information on the number of innovations
Environmental
Management
Cleaner
Production
Materials and
Waste Review
Energy and
Water Review
Cleaner
Production
Plan
Environmental
Aspects and
Costs
Environmental
Input and Output
Inventory
Cleaner
Production Plan
Energy and Water
Conservation and
Recovery
Waste
Minimisation and
Material and
Waste Handling
certificate
workshops
self
assessment
on site
assistance
Fig. 4. Structure of workshops.

807W. Altham / Journal of Cleaner Production 15 (2007) 798e813
implemented to improve operational efficiency and cut costs overthe last three years that have led to reduced energy or water usageor a reduction in liquid effluent, solid waste or air emissions.
Uptake is the sum of the above three scores. Each compo-nent has a maximum score of 100, giving a total possible scoreof 300 [59].
4. Benchmarking program results
The case study initially included 17 businesses: seven in theCleaner Production Club and ten in the Benchmarking Onlyprogram. Three rounds of data were collected and analysedover a period of 18 months. Nine businesses participated inthe case study until the completion of the research project.Eight of these provided useable data: four in each of thegroups and one manager provided an incomplete scorecardfor the third and final round of data. Of the eight businessesthat dropped out of the program, six sold their business, whiletwo considered the program not worth their continued involve-ment and therefore withdrew from the program. Approxi-mately 22% of drycleaning business managers from WesternAustralia initially participated in the program.
Table 2 summarises the results and variations in the perfor-mance levels over the period of the data collection. This datashows a large variation in the performance levels of participat-ing businesses.
It was interesting to note from comparing the results fromthe different rounds of data, that even though the first and thirdrounds (summer season) of data were similar, the secondround (winter season) showed a decline in cleaner production[56, p. 165]. The second round of benchmarking data covereda traditionally low season for the drycleaning industry, withoutput declining by 25%. These results showed that opera-tional practices do not always alter to take account of changesin physical output, and suggests that many businesses weremanaged by habit and entrenched practices.
An encouraging outcome of this research project is thatfour business managers, with collectively over 100 years expe-rience in the drycleaning industry, all operating high produc-tivity operations (cleaned on average 1446 garments permonth per employee compared to the average of 972) partici-pated in the program. The four are singled out for this section,as the business managers with the greatest experience in theindustry and those who could be expected to have the leastto gain from this program. Three of these four were also thesubjects of drycleaning cleaner production case studies pub-lished for this work.
The improvement in cleaner production of this group com-pared to the whole group were for; energy cost per garment,8.2% compared to 5.4%; improvement in perc mileage, 44%compared to 29.7%; and the increase in the number of gar-ments cleaned per litre of perc waste, 71% compared to47.9%. This demonstrates that benchmarking did trigger man-agements’ attention on additional elements of the business’soperations regardless of current levels of performance and ex-perience in the particular industry.
4.1. Cause of performance gaps
These performance gaps were further investigated to deter-mine if the variations in performance are caused by physicaloutput (reflecting economies of scale) or by other factors.These other factors include not only management and workpractices, as well as business culture, but also the type of ser-vices offered (e.g. delivery, same-day service, etc.), layout ofequipment, age and make of the drycleaning machine, boilerfuel source, percentage of steam pipes lagged, and the amountof ‘other activities’ such as alteration and laundry services pro-vided by the business.
The four energy indicators are the only indicators for whichphysical output had a significant correlation with the perfor-mance levels from the first round of data. Therefore, econo-mies of scale were present and allowed for only in respect
Table 2
Results and performance variations
Indicator Performance
Change in
performance %dPooreste Beste Averagee Fold
difference
Education and training (hours/employee) �48.25 0 6.7 1.8 N/A
Publications (number/month) 122.22 0 4 1.8 N/A
Incidents (number/month) 0.00 1 0 0.2 N/A
Perc mileagea 29.74 20 87 44 4.4
Perc waste generationb 47.87 32 225 105 7
Energy (cents/garment) 5.40 66 18 37 3.7
Energy (% of turnover) 0.50 8.87 2.57 5.7 3.5
kWh/garment 9.06 8.5 2.1 4.6 4
kg GHG/garment 17.32 3.46 0.91 1.8 3.8
Waste costs (cents/garment) 47.87 10.4 1.4 4.6 7.4
Waste management practicesc �0.18 22 100 79 4.5
a Kilograms of garments cleaned per litre of perchlorethylene (perc) consumed.b Garments cleaned per litre of waste perc generated.c Recycling cost/total waste costs as %.d This analysis was only conducted on businesses that completed the program (n ¼ 8).e Average performance for individual businesses, based on all available records for each business (n ¼ 17).

808 W. Altham / Journal of Cleaner Production 15 (2007) 798e813
to the energy performance target. This significant result meansthat the energy target needs to be amended for economies ofscale as previously discussed to generate more realistic andcredible targets for individual small businesses. The estimatedunadjusted average energy saving is 55% of current energycosts, while the estimated adjusted value is 23%, a valuewhich appears a much more realistic figure and equates toan average of $3384 per participant. An energy saving of23% equates to a 1.2% reduction in total costs and an average8% rise in net profit. This approach has the potential to boostthe acceptance of benchmarking, because it directly considersthe size of the business in calculating suitable benchmarks,while helping convince the majority of business managersthat the size of their business is no reason or excuse for theircurrent higher energy costs compared to their peers.
Figs. 5e7 illustrate the wide variation in performance be-tween the businesses participating in the program. The energyresults (Fig. 5) show a more consistence trend between outputand energy cost, the relationship is significant. While for percmileage (Fig. 6) and perc waste (Fig. 7) the performance var-iation are much greater than for energy consumption.
4.2. Promotion of potential cost savings
Potential cost savings were reported as a potential increasein projected net profit. The areas in which these savings couldbe made were: 62% from improvements in energy efficiency;28% from improvements in perc efficiency; and 10% fromreduction in the cost of perc waste disposal, again reflectingcurrent cost structures.
Fig. 8 splits the increase in net profit between the three maincleaner production areas and this graph shows that the potentialto increase profits varies considerably between participatingbusinesses. The potential increases in net profit for participantsrange from 1.1% to 33.6%, with the average at 10.9%.
All participants further stated they were paying greaterattention to operational procedures and environmental man-agement accounting and were investigating additional prac-tices, procedures and equipment to reduce these costs. Thisis in line with the general expectation, but quantitative datais not available to support this claim.
Total Energy Costs in Cents per Garment
R2= 0.6466
0.00
0.10
0.20
0.30
0.40
0.50
0.60
0.70
0 1000 2000 3000 4000 5000 6000 7000 8000Number of Garments Cleaned per Month
Cen
ts p
er G
arm
en
t
Fig. 5. Total energy costs in cents per garment for round one.
4.3. Cleaner production and eco-efficiency uptake
The cleaner production monitor surveyed the level ofcleaner production uptake (awareness, management and im-plementation) by SMEs in four industry sectors. The sectorssurveyed were food processing, metal products, paper-basedprinting and drycleaning sectors. Eighty percent of businessesand all of the drycleaners surveyed were from Western Aus-tralia. The monitor used the drycleaning industry as a referencegroup to estimate the success of this drycleaners’ cleaner pro-duction program. The drycleaners surveyed in the cleaner pro-duction monitor research were divided into cleaner productionprogram participants and the drycleaners control groups, withthe first group further divided into the Cleaner ProductionClub and the Benchmarking Only groups. The results of thissurvey were used to determine in an objective, semi-quantita-tive manner the success of the two intervention programs(benchmarking and capacity building), and to determinewhether members of the drycleaning industry not participatingin the research program (drycleaning control) had similarlevels of cleaner production uptake as the other industry sec-tors (non-drycleaning control). This analysis also determineswhether they were inferior to those participating in the inter-vention program, or similar to those participating in theprogram and superior to the other three industry sectors(non-drycleaning control).
Raw scores of drycleaners survey and the averages for thenon-drycleaning sectors in the cleaner production monitor pro-gram are included in Table 3. For greater details on the surveyplease refer to Altham [56, p. 273e281]. As a short recap,awareness gauges the level of awareness and understandingof cleaner production and eco-efficiency. Management gaugesif management and information systems are in place to supportcleaner production and eco-efficiency, while implementationgauges the level of implementation of cleaner production oreco-efficiency within the business. Each is scored out of 100and the sum is the cumulative score (max 300). Note thatthe industry drycleaning program is the combination of theCleaner Production Club and the Benchmarking Onlyparticipants.
4.4. Summary of statistical test results
The results of this analysis suggest that businesses that par-ticipated in the research project, as a group, had a significantlyhigher uptake of cleaner production than those that did not.The drycleaning control and the non-drycleaning controlgroups had similar levels of uptake of cleaner production,indicating that the improvement can be attributed to thisresearch project. However, identifying whether there is a sig-nificant difference in the uptake in cleaner production betweenthe Cleaner Production Club and the Benchmarking Onlygroups of the research program is uncertain because of thelow number of businesses in the two samples at the completionof the program. From these results the conclusion can bedrawn that the research project did increase the level of uptakeof cleaner production, however which intervention component

809W. Altham / Journal of Cleaner Production 15 (2007) 798e813
Perc Mileage (kg of garment cleaned per litre of perc consumed)
R2 = 0.1747
0102030405060708090
100
0 1000 2000 3000 4000 5000 6000 7000 8000Number of Garments Cleaned per Month
Perc M
ileag
e (N
um
ber)
Fig. 6. Perc mileage for round one.
(benchmarking or capacity building) had the greatest influencecannot be determined.
5. Discussion: the limitation of benchmarking to triggercleaner production in small businesses
There are a number of factors that restrict the potential ofbenchmarking to trigger firm level improvements in eco-effi-ciency. These are discussed below in relation to the criticalsuccess factors for benchmarking.
The identification of performance gaps has two main bar-riers for small businesses. First, small businesses often con-sider they have no environmental aspects and thereforerequire assistance with the selection of KPI. The second re-lates to poor or non-existent environmental monitoring and ac-counting practices [60]. Furthermore when environmentalcosts are identified, they are often allocated to overheads,which mask the source of the expense [61,62] and reducesdrivers for improvement. Improved environmental cost ac-counting leads to the identification of additional cleaner pro-duction options [63]. Where environmental accountingpractices are implemented they often contain a very narrowdefinition of environmental costs. The direct costs are often
only the ‘tip of the iceberg’ for the total environmental costs[64]. The major cost is generally the labour required to collect,transfer and compact the material to the waste collection pointready for collection [65]. An example of the poor recognitionof waste costs comes from the UK; when a group of businesseswere asked to estimate their waste costs before a completewaste audit was conducted; the actual cost of waste was onaverage 25 times that estimated [66]. Poor environmentalaccounting practices result in limited or no recognition ofpotential cost saving, which in turn diminishes economic ben-efits as a driver for improving eco-efficiency.
A mix of drivers increases the incentive to improve eco-efficiency. These drivers can be split into internal driversand external drivers. They impact on efficiency and competi-tiveness respectively (given a level of overlap). Internal driversseek improvements in efficiency, while external drivers seektheir ‘licence to operate’ together with recognition fromawards and accreditation for the business’s superior cleanerproduction leading to competitive and marketing advantages.However, such external drivers are of limited influence onsmall businesses because of the unsuitability of current accred-itation programs (ISO 14001 etc.) and the limited visibility ofsmall businesses in the market.
Number of Garments Cleaned per Litre of Perc waste Generated
R2 = 0.232
0
50
100
150
200
250
0 1000 2000 3000 4000 5000 6000 7000 8000Number of Garments Cleaned per Month
Nu
mb
er o
f g
arm
en
ts clean
ed
/litre
waste p
erc
Fig. 7. Waste perc for round one.

810 W. Altham / Journal of Cleaner Production 15 (2007) 798e813
Percentage Increase in Potential Net Profit - By Business and Cost Area
0 5 10 15 20 25 30 35CPC1CPC2CPC3CPC4CPC5CPC6CPC7
BM1BM2BM3BM4BM5BM6BM7BM8BM9
BM10
Co
mp
an
y C
od
e
Percent Increase in Potential Net Profit
Total Energy Costs Perc Consumption Costs Perc Waste Disposal Costs
Fig. 8. Percentage increase in net profit.
Economic benefits can be a poor driver to reduce environ-mental impacts if the link between ‘environmental impacts’and ‘environmental costs’ is weak. This situation is createdby limited implementation of the ‘polluter pays’ principle,hidden subsidies and the lack of internalisation of externalities[67,68]. The presence of externalities encourages the overex-ploitation of natural resources because the price paid is lessthan the real cost of these resources. This situation leads toan increase in demand for the resources and diminished incen-tive to increase efficiency or identify substitutes. These sub-sidies reduce the potential economic benefits that can begenerated by improved eco-efficiency, hence also diminishingits value as a driver for change. Under current policy the mar-ket often does not provide the correct price signals to supportmore environmental sustainable practices. This has led to callsto ‘strengthen the market’ [68e70]. As an illustration of thispoint Australia’s agriculture sector receives an indirect subsidyof $3.322 billion dollars a year due to low water charges [71].In Australia the total value of environmental subsidies was es-timated to be approximately $14 billion or 3.3% of GDP [71],and globally the indirect subsidy total $US 650 billion peryear [72].
Risk management is also a weak driver in situations wherebusiness managers have a poor understanding of the potentialenvironmental and health impacts of the materials they use,the waste they create and the emissions they release. Further,if the enforcement of regulation is questionable, fear of pros-ecution or licence withdrawal as drivers to improve cleanerproduction will also be diminished.
By using benchmarking to target those areas of cleaner pro-duction that have the greatest opportunity for economic bene-fit, business managers may not investigate the full range oftheir environmental impacts, but only those with major directenvironmental costs attached. Furthermore, business managersare tempted to consult checklists, case studies, demonstrationsites, and published material rather than conduct a full causeassessment, or fully explore the full range of cleaner
production practices. Therefore, they often end up with solu-tions that are not appropriate to their situation, and which donot providing long-term innovative solutions [73]. The cleanerproduction action plan as developed in this program may beconsidered an abridged method of conducting a cleaner pro-duction assessment. To help counter this limitation of bench-marking, the program continually reinforces the messagethat sound environmental management requires the analysisof root causes, and for those seeking a more sustainable andinnovative solution they need to use more comprehensivecleaner production tools. This concern is echoed in the reportof the Quick-scan program in the Netherlands [74].
6. Conclusion
Businesses that completed the program on average im-proved their energy efficiency (kWh/garment) by 9%, reducedperc consumption (perc mileage) by 30%, and reduced hazard-ous waste generation (garments cleaned/litre waste perc) by48%. Perc and perc waste cost are still minor costs to the busi-ness, but are becoming of increased importance due to con-cerns over their ‘licence to operate’, potential of regulatorychanges, the increasing cost of waste disposal and liability
Table 3
Results of the cleaner production monitor
Awareness Management Implementation Sum
CP Club (n ¼ 3) 70 66 57 193
Benchmark only
(n ¼ 3)
50 67 40 157
Industry drycleaning
program (n ¼ 6)
60 66 48 175
Drycleaning control
(n ¼ 13)
19 46 17 82
Non-drycleaning
control (n ¼ 121)
21 41 19 81
n, number of companies in sample.

811W. Altham / Journal of Cleaner Production 15 (2007) 798e813
considerations. The results of this research project found thatthere is not a significant difference in the rate of improvementin cleaner production between the two program groups(Cleaner Production Club and Benchmarking Only group).Furthermore, the reported levels of cleaner production im-provement were not uniform. The businesses with the higherproductivity (measured as garments cleaned per employee)and/or the longer experience in the industry improved theirperformance more than the average, regardless of which pro-gram they participated in, giving further support to the viewthat well managed businesses have the greatest potential togain from a systematic program such as this.
The large variations in the physical output of the businessesrequired statistical testing for the presence of economies ofscale, and if found, to correct for these. If economies of scaleare present, the unadjusted targets are unrealistic and thereforelimit the effectiveness and credibility of such programs andhence threaten continued participation in the program. If econ-omies of scale are not present, the results show that the smallsize of any operation is no excuse for poor eco-efficiency.
With respect to energy costs, economies of scale werepresent in the participating businesses. Therefore, programsto improve energy efficiency may require an improved causeanalysis or more innovative or technical solutions. This is be-cause owners had worked constantly to improving energy ef-ficiency because energy costs were sufficiently high (6% ofturnover) to flag energy costs as an area of concern for long-term profitability. In regards to perc mileage and the genera-tion of perc waste, the majority of the variation in performancewas caused by other management factors. This is because littleor no attention had been directed at improving perc mileage orreduction of waste perc generation, because perc costs werelow (as a percentage of turnovers) and therefore perc manage-ment was not flagged as an area of concern for long-term prof-itability. These final two results suggest the many ‘goodhousekeeping practices’ are still available to improve percmileage and perc waste performance; as reflected in the largeimprovements in perc performance. Business managers shouldtherefore initially be directed towards improving current prac-tices and procedures through good housekeeping and low-costtechnology modification options rather than through more ad-vanced technical solutions.
Initially there was poor recognition of the industry’s envi-ronmental aspects. This research project revealed that cleanerproduction gaps existed and some of these gaps were consid-ered important for individual business managers. Economicbenefits, risk management and fear of regulation were the pri-mary drivers to improve cleaner production in the drycleaningindustry. The introduction of cleaner production in the dry-cleaning sector was triggered by benchmarking and, in thecase of this program, was supported by suitable capacity build-ing activities. This twin intervention overcame many of the bar-riers to cleaner production for small businesses and providedcapacity building at a level in accordance with the businessmanager’s experience and knowledge of environmental issues.
This research project identified the potential of two-tierprograms (Benchmarking Only programs, or the establishment
of Cleaner Production Clubs) to maximise capacity buildingwhile obtaining the best use of limited resources. The initialestablishment of Benchmarking Only programs which selectedKPIs, established benchmarks, distributed printed material to-gether with short site visits can start business managers on theroad to cleaner production. This is particularly the case inindustry sectors with a limited history of cleaner production,major variations in eco-efficiency, and poor environmentalmanagement accounting practices (criteria most small busi-nesses would meet). These programs are well suited to be de-livered by industry organisations with assistance from cleanerproduction centres. As more of the good housekeeping prac-tices and minor technology modification practices are imple-mented and practices changed, the demand for morecomprehensive Cleaner Production Club capacity buildingprograms will increase, and this training should be providedby trained cleaner production specialists.
The conclusion is that there are large numbers of goodhousekeeping and minor technology modification practicesnot utilised for industries with a limited history of cleanerproduction, and that simple benchmarking and basic environ-mental management accounting practices do trigger cleanerproduction initiatives. This approach allows low resource pro-grams (for both facilitators and businesses) to be establishedbefore introducing more comprehensive cleaner productioncapacity building programs when demanded by industry.This demand-side drive for cleaner production programs in-creases the likelihood of success. These programs should beestablished in collaboration with all stakeholders and withthe industry organisation facilitating the program to utilise es-tablished lines of communication and the trust between busi-ness managers and industry organisations.
Small businesses face a number of barriers to cleaner pro-duction and benchmarking. The barriers to cleaner productioninclude identifying environmental aspects and cost, knowledgeof method to improve cleaner production and the resources andtime to identify and implement cleaner production options. Thebarriers to benchmarking include identifying key performanceindicators, collecting and analysing data, selecting benchmark-ing partners, networking with all stakeholders, and developingand implementing actionable improvements. Because of thesebarriers, benchmarking and cleaner production programs forsmall businesses need to be facilitated by a third party and im-plemented as a sector specific network in collaboration withother active stakeholders. From this research it appears that‘what did get measured does get managed’ particularly whenthere is a local reference point, i.e. peer benchmarks.
References
[1] Australian Bureau of Statistics. Characteristics of small business (Cat.
No. 8127.0). Canberra: ABS, Australian Commonwealth Government;
2001.
[2] Australian Bureau of Statistics. Small business in Australia (Cat. No.
1321.0). Canberra: ABS, Australian Bureau of Statistics; 1999.
[3] Bolli A, Emtairah T. Environmental benchmarking for local authorities:
from concept to practice. Copenhagen: European Environment Agency;
2001. p. 64.

812 W. Altham / Journal of Cleaner Production 15 (2007) 798e813
[4] Monkhouse E. The role of competitive benchmarking in small to
medium -sized enterprises. Benchmarking for Quality Management and
Technology 1995;2(4):41e50.
[5] Bergin S. Benchmarking small business performance: barriers and bene-
fits, ICSB world conference. Brisbane: Australia; 2000.
[6] Dodd J, Turner M. Is benchmarking appropriate of small businesses?
National Public Accountant 2000;45(6):36e44.
[7] Aquatech. A benchmark of current cleaner production practices. Envi-
ronment Australia; 1997.
[8] NSWEPA. Profits from cleaner production; a self-help tool for small to
medium-sized businesses. Sydney: New South Wales EPA; 2000. p. 72.
[9] European Commission. Integrated pollution prevention and control: draft
reference document on the general principles of monitoring; 2002.
[10] Hennicke P, Ramesohl S. Interdisciplinary analysis of successful imple-
mentation of energy efficiency in the industrial, commercial and service
sector. The European Commission 1998;137.
[11] USEPA. Why should you care about preventing waste? US EPA; 2001.
[12] Texas Instruments. Best practice: benchmarking as a tool for quality as-
sessment; 1998.
[13] Garvin D. Building a learning organization. Harvard Business Review
1993;Jul/Aug:78e91.
[14] Laakso T, Kleinhans S, Smeds R, Doumeingts G. Embedding the man-
agement of evolution into strategic learning. International Journal of Pro-
duction Economics 1998;56e57:333e45.
[15] Wehrmeyer W. Measuring environmental business performance. In:
Hillary R, editor. Business and the environment e practitioner series.
Cheltenham: Stanley Thornes; 1995. p. 110.
[16] Codling S. Best practice benchmarking. Hampshire: Gower Publishing
Limited; 1992.
[17] Camp R. Business process benchmarking: finding and implementing best
practices. Milwaukee: ASQC Quality Press; 1995.
[18] Lynn G, Valentine W, Wright R. A benchcasing study of new product and
process development. Engineering Management Journal 1996;8(4):5e13.
[19] Codling B. Benchgrafting: a model for successful implementation of the
conclusions of benchmarking studies. Benchmarking for Quality Man-
agement and Technology 1998;5(3):158e64.
[20] Gunningham N, Sinclair D. Barriers and motivators to the adoption of
cleaner production practices. Canberra: Environment Australia; 1997.
[21] Lee G, Bennett D, Oakes I. Technological and organisational change in
small to medium-sized manufacturing companies e a learning organisa-
tion perspective. International Journal of Operations and Production
Management 2000;20(5):549e72.
[22] Ali S, Breen J, Sims R. Successful small business: an approach to iden-
tifying businesses with a predisposition to growth’, creating innovative
growth companies, 14th conference of the Small Enterprise Association
of Australia and New Zealand. Wellington: New Zealand; 2001.
[23] Carroll B, Tomas S. Team competition spurs continuous improvement at
Motorola. National Productivity Review 1995;14(4):1e9.
[24] Global Environmental Management Initiative. Benchmarking: the primer ebenchmarking for continuous environmental improvement. Washington:
GEMI; 1994.
[25] Rigby D. Management tools and techniques: a survey. California Man-
agement Review 2001;43(2):139e60.
[26] Lee T. The effects of benchmarking and process information on information
acquisition and decision outcomes. Arizona State University; 1999. p. 66.
[27] Australian Dept of Industrial Relations. Environmental efficiency in the
Australian public service. Australian Dept of Industrial Relations; 1996.
[28] Bogan C, Callahan D. Benchmarking in rapid time. Industrial Manage-
ment 2001;MarcheApril:28e33.
[29] Atkin B. Innovation and benchmarking in the building and construction
sector e the UK approach, Commonwealth Government Officials Con-
ference. Brisbane: Australia; 2000.
[30] Department of Employment Workplace Relations and Small Business. A
portrait of Australian business: results of the 1996 business longitudinal
survey. Canberra: Small Business Research Program; 1998.
[31] Tilley F. The gap between the environmental attitudes and the environ-
mental behaviour of small firms. Business Strategy and the Environment
1999;8:238e48.
[32] Gerstenfeld A, Roberts H. Size matters. In: Hillary R, editor. Small and
medium-sized enterprises and the environment. Aizlewood: Greenleaf;
2000. p. 106e18.
[33] Beardsley D. Incentives for environmental improvement: an assessment
of selected programs in the States and Europe. Washington: Global En-
vironmental Management Initiative; 1996.
[34] Hunt J. Environment, information and networks. In: Hillary R, editor.
Small and medium-sized enterprises and the environment. Aizlewood:
Greenleaf; 2000. p. 194e202.
[35] Bichard E. Time to reassess the small business environmental advisory
system in the UK. In: Hillary R, editor. Small and medium-sized enter-
prises and the environment. Aizlewood: Greenleaf; 2000. p. 255e62.
[36] Rosenfeld SA. Does cooperation enhance competitiveness? Assessing
the impacts of inter-firm collaboration. Research Policy 1996;25:247e63.
[37] Enright M, Ffowcs-Williams I. Local partnerships, clusters and SME
globalization. Bologna: OECD; 2000. p. 37.
[38] Codling S. Best practice in benchmarking. 2nd ed. Vol. Houston, TX:
Gulf Publishing Company; 1996.
[39] Zairi M, Whymark J. The transfer of best practices: how to build a culture
of benchmarking and continuous learning: parts 1&2. Benchmarking An
International Journal 2000;7(1):62e78, 146e67.
[40] Jarrar Y, Zairi M. Internal transfer of best practice for performance excel-
lence: a global survey. Benchmarking 2000;7(4):239e46.
[41] OECD. Encouraging environmentally sustainable growth. OECD
2001;52.
[42] Environmental Technology Best Practice Program. Perchloroethylene
consumption in the dry-cleaning industry. Envirowise 1996.
[43] Energy Efficiency Best Practice Program. Energy efficiency in the dry-
cleaning industry. Oxfordshire, UK: UK Department of Industry Science
and Resources; 2000.
[44] Hillary R. Introduction: small and medium-sized enterprises and the en-
vironment. In: Hillary R, editor. Small and medium-sized enterprises and
the environment. Sheffield: Greenleaf; 2000. p. 11e22.
[45] Smith A, Kemp R, Duff C. Factors that influence small and medium-
sized enterprises’ environmental behaviour. In: Hillary R, editor. Small
and medium-sized enterprises and the environment. Sheffield: Greenleaf;
2000. p. 24e34.
[46] Lee-Kuhre W. ISO 14031 environmental performance evaluation. Upper
Saddle River: Prentice Hall; 1998.
[47] Sustainability. Engaging stakeholders. parts 1&2. UNEP 1996;196.
[48] Global Environmental Management Initiative. GEMI benchmarking sur-
veys. GEMI; n.d.
[49] Energy Efficiency Best Practice Program. Innovation; big step energy ef-
ficiency. Australian Energy News 2001;14e5.
[50] Entrepreneur Business Centre. Benchmarking your own business. Perth,
Western Australia: Entrepreneur Business Centre; 2001.
[51] Augenstein D. The power of teamwork. Fleet Equipment 1995;21(6):12.
[52] Palmer J, van der Vorst R. Are standard systems right for SMEs? Eco-
Management and Auditing 1996;3:91e6.
[53] National Pollutant Inventory. Substance profile e tetrachloroethylene.
Environment Australia 2003.
[54] Entrepreneur Business Centre. EBC business start-up guide for dry clean-
ing business. Perth: Entrepreneur Business Centre; 2003. p. 20.
[55] Drycleaning Institute of Australia. Drycleaning industry regulation stan-
dard. Drycleaning Institute of Australia; 1999.
[56] Altham W. Benchmarking to trigger and sustain the introduction of
cleaner production in SMEs. PhD thesis. Curtin University of Technol-
ogy, Perth, Australia; 2003. p. 330
[57] Union Pty Ltd. Permatic 1010-1013 Product sales pamphlet. Bologna;
2000.
[58] Centre of Excellence in Cleaner Production. Small to medium sized
business training manual. Centre of Excellence in Cleaner Production;
2001.
[59] Howgrave-Graham A, van Berkel R. Monitoring and benchmarking the
uptake of cleaner production in SMEs. Perth: Centre of Excellence in
Cleaner Production; 2001. p. 14 (unpublished).
[60] Todd R. Environmental measures developing an environmental decision-
support structure. In: Schulze PC, editor. Measures of environmental

813W. Altham / Journal of Cleaner Production 15 (2007) 798e813
performance and ecosystem condition. Washington, DC: Natural Acad-
emy Press; 1999. p. 177e87.
[61] White A, Savage DE, Brody J, Cavander D, Lach L. Environmental cost
accounting for capital budgeting. Boston: Tellus Institute; 1995. p. 9.
[62] Environment Australia. Profiting from environmental improvement in
business. Canberra: Environment Australia; 1999. p. 24.
[63] Olvida T, Alvarez-Rivero T, Chipman R. Improving governments’ role in
the promotion of environmental managerial accounting. New York:
United Nations; 2000. p. 80.
[64] Environmental Technology Best Practice Program. Waste minimisation
pays: five business reasons for reducing waste. Envirowise 1998.
[65] Fox J, Gertman R, Pratt W, Shiremen W. Profiting from source reduction:
measuring the hidden benefits. Alameda Country Source Reduction and
Recycling Board; 1997.
[66] Phillips PS, Read AD, Green AE, Bates MP. UK waste minimisation
clubs: a contribution to sustainable waste management. Resources, Con-
servation and Recycling 1999;27:217e47.
[67] Roodman DM. Paying the piper: subsidies, politics, and the environment.
Worldwatch Institute; 1996.
[68] Commission on Sustainable Development. Implementation of agenda 21.
United Nations; 1997.
[69] Australian and New Zealand Environment and Conservation Council.
Towards sustainability: achieving cleaner production in Australia.
Canberra: Australian and New Zealand Environment and Conservation
Council; 1999.
[70] Holliday C, Schmidheiny S, Watts P. Walking the talk: the business case
for sustainable development. Sheffield: Greenleaf Publishing; 2002.
[71] Environment Australia. Subsidies to the use of natural resources.
Canberra: Department of the Environment, Sport and Territories; 1996.
[72] Hargroves K, Smith M. The role of government. In: Hargrove K,
Smith M, editors. The Natural Advantage of Nations. Sterling, USA:
Earthscan; 2005. p. 171e216.
[73] Wanzenried B, Dvorak BI, Woldt E. Descriptive versus prescriptive com-
parison of P2 opportunity assessment approaches. Pollution Prevention
Review 1999;Summer;67e79.
[74] de Bruijin T, Hofman P. Pollution prevention and industrial transforma-
tion evoking structural changes within companies. Journal of Cleaner
Production 2000;8:215e23.