Embed Size (px)
Citation preview

T h e A u d i t o r - G e n e r a lAudit Report No.25 2000–2001Information Support Services
Benchmarking the Finance Function
A u s t r a l i a n N a t i o n a l A u d i t O f f i c e

2 Benchmarking the Finance Function
© Commonwealthof Australia 2000
ISSN 1036-7632
ISBN 0 642 44274 6
This work is copyright. Apart fromany use as permitted under theCopyright Act 1968, no part may bereproduced by any process withoutprior written permission from theCommonwealth, available fromAusInfo. Requests and inquiriesconcerning reproduction and rightsshould be addressed to:The Manager,Legislative Services,AusInfoGPO Box 1920Canberra ACT 2601or by email:[email protected]

3
Canberra ACT22 December 2000
Dear Madam PresidentDear Mr Speaker
The Australian National Audit Office has undertaken abenchmarking study in accordance with the authority containedin the Auditor-General Act 1997. I present this report of thisaudit, and the accompanying brochure, to the Parliament. Thereport is titled Benchmarking the Finance Function.
Following its tabling in Parliament, the report will be placed onthe Australian National Audit Office’s Homepage—http://www.anao.gov.au.
Yours sincerely
P. J. BarrettAuditor-General
The Honourable the President of the SenateThe Honourable the Speaker of the House of RepresentativesParliament HouseCanberra ACT
4 Benchmarking the Finance Function
AUDITING FOR AUSTRALIA
The Auditor-General is head of theAustralian National Audit Office. TheANAO assists the Auditor-General tocarry out his duties under the Auditor-General Act 1997 to undertake performanceaudits and financial statement audits ofCommonwealth public sector bodies andto provide independent reports and advicefor the Parliament, the Government andthe community. The aim is to improveCommonwealth public sectoradministration and accountability.
Auditor-General reports are available fromGovernment Info Shops. Recent titles areshown at the back of this report.
For further information contact:The Publications ManagerAustralian National Audit OfficeGPO Box 707Canberra ACT 2601
Telephone (02) 6203 7505Fax (02) 6203 7798Email [email protected]
ANAO audit reports and informationabout the ANAO are available at ourinternet address:
http://www.anao.gov.au
Audit TeamEdward Hay
Grace GuilfoyleHayley MacGregor

5
Contents
Summary, Key Findings and RecommendationSummary 9Key Findings and Recommendation 12
Benchmark Study Findings and Conclusions1. Introduction 17
2. Overall Finance Function Benchmark 23Introduction 23Cost Dimension Benchmarks 25Quality Dimension Benchmarks 27
3. Financial Budgeting and Analysis Activity Banchmarks 31Introduction 31Cost Dimension Benchmark 31Efficiency Dimension Benchmark 33Better Practice Benchmark 34Better Practice Observations 35
4. Fixed Assets Activity Benchmarks 37Introduction 37Cost Dimension Benchmarks 38Efficiency Dimension Benchmark 39Quality Dimension Benchmark 40Better Practices Observations 41
5. Accounts Payable Activity Benchmarks 45Introduction 45Cost Dimension Benchmarks 46Efficiency Dimension Benchmarks 49Quality Dimension Benchmark 50Conclusion 52
6. ‘Close the Books’ and Financial Reporting Activity Banchmarks 56Introduction 56Cost Dimension Benchmark 57Quality Dimension Benchmarks 58Conclusion 59Better Practice Observations 60
7. Accounts Receivable Activity Benchmarks 61Introduction 61Cost Dimension Benchmarks 62Efficiency Dimension Benchmark 64Quality Dimension Benchmarks 65Conclusion 68Better Practices Observations 68

6 Benchmarking the Finance Function
8. Payroll Activity Benchmarks 71Introduction 71Cost Dimension Benchmarks 72Efficiency Dimension Benchmark 73Quality Dimension Benchmark 74Conclusion 77Better Practice Observations 77
9. Travel Activity Benchmarks 80Introduction 80Cost Dimension Benchmarks 81Efficiency Dimension Benchmark 83Better Practice Benchmark 84Conclusion 85Better Practice Observations 86
10. Billing Activity Benchmarks 88Introduction 88Cost Dimension Benchmarks 88Quality Dimension Benchmarks 90Conclusion 93Better Practice Observations 93
11. Tax Activity Benchmarks 95Introduction 95Cost Dimension Benchmark 95Conclusion 96Better Practice Observations 97
AppendicesAppendix 1: Benchmark Demographic Profiles 101Appendix 2: Derivation of Finance Function Benchmarks 102Appendix 3: Finance Function Benchmarks 105
1. Overall Finance Function Benchmarks 1052. Financial Budgeting and Analysis 1073. Fixed Assets Activity Benchmarks 1084. Accounts Payable Activity Benchmarks 1105. ‘Close the Books’ and Financial Reporting 1126. Accounts Receivable Activity Benchmarks 1137. Payroll Activity Benchmarks 1158. Travel Activity Benchmarks 1179. Billing Activity Benchmarks 11810. Tax Activity Benchmarks 120
Appendix 4: Previous Audit Coverage 121
Index 124Series Titles 125Better Practice Guides 127
7
Summary, Key Findingsand Recommendations

8 Benchmarking the Finance Function

9
Summary
1. This Report on the public sector finance function is part of a seriesof benchmarking studies being undertaken by the Australian NationalAudit Office (ANAO) into common business processes. The ANAO hasrecently published a report detailing a benchmarking study of the internalaudit function.1 and is currently undertaking a study relating to the humanresource management function. The primary purpose of these studies isto obtain and report quantitative and qualitative data on aspects ofperformance of the function or business process. The benchmark studiesare undertaken as part of the ANAO’s Information Support Services whichare also an important element of providing assurance to stakeholders.
2. The objective of the finance function benchmarking study was toobtain, and report on over time, quantitative and qualitative data relatingto finance function activities as they operate in Commonwealthorganisations.2 This Report provides the results from the first year ofthe benchmarking study. This data can be utilised by all public sectororganisations to develop appropriate measures of performance for theirown finance function as part of continuous improvement programs orbusiness re-engineering.
3. While the emphasis of the ANAO benchmarking studies is to makeavailable public sector benchmarks for use as an organisationalimprovement tool, they also provide an opportunity for an across-the-board assessment of the Commonwealth public sector for particularfunctions. This assessment is based on a comparison of responses fromparticipating Commonwealth organisations (the Commonwealth Group)and data from an international group (the Global Group).
4. Commonwealth organisations can compare their own performanceagainst the benchmarks and use the information to detect and diagnoseareas of concern in business processes in terms of the dimensions of cost,efficiency and quality and highlight opportunities for improvement.
1 Australian National Audit Office, Audit Report No.14 of 2000–01, Benchmarking the Internal AuditFunction, October 2000.
2 In this Report organisations refers to agencies subject to the Financial Management andAccountability (FMA) Act 1997 and statutory authorities subject to the Commonwealth Authoritiesand Companies (CAC) Act 1997.

10 Benchmarking the Finance Function
5. The finance function benchmarking study examines aggregatedbenchmarking measures of cost, efficiency, quality and better practicereported by nineteen Commonwealth organisations for 1998–99 andprovides aggregated benchmarking results. The Commonwealth publicsector organisations participating in the benchmark study have beenprovided with a comprehensive report comparing their results with thoseof other organisations in the Commonwealth public sector group andwith the global population.
6. Ten of the Commonwealth Group organisations are covered bythe Financial Management and Accountability Act 1997 (FMA) and nine bythe Commonwealth Authorities and Companies Act 1997 (CAC).
7. The Global Group used as a comparator throughout this Reportis from the Arthur Andersen benchmarking database and comprises morethan 500 organisations. The largest proportion of these organisations(45 per cent) is in the United States of America and over 95 per cent arein the private sector. Further information on the Commonwealth andGlobal benchmarking Groups is at Appendix 1.
8. The ANAO study collected benchmarking data on the followingactivities:
• overall cost of the finance function (chapter 2);
• financial budgeting and analysis (chapter 3);
• fixed assets (chapter 4);
• accounts payable (chapter 5);
• ‘close the books’ and financial reporting (chapter 6);
• accounts receivable (chapter 7);
• payroll (chapter 8);
• travel (chapter 9);
• billing (chapter 10); and
• tax (chapter 11)
9. The results are limited in scope to the extent that data in thestudy has been derived from self-assessments. The results do not takeaccount of, or distinguish between, the different environments in whichfinance functions operate, such as the public and private sectors. As aresult, the benchmark study can only provide a broad indication ofdifferences in performance between the two Groups.
11
10. Although the report makes a number of comparisons betweenthe two Groups, it is important to note that results against each of thebenchmarks should not be assessed in isolation as this rarely providesinsight into how different outcomes have been achieved. Discoveringthe specific practices responsible for high performance, and adapting andapplying them within an organisation as a basis for process improvementis not the role of this study. Thus the Report does not provide reasonsfor differences in performance, however it does provide guidance onsome of the factors that organisations may wish to consider whenevaluating their results.
Summary

12 Benchmarking the Finance Function
Key Findings andRecommendation
11. This finance function benchmarking study indicates thatorganisations in the Commonwealth Group perform equal to or betterthan the Global Group at the median in relation to:
• quality in terms of lower activity error rates (accounts payable,accounts receivable and payroll);
• level of staffing in the finance function;
• making greater use of shared services;
• number of actual budgets;
• number of days between invoicing and receipt of payment;
• processing cost per pay, higher utilisation of direct deposit andintegrated/interfaced payroll/human resources systems;
• making greater use of reimbursement through payroll and directdeposit for travel payments; and
• some elements of activity cost (‘close the books’, accounts receivable,travel, billing and tax). It should be noted that the CommonwealthGroup perform these activities to a lesser extent than the Global Group.
12. The benchmarking study also indicates that opportunities mayexist in some organisations for progress to be made in areas where theCommonwealth Group reported less favourable results overall than theGlobal Group. The main areas included are those where, at the median,there were:
• higher costs for the finance function overall;
• higher activity costs overall (budgeting and analysis, fixed assets,accounts payable, payroll, travel, and tax);
• higher activity cost per transaction (fixed assets, accounts payable,travel and billing);
• lower efficiency (budgeting and analysis, fixed assets, accountspayable, accounts receivable, payroll and travel);
• shorter lengths of employee service and lower levels of qualificationsfor finance function staff; and
• higher error rates (‘close the books’ and billing).

13
13. As previously mentioned this benchmarking study involvesmaking various comparisons between quantitative and qualititative dataderived from the Commonwealth and Global Groups. The Report doesnot attempt to provide reasons for the results. The Report does howeverprovide guidance as to the type of factors which organisations couldconsider when evaluating their results.
14. The nature of this benchmarking study precludes detailedrecommendations-indeed, as discussed previously, that is not its primarypurpose. However, one broad recommendation, directed to allCommonwealth organisations, can be made.
15. The ANAO recommends that organisations compare their performanceagainst the benchmarks in this Report (and any other relevant benchmarks) inorder to assist in the identification and diagnosis of areas where improvementsmay be made in their business processes.
Key Findings

14 Benchmarking the Finance Function

15
Benchmark Study Findingsand Conclusions

16 Benchmarking the Finance Function

17
1 Introduction
Background to the benchmarking study1.1 The adoption of accrual budgeting and accounting as part of theon-going government reforms affecting the Commonwealth public sectorhas necessitated, amongst other things, the introduction of newinformation systems and enhanced management reporting by many publicsector organisations to meet the demands for better and more timelyinformation for decision making. Various reports by the ANAO havedrawn attention to the importance of having in place effective controlstructures to underpin the new budgeting and accounting framework3.
Introduction1.2 The ANAO has undertaken a benchmarking study in relation tothe finance function of public sector organisations. The study is basedon data from the 1998–99 financial year, the year prior to the introductionof accrual budgeting. The results can then provide a baseline fororganisations to assess their performance in the future. While recognisingaccrual budgeting will introduce some additional complexity toorganisational budgeting, it would be reasonable to expect the currentanalysis to be improved over time as organisations streamline and improvethe integrity of their processes.
1.3 This Report examines measures of cost, efficiency, quality andbetter practice across a range of activities undertaken as part of the financefunction by Commonwealth government organisations. It is part of aseries of benchmarking studies being undertaken by the ANAO intocommon business processes. The primary purpose of these studies is toobtain and report quantitative and qualitative data on aspects ofperformance of the function or business process.
3 Australian National Audit Office Audit Report No.52 of 1999–2000 Control Structures as Part of theAudits of Financial Statements of Major Commonwealth Agencies for the Period Ended30 June 2000 and Audit Report No.21 of 1999–2000 Audits of the Financial Statements ofCommonwealth Government Agencies for the Period Ended 30 June 1999.

18 Benchmarking the Finance Function
1.4 Comparison against benchmarks alone however, rarely providesinsight into how superior outcomes have been achieved. Discoveringthe specific practices responsible for high performance, and adapting andapplying them within an organisation provides as a basis for processimprovement is not the role of this study. Thus the Report does notprovide reasons for differences in performance. The Report doeshowever provide guidance as to some of the factors that organisationsmay wish to consider when evaluating their individual results. Whereappropriate better practice observations, drawn from ANAO betterpractice guides, the Arthur Andersen global benchmarking database andfrom Reengineering Australia, are made throughout this Report to assistorganisations in identifying opportunities for improvements.
1.5 Research from the private sector indicates that the operation of afinance function is regarded as expensive with significant scope forperformance improvement. Research further indicates that the financefunction in the private sector has been transformed over recent years,partly as a result of increasing cost pressures, but also in response to agrowing demand from the users of financial information for more value-added information to assist in their decision-making.
1.6 As illustrated in the following diagram, better practiceorganisations are re-focussing their financial management function froma traditional base, where processing of transactions predominated,towards a lower cost, business management role.
Trends in financial management
DecisionSupport
Control
Reporting
TransactionProcessing
DecisionSupport
Control
Reporting
Transaction Processing

19
Study objective1.7 The objective of the benchmarking study was to obtain, over time,quantitative and qualitative benchmarks for the finance function as itoperates in Commonwealth organisations.
1.8 While the emphasis of the ANAO benchmarking studies is to makeavailable public sector benchmarks for use as an organisationalimprovement tool, they also provide an opportunity for an across-the-board assessment of the Commonwealth public sector for particularfunctions. This assessment is based on a comparison of responses fromparticipating Commonwealth organisations and data from an internationalgroup.
Scope of the study1.9 This Report includes aggregated benchmarking results fromnineteen Commonwealth organisations (the ‘Commonwealth Group’) for1998–99. Ten of the Commonwealth Group organisations are covered bythe Financial Management and Accountability Act 1997 (FMA) and nine bythe Commonwealth Authorities and Companies Act 1997 (CAC).
1.10 Information relating to organisational expenditure, financefunction expenditure and the number of staff in the finance function areprovided for the Commonwealth Group below.
Total organisation Number of Finance function Number ofexpenditure organisations expenditure organisations
< $100 million 5 < $1 million 2
$100—$500 million 5 $1—$5 million 13
> $500 million 9 > $5 million 4
TOTAL 19 TOTAL 19
Staff in the finance Number ofsection organisations
< 10 1
11–25 9
26–50 4
>50 5
TOTAL 19
1.11 The total expenditure of the Commonwealth Group was$11.8 billion in 1998–99. The Commonwealth Group organisations allocatebetween 0.09 and 9.85 per cent of their total expenditure to the financefunction. Other activities performed by the finance area that were notcovered by the diagnostic instrument used to collect the data include
Introduction

20 Benchmarking the Finance Function
strategic management, financial policy development, treasury, cashmanagement, devolved banking and finance help desk.
1.12 In order to provide the public sector organisations withbenchmarking services, the ANAO formed a strategic alliance with ArthurAndersen enabling the ANAO to access diagnostic questionnaires, globalbenchmarks and information on better practices. Data processing andanalysis was conducted jointly by the ANAO, Reengineering Australiaand Arthur Andersen.
1.13 The Global Group used as a comparator throughout this Reportis from the Arthur Andersen benchmarking database and comprises morethan 500 organisations. The largest proportion of these organisations(45 per cent) are in the U.S. and over 95 per cent are in the private sector.Further information on the Commonwealth and Global benchmarkingGroups is at Appendix 1.
1.14 The observations in this Report are based on the informationprovided by the Commonwealth Group in response to a questionnaire.Consequently, the standard of evidence relied on for the study must beconsidered persuasive, rather than conclusive, based as it is on self-assessment by organisations. These self-assessments were subject toquality assurance checks by the ANAO, but have not been audited by theANAO. Thus the quality assurance processes undertaken by the ANAOon the data are not of themselves sufficient to guarantee its integrity.
1.15 In most organisations data was obtained for the ‘central’ financearea only. Moreover, the benchmark information cannot take account of,or distinguish between, the different environments in which financefunctions operate, for example as between the public and private sectors.As a result, the benchmark study can only provide an insight intodifferences in performance and may raise further questions forinvestigation.
Evaluation criteria1.16 The diagnostic questionnaires completed by each participatingorganisation capture a wide variety of information from which the ANAOdetermined a range of benchmarks across cost, efficiency and qualitydimensions. These benchmarks—listed at Appendix 2—have been usedas the evaluation criteria for this Report. In terms of the structure of thisReport, the benchmarks have been categorised by the finance functionoverall and then each particular finance activity (e.g. financial budgetingand analysis, fixed assets). Detailed results for each benchmark are atAppendix 3.
21
Beyond Bean Counting 20001.17 In August 2000, the Public Sector Centre of Excellence of CPAAustralia published Beyond Bean Counting 2000 a benchmark of effectivefinancial management in the Australian Public Sector4. The intention of thisreport was to obtain the perspective of Chief Executive Officers (CEO)and the Chief Finance Officers (CFO) on financial management progressin their organisations since the survey conducted as part of the firstBeyond Bean Counting report commissioned by the ManagementAdvisory Board in 19975. Some care needs to be taken in comparing theresults of the Beyond Bean Counting 2000 survey with the ANAObenchmark study because of the type of organisations that participatedin it. The Beyond Bean Counting 2000 survey included ACT, State andlocal government organisations and a private sector company and covered12 Commonwealth organisations and indicates:
• a widespread acceptance of the value of accrual information by CEOs;
• CEOs and CFOs are taking a more dominant role and accountabilityfor financial results;
• continuing strong demands for quality accounting and financeprofessionals;
• the emergence of revenue and profit/loss targets in the annual budgetin place of a focus only on expenditure;
• a significant change in the budgetary control function;
• the widespread use of integrated financial management systemsassisting the devolution of financial management authority to linemanagers; and
• a significant shift in the main focus of internal managementaccountability from individual budget line items (e.g. travel, salaries,etc) towards a focus on financial results (operating result, key ratios).
Introduction
4 Beyond Bean Counting 2000 A Benchmark of Effective Financial Management in the AustralianPublic Sector, Public Sector Centre of Excellence, CPA Australia, August 2000.
5 Beyond Bean Counting Effective Financial Management in the APS—1998 & Beyond, ManagementAdvisory Board, December 1997.

22 Benchmarking the Finance Function
1.18 The perspective of the surveyed CEOs and CFOs provides animportant insight into the current strategic and leadership trends inAustralian Public Sector (APS) financial management. The ANAObenchmark study provides more detailed information on benchmarksfor the cost, efficiency, quality and better practice of the individualactivities of the finance function. Taken together these reports providepublic sector managers with a wealth of information directed towardsimproving financial management in the APS and to improved financialdecision making. Where appropriate, reference has been made to theBeyond Bean Counting 2000 report in this benchmark study.
Previous audit coverage1.19 The ANAO has undertaken significant research into how betterpractice organisations, in both the private and public sectors, approachthe collection, analysis, production and use of financial information. Asummary of relevant previous audit coverage and better practice guidesis provided in Appendix 4.
1.20 This audit was conducted in conformance with ANAO auditingstandards and cost approximately $340 000.
23
2. Overall Finance FunctionBenchmark
Introduction2.1 The primary business objective of the finance function is to provideaccounting services and financial information in a low cost, accurate andtimely manner.
2.2 The finance function includes the following activities:
• financial budgeting and analysis;
• fixed assets;
• accounts payable;
• ‘close the books’ and financial reporting;
• accounts receivable;
• payroll;
• travel;
• billing; and
• tax.
2.3 This Report provides details of benchmarks relating to cost,efficiency, quality and better practice associated with the finance functionin accordance with the activity categories listed above.
2.4 Figure 1.1 shows the range of costs, and the median cost, spentby the Commonwealth Group on each finance activity. As shown inFigure 1.1, payroll and budgeting account for the majority of the financefunction cost in the Commonwealth Group with individual organisationpercentages for each process varying considerably.

24 Benchmarking the Finance Function
Quality
Figure 2.1Benchmarked Commonwealth Group Finance Activity Cost
60%
Budge
ting
Per
cent
age
of T
otal
Ann
ual
Fin
ance
Fun
ctio
n E
xpen
ditu
re
Fixed
Asset
s
Accou
nts
Payab
le
Close
the
Books
Accou
nts
Receiv
able
Payro
ll
Trave
l
Billing Tax
50%
40%
30%
20%
10%
0%
15.6%
3.3%
13.6%8.9%
3.6%
21.2%
3.5% 2.4% 1.0%
Formula Used: Total Annual Activity Cost/ Total Annual Finance Function Expenditure
2.5 On average, finance staff in the Commonwealth Group accountfor some 3.5 per cent of total staffing, with individual organisation’sstaffing ranging between 6.3 and 165 full time equivalents (FTEs).
2.6 The overall finance function benchmarks provide a broadindication of relative cost by measuring the proportion of organisationalexpenditure required to pay finance and accounting related costs6 andfinance function staffing as a proportion of total staffing. Benchmarksrelating to the average length of employee service in the finance functionwithin each organisation and finance employee education levels have beenused to provide a broad indication of quality of information. The financefunction benchmarks selected by the ANAO are summarised in Table 2.1.
Table 2.1 Overall Finance Function Benchmarks
Dimension Formula
Cost—Overall Total finance function expenditure/Total organisational expenditure
Cost—Staffing Total finance function staffing/Total organisational staffing
Efficiency No Benchmark7
Average length of employee service in the finance function of theorganisation
Finance staff education levels as a percentage of total financeemployees
Better practice Shared services utilisation by activity
6 Total costs include direct labour, contracted labour, operating expenses (excluding rent,depreciation, or allocated overhead expenses), service bureau fees, and data processing costsrelated to support (direct labour, operating expenses, and vendor software licensing andmaintenance costs).
7 No efficiency benchmarks are available for the overall finance function. However, the efficiencydimension is considered for most finance activities in subsequent chapters of this Report.

25
Cost Dimension Benchmarks2.7 The ANAO used two measures of cost of the total finance function.The first captures cost at a global level and expresses total finance functioncost as a percentage of total organisational expenditure8. The second costmeasure captures the total finance function staffing and expresses it as apercentage of the total organisational staffing.
2.8 Figure 2.2 shows that the Commonwealth Group allocates between0.09 and 9.85 per cent of total expenditure to the finance functioncompared with 0.11 and 4.83 per cent for the Global Group. The medianallocation for the Commonwealth Group is 25 per cent higher than thatof the Global Group.
Figure 2.2Finance Function Cost Benchmark—Overall Cost
Overall Finance Function Benchmark
Formula Used: Total Finance Function Expenditure / Total Organisational Expenditure
2.9 It should be noted that nine of the Commonwealth organisationshave some level of administered expenses included when determiningtotal expenditure. Therefore, by their nature, these organisations wouldspend a lower percentage of their total (departmental plus administered)expenditure on the finance function relative to the other Commonwealthorganisations and the Global Group who do not have an equivalent non-entity expenditure9.
2.10 Six of the nineteen Commonwealth Group reported overall costbenchmarks which place them within the Global Group’s least costquartile. Six of the remaining Commonwealth Group reportedbenchmarks that placed them within the Global Group’s highest costquartile.
Commonwealth Government
Per
cent
age
of T
otal
O
rgan
isat
ion
Exp
endi
ture
Global
Highest Cost 25%
Middle 50%
Lowest Cost 25%
10%
8%
6%
4%
2%
0%
Median1.270%
Median1.014%
8 Total organisational expenditure for this benchmarking study is the operating expenditure of theorganisation, including (where applicable) any administered budgets or expenditure.
9 Departmental expenditure is controlled by the organisation, whereas administered expenditure iscontrolled by the Government and managed or oversighted by the organisation on theGovernment’s behalf.
26 Benchmarking the Finance Function
2.11 Two of the Commonwealth Group exceeded the Global Grouphighest overall cost benchmark. These were two of the smallestorganisations within the Commonwealth Group, suggesting that theabsence of economies of scale could be an issue in this respect.
2.12 An evaluation of cost benchmarks is provided in the followingchapters of this Report for each of the activities that constitute part ofthe finance function. An estimate of potential expenditure reductions ismade in these chapters on the basis that those organisations in theCommonwealth Group with costs above the Group median are movedto the median level. The potential reductions total some $10.6 million,or 20.7 per cent of current expenditure on the benchmarked financeactivities.10
2.13 In relation to the second overall finance function cost measure asillustrated in Figure 2.3, finance function staffing in the CommonwealthGroup ranges between 0.72 and 12.38 per cent of total organisationalstaffing and from 0.17 and 13.33 per cent in the Global Group respectively.
Figure 2.3Finance Function Cost Benchmark—Staffing
Formula Used: Total Finance Function Staffing / Total Organisational Staffing
0%
2%
4%
6%
8%
10%
12%
14%
Commonwealth Government
Per
cent
age
of T
otal
Sta
ffing
Global
Highest Staffing 25%
Lowest Staffing 25%
Middle 50%
Median3.50%
Median3.75%
10 Potential expenditure reduction calculations were determined as follows. The CommonwealthGroup spent a total of $66.1 million on the finance function of which $51.3 million related to thebenchmarked activities. When an individual Commonwealth organisation spent more (inpercentage terms) on a benchmarked activity relative to the median of the CommonwealthGroup, the ANAO calculated the difference and applied it to their reported 1998–99 expenditurefor that activity. The difference between these two figures has been used to derive potentialsaving for each organisation. The total estimated expenditure reduction was calculated to be$10.6 million or 20.7 per cent of current expenditure on benchmarked activities. All of the potentialexpenditure reduction figures used throughout this Report have been calculated using the samemethod.

27
2.14 Seven of the Commonwealth Group reported staffing benchmarksplacing them in the lowest staff quartile of the Global Group with onlytwo reporting benchmarks placing them in the highest staffing quartileof the Global Group. The ANAO noted that the Commonwealth Grouporganisation reporting the lowest percentage of finance staff was alsothe largest of the organisations in the Commonwealth Group, suggestingpossible economy of scale benefits within the staffing of the function.
2.15 The results indicate that both the median and overall costbenchmark is higher in the Commonwealth Group than the Global Groupwhile the median and overall staffing is higher in the Global Group. Insubsequent chapters of this Report, the benchmarking analysis at theactivity level provides a more detailed view of relative performance.
Quality Dimension Benchmarks2.16 The first quality benchmark of the finance function overallmeasures the length of the employee service in the organisation’s financefunction as an indicator of stability and skill retention. As shown inFigure 2.4, the Global Group exhibits longer length of service, with themedian at eight years compared with five years for the CommonwealthGroup.
Figure 2.4Finance Function Quality Benchmark—Staff Retention
Overall Finance Function Benchmark
0
Commonwealth Government
Ave
rage
Len
ngth
of S
ervi
ce (
Yea
rs)
Global
Longest Service 25%
Middle 50%
Shortest Service 25%
5
10
15
20
25
Median8 yearsMedian
5 years
Formula Used: Average Length of Employee Service
2.17 This benchmark does not take into account the length of timestaff have spent in the finance areas of other organisations. Althoughrelevant to both groups, this could particularly effect the CommonwealthGroup where until recently many organisations had the same financemanagement systems and the same financial directions and regulations.
28 Benchmarking the Finance Function
2.18 The shorter average length of service for the CommonwealthGroup in comparison with the Global Group may manifest itself in someof the activity benchmarks in the following chapters.
2.19 The second overall benchmark which can provide a broadindication of quality relating to the finance function measures theeducational levels of finance employees—which can be a determinant ofthe roles these employees will fulfil within the organisation. Figure 2.5reveals that both staff and management in the Commonwealth Grouphave fewer qualifications than those in the Global Group. Seventy sixper cent of finance function staff and 35 per cent of finance functionmanagement within the Commonwealth Group do not have any of thespecified qualifications.
Figure 2.5Finance Function Quality Benchmark—Staff Qualifications
Formula Used: Finance Staff Education as a Percentage of Total Finance Staff
2.20 The effect of having different levels of staff with relevantqualifications within the organisations with the Commonwealth andGlobal Groups cannot be ascertained from these results. The ANAOnotes, however, that finance education levels and years of service shouldbe viewed as only two factors shaping the overall finance skill set. Otherfactors—such as types of education not considered by the qualificationsbenchmarking measure, employee training, and related workexperience—are relevant when evaluating the overall skill set of thefinance workforce.
Accounting Degree
CPA
MBA
CPA & MBA
None of Above
Percentage of Staff
0% 10% 20% 30% 40% 70%50% 60% 80%
Mgt - Commonwealth Government
Staff - Commonwealth Government
Mgt - Global
Staff - Global

29
2.21 The CPA Australia Report Beyond Bean Counting 2000, whichsurveyed some 12 Commonwealth organisations, reported that the numberof professionally qualified staff had increased over the past two years.The survey indicated that there has been a focus by the public sector torecruit and promote professionally qualified staff to financial managementpositions. Eighty two per cent of organisations surveyed have aprofessionally qualified accountant as their senior finance manager and95 per cent of CEOs rated their CFO’s skills as very good or excellent.Although there has been significant effort in training staff to operate inthe new environment, the CPA Australia survey results suggest that thistraining is not yet effective with significantly lower levels of satisfactionwith line managers’ financial management skills than in 1997.11
2.22 This suggests that, as mentioned above, that finance educationlevels are only one factor contributing to the overall skills and quality ofstaff involved in the finance function.
Better Practice Benchmark2.23 A benchmark used as an indicator of the adoption of generallyrecognised better practice is the utilisation of shared services within theorganisation. Shared services is a term that describes the consolidation,standardisation and reengineering of a support process into one or moreunits that serve the entire organisation. Better practice organisationsimplement a shared services strategy to:
• standardise work policies;
• employ and consolidate common systems;
• take advantage of economies of scale; and
• eliminate duplication of efforts
2.24 Figure 2.6 shows that the Commonwealth Group has aconsiderably higher shared services focus than the Global Group. Thismay be a consequence of the subsidiary company structure seen in manyprivate sector entities.
Overall Finance Function Benchmark
11 Op. cit, Beyond Bean Counting 2000 A Benchmark for Effective Financial Management in theAustralian Public Sector, p. 20.
30 Benchmarking the Finance Function
Figure 2.6Finance Function Efficiency Benchmark—Shared Services
Conclusion2.25 The benchmarking results indicate that the Commonwealthorganisations’ finance functions have a higher overall cost and loweroverall staffing than the Global Group. In addition, CommonwealthGroup staff exhibit shorter lengths of service in the finance function andhave fewer qualifications than their global counterparts. TheCommonwealth Group does however make greater use of shared serviceswhich is considered better practice.
Shared Services Utilisation
Commonwealth Government Global
Fixed Assets
Close the Books & Financial Reporting
Accounts Receivable
Billing
Payroll
Accounts Payable
Travel & Entertainment
0% 10% 20% 30% 40% 60% 70% 80% 90%50%
27.61%78.95%
23.67%52.63%
26.23%
19.92%36.84%
63.16%
26.23%52.63%
29.38%84.21%
26.63%73.68%
31
3. Financial Budgeting andAnalysis Activity Benchmarks
Introduction3.1 A budget is a systematic method of allocating financial, physicaland human resources in order to monitor progress toward organisationalgoals, help control spending and predict cash flow12. A primary businessobjective of financial budgeting and analysis is to effectively allocateresources among various activities and monitor the use of those resources.
3.2 Financial budgeting and analysis is, with payroll, one of the mostsignificant of the Commonwealth Group financial activities. It accountsfor a median 15.6 per cent of the total finance operating budget in theCommonwealth Group. Financial budgeting and analysis staff in theCommonwealth Group account for a median 12.2 per cent of the totalfinance function staffing, ranging between 0.65 and 27.32 FTEs inindividual organisations.
3.3 The cost, efficiency and better practice benchmarks selected bythe ANAO for the financial budgeting and analysis activity are set out inTable 3.1.
Table 3.1Budgeting and Analysis Activity Benchmarks
Dimension Formula
Cost—Overall Total budgeting and analysis activity cost / Total organisationalexpenditure
Efficiency Total elapsed days to prepare budget
Better Practice Total number of budgets developed annually
Cost Dimension Benchmark3.4 The cost benchmark captures the cost of budgeting and analysisat a global level and expresses this as a percentage of total organisationalexpenditure.
12 The public sector is required to prepare budget documents for the Parliament, including forAdditional Estimates as well as for internal management purposes. In contrast the private sectorprepares budgets for internal purposes only.
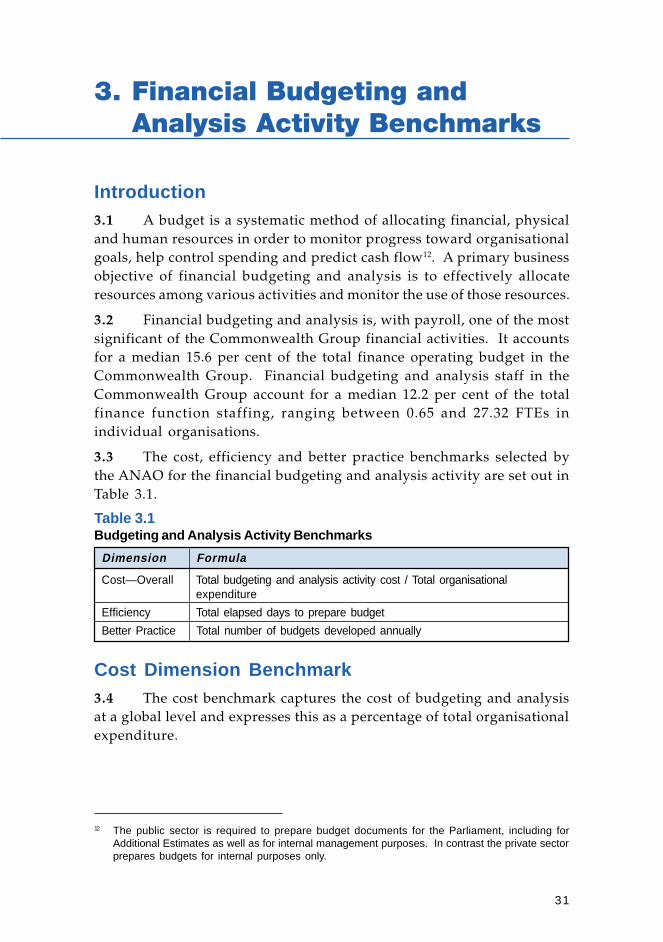
32 Benchmarking the Finance Function
3.5 As shown in Figure 3.1, the Commonwealth Group allocatesbetween 0.019 and 1.739 per cent of total organisational expenditure tofinancial budgeting and analysis activity, with the lowest cost quartileranging between 0.019 and 0.061 per cent. In comparison, the GlobalGroup allocates between 0.004 and 0.941 per cent of total organisationexpenditure. However, the highest result in Commonwealth Group rangeis significantly greater than the rest of the Commonwealth Group. Ifthis result is removed, the Commonwealth Group range becomes 0.019to 0.502 per cent, which is on par with the Global Group.
Figure 3.1Budgeting and Analysis Activity Cost Benchmark—Overall Cost
Formula Used: Total Budgeting and Analysis Activity Cost / Total Organisational Expenditure
3.6 At the median the Commonwealth Group spends some 50 percent more on budgeting and analysis than the Global Group. Therelatively high cost of budgeting and analysis in the CommonwealthGroup may be a reflection of a more complex budgeting process whichincludes, for example:
• involvement of other agencies and Ministers in the budgeting process;and
• high levels of transparency required by government and parliamentaryaccountability frameworks.
3.7 However, the benchmark data suggests a potential forimprovement in cost-efficiency. If the budgeting and analysis costs ofthe finance function activity of those organisations in the CommonwealthGroup above the Group median were reduced only to the median level,then expenditure reductions of some $3.4 million (29 per cent) wouldresult. The introduction of accrual budgeting with effect from 1 July 1999,the year after the benchmarking data was collected, may add further toCommonwealth budgeting costs.
0.0%
0.2%
0.4%
0.6%
0.8%
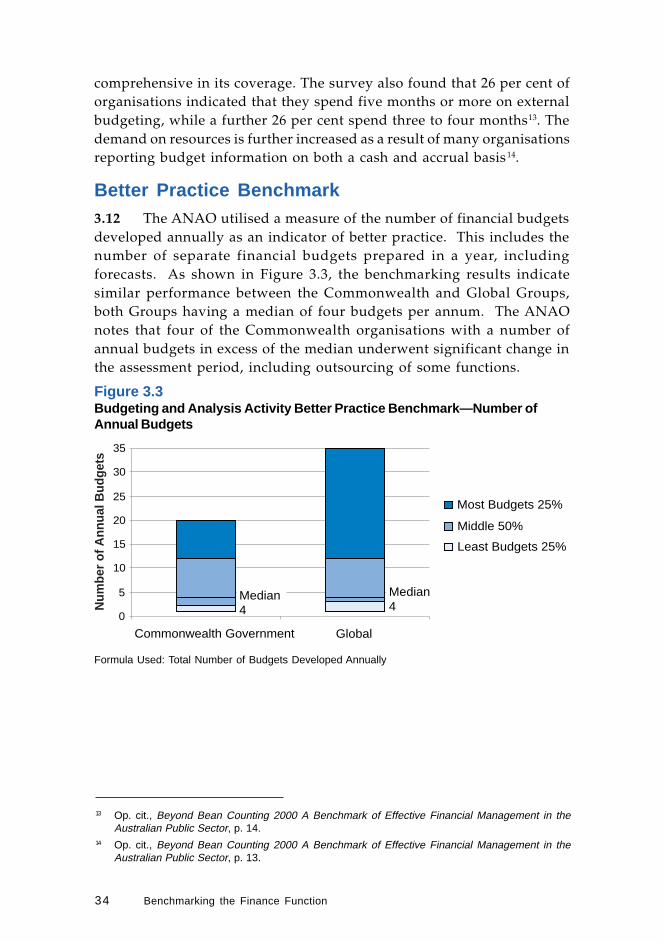
1.0%
1.2%
1.4%
1.6%
1.8%
Per
cent
age
of T
otal
Org
anis
atio
n E
xpen
ditu
re
Commonwealth Government Global
Higest Cost 25%
Middle 50%
Lowest Cost 25%
Median0.106%
Median0.158%

33
3.8 The difference in performance against cost benchmarks may be areflection of the significant nature of the financial budgeting and analysisactivity and the high levels of transparency required as part of the budgetprocess and accountability framework within government.
Efficiency Dimension Benchmark3.9 The ANAO selected the efficiency measure of the cycle time toprepare the budget. This measure illustrates the average elapsed time(in calendar days) to prepare the annual budget, from the release of thepreparation materials to the final budget approval. The benchmarkingresults, showing a median budget cycle time of 90 days for theCommonwealth Group, compared with 60 days for the Global Group,are set out in Figure 3.2.
Figure 3.2Budgeting and Analysis Activity Efficiency Benchmark—Budget Cycle Time
Financial Budgeting and Analysis Activity Benchmarks
Formula Used: Total Elapsed Days to Prepare Budget
3.10 With cycle times ranging between 14 and 270 days, theCommonwealth Group takes longer than the Global Group to preparebudgets—the cycle time is 50 per cent greater at the median. The ANAOnotes that public sector accountability arrangements may result in morebudgeting review, refinement and approval processes than in thepredominantly private sector Global Group, giving rise to the potentialfor longer cycle times.
3.11 The ASCPA survey found that the demands of the budgetingprocess are increasingly being seen as a drain on an organisation’sresources and a constraint on its ability to react quickly to changingcircumstances. There is a growing trend among private sectororganisations towards reducing the impact of the budget on corporateactivities, while in government the budget is becoming more
Ela
psed
Day
s T
o P
repa
re B
udge
t
Longest Cycle Time 25%
Middle 50%
Shortest Cycle Time 25%
CommonwealthGovernment
Global
300
250
200
150
100
50
0
Median90 Days Median
60 Days
34 Benchmarking the Finance Function
comprehensive in its coverage. The survey also found that 26 per cent oforganisations indicated that they spend five months or more on externalbudgeting, while a further 26 per cent spend three to four months13. Thedemand on resources is further increased as a result of many organisationsreporting budget information on both a cash and accrual basis14.
Better Practice Benchmark3.12 The ANAO utilised a measure of the number of financial budgetsdeveloped annually as an indicator of better practice. This includes thenumber of separate financial budgets prepared in a year, includingforecasts. As shown in Figure 3.3, the benchmarking results indicatesimilar performance between the Commonwealth and Global Groups,both Groups having a median of four budgets per annum. The ANAOnotes that four of the Commonwealth organisations with a number ofannual budgets in excess of the median underwent significant change inthe assessment period, including outsourcing of some functions.
Figure 3.3Budgeting and Analysis Activity Better Practice Benchmark—Number ofAnnual Budgets
13 Op. cit., Beyond Bean Counting 2000 A Benchmark of Effective Financial Management in theAustralian Public Sector, p. 14.
14 Op. cit., Beyond Bean Counting 2000 A Benchmark of Effective Financial Management in theAustralian Public Sector, p. 13.
Formula Used: Total Number of Budgets Developed Annually
0
5
10
15
20
25
30
35
Num
ber o
f Ann
ual B
udge
ts
Commonwealth Government Global
Most Budgets 25%
Middle 50%
Least Budgets 25%
Median4
Median4

35
Conclusion3.13 The benchmarking results indicate that the Commonwealth Groupspends more on budgeting and analysis activity component of the financefunction and, at the median, takes longer to prepare budgets relative tothe Global Group. Overall the Commonwealth Group develops a lowernumber of budgets annually but at the median has the same result as theGlobal Group.
Better Practice Observations 15
3.14 The following paragraphs outline some of the better practices thathave been adopted by organisations to deliver overall improvement inthe efficiency and effectiveness of the financial budgeting and analysisactivity.
3.15 Budgets should link to strategic and tactical planning, aligningthe budgeting process with the strategic direction of the organisationand enabling managers to understand how their day to day efforts movethe organisation toward its goals, leading to better coordination of tactics,better feedback about obstacles and opportunities and, ultimately, betterperformance.
3.16 To develop a strong link between budget development andcorporate strategy, better practice organisations take a series of steps,including:
• clearly defining the strategic goals before budgeting begins;
• establishing and fostering formal and informal channels ofcommunication;
• improving procedures and information systems; and
• providing training for budget developers and other employees so thatthey recognise how their efforts affect the organisational strategy.
3.17 Large organisations often use budget modelling systems, linkingcost management approaches and other data sources with budgeting.This improves the quality of information available for managers’ use indeveloping budgets and consequently the depth, accuracy and speed ofthe process.
Financial Budgeting and Analysis Activity Benchmarks
15 Arthur Andersen Global Best Practices® KnowledgeBase and Reengineering Australia.

36 Benchmarking the Finance Function
3.18 Budget preparation performance can be further improved by:
• implementing or improving standardisation of budget guidelines;
• reviewing the appropriate level of detail in budget preparation;
• improving allocation issue resolution procedures and timeframes; and
• reducing the number of budget centres and levels of decentralisedauthority.
3.19 Budgets should be developed to accommodate change, forexample by including materiality levels for budget revisions. This enablesbusiness units to respond to changing conditions and can obviate theneed to overstate their budgets to cover unforeseen developments.
37
4 Fixed Assets ActivityBenchmarks
Introduction4.1 Fixed assets are physical resources used for production of anorganisation’s goods and services. They are long-term in nature andusually subject to depreciation. Such assets include equipment (machinery,furniture, tools), building structures (offices, factories, warehouses) andland.
4.2 Accurate and timely acquisition, tracking, maintenance anddisposal of fixed assets are aims of asset management. This entailsrecording, adding, updating, depreciating and disposing of fixed assetsin the accounting records in a timely and accurate manner.
4.3 The fixed assets activity in the Commonwealth Group accountsfor a median 3.3 per cent of the total finance operating budget. At median,fixed assets staff in the Commonwealth Group accounts for 2.86 per centof the total finance function staffing, with staffing in individualorganisations ranging between 0.08 and 16.75 FTEs.
4.4 The cost, efficiency, quality and better practice benchmarksselected by the ANAO for the fixed assets activity are set out in Table 4.1.
Table 4.1Fixed Assets Activity Benchmarks
Dimension Formula
Cost—Overall Total fixed assets activity cost / Total organisationalexpenditure
Cost—Per Activity Total fixed assets activity cost / Annual number of fixed assetstransactions
Efficiency—Per Resource Total number of fixed assets tracked / Total fixed assets fulltime equivalent
Quality Percentage of fixed assets that are misallocated ormisclassified
Better Practice Capitalisation threshold for fixed assets

38 Benchmarking the Finance Function
Cost Dimension Benchmarks4.5 The ANAO used two measures of cost related to fixed assetaccounting. The first captures fixed assets cost at a global level andexpresses this as a percentage of total organisational expenditure. Thesecond fixed assets cost benchmark measures costs per transaction.
4.6 As shown in Figure 4.1, the Commonwealth Group allocatesbetween 0.003 and 0.167 per cent of total organisational expenditure tofixed assets activity, with the lowest cost quartile ranging between 0.003and 0.018 per cent. In comparison, the Global Group allocates between0.001 and 0.146 per cent of total organisational expenditure to fixed assetsactivity.
Figure 4.1Fixed Assets Activity Cost Benchmark—Overall Cost
Formula Used: Total Fixed Assets Activity Cost / Total Organisational Expenditure
4.7 The Commonwealth Group total fixed assets activity cost, at themedian, is twice that of the Global Group. Two of the CommonwealthGroup have benchmarks which place them within the lowest cost quartileof the Global Group and eleven of the remaining organisations are withinthe Global Group’s highest cost quartile.
4.8 If the fixed assets activity costs component of the finance functionof those organisations in the Commonwealth Group above the Groupmedian were reduced to the median level, then expenditure reduction ofsome 31 per cent could result.
4.9 The second fixed assets cost benchmark measures costs pertransaction. The benchmarking results—which show the CommonwealthGroup’s median cost per transaction as $46, compared with the GlobalGroup’s $40—are illustrated in Figure 4.2.
0.00%
0.02%
0.04%
0.06%
0.08%
0.10%
0.12%
0.14%
0.16%
0.18%
Per
cent
age
of T
otal
Org
anis
atio
nal E
xpen
ditu
re
Highest Cost 25%
Lowest Cost 25%
Middle 50%
Commonwealth Government Global
Median0.040% Median
0.020%

39
Figure 4.2Fixed Assets Activity Cost Benchmark—Cost / Fixed Asset Transaction
Fixed Assets Activity Benchmarks
Formula Used: Total Fixed Assets Activity Cost / Annual Number of Fixed Assets Transactions
4.10 Although there is a higher median cost per fixed asset transactionin the Commonwealth Group, four of the Commonwealth Group havecost per activity benchmarks which place them within the lowest costquartile of the Global Group. Only three of the Commonwealth Groupare placed within the highest cost per activity quartile of the Global Group.It should also be noted that the highest result in the CommonwealthGroup ($1464) was substantially higher than the rest of the group whichadversely affects the result of the Commonwealth Group. The next highestcost per fixed asset transaction was $310, which is lower than the worstresult in the Global Group ($487).
4.11 The ANAO notes that the four of the Commonwealth Group withbenchmarks within the lowest cost per activity quartile of the GlobalGroup were all placed within the Global Group highest overall costquartile. This could indicate that these organisations are relatively capitalintensive, or that they are processing more assets transactions than theirGlobal Group counterparts.
Efficiency Dimension Benchmark4.12 The ANAO selected the benchmark of annual volume of fixedassets tracked per full-time equivalent (FTE) which provides a measureof employee output and productivity and can be used as a broad indicatorof efficiency. The benchmarking results are summarised in Figure 4.3,which shows a median efficiency level in the Global Group 2.4 times thatof the Commonwealth Group.
$-
$250
$500
$750
$1,000
$1,250
$1,500
Cos
t / F
ixed
Ass
ets
Tra
nsac
tion
Highest Cost 25%
Middle 50%
Lowest Cost 25%
Commonwealth Government Global
Median$40
Median$46
40 Benchmarking the Finance Function
0
10,000
20,000
30,000
40,000
50,000
Fix
ed A
sset
s T
rack
ed /
FT
E
Middle 50%
Most Efficient 25%
Least Efficient 25%
Commonwealth Government
Global
Median8353
Median3502
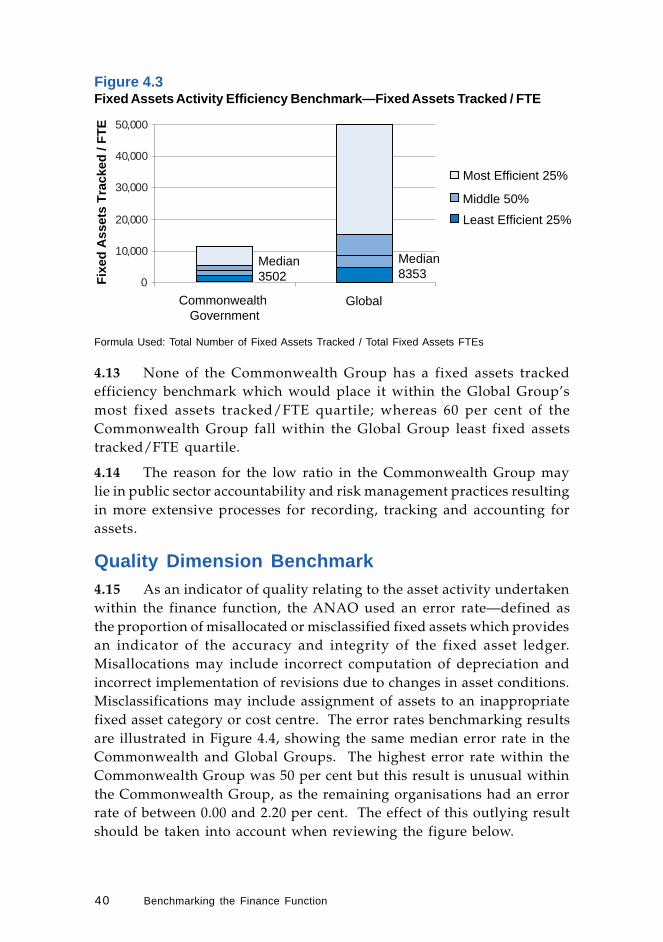
Figure 4.3Fixed Assets Activity Efficiency Benchmark—Fixed Assets Tracked / FTE
Formula Used: Total Number of Fixed Assets Tracked / Total Fixed Assets FTEs
4.13 None of the Commonwealth Group has a fixed assets trackedefficiency benchmark which would place it within the Global Group’smost fixed assets tracked/FTE quartile; whereas 60 per cent of theCommonwealth Group fall within the Global Group least fixed assetstracked/FTE quartile.
4.14 The reason for the low ratio in the Commonwealth Group maylie in public sector accountability and risk management practices resultingin more extensive processes for recording, tracking and accounting forassets.
Quality Dimension Benchmark4.15 As an indicator of quality relating to the asset activity undertakenwithin the finance function, the ANAO used an error rate—defined asthe proportion of misallocated or misclassified fixed assets which providesan indicator of the accuracy and integrity of the fixed asset ledger.Misallocations may include incorrect computation of depreciation andincorrect implementation of revisions due to changes in asset conditions.Misclassifications may include assignment of assets to an inappropriatefixed asset category or cost centre. The error rates benchmarking resultsare illustrated in Figure 4.4, showing the same median error rate in theCommonwealth and Global Groups. The highest error rate within theCommonwealth Group was 50 per cent but this result is unusual withinthe Commonwealth Group, as the remaining organisations had an errorrate of between 0.00 and 2.20 per cent. The effect of this outlying resultshould be taken into account when reviewing the figure below.

41
Figure 4.4Fixed Assets Activity Quality Benchmark—Error Rates
Fixed Assets Activity Benchmarks
Formula Used: Percentage of Fixed Assets Misallocated or Misclassified
4.16 Three of the Commonwealth Group have benchmarks whichwould place them within the Global Group least errors quartile. TheANAO notes that these particular organisations also have a relativelyhigh cost per fixed assets transaction. Individual organisations need toconsider the appropriate risk management profile to minimise costs whilekeeping error rates within acceptable limits.
Better Practice Benchmark4.17 The ANAO also benchmarked the value at which assets arecapitalised within the organisations within the two Groups. The assetcapitalisation threshold is a monetary reporting threshold thatorganisations establish in order to reduce the number of assets reportedin the financial statements to only those which are significant in value.Generally the threshold is set to ensure that at least 95% of the totalvalue of non-current assets is reported in the financial statements. Theestablishment of such a threshold is an attempt to weigh the cost ofgathering data against its usefulness or significance to the readers of thefinancial statements. The asset capitalisation threshold does not relateto whether organisations need to record the existence of assets. This isan asset management decision based on the importance of the asset orgroup of assets to an organisation and accountability criteria.
4.18 The benchmarking results are shown in Figure 4.5, with mediancapitalisation thresholds of $2000 and $1628 in the Commonwealth andGlobal Groups.
0%5%
10%15%20%25%
30%35%40%
45%50%
Commonwealth Government
Global
Most Errors 25%
Middle 50%
Least Errors 25%
Per
cent
age
of F
ixed
Ass
ets
Mis
clas
sifie
d or
Mis
allo
cate
d
Median1.00%
Median1.00%

42 Benchmarking the Finance Function
Figure 4.5Fixed Assets Activity Better Practice Benchmark—Capitalisation Threshold
Formula Used: Capitalisation Threshold for Fixed Assets
4.19 In almost all of the Commonwealth Group, the minimumcapitalisation threshold is set at $2000, somewhat below the Global Grouphighest threshold quartile which ranges between $4071 and $16 284, butabove the Global median. The ANAO notes that an asset capitalisationthreshold of $2000 had been mandatory for the majority ofCommonwealth public sector organisations until recently.
Conclusion4.20 The Commonwealth Group overall fixed assets activity costs morewhen compared with the Global Group and the Global Group performedbetter on the selected efficiency benchmark. Quality as measured byreported error rates was equal at the median.
4.21 Accountability requirements, risk management practices and useof technology or other means to enhance process efficiency may beappropriate areas for consideration by organisations wishing toinvestigate differences in the benchmark results.
Better Practice Observations 16
4.22 The ANAO has undertaken two recent audits of assetmanagement: the first—in 1995–9617—was followed up in 1997–9818. Inconjunction with the 1995–96 Audit Report the ANAO produced an Asset
$0
$2,000
$4,000
$6,000
$8,000
$10,000
$12,000
$14,000
$16,000
$18,000
Commonwealth Government
Cap
italis
atio
n T
hres
hold
Global
Highest Threshold 25%
Lowest Threshold 25%
Middle 50%
Median$2000
Median$1628
16 Australian National Audit Office Audit Report No.27 of 1995–96 Asset Management, AustralianNational Audit Office Audit Report No.41 of 1997–98, Asset Management and Arthur AndersenGlobal Best Practices® KnowledgeBase.
17 Australian National Audit Office Audit Report No. 27 of 1995–96 Asset Management.18 Australian National Audit Office Audit Report No. 41 of 1997–98 Asset Management.
43
Management Better Practice Guide19 and the Asset ManagementHandbook20 which was designed to assist managers interpret andimplement the assets management principles developed in the Report.In the 1997–98 Report the ANAO noted that, while there had beensignificant acceptance by public sector organisations of therecommendations of Audit Report No.27, 1995–96, many organisationsreviewed had not fully adopted a strategic assets management approachto maximise performance and accountability for outputs and outcomes.
4.23 The following paragraphs outline some of the better practices thathave been adopted by organisations to deliver overall improvement inthe efficiency and effectiveness of the fixed assets activity.
Principles4.24 Five principles which underpin better practice asset managementare:
• Integrated Planning—Asset management decisions are integrated withstrategic planning. This is achieved by establishing clear links betweenassets, corporate objectives and program or service delivery standards.
• Acquisition Planning—Asset planning decisions are based on anevaluation of alternatives to ownership, including non-asset solutionsand demand management. The evaluations should include acomparison of life-cycle costs, benefits and risks.
• Accountability—An effective framework is established to identifythose responsible for assets. In particular, the framework shouldinclude mechanisms which establish accountability for asset condition,use and performance.
• Disposal Planning—A framework for the disposal process should bein place. In particular, disposal decisions should be based on an analysisof the methods which achieve the best net return; and disposalperformance should be monitored for effectiveness.
• Control Framework—An effective internal control structure isestablished for asset management, including asset policies andprocedures and use of appropriate information systems.
Fixed Assets Activity Benchmarks
19 Australian National Audit Office Asset Management Better Practice Guide June 1996.20 Australian National Audit Office Asset Management Handbook June 1996.

44 Benchmarking the Finance Function
Technology4.25 Integration of the fixed asset system with the human resourcemanagement information system allows the tracking of employeepossession of attractive and portable items.
4.26 Integration of the asset register with the purchasing, capitalplanning, preventative maintenance, accounts payable (to captureacquisitions) and general ledger (to validate cost centre coding) systemseliminates potential for errors, duplicate data entry and processing.
4.27 Electronic marking (bar codes or electronic markers) and scanningcan enhance the efficiency of identifying the inventory and location ofassets.
Policies4.28 Raising the capitalisation threshold (in accordance withorganisational accounting, risk management and the businessrequirements) can decrease the total number of fixed assets that have tobe recorded and tracked.
4.29 Establishment of standards and policies maintenance of fixedassets, including preventative maintenance, can result in reducedequipment failure, reduced costs and increased utilisation.

45
5. Accounts Payable ActivityBenchmarks
Introduction5.1 For most organisations, accounts payable is a linear process thatbegins with receiving an invoice and ends with issuing payment to thesupplier. Organisations generally follow a standard set of activities forprocessing an invoice for payment, including:
• receiving the invoice via mail, fax, e-mail or electronic data interchange(EDI);
• categorising the invoice, entering it into a system, and scheduling itfor further processing;
• reviewing the invoice for authenticity and arithmetic accuracy;
• documenting the invoice by attaching receiving paperwork and thepurchase order;
• obtaining the required approval to pay the invoice;
• scheduling the invoice for payment, taking into consideration theorganisation’s priorities for payment, the invoice due date and possibleprompt-payment discounts; and
• on the appropriate day, paying the invoice via cheque or electronicmeans and notifying the supplier of payment.
5.2 Additional tasks include responding to inquiries from suppliersand others within the organisation; resolving payment issues and disputes;keeping the master file of suppliers up-to-date; and managing accountingpolicies that affect supplier relationships and cash management.
5.3 The increasing use of ‘electronic commerce’ (e-commerce) willchange the payment processes employed by organisations. E-commerceis regarded as the execution of business transactions using electroniccommunications networks and is used by organisations to streamlinebusiness processes.
5.4 Next to payroll and budgeting, accounts payable is one of themore significant activities conducted within the finance function activityarea of the Commonwealth Group, accounting for a median 13.6 per centof the total finance budget.
5.5 In the Commonwealth Group, the median accounts payableprocessing staff is 14.45 per cent of the total finance function staffing,with individual organisation staffing ranging between 1 and 32 FTEs.

46 Benchmarking the Finance Function
5.6 The quality of design of the accounts payable process—and howwell the process is executed—has an impact on two areas important tothe organisation: supplier relationships and cash flow. The primarybusiness objective of accounts payable is to be an efficient, low-costcontributor to the “obtain materials and supplies” process. This can beaccomplished by making timely and accurate payments for goods andservices purchased and thereby optimising cash flow through effectivemanagement of disbursements, credit terms and discounts.
5.7 The accounts payable benchmarks selected by the ANAO addressdimensions of cost, efficiency, quality and better practice as set out inTable 5.1.
Table 5.1Accounts Payable Activity Benchmarks
Dimension Formula
Cost—Overall Total accounts payable activity cost / Total organisationalexpenditure
Cost—Per Activity Total accounts payable cost / Number of annual invoices
Efficiency—Per Resource Total accounts payable invoices / Total accounts payable FTEs
Efficiency—Size Total accounts payable payments / Number of invoicesprocessed
Quality—Error Rate Total accounts payable errors / Number of invoices processed
Better Practice Total number of active vendors to organisation
Cost Dimension Benchmarks5.8 The ANAO selected two benchmarks to gain an indication of thecost of the accounts payable activity within the finance function. Thefirst captures the accounts payable cost at a global level and expresses itas a percentage of total organisational expenditure, and is illustrated inFigure 5.1. The Commonwealth Group allocates between 0.007 and0.870 per cent of their total organisational expenditure on their accountspayable activity, with the lowest cost quartile ranging between 0.007 and0.080 per cent. These results indicate a higher proportion of expenditureby the Commonwealth Group than the Global Group, with the GlobalGroup benchmarks ranging between 0.005 and 0.350 per cent of totalorganisational expenditure.

47
0.00%
0.15%
0.30%
0.45%
0.60%
0.75%
0.90%
Highest Cost 25%
Middle 50%
Lowest Cost 25%
Commonwealth Government Global
Per
cent
age
of T
otal
Org
anis
atio
n E
xpen
ditu
re
Median0.164% Median
0.120%
Figure 5.1Accounts Payable Activity Cost Benchmark—Overall Cost
Accounts Payable Activity Benchmarks
Formula Used: Total Accounts Payable Activity Cost / Total Organisational Expenditure
5.9 Although four of the Commonwealth Group are in the lowestcost quartile of the Global Group, nine are placed within the Global Grouphighest cost quartile. At the median, organisations in the CommonwealthGroup are spending 37 per cent more on the accounts payable activitythan the Global Group.
5.10 The ANAO notes that higher than normal costs may have beenincurred by some of the Commonwealth Group because of theimplementation of new information technology systems during thebenchmark survey year. The benchmark data highlights that there maybe opportunities to investigate reasons for the differences and possiblyreduce cost. If the accounts payable cost component of the financefunction of those organisations in the Commonwealth Group above theGroup median was reduced to the median level, then expenditurereductions of some $1.3 million (15 per cent) would result.
5.11 The second cost dimension benchmark utilised by ANAOmeasures the accounts payable activity cost per invoice processed. Asdisplayed in Figure 5.2, none of the Commonwealth Group are in thelowest cost quartile of the Global Group. At the median, theCommonwealth Group processing cost per invoice is 72 per cent higherthan the Global Group.

48 Benchmarking the Finance Function
Formula Used: Total Accounts Payable Activity Cost / Number of Annual Invoices
5.12 A contributing factor to the higher accounts payable cost in theCommonwealth Group may be that the Commonwealth Group undertakesmore extensive checking to detect errors before payments are processed.The lower error rates in the Commonwealth Group are reviewed later inthis chapter.
5.13 The ANAO notes that previous ANAO audit reports determineda benchmark for Commonwealth agencies relating to cost per invoiceprocessed (for direct labour cost only) at $10 in 198721 and $11 in 199622.Adjusted for inflation the figures at 30 June 1999 are $14.64 and $11.62respectively23. The data from this benchmarking exercise indicates a figureof $14.54 (30 June 1999) for the direct labour cost component of cost perinvoice processed.
$0
$20
$40
$60
$80
$100
$120
Cos
t / A
ccou
nts
Pay
able
Invo
ice
Highest Cost 25%
Middle 50%
Lowest Cost 25%
Commonwealth Government Global
Median$18.88 Median
$10.99
21 Department of Finance, 1987, Efficiency Scrutiny on Processing of Accounts—A Report for theMinister of Finance.
22 Australian National Audit Office Audit Report No.16 of 1996–97 Payment of Accounts.23 Figures have been adjusted using the “General Government Final Consumption Expenditure—
Other” price index from the Australian Bureau of Statistics publication Australian System ofNational Accounts (ABS Catalogue No. 5204.0). The 1987 figure was calculated as follows:$10/68.3 * 100 = $14.64 and the 1996 figure was calculated as: $11/94.6 * 100 = $11.62.
Figure 5.2Accounts Payable Activity Cost Benchmark—Cost / Invoice

49
Accounts Payable Activity Benchmarks
0
10,000
20,000
30,000
40,000
50,000
Invo
ices
Pro
cess
ed /
Acc
ount
s P
ayab
le F
TE
Commonwealth Government Global
Most Efficent 25%
Middle 50%
Least Efficent 25%
Median7412Median
3667
Efficiency Dimension Benchmarks5.14 The ANAO used two benchmarks to provide a broad indicator ofefficiency for the accounts payable activity. The first measures the numberof accounts payable invoices processed per FTE, providing a reflectionof employee output and productivity. The results are provided in Figure5.3. The second accounts payable efficiency benchmark used by the ANAOmeasures the average accounts payable payment size. These results arepresented in Figure 5.4.
5.15 In Figure 5.3, only one of the Commonwealth Group has a numberof invoices per accounts payable/FTE ratio which places it in the mostefficient quartile of the Global Group. Seventy five per cent of theorganisations in the Commonwealth Group have ratios that place themwithin the least efficient quartile of the Global Group.
Figure 5.3Accounts Payable Activity Efficiency Benchmark—Processed Invoices / FTE
Formula Used: Total Accounts Payable Invoices / Total Accounts Payable FTEs
5.16 The ANAO notes that the relatively high cost may also beattributed, in part, to more thorough checking of invoices resulting inlower error rates. In this (and all other activities), organisations need toconsider the balance of cost, efficiency and quality dimensions.
5.17 The second accounts payable efficiency benchmark used by theANAO measures the average accounts payable payment size. Optimisingthe size of individual payments—for example by rationalising the numberof vendors or consolidating a number of invoices into one payment—canlead to more efficient accounts payable processes through reducedtransaction volumes and costs. As illustrated in Figure 5.4, theCommonwealth Group has a substantially smaller average payment sizeprofile than the Global Group.

50 Benchmarking the Finance Function
Formula Used: Total Accounts Payable Payments / Number of Invoices Processed
Quality Dimension Benchmark5.18 The ANAO used a measure of the total number of errors as apercentage of total accounts processed to supplement the accounts payablecost and efficiency benchmarks.
5.19 Accounts payable errors include incoming voucher errors, voucherprocessing errors and cheque errors. Incoming voucher errors relate tothe completeness, accuracy and proper authorisation of vouchers. Thisincludes missing documentation, lack of required approvals, missing orinaccurate information (eg. account coding) or discrepancies ininformation between various documents. Voucher processing errors areerrors rejected by the accounts payable system in relation to the validityof account distribution coding, vendor account numbers etc. Chequeerrors are errors related to the production and dissemination ofpayments.
5.20 The error rates benchmark indicates (as illustrated in Figure 5.5)that, while the accounts payable costs of the Commonwealth Group maybe relatively high in comparison with the Global Group, the quality ofthe outcomes in respect of error rates is better. Seven of theCommonwealth Group have error rates within the best quartile of theGlobal Group, and none of the Commonwealth Group are ranked nextto the Global Group highest error rates quartile. The median error rateof the Commonwealth Group is some 45 per cent lower than that of theGlobal Group.
$0
$20 000
$40 000
$60 000
$80 000
$100 000
$120 000
$140 000
$160 000
$180 000
CommonwealthGovernment
Aver
age
Acc
ount
sPay
able
Pay
men
t
Most Efficient 25%
Middle50%
Least Efficient 25%
Global
Median$9224
Median$13 167
Figure 5.4Accounts Payable Activity Efficiency Benchmark—Average Payment

51
Figure 5.5Accounts Payable Activity Quality Benchmark—Error Rates
Accounts Payable Activity Benchmarks
Formula Used: Total Accounts Payable Errors / Number of Invoices Processed
5.21 There is a correlation between the cost of processing and errorrates and this information may indicate that the Commonwealth Groupis investing more time and effort in checking payments. The ANAOnotes that the organisation in the Commonwealth Group that had thebest performance in respect of the two accounts payable cost dimensionbenchmarks and the efficiency benchmark, had the second highest errorrate, indicating that the potential trade-off between cost and quality maybe a factor in the results.
Better Practice Benchmark5.22 Optimising the number of vendors is often implemented todevelop closer working relationships and improve the efficiency of theaccounts payable process. The ANAO used a benchmark based on thenumber of active vendors to provide an indication of the adoption ofbetter practices within the two groups.
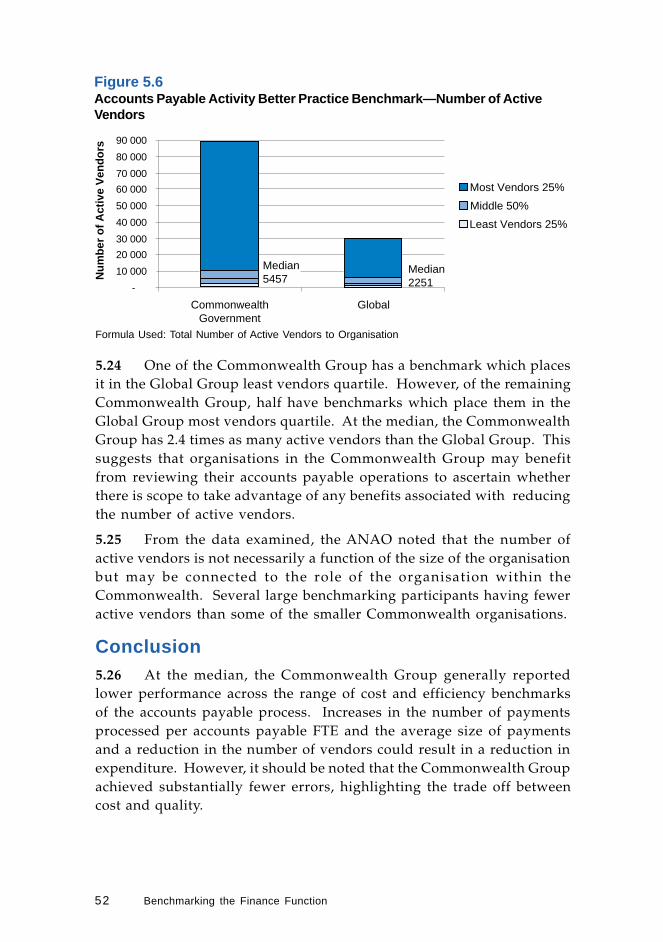
5.23 The results of benchmarking the number of active vendors areshown in Figure 5.6.
0%
5%
10%
15%
20%
25%
30%
35%
CommonwealthGovernment
Err
ors/
Pay
men
t Highest Error Rates 25%
Middle50%
Lowest Error Rates 25%
Global
Median1.52%
Median2.74%
52 Benchmarking the Finance Function
Formula Used: Total Number of Active Vendors to Organisation
5.24 One of the Commonwealth Group has a benchmark which placesit in the Global Group least vendors quartile. However, of the remainingCommonwealth Group, half have benchmarks which place them in theGlobal Group most vendors quartile. At the median, the CommonwealthGroup has 2.4 times as many active vendors than the Global Group. Thissuggests that organisations in the Commonwealth Group may benefitfrom reviewing their accounts payable operations to ascertain whetherthere is scope to take advantage of any benefits associated with reducingthe number of active vendors.
5.25 From the data examined, the ANAO noted that the number ofactive vendors is not necessarily a function of the size of the organisationbut may be connected to the role of the organisation within theCommonwealth. Several large benchmarking participants having feweractive vendors than some of the smaller Commonwealth organisations.
Conclusion5.26 At the median, the Commonwealth Group generally reportedlower performance across the range of cost and efficiency benchmarksof the accounts payable process. Increases in the number of paymentsprocessed per accounts payable FTE and the average size of paymentsand a reduction in the number of vendors could result in a reduction inexpenditure. However, it should be noted that the Commonwealth Groupachieved substantially fewer errors, highlighting the trade off betweencost and quality.
-
10 000
20 000
30 000
40 000
50 000
60 000
70 000
80 000
90 000
Num
ber
of A
ctiv
e V
endo
rs
CommonwealthGovernment
Global
Most Vendors 25%
Middle 50%
Least Vendors 25%
Median5457
Median2251
Figure 5.6Accounts Payable Activity Better Practice Benchmark—Number of ActiveVendors

53
Better Practice Observations 24
5.27 The ANAO conducted an audit in 1996 of the accounts payableactivity25 within the Commonwealth and issued an accompanyinghandbook26 to the audit. As noted in the ANAO’s Paying AccountsAccompanying Handbook, the overriding principle to be adopted inaccounts payable is to “pay the supplier” not “process the paper”. In thisregard significant improvements and efficiencies can be achieved byforming alliances with strategic suppliers and establishing business rulesfor both parties. Technology is the key enabler that permitsimplementation of an appropriate structure and efficient processes.
Strategic Alliances5.28 Better practice is to sole source where possible and to enter intoa medium to long term contractual relationship with that supplier. Thisapproach provides the opportunity to develop and extend existingclustering arrangements (for example in areas such as travel andinformation technology infrastructure) to other goods and services andto make greater use of the economic leverage implicit in suchrelationships.
5.29 Vendors with whom strategic alliances are formed may beinvolved in developing better ways to process accounts payable. Thiscould include:
• the use of summary invoicing;
• transfer of responsibility for accuracy to suppliers;
• agreement of performance standards (cost, quality and delivery) andperformance guarantees;
• alignment of supplier and buyer databases to allow simplified updateof information;
• parallel development of electronic data/document interchange;
• development of supplier procedures to cover delivery requirementsand handling of exceptions to allow redesigned payment processes tobe implemented; and
• involvement of payment of accounts staff in the development andnegotiation of standard terms and conditions and customised termsand conditions for large contracts.
Accounts Payable Activity Benchmarks
24 Australian National Audit Office Paying Accounts Accompanying Handbook, November 1996,Arthur Andersen Global Best Practices® KnowledgeBase and Reengineering Australia.
25 Australian National Audit Office Audit Report No.16 of 1996–97 Payment of Accounts.26 Australian National Audit Office Paying Accounts Accompanying Handbook, November 1996.
54 Benchmarking the Finance Function
Organisational Structure5.30 Centralised processing benefits include achievement of a higherdegree of specialist expertise, establishment of centres of excellence thatdevelop and enforce common practices and standards and theachievement of cost efficiencies through co-locating of systems and staff.It also provides other benefits such as the ability to consolidate paymentsto suppliers.
5.31 Better practice suggests that the authority to approve and theresponsibility for expenditure should be as close as possible to thedecision-maker committing the organisation to the payment. Thisapproach follows through to certification for payment once the goodsand services are received.
5.32 Benefit can also be achieved through the co-location of accountspayable and purchasing staff. Through a multi-function approachachieved by cross training, staff are made more aware of theindependencies of these two activities. They also provide a more flexibleworkforce which is more responsive to peak workload periods.
Technology5.33 A common feature of changes in payment of accounts practices isthe increasing reliance on technological solutions to make value-addedprocesses more efficient and to eliminate non-value added processesaltogether. The two principal innovations in this area have been themove toward the full integration and/or interfacing of financial systemsand the increasing use of electronic commence—primarily electronic data/document exchange and electronic payment.
5.34 A fully integrated/interfaced system could exhibit some or all ofthe following features:
• electronic purchase order which extracts details from database ofapproved suppliers and which is authorised electronically;
• quantity, price and account code entered once only, on the purchaseorder;
• electronic notification of receipt of goods/services;
• automated three-way matching of invoice, purchase order andnotification of receipt;
• supplier and account code details extracted automatically frompurchase order for payment;
• automatic check for duplicate payment; and

55
• cheque payment/direct credit automatically scheduled based on termsof trade taken from supplier database.
Payment Process5.35 The emphasis in review of payment processes is to reduce thenumber of steps in paying accounts. Better practice has been betweenthree and five steps for the entire process. A range of innovations havecontributed to this, including:
• Evaluated Receipt Settlement—agreements with suppliers to pay forgoods upon receipt, thus eliminating the need for invoices. Thisinvolves the suppliers shipping document (or telecommunicatedshipping advice) being used to determine the quantity of goodssupplied. The quantity data (subject to verification by the receivingsection) is extended at the purchase contract price and terms in effectat the time of shipment to calculate the amount owed and paymentdue date.
• Standing Payments—establishment of regular (usually monthly) orlump-sum payments for recurring transactions based on expected usagelevels, with periodic adjustments. This approach is particularlyrelevant to suppliers that provide goods or services on a regular basis,such as utility providers and fleet managers.
• Differentiated payment—adopting effective abbreviated certificationprocedures, particularly for low-dollar-value claims, has the potentialto significantly reduce the amount of time spent on payments ofaccounts.
Accounts Payable Activity Benchmarks

56 Benchmarking the Finance Function
6. ‘Close the Books’ and FinancialReporting Activity Benchmarks
Introduction6.1 ‘Close the books’ and financial reporting is the process throughwhich an organisation generates and distributes reports on a periodicbasis to meet regulatory requirements and internal information needs.Accuracy and timeliness are critical.
6.2 Possible tasks include:
• ensuring validity and consistency in the organisation’s charts ofaccounts;
• completing journal entries;
• consolidating data from outlying business units;
• running trial balances;
• correcting errors;
• reconciling and analysing accounts;
• calculating taxes;
• preparing and distributing reports; and
• supervising closing tasks and reviewing key accounts and reports.
6.3 The closing of the books and financial reporting process is one ofthe more significant activities in the Commonwealth Group’s financialoperations. It accounts at the median for 8.9 per cent of the total financeoperating budget.
6.4 At the median, the Commonwealth Groups ‘close the books’accounts for 6.1 per cent of the total finance function staffing, withindividual organisation staffing ranging between 0.48 and 9.4 FTEs.
6.5 The cost, quality and better practice benchmarks identified bythe ANAO for the ‘close the books’ activity are shown in Table 6.1.
Table 6.1‘Close the Books’ Activity Benchmarks
Dimension Formula
Cost—Overall Total ‘close the books activity cost / Total organisational expenditure
Quality—Error Rate Total number of error correction journals / Total number of journals
Better Practice Number of hard closes in excess of requirements

57
Cost Dimension Benchmark6.6 The overall cost benchmark captures ‘close the books’ cost at aglobal level and expresses this as a percentage of total organisationalexpenditure. The benchmarking results are summarised in Figure 6.1.The Commonwealth Group allocates between 0.013 and 0.990 per cent oftotal organisational expenditure to the ‘close the books’ activity, withthe lowest cost quartile ranging between 0.013 and 0.050 per cent. Incomparison, the Global Group allocates between 0.005 and 0.957 per centof total organisational expenditure.
Figure 6.1‘Close the Books’ Activity Cost Benchmark—Overall Cost
‘Close the Books’ and Financial Reporting Activity Benchmarks
Formula Used: Total ‘Close The Books’ Activity Cost / Total Organisational Expenditure
6.7 The median cost of the Commonwealth Group is approximatelyhalf of the Global Group. Eight of the Commonwealth Group havebenchmarks which place them within the Global Group lowest costquartile. The Commonwealth Group, with the recent introduction ofaccrual accounting, tighter Parliamentary reporting timetables andincreasing emphasis on internal accrual reporting has only just begun torecognise the value of regular ‘close the books’ processes.
6.8 If the ‘close the books’ cost component of the finance function ofthose organisations in the Commonwealth Group above the Group medianwere reduced only to the median level, then expenditure reductions ofsome 17 per cent would result.
0.0%
0.2%
0.4%
0.6%
0.8%
1.0%
Highest Cost 25%
Middle50%
Lowest Cost 25%
Per
cent
age
of T
otal
Org
anis
atio
nal E
xpen
ditu
re
CommonwealthGovernment
Global
Median0.081%
Median0.152%

58 Benchmarking the Finance Function
Quality Dimension Benchmarks6.9 The ANAO used error rate (through the total number of errorcorrection journals as a percentage of total journals) as a measure of ‘closethe books’ and financial reporting quality. The error correctionbenchmark, as shown in Figure 6.2, indicates higher error rates for theorganisations within the Commonwealth Group, in comparison to theGlobal Group.
Figure 6.2‘Close the Books’ Activity Quality Benchmark—Error Rates
Formula Used: Total Number of Error Correction Journals / Total Number of Journals
6.10 All of the Commonwealth Group reported error rates greater thanthe Global Group median, with all but four of the Commonwealth Grouphaving error rates placing them in the most errors quartile of the GlobalGroup.
6.11 The ANAO noted no apparent correlation between the cost ofthe ‘close the books’ and financial reporting activity within theCommonwealth Group and the error rates.
Per
cent
age
Err
or C
orre
ctio
n Jo
urna
ls
Most Errors 25%
Middle 50%
Least Errors 25%
Median2.00%
Median21.43%
CommonwealthGovernment
Global
75%
60%
45%
30%
15%
0%

59
Better Practice Benchmark6.12 The ANAO used the number of ‘hard closes27’ that an organisationconducts in excess of requirements as an indicator of better practice. Forthe purpose of this benchmark, it is assumed that only one hard close isrequired of the public sector, at the end of each financial year. The resultsof the number of hard closes in excess of requirements benchmarkingare illustrated in Figure 6.3.
Figure 6.3‘Close the Books’ Activity Better Practice Benchmark—Hard Closes
‘Close the Books’ and Financial Reporting Activity Benchmarks
Formula Used: Number of Hard Closes in Excess of Requirements
6.13 With the exception of five, organisations in the CommonwealthGroup have hard close benchmarks which place them in the least hardclose quartile of the Global Group.
Conclusion6.14 The ‘close the books’ activity for the Commonwealth Group is aless frequent, and lower cost (at the median), activity than in the GlobalGroup. The notion of ‘closing the books’ and particularly ‘hard closes’ isrelatively new to a number of participants in the Commonwealth Group,and the overall cost benchmark may reflect this inexperience. Errorsappear to be frequent and may make the process unnecessarily expensive.
Commonwealth Government
No Hard Closes in Excess of Requirements
Global
1-12 Hard Closes in Excess of RequirementsOver 12 closes in Excess of Requirements
No Hard Closes in Excess of Requirements
13-28 Hard Closes in Excess of Requirements
1-12 Hard Closes in Excess of Requirements
58.39%
2.58%
39.03%
72.22%
0.00%
27.78%
27 A hard close is performed each time a detailed cut-off is performed and financial reports areproduced. It includes analysis of accounts receivable, inventory, payables, revenues andexpenses. The hard close also involves the process of making necessary accruals, adjustmentsand combining and consolidating entries for reporting purposes. In addition to the end of yearfinancial statements, many organisations perform a hard close during the year for both internaland external reporting. A hard close is distinguished from a soft close where the books are closedwith just enough precision to satisfy internal management reporting requirements.
60 Benchmarking the Finance Function
Better Practice Observations 28
6.15 The following paragraphs outline some of the better practices thathave been adopted by organisations to deliver overall improvement inthe efficiency and effectiveness of the ‘close the books’ and financialreporting activity.
6.16 Better practice organisations shift tasks away from period-endto simplify closing the books. Tasks that are performed as part of theclose cycle, such as reconciling accounts and journalising accruals, maybe done at that time simply out of habit.
6.17 These organisations also provide line managers with the financialinformation needed for decision support. Rather than provide genericinformation, reports provide key performance indicators relevant formanagement review and analysis. A well-honed set of standardisedreports can also be designed to not only meet the needs of managers butsave time on the close as well.
6.18 Minimising errors enhances the speed and reporting accuracy ofthe closing. Quality in the process is supported by the quality ofinformation provided by each unit in the organisation. Errors may reducewhen quality initiatives extend to reporting units and accountability forerror correction is assigned to the originating department.
28 Australian National Audit Office Building Better Financial Management Support Guide, November1999, Arthur Andersen Global Best Practices® KnowledgeBase and Reengineering Australia.Australian National Audit Office Paying Accounts Accompanying Handbook, November 1996,Arthur Andersen Global Best Practices® KnowledgeBase and Reengineering Australia

61
7 Accounts Receivable ActivityBenchmarks
Introduction7.1 Accounts receivable is among the largest and most liquid assetson the books of many organisations and a properly managed accountsreceivable portfolio can expedite cash flow and support corporate cashrequirements. A primary objective of the accounts receivable activity isto ensure that customers who are granted credit pay according to termsand that funds are available as soon as payment is received. However,in the Commonwealth Group accounts receivable is not a significantfinance activity.
7.2 The three basic processes that make up the accounts receivableactivity are:
• remittance processing—including payment methods and automatedprocessing;
• credit management—including communication of credit policies, creditchecks and approvals, and credit maintenance; and
• collections—including methods to monitor and motivate internal andexternal collections agents, collections techniques, and technology.
7.3 As with the billing activity, the accounts receivable activity’srelative low significance in the Commonwealth Group’s financialoperations is illustrated by the benchmarking data. The accountsreceivable activity within the Commonwealth Group at the median onlyaccounts for 3.6 per cent of the total finance operating budget. Accountsreceivable processing staff in the Commonwealth Group, represent only4.23 per cent of the total finance function staffing, with individualorganisation staffing ranging between 0.08 and 9.03 FTEs.
7.4 The ANAO noted that while five of the Commonwealth Groupindicated they did not have a billing activity, only one indicated it didnot have an accounts receivable activity. This may result in someinconsistency in the data between billing and accounts receivablebenchmarks as some organisations were unable to structurally distinguishbetween the two activities.
7.5 The ANAO also notes that there are a number of Commonwealthorganisations which were not benchmarked as part of this study, but doundertake substantial accounts receivable activity and therefore the GlobalGroup benchmarks are relevant to these organisations.
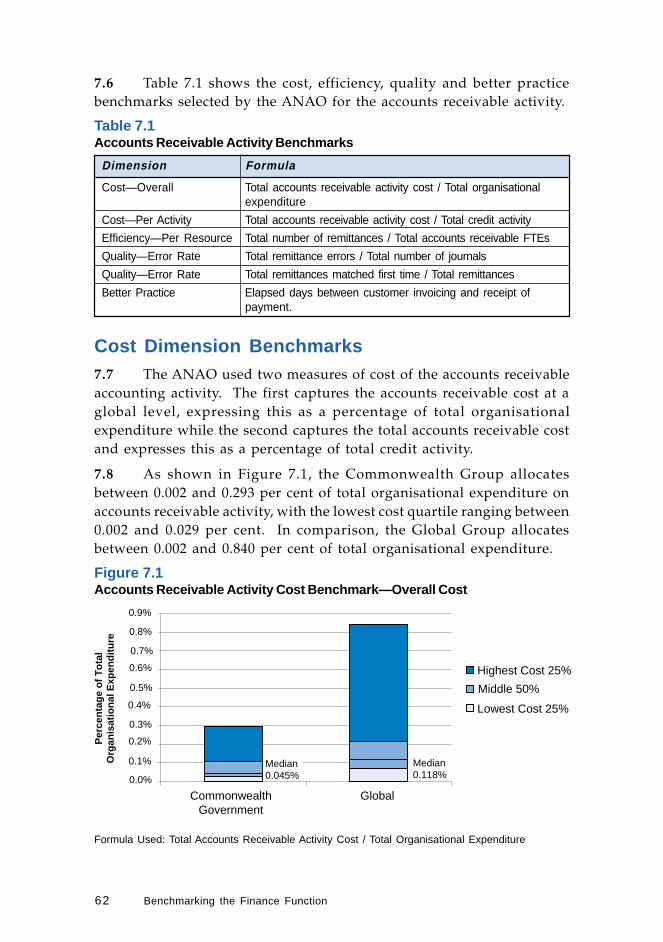
62 Benchmarking the Finance Function
7.6 Table 7.1 shows the cost, efficiency, quality and better practicebenchmarks selected by the ANAO for the accounts receivable activity.
Table 7.1Accounts Receivable Activity Benchmarks
Dimension Formula
Cost—Overall Total accounts receivable activity cost / Total organisationalexpenditure
Cost—Per Activity Total accounts receivable activity cost / Total credit activity
Efficiency—Per Resource Total number of remittances / Total accounts receivable FTEs
Quality—Error Rate Total remittance errors / Total number of journals
Quality—Error Rate Total remittances matched first time / Total remittances
Better Practice Elapsed days between customer invoicing and receipt ofpayment.
Cost Dimension Benchmarks7.7 The ANAO used two measures of cost of the accounts receivableaccounting activity. The first captures the accounts receivable cost at aglobal level, expressing this as a percentage of total organisationalexpenditure while the second captures the total accounts receivable costand expresses this as a percentage of total credit activity.
7.8 As shown in Figure 7.1, the Commonwealth Group allocatesbetween 0.002 and 0.293 per cent of total organisational expenditure onaccounts receivable activity, with the lowest cost quartile ranging between0.002 and 0.029 per cent. In comparison, the Global Group allocatesbetween 0.002 and 0.840 per cent of total organisational expenditure.
Figure 7.1Accounts Receivable Activity Cost Benchmark—Overall Cost
Formula Used: Total Accounts Receivable Activity Cost / Total Organisational Expenditure
Per
cent
age
of T
otal
Org
anis
atio
nal E
xpen
ditu
re
CommonwealthGovernment
Global
0.9%
0.8%
0.7%
0.6%
0.5%
0.4%
0.3%
0.2%
0.1%
0.0%
Highest Cost 25%
Middle 50%
Lowest Cost 25%
Median0.045%
Median0.118%

63
7.9 Some 70 per cent of the Commonwealth Group reported accountsreceivable overall cost benchmarks which fall within the Global Grouplowest cost quartile.
7.10 If the accounts receivable component of the finance function costsof those organisations in the Commonwealth Group above the Groupmedian were reduced only to the median level, this would result inexpenditure reductions of some 25 per cent.
7.11 Due to the low overall significance of accounts receivable activitiesin the Commonwealth Group, a more appropriate measure of costperformance may be found in the cost per activity benchmark which isthe second of the accounts receivable cost measures benchmarks.Figure 7.2 shows the results of the accounts receivable cost per activitybenchmarking with the Commonwealth Group’s costs well below thoseof the Global Group.
Figure 7.2Accounts Receivable Activity Cost Benchmark—Cost/Credit Activity
Accounts Receivable Activity Benchmarks
Formula Used: Total Accounts Receivable Activity Cost / Total Credit Activity
7.12 In the Commonwealth Group, only nine organisations were ableto provide information against this benchmark. Of the nine, seven haveaccounts receivable cost per activity benchmarks which place them in theGlobal Group lowest cost quartile, and the median cost per credit activityin the Commonwealth Group is around 25 per cent of that in the GlobalGroup. There was a wide range of results within the CommonwealthGroup for this benchmark. The highest cost per activity was $2576, thisthen dropped to $599 and then $136. The sizeable difference in resultsmay be a further reflection of the varied degree to which Commonwealthorganisations perform the accounts receivable activity.
$-
$500
$1000
$1500
$2000
$2500
$3000
$3 500
$4 000
$4 500
CommonwealthGovernment
Highest Cost 25%
Middle50%
Lowest Cost 25%
Cos
t/Cre
dit A
ctiv
ity
Global
Median$121
Median$492

64 Benchmarking the Finance Function
Efficiency Dimension Benchmark7.13 The ANAO selected the efficiency measure of the number ofremittances processed per FTE, as it provides an insight into employeeoutput and productivity. The benchmarking results—showing the medianperformance level of the Commonwealth Group at less than half that ofthe Global Group—are illustrated in Figure 7.3.
Figure 7.3Accounts Receivable Activity Efficiency Benchmark—Remittances/FTE
Formula Used: Total Number of Remittances / Total Accounts Receivable FTEs
7.14 In the Commonwealth Group, 17 organisations had results forthis benchmark. Four of the Commonwealth Group reported efficiency(number of remittances per accounts receivable FTE) results which placethem within the Global Group most efficient quartile. However, overhalf of the Commonwealth Group reported benchmarks placed in theGlobal Group least efficient quartile.
7.15 The ANAO notes that while organisations in the CommonwealthGroup reported relatively low cost per transaction benchmarks, they alsoreported relatively low efficiency per FTE compared with the GlobalGroup. This may require further investigation, but may be a result ofthe incompatible data samples between the two benchmarks (althoughall but one of the Commonwealth Group indicated they had an accountsreceivable activity, ten organisations were unable to produce an accountsreceivable cost per credit activity ratio).
CommonwealthGovernment
Global
Rem
ittan
ces/
FT
E
Most Remittances 25%
Middle 50%
Least Remittances 25%
30 000
25 000
20 000
15 000
10 000
5000
0
Median1761
Median3966

65
Quality Dimension Benchmarks7.16 The ANAO used two measures of accounts receivable quality. Thefirst assesses the error rate through the total number of remittance errorsas a percentage of total remittances. The results are illustrated inFigure 7.4, with the median Commonwealth Group error rate beingaround one third that of the Global Group.
Figure 7.4Accounts Receivable Activity Quality Benchmark—Error Rates
Accounts Receivable Activity Benchmarks
Formula Used: Total Remittance Errors / Total Number of Remittances
7.17 Eight of the Commonwealth Group reported quality benchmarkswhich place them within the least errors quartile of the Global Groupand the median error rate in the Commonwealth Group is well belowthe Global level. None of the benchmarked Commonwealth Group hada benchmark which placed it next to the most errors quartile of the GlobalGroup.
7.18 There does not appear to be a trade off between cost and qualityin the benchmarking results of the Commonwealth Group, with relativelylow costs and low error rates being reported. The ANAO noted that theCommonwealth Group reporting the highest cost per activity for accountsreceivable also had amongst the highest error rates, suggesting someprocess issues requiring investigation.
7.19 The second accounts receivable quality benchmark measures thepercentage of remittances matched first time, reflecting the accuracy ofautomated posting or the accuracy of remittance processing staff ingleaning payment information from remittances. Items that may preventa ‘first-time match’ include discrepancies in the amount paid, problemsmatching invoices to the payment, and errors that are outside oforganisational predefined tolerance levels.
0%
5%
10%
15%
20%
25%
CommonwealthGovernment
Global
Per
cent
age
of R
emitt
ance
Err
ors
Most Errors 25%
Middle 50%
Least Errors 25%
Median1.20%
Median3.50%

66 Benchmarking the Finance Function
7.20 Figure 7.5 shows the benchmarking results of remittances matchedfirst time. The median level of first time matches in the CommonwealthGroup is 98 per cent, compared with 93 per cent for the Global Group.
Figure 7.5Accounts Receivable Activity Quality Benchmark—Remittance First-timeMatches
Formula Used: Total Remittances Matched First Time / Total Remittances
7.21 The Commonwealth Group compares favourably with the GlobalGroup on this benchmarking measure. Half of the Commonwealth Groupreported first time match ratios that placed them within the GlobalGroup’s highest quality quartile. The Commonwealth Group result isfurther improved by the fact that only one outlying organisation had amatch rate lower than 77 per cent. The remainder of the CommonwealthGroup had a first time match rate of between 77 to 100 per cent.
Better Practice Benchmark7.22 The accounts receivable better practice benchmark assessed thenumber of days that receivables were outstanding, indicating the averagelength of time it took to collect a bill. A low number of days outstandingcould, amongst other things, indicate effective billing and collectingpractices, highly satisfied customers, or both. The benchmarking resultsare shown in Figure 7.6, with Commonwealth Group reporting a medianreceivables days outstanding of 29 days, compared with 43 days for theGlobal Group.
20%
40%
60%
80%
100%
CommonwealthGovernment
Global
Per
cent
age
of R
emitt
ance
sM
atch
ed F
irst T
ime Most Matches 25%
Middle 50%
Least Matches 25%
Median98%
Median93%

67
Figure 7.6Accounts Receivable Activity Better Practice Benchmark—Days ReceivableOutstanding
Accounts Receivable Activity Benchmarks
Formula Used: Elapsed Days between Customer Invoicing and Receipt of Payment
7.23 The Commonwealth Group generally reported lower number ofreceivable days outstanding than the Global Group with the median at67 per cent of that of the Global Group. Half of the CommonwealthGroup that reported against this benchmark, reported days receivablesperformance placing them next to the Global Group’s highest quality (leastdays outstanding) quartile.
7.24 The ANAO noted that, generally, those of the CommonwealthGroup that reported the lowest cost per transaction benchmarks foraccounts receivables, also reported the longest days receivables. Thismay be reflective of a cost-quality trade off in those organisations.
7.25 The small size of the accounts receivable activities within theCommonwealth Group may indicate less complexity in the accountsreceivable activity, which could affect the interpretation of the cost,efficiency, quality and better practice benchmarking outcomes.
7.26 The ANAO 1997 Accounts Receivable Audit29 found that theaverage time to collect receivables amongst the ten Commonwealthorganisations surveyed was 39 days. It was noted that this result wasbetter than that achieved in the whole general government sector whenaverage days to collect receivables on sales of goods and services during1995–96 was calculated to be 57 days. The current benchmarking of theCommonwealth Group reveals a median of 29 days to collect receivables,continuing the trend of improvement since 1995–96.
0
20
40
60
80
100
120
140
Most Days 25%
Middle50%
Least Days 25%
CommonwealthGovernment
Global
Day
s R
ecei
vabl
e O
utst
andi
ng
Median43 Days
Median29 Days
29 Australian National Audit Office Audit Report No.29 of 1997–98 Management of AccountsReceivable.

68 Benchmarking the Finance Function
Conclusion7.27 Accounts receivable is not a significant finance activity for theCommonwealth Group. While the relatively small size of the receivablesactivities could indicate less complexity in those activities—and couldtherefore affect interpretation of the cost, efficiency, quality and betterpractice benchmarking outcomes—the benchmarking results show theCommonwealth Group activities to be relatively low in cost and high inquality when compared with the Global Group.
7.28 At the median, the efficiency indicator, however, produces anunfavourable comparative view of the Commonwealth Group’sperformance and this anomaly may require further investigation.
Better Practice Observations 30
7.29 The ANAO undertook an audit of the accounts receivable activityin 199731 and concluded that at both the strategic and operational level,improvements could be made in the management and administration ofthe accounts receivable function in the general government sector.
7.30 As noted in the ANAO’s Management of Accounts ReceivableBetter Practice Guide32, effective management of accounts receivablepresents important opportunities for Commonwealth organisations toachieve strategic advantage through improvements in customer service,cash management and reduction in costs.
7.31 The following paragraphs outline some of the better practices thathave been adopted by organisations to deliver overall improvement inthe efficiency and effectiveness of the accounts receivable activity.
7.32 The ANAO notes that some Commonwealth organisations havealready adopted better practices in the accounts receivable activity butthe discussion is provided for the benefit of all organisations wishing toimplement higher performing internal finance functions.
7.33 The adoption of better practices in Commonwealth organisationsmay lead to substantial improvement in the accounts receivable activity,particularly in the areas of organisational structure, centralised processingand appropriate technology utilisation.
30 Australian National Audit Office Management of Accounts Receivable Better Practice Guide,December 1997, Arthur Andersen Global Best Practices® KnowledgeBase and ReengineeringAustralia.
31 Australian National Audit Office Audit Report No.29 of 1997–98 Management of AccountsReceivable, December 1997.
32 Australian National Audit Office Management of Accounts Receivable Better Practice Guide,December 1997.
69
Organisational Structure7.34 Centralised processing benefits include achievement of a highdegree of specialist expertise, establishment of centres of excellence thatdevelop and enforce common practices and standards and theachievement of cost efficiencies through co-locating of systems and staff.
7.35 Outsourcing of the collection activity and monitoring of thevendor ’s performance affords the opportunity to focus on corecompetencies and leveraging the provider’s expertise in non-core areas.It also releases financial resources that might otherwise have been usedto construct and maintain infrastructure.
7.36 Effective credit and collections policies and practices should leadto a days sales outstanding that approximates the credit terms. Improvedperformance may be achieved through:
• review of the collection efforts to make them more efficient;
• review of the current credit terms for their appropriateness; and
• restructuring the billing process to remove inefficiencies andinaccuracies causing delays in invoicing and payment.
Technology7.37 Accounts receivable processing efficiency and effectiveness canbe enhanced by utilisation of electronic commerce, in particular electronicdata interchange (EDI), electronic mail, electronic funds transfer (EFT)and electronic catalogue systems to allow buyer and supplier to transactbusiness by exchanging information between computer systems.
7.38 Automated remittance processing results in minimal employeeintervention, directing resources toward working with customers to collectpayment rather than processing paperwork. Technology can be used toidentify and track accounts that require follow up and to analyse variablessuch as average days to pay, days sales outstanding and discounts earnedon each account.
7.39 Integration and/or interfacing of revenue and accounts receivablesystems allows remittances to be automatically credited against acustomer account with simultaneous updating of the general ledger. Otherfeatures of a fully integrated system could include:
• electronic invoicing through extraction of details from a database ofapproved customers and credit terms and on-line authorisation;
• quantity, price and account code for sales entered once only, on theinvoice;
Accounts Receivable Activity Benchmarks

70 Benchmarking the Finance Function
• electronic notification of delivery of goods/services;
• customer and account code details extracted automatically fromcustomer order;
• automation of reminder letters; and
• automatic triggering of write-off or waiver action.

71
8. Payroll Activity Benchmarks
Introduction8.1 The payroll activity includes all processes required to pay salariesand wages in accordance with organisation policies and governmentregulations. A primary business objective of payroll is to be an efficientand effective processor of employee wages, benefits and reimbursableexpenses.
8.2 Payroll processes include:
• monitoring employee time and attendance;
• calculating gross and net pay;
• distributing net pay;
• disbursing withholdings or deductions from gross pay;
• maintaining and updating all payroll-related data;
• processing payroll accounting entries; and
• resolving payroll inquiries.
8.3 The payroll activity is the most significant of the finance functions,accounting for a median 21.2 per cent of the total finance functionoperating cost of the Commonwealth Group. Payroll staff account for amedian 23.81 per cent of the total finance function staffing, varyingbetween 0.55 and 81 FTEs in the Commonwealth Group. However,outsourcing in some Commonwealth organisations makes it difficult tocompare indicators based on FTEs.
8.4 The payroll activity benchmarks selected by the ANAO addressdimensions of cost, efficiency, quality and better practice as set out inTable 8.1.
Table 8.1Payroll Activity Benchmarks
Dimension Formula
Cost—Overall Total payroll activity cost / Total organisational expenditure
Cost—Per Activity Total payroll activity cost / Annual number of pays
Efficiency—Per Resource Total number of pays annually / Payroll activity FTEs
Quality—Error Rate Total number of pays with errors / Total number of paysannually
Better Practice Payroll/Human Resources System Integration/Interface
Total staff using direct debit / Total staff
Payroll Activity Benchmarks
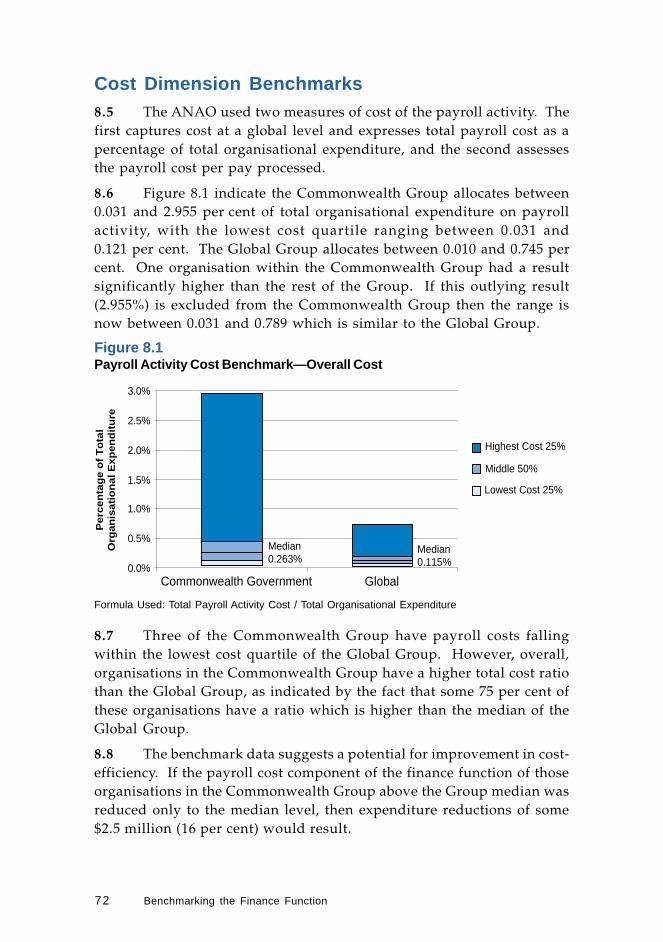
72 Benchmarking the Finance Function
Cost Dimension Benchmarks8.5 The ANAO used two measures of cost of the payroll activity. Thefirst captures cost at a global level and expresses total payroll cost as apercentage of total organisational expenditure, and the second assessesthe payroll cost per pay processed.
8.6 Figure 8.1 indicate the Commonwealth Group allocates between0.031 and 2.955 per cent of total organisational expenditure on payrollactivity, with the lowest cost quartile ranging between 0.031 and0.121 per cent. The Global Group allocates between 0.010 and 0.745 percent. One organisation within the Commonwealth Group had a resultsignificantly higher than the rest of the Group. If this outlying result(2.955%) is excluded from the Commonwealth Group then the range isnow between 0.031 and 0.789 which is similar to the Global Group.
Figure 8.1Payroll Activity Cost Benchmark—Overall Cost
Formula Used: Total Payroll Activity Cost / Total Organisational Expenditure
8.7 Three of the Commonwealth Group have payroll costs fallingwithin the lowest cost quartile of the Global Group. However, overall,organisations in the Commonwealth Group have a higher total cost ratiothan the Global Group, as indicated by the fact that some 75 per cent ofthese organisations have a ratio which is higher than the median of theGlobal Group.
8.8 The benchmark data suggests a potential for improvement in cost-efficiency. If the payroll cost component of the finance function of thoseorganisations in the Commonwealth Group above the Group median wasreduced only to the median level, then expenditure reductions of some$2.5 million (16 per cent) would result.
0.0%
0.5%
1.0%
1.5%
2.0%
2.5%
3.0%
Commonwealth Government Global
Pe
rce
nta
ge
of T
ota
lO
rga
nis
atio
na
l Exp
en
ditu
re
Highest Cost 25%
Middle 50%
Lowest Cost 25%
Median0.263%
Median0.115%

73
8.9 The ANAO notes that benchmark results do not provide reasonsfor the differences in performance, and consideration needs be given tothe type of organisation and its business.
8.10 The second payroll cost benchmark—shown in Figure 8.2—assessesthe payroll cost per pay processed. The Commonwealth Group resultsare similar with those of the Global Group.
Figure 8.2Payroll Activity Cost Benchmark—Cost/Pay
Payroll Activity Benchmarks
$0
$20
$40
$60
$80
$100
$120
$140
$160
Commonwealth Government
Cos
t / P
ay
Global
Highest Cost 25%
Middle 50%
Lowest Cost 25%
Median$18.29
Median$17.65
Formula Used: Total Payroll Activity Cost / Annual Number of Pays
8.11 Two of the benchmarked Commonwealth organisations have acost per pay that falls within the lowest cost quartile of the Global Group.One of these organisations is also the largest of the Commonwealth Group,possibly indicating the benefits of scale.
8.12 The organisation that had an outlying result in the overall costbenchmark also had a result substantially higher than the rest of theGroup in this benchmark. In this instance, the organisation had a costper pay of approximately $150, which is $110 more than the cost per payfor the next highest organisation.
Efficiency Dimension Benchmark8.13 The efficiency measure of the number of pays processed per FTE—illustrated in Figure 8.3 —provides an insight into employee output andproductivity. As with the two cost benchmarks, two of theCommonwealth Group have a number of pays per payroll FTE that fallwithin the most efficient quartile of the Global Group. However theGlobal Group median is 37 per cent higher than that of theCommonwealth.

74 Benchmarking the Finance Function
Figure 8.3Payroll Activity Efficiency Benchmark—Pays/FTE
Formula Used: Total Number of Pays Annually / Payroll Activity FTEs
8.14 Good performance against the efficiency benchmark could be anindication of highly efficient employees or employee utilisation, efficientbusiness processes and/or low error rates (less rework required). Afurther consideration could be the relatively complex public sectoremployment conditions, including arrangements around higher dutiesallowances and short-term leave.
Quality Dimension Benchmark8.15 The ANAO selected one measure of quality for the payroll activitybeing a benchmark which measures the error rate through the totalnumber of payroll errors as a percentage of pays. Payroll processingerrors are those rejected by the payroll system. System validation testsmay check for validity of employee numbers, account distribution coding,the reasonableness of pay amounts, etc. Therefore, this measure is anindication of the quality of information input to the payroll system.
8.16 The error rate benchmarks of the Commonwealth Group—shownin Figure 8.4—indicate sound performance against Global benchmarkswith the median some 31 per cent lower than that of the Global Group.Six of the nineteen Commonwealth Group reported error rate benchmarksplacing them in the low error rate quartile of the Global Group.Furthermore, only one organisation within the Commonwealth Group
0
60,000
Pay
s / P
ayro
ll F
TE
Commonwealth Government Global
Middle 25%
Least Efficient 25%
Most Efficient 25%
50,000
40,000
30,000
20,000
10,000Median5446
Median3967
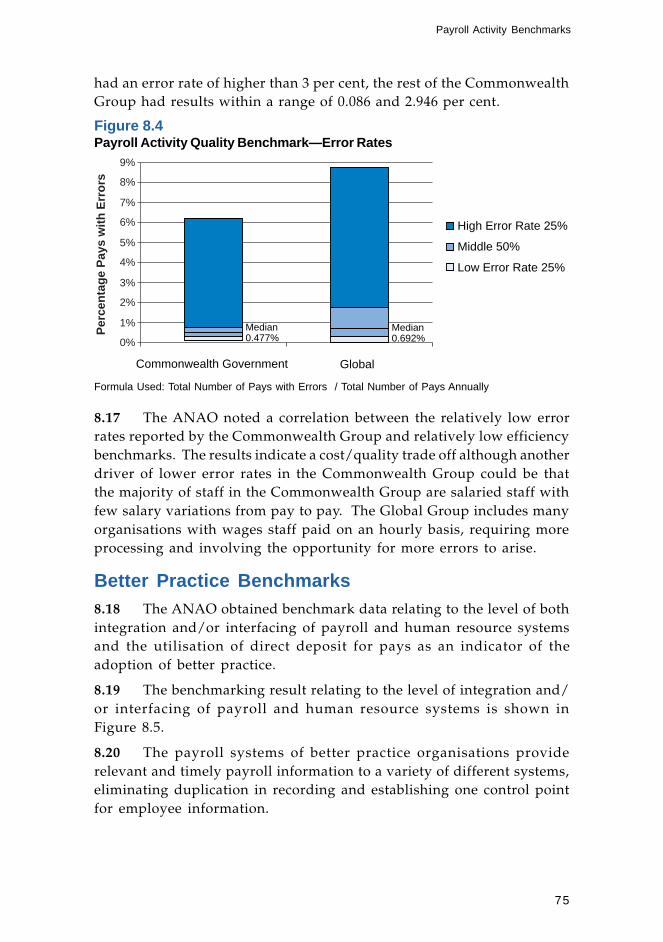
75
had an error rate of higher than 3 per cent, the rest of the CommonwealthGroup had results within a range of 0.086 and 2.946 per cent.
Figure 8.4Payroll Activity Quality Benchmark—Error Rates
Payroll Activity Benchmarks
0%
1%
2%
3%
4%
5%
6%
7%
8%
9%
Per
cent
age
Pay
s w
ith E
rror
s
Commonwealth Government Global
High Error Rate 25%
Middle 50%
Low Error Rate 25%
Median0.692%
Median0.477%
Formula Used: Total Number of Pays with Errors / Total Number of Pays Annually
8.17 The ANAO noted a correlation between the relatively low errorrates reported by the Commonwealth Group and relatively low efficiencybenchmarks. The results indicate a cost/quality trade off although anotherdriver of lower error rates in the Commonwealth Group could be thatthe majority of staff in the Commonwealth Group are salaried staff withfew salary variations from pay to pay. The Global Group includes manyorganisations with wages staff paid on an hourly basis, requiring moreprocessing and involving the opportunity for more errors to arise.
Better Practice Benchmarks8.18 The ANAO obtained benchmark data relating to the level of bothintegration and/or interfacing of payroll and human resource systemsand the utilisation of direct deposit for pays as an indicator of theadoption of better practice.
8.19 The benchmarking result relating to the level of integration and/or interfacing of payroll and human resource systems is shown inFigure 8.5.
8.20 The payroll systems of better practice organisations providerelevant and timely payroll information to a variety of different systems,eliminating duplication in recording and establishing one control pointfor employee information.
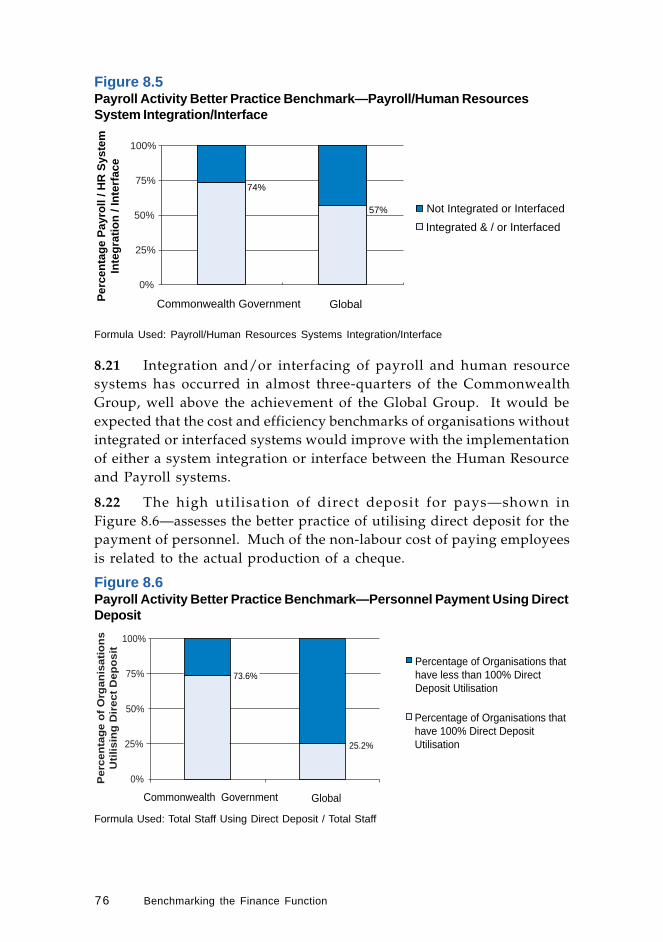
76 Benchmarking the Finance Function
Figure 8.5Payroll Activity Better Practice Benchmark—Payroll/Human ResourcesSystem Integration/Interface
0%
25%
50%
75%
100%
Per
cent
age
Pay
roll
/ HR
Sys
tem
Inte
grat
ion
/ Int
erfa
ce
Commonwealth Government Global
Not Integrated or Interfaced
Integrated & / or Interfaced
57%
74%
0%
25%
50%
75%
100%
Pe
rce
nta
ge
of O
rga
nis
atio
ns
Util
isin
g D
ire
ct D
ep
osi
t
Commonwealth Government Global
Percentage of Organisations thathave less than 100% DirectDeposit Utilisation
Percentage of Organisations thathave 100% Direct Deposit Utilisation
73.6%
25.2%
Formula Used: Payroll/Human Resources Systems Integration/Interface
8.21 Integration and/or interfacing of payroll and human resourcesystems has occurred in almost three-quarters of the CommonwealthGroup, well above the achievement of the Global Group. It would beexpected that the cost and efficiency benchmarks of organisations withoutintegrated or interfaced systems would improve with the implementationof either a system integration or interface between the Human Resourceand Payroll systems.
8.22 The high utilisation of direct deposit for pays—shown inFigure 8.6—assesses the better practice of utilising direct deposit for thepayment of personnel. Much of the non-labour cost of paying employeesis related to the actual production of a cheque.
Figure 8.6Payroll Activity Better Practice Benchmark—Personnel Payment Using DirectDeposit
Formula Used: Total Staff Using Direct Deposit / Total Staff

77
8.23 All but five of the Commonwealth Group pay 100 per cent oftheir staff by direct deposit. However the remaining organisations stillhave high utilisation rates with four of the organisations ranging between98.10 per cent to 99.52 per cent of pays processed and only oneorganisation with a utilisation rate below 90 per cent (87.67).
8.24 The high utilisation of direct deposit for pays within theCommonwealth Group in conjunction with the high percentage of humanresources and payroll system integration and/or interface in theCommonwealth Group would be expected to result in lower payrollprocessing costs and higher levels of efficiency for these organisations.However, the cost and efficiency benchmarks of the CommonwealthGroup do not support this expectation suggesting the need for furtheranalysis.
Conclusion8.25 The Commonwealth Group reported high utilisation of bothintegrated/interfaced payroll/human resources systems and payrolldirect deposit which are better practices. However, the overall payrollcost is higher than that of the Global Group while the median cost perpay is lower. The Global Group is 37 per cent more efficient as measuredby the median number of pays processed per full time equivalent employee(FTE). The error rate benchmarks of the Commonwealth Group generallyindicate sound performance with the median some 31 per cent lowerthan that of the Global Group.
Better Practice Observations 33
8.26 The following paragraphs outline some of the better practices thathave been adopted by organisations to deliver overall improvement inthe efficiency and effectiveness of the payroll activity.
8.27 The ANAO notes that most Commonwealth organisations havealready adopted better practices in the payroll activity—for example theutilisation of direct deposit of pay—but the discussion is provided forthe benefit of all organisations wishing to implement higher performingfinance functions.
Organisational Structure8.28 A significant trend is the move toward centralised processing ofpayroll, clearly distinguishing authorisation devolution and processing
Payroll Activity Benchmarks
33 Arthur Andersen Global Best Practices® KnowledgeBase and Reengineering Australia.

78 Benchmarking the Finance Function
centralisation. As part of the authorisation devolution, human resourceinformation system data entry and retrieval is decentralised with theprocessing of the payroll occurring centrally.
8.29 Organisational performance against the efficiency benchmark maybe improved through the use of service bureaus or higher levels oftechnology utilisation (eg. automated time recording and attendancesystems). The consolidation of the payroll processing into one or a smallnumber of centres frees up resources for more value adding activities.
8.30 Benefit can also be achieved through the co-location andintegration of the human resource information and payroll processingstaff. Through a multi-function approach achieved by cross training,staff are made more aware of the interdependencies of these two activities.They also provide a more flexible workforce which is more responsiveto peak workload periods.
8.31 Appropriate outsourcing of the payroll activity can also deliverbenefit through improved efficiency.
Technology8.32 A common feature of changes in payroll practices is the increasingreliance on technological solutions to make value-added processes moreefficient and to eliminate non-value added processes altogether. Thetwo principal innovations in this area have been the move toward thefull integration or interfacing of the human resource managementinformation, financial and the payroll systems, and the increasing use ofelectronic commerce—primarily electronic payment.
8.33 Better practice organisations use a central integrated system whichis based around one database. This database supports all humanresources, benefits and payroll activities. Data only needs to be addedonce to the system which eliminates redundant data entry, reduces thenumber of staff needed and ensures consistency of data. Employees canalso access payroll, benefits and HR information more easily and quickly.
8.34 Paying employees electronically reduces payroll processing timeand costs and increases employee productivity. It eliminates the timeand expense associated with issuing paper cheques and reduces potentialfor lost, stolen or fraudulent cheques.
8.35 Better practice organisations have replaced paper with electronicmessaging for time and attendance reporting. Paperless reportingminimises redundant data entry and shortens payroll processing time.
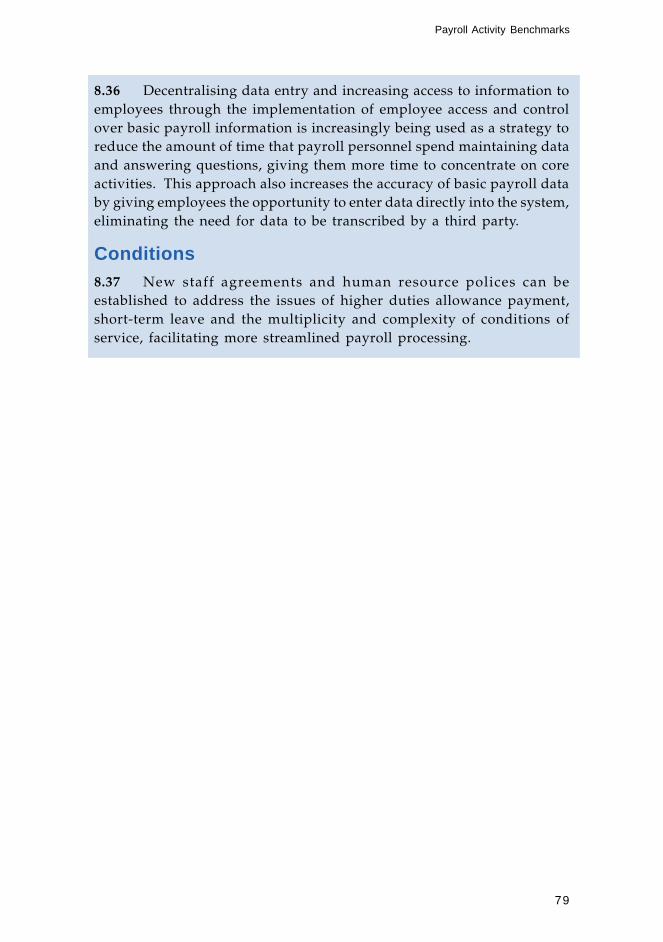
79
8.36 Decentralising data entry and increasing access to information toemployees through the implementation of employee access and controlover basic payroll information is increasingly being used as a strategy toreduce the amount of time that payroll personnel spend maintaining dataand answering questions, giving them more time to concentrate on coreactivities. This approach also increases the accuracy of basic payroll databy giving employees the opportunity to enter data directly into the system,eliminating the need for data to be transcribed by a third party.
Conditions8.37 New staff agreements and human resource polices can beestablished to address the issues of higher duties allowance payment,short-term leave and the multiplicity and complexity of conditions ofservice, facilitating more streamlined payroll processing.
Payroll Activity Benchmarks
80 Benchmarking the Finance Function
9 Travel Activity Benchmarks
Introduction9.1 Travel expenses are those costs incurred by organisations in havingemployees travel for business purposes. For most organisations, travelis the third largest controllable expense, after salaries and data processing(hardware and software) costs34. The nature of an organisation’s businessand its geographical spread will have a direct impact on the extent oftravel undertaken.
9.2 Travel expenses are derived from both direct and indirect sources.Direct travel expenses are the costs of tangible goods and services suchas airfare, hotel rooms, meals and car rentals. Indirect travel expensesare the administrative costs involved in managing travel, such as thecosts of processing expense reports, issuing reimbursements or advancesand paying travel-related bills. Only indirect travel costs are measuredin this benchmarking study. A primary business objective of the travelactivity is to be a low-cost provider and processor of travel activity relatedexpenses.
9.3 Travel administration is generally one of the smallest activitieswithin the Commonwealth Group with a median 3.5 per cent of the totalfinance budget. At the median travel processing staff account for4.54 per cent of the total finance function staffing, with individualorganisation staffing ranging between 0.1 and 19 FTEs.
9.4 The travel activity benchmarks selected by the ANAO addressthe dimensions of cost, efficiency and quality as set out in Table 9.1.
Table 9.1Travel Activity Benchmarks
Dimension Formula
Cost—Overall Total indirect travel activity cost / Total organisational expenditure
Cost—Per Activity Total indirect travel cost / Number of travel requisitions
Efficiency Total travel requisitions / Total travel FTEs
Better Practice Method of employee reimbursement
34 Arthur Andersen Global Best Practices® KnowledgeBase.

81
Cost Dimension Benchmarks9.5 The ANAO used two measures of cost of the travel activity. Thefirst captures travel activity cost at a global level and expresses this as apercentage of total organisational expenditure. As shown in Figure 9.1,the Commonwealth Group allocates between 0.003 and 0.826 per cent oftotal organisational expenditure to travel activity, indicating a relativelyhigh cost within the Commonwealth Group as a whole. On the otherhand, the Global Group allocates between 0.001 and 0.270 per cent oftotal organisational expenditure. It should be noted, however, that theorganisation that had a benchmark of 0.826 was substantially higher thanthe rest of the Commonwealth Group. If the outlying result is omittedthen the range of expenditure that the Commonwealth Group allocatesto the Travel activity is between 0.003 and 0.223 per cent which is verysimilar to the Global Group.
Figure 9.1Travel Activity Cost Benchmark—Overall Cost
Travel Activity Benchmarks
Formula Used: Total Indirect Travel Activity Cost / Total Organisational Expenditure
9.6 Although two organisations within the Commonwealth Grouphave benchmarks which fall within the Global Group’s lowest costquartile, almost three quarters of the Commonwealth Group havebenchmarks falling in the highest cost half of the Global Group. Thisindicates the potential for enhanced cost-efficiency. If the travel activitycosts of the finance function of those organisations in the CommonwealthGroup above the Group median were reduced to the median level, theresult would be a 21 per cent reduction in expenditure.
0.9%
Per
cnta
ge o
f Tot
alO
rgan
isat
iona
l Exp
endi
ture
Commonwealth Government Global
Highest Cost 25%
Middle 50%
Lowest Cost 25%
0.5%
0.6%
0.7%
0.8%
0.2%
0.3%
0.4%
0.0%
0.1% Median0.016%
Median0.035%

82 Benchmarking the Finance Function
9.7 The second benchmark of the travel activity utilised by the ANAOmeasures the travel activity cost per travel requisition processed. Theaverage cost per travel requisition, as illustrated in Figure 8.2, indicatesthat in relation to the travel processing activity, the median cost of theCommonwealth Group is some 50 per cent higher than that of the GlobalGroup. The range of costs however is smaller in the CommonwealthGroup (between $2.86 and $192.02) than the Global Group ($1.59 and$229.77). Furthermore, the highest result within the CommonwealthGroup ($192.02) was considerably greater than the one below it whichwas $94.53.
Figure 9.2Travel Activity Cost Benchmark—Cost/Travel Requisition
Formula Used: Total Indirect Travel Activity Cost / Number of Travel Requisitions
9.8 The ANAO notes that the administration of travel has beendecentralised within the Commonwealth Government in recent years,and consequently the activity cost benchmarks may not have capturedall costs. Any ‘hidden’ costs will add to the already high traveladministration costs revealed above.
9.9 The higher cost within the Commonwealth Group may beexplained in part by the differences in approach to travel administrationbetween the public and private sectors. For example, it is generally normalpractice in the Commonwealth to pay officers a ‘travel advance’ basedon the city to be visited and the duration of the visit. The advance isacquitted after the travel is completed, resulting in two administrativeprocesses for each trip. The use of an entitlement based reimbursementsystem that also has two administrative processes for each trip is becomingmore common.
Commonwealth Government Global
Highest Cost 25%
Middle 50%
Lowest Cost 25%
$250
$200
$150
$100
$50
$0
Cos
t / T
rave
l Req
uisi
tion
Median$26.52
Median$39.85

83
9.10 In the private sector, it is common practice for officers travellingto be reimbursed for actual travel costs (including incidentals) with ahigh utilisation of business charge cards. Charge cards for travel expensesare not widely used in Commonwealth organisations. As discussed inthe Better Practice Observations beginning at paragraph 9.20, improvedefficiency in travel administration may be delivered by the review of anorganisation’s travel policies.
9.11 The higher cost within the Commonwealth Group may beexplained in part by the differences in approach to travel administrationbetween the public and private sectors. The Commonwealth traditionallypaid officers a travel allowance which usually involved detailedcalculations. For some travel (for example overseas) there was anallowance given which was required to be acquitted following completionof the travel. In the private sector, it is common practice for officerstravelling to be reimbursed for actual travel costs (including incidentals)with a high utilisation of corporate charge cards. This system generallyinvolves fewer resources in terms of processing. Charge cards for travelexpenses have not been widely used in Commonwealth organisationsbut the rate of usage is increasing. As discussed in the Better PracticeObservations beginning at paragraph 9.20, improved efficiency in traveladministration may be delivered by organisations re-engineering theirtravel processes.
Efficiency Dimension Benchmark9.12 The ANAO obtained data on the number of travel requisitionsprocessed per FTE to provide an indicator of efficiency by providing ameasure of employee output and productivity.
9.13 The benchmarking results, set out in Figure 9.3, suggest thatCommonwealth Group travel processing is relatively inefficient whencompared with the Global Group. Almost three-quarters of theorganisations in the Commonwealth Group have efficiency benchmarkswhich fall within the Global Group’s least efficient quartile and only oneof the Commonwealth Group had a result of over 10,000 travel requisitionsprocessed per FTE.
Travel Activity Benchmarks

84 Benchmarking the Finance Function
Figure 9.3Travel Activity Efficiency Benchmark—Travel Requisitions/FTE
Formula Used: Total Travel Requisitions / Total Travel FTEs / Number of Travel Requisitions
Better Practice Benchmark9.14 The benchmark performance of the Commonwealth Group maybe indicative of the decentralised nature of travel processing managementwithin the Commonwealth Group, and/or the complexities of the travelprocesses of organisations.
9.15 The ANAO used the benchmark of reimbursement of travelthrough payroll as an indicator of better practice. The practice of payingtravel reimbursements through the payroll system minimises transactionprocessing and results in reduced employee reimbursement processingcosts, turnaround time and employee effort.
9.16 The Commonwealth Group’s use of the payroll system to reimbursetravel expenses is similar to the Global Group, as illustrated in Figure 9.4following.
Most Efficient 25%
Middle 50%
Least Efficient 25%
Commonwealth Government Global
40,000
30,000
20,000
10,000
0
Req
uisi
tions
/ T
rave
l FT
E
Median5338Median
1711

85
Figure 9.4Travel Activity Better Practice—Reimbursement through Payroll
Travel Activity Benchmarks
Formula Used: Method of Employee Reimbursement
9.17 The Commonwealth Group reported that the ‘other’ methods ofpayment of travel reimbursements included direct deposit into theofficer ’s bank account via electronic funds transfer through accountspayable (which is similar to the above process) and cash.
Conclusion9.18 The benchmarking of travel administration activity indicates theCommonwealth Group spends both a higher proportion of its totalexpenditure on the travel activity and has a higher average cost per travelrequisition than the Global Group. The Commonwealth Group alsoperform less favourably in terms of efficiency based on the selectedmeasure of efficiency. The Commonwealth Group does however, farewell in relation to the use of reimbursement through payroll and directdeposit.
9.19 These findings are supported by Audit Report No.19 Managementof Public Sector Travel Arrangements—Follow Up Audit published by theANAO in December 2000. The audit objective was to ascertain the extentof implementation of the previous audit recommendations and betterpractice principles and whether organisations were managing travelefficiently and effectively. The audit concluded that organisations havetaken only limited action to reengineer their travel management processes.
Cheque
Other
Payroll
Commonwealth Government Global
100%
66%
17%
17%
17%
77%
6%
75%
50%
25%
0%
86 Benchmarking the Finance Function
Better Practice Observations 35
9.20 The ANAO issued the Public Sector Travel Better Practice Guide inDecember 199736 outlining many better practices that may result insignificant improvement in the administration of travel. These includedthe mandating the use of a multi-purpose, employer-sponsored chargecard for travel related expenditure and the implementation of fullyautomated travel booking, approval and expense processing.
9.21 The following paragraphs outline some of the other betterpractices that have been adopted by organisations to deliver overallimprovement in the efficiency and effectiveness of the travel activity.
Organisational Structure9.22 As with certain other finance activities, a significant trend is themove toward centralised processing of travel, clearly distinguishingauthorisation devolution and processing centralisation.
9.23 The implementation of travel payments through the existingpayroll system is a better practice which will deliver consolidation andreduce duplication and cost. It also facilitates the opportunity for cross-skilling between travel and payroll processing personnel.
Technology9.24 Utilisation of a multipurpose corporate charge card may reduceindirect administrative costs of managing travel expenses and offer acomprehensive approach to payment, expense monitoring and processing,reimbursement and information management. These cards capturecorporate spending in detail which helps in monitoring travel policycompliance, forecasting travel budgets, collecting data on vendor usageand negotiating discounts with vendors.
9.25 Automation of travel booking, approval and expense processingcan lead to process efficiencies in organisations where business travel isa significant activity. The features of an automated system would include:
• electronic forms, preferably pre-populated with expense data fromcharge card transactions;
• built-in data completeness, accuracy and other integrity tests;
35 Australian National Audit Office Public Sector Travel Better Practice Guide December 1997,Arthur Andersen Global Best Practices® KnowledgeBase and Reengineering Australia.
36 Australian National Audit Office Public Sector Travel Better Practice Guide December 1997.

87
• integration with travel policy to highlight exceptions and seekexplanations; and
• electronic transmission to, and approval by, a supervisor, and then toaccounts area.
Travel Policy/Conditions9.26 Developing, communicating and enforcing a formal travel policyencompassing all aspects of the travel process provides the frameworkfor an efficient and effective travel process.
9.27 Undertaking regular risk assessments of business travel policiesand processes.
9.28 Consolidating corporate travel management and developing astrong relationship with a single travel agency may enable negotiationof better rates with airlines and other travel vendors, control of travelpolicy and preferred vendor usage.
9.29 Reducing the complexity of travel allowances and processes mayresult in improved processing efficiency—for example, by payment ofactual expenses in place of travel allowances for accommodation andmeals, utilisation of corporate charge cards with appropriate controlsand implementing pre-agreed arrangements with hotels or hotel chainswhere the organisation is directly billed for expenses.
9.30 Monitoring and reviewing contract performance through acomprehensive statement of performance measures covering all aspectsof business travel.
Travel Activity Benchmarks
88 Benchmarking the Finance Function
10. Billing Activity Benchmarks
Introduction10.1 The billing activity process includes creating customer billingaccounts, creating and sending invoices to customers, responding toinquiries, maintaining the billing system and providing collection-relatedreports to management. The main objective of the billing activity is toensure that all customers who purchase goods and services are sent acomplete and accurate bill or billing statement in a timely manner.
10.2 In the Commonwealth Group, only thirteen of the organisationsbenchmarked had billing activity information. Five organisationsindicated they did not have a billing activity and one other had a billingactivity that was almost negligible in staffing and funding.
10.3 In organisations within the Commonwealth Group that have abilling activity, this activity accounts for (at the median) only 2.4 per centof the total finance function budget. The relatively low significance ofthe billing activity is also supported by the number of billing FTEs withinthe Commonwealth Group where, at median, billing staff account for2.62 per cent of the total finance function staffing, with individualorganisation staffing ranging between 0.2 and 4.03 FTEs.
10.4 The cost, quality and better practice benchmarks selected by theANAO for the billing activity are shown in Table 10.1. There were noefficiency benchmarks available for the billing activity.
Table 10.1Billing Activity Benchmarks
Dimension Formula
Cost—Overall Total billing activity cost / Total organisational expenditure
Cost—Per Activity Total billing activity cost / Number of annual invoices issued
Quality—Error Rate Number of customer invoices adjusted / Total number of customerinvoices issued
Quality—Time Average elapsed time between service provision and invoicing
Better Practice Percentage utilisation of EDI for billing
Cost Dimension Benchmarks10.5 The ANAO used two measures of cost of the billing activity. Thefirst captures the billing cost at a global level and expresses this as apercentage of total organisational expenditure.

89
Billing Activity Benchmarks
Formula Used: Total Billing Activity Cost / Total Organisational Expenditure
10.7 Half of the fourteen Commonwealth Group with a billing activityhave overall cost benchmarks which place them within the Global Group’slowest cost quartile and no Commonwealth Group organisation had anoverall cost benchmark which placed it in the Global Group’s highestcost quartile.
10.8 Although the Commonwealth Group has an overall better resultthan the Global Group, there is still potential for improving cost-efficiencywithin the Commonwealth. If the billing costs of those organisations inthe Commonwealth Group above the Group median were reduced tothe median level, then expenditure reductions of some 12 per cent of thebilling activity cost for the Commonwealth Group would result.
10.9 The ANAO observed that the Commonwealth Group with thelowest overall cost benchmark had outsourced it’s billing activityalthough, as noted subsequently in this chapter, this organisation alsohad a high error rate.
10.10 The second billing activity cost benchmark measures the billingactivity cost per invoice issued. As illustrated in Figure 10.2, the billingcost per invoice for the Commonwealth Group ranged between $5.88and $213.14, compared with $0.10 and $77.72 in the Global Group. Therange for the Commonwealth Group has been affected by two
Highest Cost 25%
Middle 50%
Lowest Cost 25%
Commonwealth Government Global
Per
cent
age
of T
otal
Org
anis
atio
nal E
xpen
ditu
re
1.0%
0.8%
0.6%
0.4%
0.2%
0.0%
Median0.118%
Median0.087%
10.6 As illustrated in Figure 10.1, the Commonwealth Group allocatesbetween 0.002 and 0.248 per cent of total organisational expenditure tobilling activity, with the lowest cost quartile ranging between 0.002 and0.015 per cent. In comparison, the Global Group allocates between 0.002and 0.978 per cent of total organisational expenditure to their billingactivity.
Figure 10.1Billing Activity Overall Cost Benchmark—Overall Cost

90 Benchmarking the Finance Function
organisations that had results substantially higher than the rest of theCommonwealth Group. The two highest results were $213.14 and $170.20,while the next highest result was $67.83. If these two outlying resultsare excluded from the range, then the range for the Commonwealth Groupbecomes $5.88 to $67.83, which is more in line with the Global Group.
Figure 10.2Billing Activity Cost Benchmark—Cost / Customer Invoice Issued
Formula Used: Total Billing Activity Cost / Number of Annual Invoices Issued
10.11 The Commonwealth Group does not perform well in thisbenchmark in comparison to the Global Group. No Commonwealth Grouporganisation possesses an average billing cost per invoice benchmarkwhich place it in the Global Group’s lowest cost quartile. Furthermore,over half of the Commonwealth Group have benchmarks which placethem in the Global Group’s highest cost quartile and the Commonwealthmedian cost is 2.75 times that of the Global Group.
10.12 A reason for the high relative cost may be found in the relativesmall sizes of the Commonwealth billing activities and the consequentinability to achieve economies of scale.
Quality Dimension Benchmarks10.13 The ANAO used two measures of billing quality. The first assessesthe error rate through the total number of adjustments as a percentageof total customer invoices issued, providing an insight about the accuracyof customer bills. The benchmark is illustrated in Figure 9.3, revealing amedian error rate of 3.40 per cent in the Commonwealth Group comparedwith a Global median error rate of 2.18 per cent.
Highest Cost 25%
Middle 50%
Lowest Cost 25%
Commonwealth Government Global
Cos
t/Cus
tom
er In
voic
e Is
sued
$225
$200
$150
$125
$100
$75
$50
$25
$-
$175
Median$11.76
Median$32.34
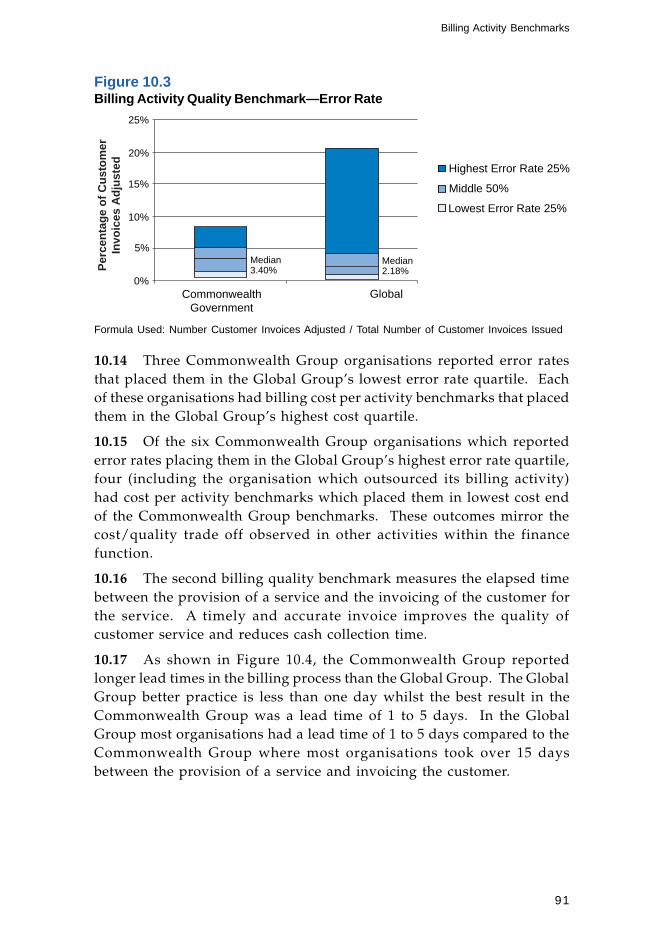
91
Figure 10.3Billing Activity Quality Benchmark—Error Rate
Billing Activity Benchmarks
Formula Used: Number Customer Invoices Adjusted / Total Number of Customer Invoices Issued
10.14 Three Commonwealth Group organisations reported error ratesthat placed them in the Global Group’s lowest error rate quartile. Eachof these organisations had billing cost per activity benchmarks that placedthem in the Global Group’s highest cost quartile.
10.15 Of the six Commonwealth Group organisations which reportederror rates placing them in the Global Group’s highest error rate quartile,four (including the organisation which outsourced its billing activity)had cost per activity benchmarks which placed them in lowest cost endof the Commonwealth Group benchmarks. These outcomes mirror thecost/quality trade off observed in other activities within the financefunction.
10.16 The second billing quality benchmark measures the elapsed timebetween the provision of a service and the invoicing of the customer forthe service. A timely and accurate invoice improves the quality ofcustomer service and reduces cash collection time.
10.17 As shown in Figure 10.4, the Commonwealth Group reportedlonger lead times in the billing process than the Global Group. The GlobalGroup better practice is less than one day whilst the best result in theCommonwealth Group was a lead time of 1 to 5 days. In the GlobalGroup most organisations had a lead time of 1 to 5 days compared to theCommonwealth Group where most organisations took over 15 daysbetween the provision of a service and invoicing the customer.
25%
Highest Error Rate 25%
Middle 50%
Lowest Error Rate 25%
CommonwealthGovernment
Global
Per
cent
age
of C
usto
mer
Invo
ices
Adj
uste
d
20%
15%
10%
5%
0%
Median2.18%
Median3.40%

92 Benchmarking the Finance Function
Figure 10.4Billing Activity Quality Benchmark—Elapsed Time to Invoicing
Formula Used: Average Elapsed Time between Service Provision and Invoicing
Better Practice Benchmark10.18 The billing better practice benchmark assesses the utilisation ofelectronic data interchange (EDI) for billing activities. EDI allows anorganisation to transmit bills electronically to customers and contributesto process efficiency and lower error rates.
10.19 None of the Commonwealth Group utilises EDI for billingpurposes offering opportunity for process and service improvement. Aspart of the Commonwealth Government’s information economyframework37, one of the ten key strategic on-line priorities is to implementa world class model for delivery of all appropriate government serviceson-line by 2001. In its 1999 performance audit report into electronicservice delivery38, the ANAO noted that although organisations weregenerally well positioned to achieve the Government’s target, there wasstill considerable work required. While this benchmarking study doesnot identify the progress of the benchmarked Commonwealthorganisations towards implementation of EDI for billing purposes, it doeshighlight the requirement for them to ensure appropriate steps are beingtaken to achieve the on-line goal by the target date.
33.33%
25.00%
25.00%
16.67%
8.70%
9.49%
10.28%
11.86%
59.68%
0% 10% 20% 30% 40% 50% 60%
>15 Days
11-15 Days
6-10 Days
1-5 Days
<1 Day
Commonwealth Government
Ela
psed
Tim
e B
etw
een
Ser
vice
Pro
visi
on &
Invo
icin
g
Global
37 Commonwealth Government Strategic Framework for the Information Economy, December 1998.38 Australian National Audit Office Audit Report No.18 of 1999–2000 Electronic Service Delivery,
including Internet Use, by Commonwealth Government Agencies.

93
Conclusion10.20 In comparison with the Global Group, the Commonwealth Grouphad a lower overall cost but had a higher cost per customer invoice issuedand a higher error rate (at the median). While, in particular organisations,high costs can be contrasted with low error rates, this is not the case forthe Commonwealth Group population as a whole.
10.21 Coupled with the longer elapsed duration to invoice, thebenchmarks indicate that the overall performance of the CommonwealthGroup is lower than the Global Group, perhaps due to the relativelysmall size of the billing activity within the benchmarked Commonwealthorganisations.
Better Practice Observations 39
10.22 The following paragraphs outline some of the better practices thathave been adopted by organisations to deliver overall improvement inthe efficiency and effectiveness of the billing activity.
10.23 The ANAO notes that some Commonwealth organisations havealready adopted better practices in the billing administration activitybut the discussion is provided for the benefit of all organisations wishingto implement higher performing internal finance functions.
10.24 The adoption of better practices in Commonwealth organisationsmay lead to substantial improvement in the billing administration activity,particularly in the areas of centralised processing and appropriatetechnology utilisation.
Organisational10.25 Improvements in communications and accuracy may reduce thepercentage of billing adjustments processed. Enhanced communicationsbetween the customer and organisation—as well as between theorganisation’s own internal order processing, billing and customer inquiryprocesses—will enable complaints and errors to be resolved in a moretimely manner. An emphasis on billing accuracy can be achieved byautomating the billing system and implementing validation and editchecks, as well as by monitoring variances from norms at key pointsthroughout the process.
Billing Activity Benchmarks
39 Arthur Andersen Global Best Practices® KnowledgeBase and Reengineering Australia.

94 Benchmarking the Finance Function
Technology10.26 Better practice organisations automate the billing system andintegrate it with other organisational or customer systems. Also, real-time interaction between order processing and billing will reduce thetime lag between in billing. Organisations that tailor billing to meet thespecific needs of customers (e.g., bill once a week, month) may encounterlonger elapsed times between performance and billing, and have thuschosen to sacrifice collection time and cash flow in the interest of customerservice.
10.27 EDI allows an organisation to transmit bills electronically tocustomers. While EDI is increasingly more common and is widelyaccepted as better practice, it is restricted by the technology limitationsof either the organisation or the customer. The implementation of EDImay result in reduced:
• paperwork and processing time;
• number of billing personnel;
• billing errors and inaccuracies; and
• duplication of activities.

95
11. Tax Activity Benchmarks
Introduction11.1 A primary business objective of the tax activity is to ensure propercompliance with tax laws while seeking to minimise organisation-widetaxes.
11.2 The business tax activity is one of the least significant of theCommonwealth Group’s financial activities. The tax activity in theCommonwealth Group accounts at the median for only 1 per cent of thetotal finance operating budget. Tax staff in the Commonwealth Groupaccount for 0.9 per cent of the total finance function staffing, with staffingin individual organisations ranging between 0.11 and 1.25 FTEs.
11.3 The cost benchmark selected by the ANAO for the tax activity isset out in Table 11.1. No efficiency or quality benchmarks were selectedfor review because of the low materiality of the activity and the absenceof useful comparators across jurisdictions and between the public andprivate sectors.
Table 11.1Tax Activity Benchmark
Dimension Formula
Cost—Overall Total tax activity cost / Total organisational expenditure
Cost Dimension Benchmark11.4 The overall cost benchmark for the tax accounting activity capturesthe total tax cost for the organisation and expresses this as a percentageof total organisational expenditure. The benchmarking results aresummarised in Figure 11.1. At the median the Commonwealth Groupspends approximately half what the Global Group spends on the taxaccounting activity. This result is most likely due to the significantlylower level of tax management required in the public sector at the timeof the benchmarking study.
11.5 The Commonwealth Group allocates between 0.003 and 0.720 percent of total organisational expenditure to tax activity, with the lowestcost quartile ranging between 0.001 and 0.005 per cent. In comparisonthe Global Group allocates between 0.001 and 0.144 per cent of totalorganisational expenditure.
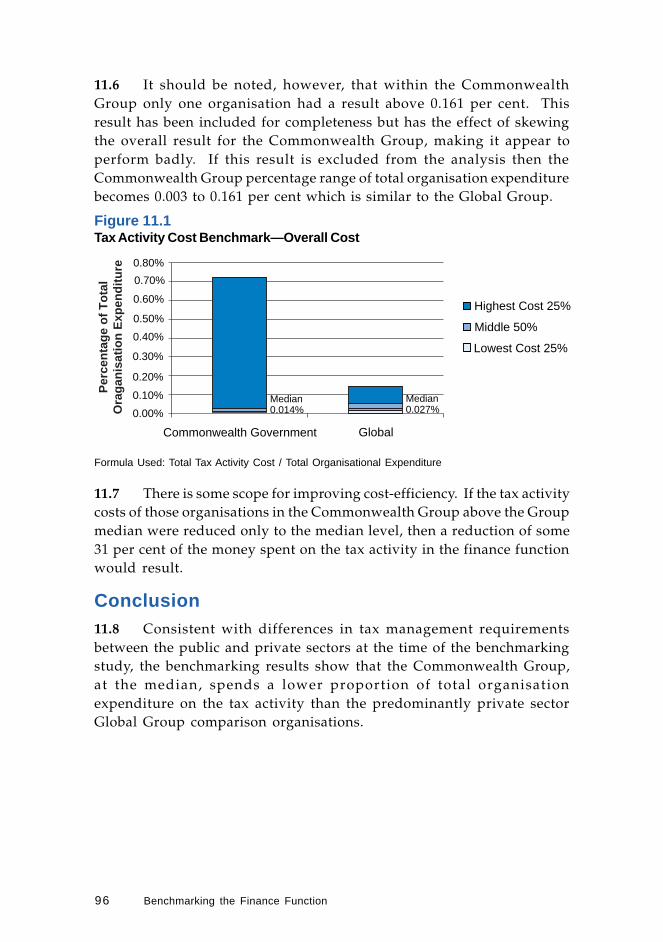
96 Benchmarking the Finance Function
11.6 It should be noted, however, that within the CommonwealthGroup only one organisation had a result above 0.161 per cent. Thisresult has been included for completeness but has the effect of skewingthe overall result for the Commonwealth Group, making it appear toperform badly. If this result is excluded from the analysis then theCommonwealth Group percentage range of total organisation expenditurebecomes 0.003 to 0.161 per cent which is similar to the Global Group.
Figure 11.1Tax Activity Cost Benchmark—Overall Cost
Formula Used: Total Tax Activity Cost / Total Organisational Expenditure
11.7 There is some scope for improving cost-efficiency. If the tax activitycosts of those organisations in the Commonwealth Group above the Groupmedian were reduced only to the median level, then a reduction of some31 per cent of the money spent on the tax activity in the finance functionwould result.
Conclusion11.8 Consistent with differences in tax management requirementsbetween the public and private sectors at the time of the benchmarkingstudy, the benchmarking results show that the Commonwealth Group,at the median, spends a lower proportion of total organisationexpenditure on the tax activity than the predominantly private sectorGlobal Group comparison organisations.
Highest Cost 25%
Middle 50%
Lowest Cost 25%
Commonwealth Government Global
0.00%
0.10%
0.20%
0.30%
0.40%
0.50%
0.60%
0.80%
Per
cent
age
of T
otal
Ora
gani
satio
n E
xpen
ditu
re 0.70%
Median0.027%
Median0.014%

97
Better Practice Observations 40
11.9 The following paragraphs outline some of the better practices thathave been adopted by organisations to deliver overall improvement inthe efficiency and effectiveness of the tax activity. These will becomeincreasingly relevant as administrative effort on managing the Goodsand Services Tax becomes better known.
11.10 Traditionally, the main focus of the tax activity has been oncompliance. Best practice companies maximise the use of technology toreduce the time spent on compliance and administration and to redirectresources to planning, research and customer service activities.
11.11 Tax planning should become part of an organisation’s businessstrategy. The tax implications of all business decisions should be assessedas those decisions are being made.
11.12 Regular communications regarding tax issues keeps employeesinformed of tax issues that can affect their job. Information should bereadily available and easy to access (eg. through providing a single pointof contact for all tax inquiries).
Canberra, ACT P. J. Barrett22 December 2000 Auditor-General
Tax Activity Benchmarks
40 Arthur Andersen Global Best Practices® KnowledgeBase.

98 Benchmarking the Finance Function

99
Appendices

100 Benchmarking the Finance Function

101
Appendix 1
Benchmark Demographic Profiles
Demographic Profile Commonwealth Group Global Group
Number of organisations 19 507
Geographic locations Australia (19) Australia (26), Europe (189),UK (11), USA (228), Asia (3),
NZ (8), Canada (13), Brazil (29)
Industry Federal Government (19) Manufacturing (223),Consumer Products (111),Commercial Services (43),Utilities (54), Financial (11),
Real Estate (7),Insurance (12), Health (8),
Non-profit/Government (23),Unspecified (15)
Total Revenues (AU$) 11 852 954 932 1 096 219 173 410
Average Revenue (AU$) 623 839 733 2 246 350 765
Revenue Range (AU$) 12 039 000 — 362 091—96 567 334 3103 406 903 036
Total Employees 46 789 2 686 513
Average Employees 2463 5416
Range of Number of 94—22 641 4—852 043Employees
Appendices
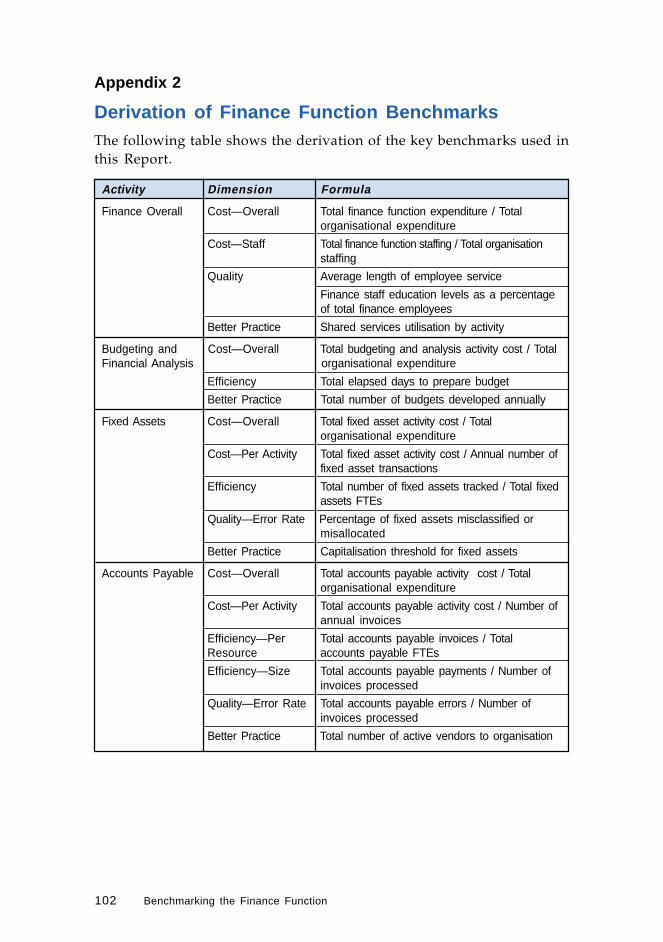
102 Benchmarking the Finance Function
Appendix 2
Derivation of Finance Function BenchmarksThe following table shows the derivation of the key benchmarks used inthis Report.
Activity Dimension Formula
Finance Overall Cost—Overall Total finance function expenditure / Totalorganisational expenditure
Cost—Staff Total finance function staffing / Total organisationstaffing
Quality Average length of employee service
Finance staff education levels as a percentageof total finance employees
Better Practice Shared services utilisation by activity
Budgeting and Cost—Overall Total budgeting and analysis activity cost / TotalFinancial Analysis organisational expenditure
Efficiency Total elapsed days to prepare budget
Better Practice Total number of budgets developed annually
Fixed Assets Cost—Overall Total fixed asset activity cost / Totalorganisational expenditure
Cost—Per Activity Total fixed asset activity cost / Annual number offixed asset transactions
Efficiency Total number of fixed assets tracked / Total fixedassets FTEs
Quality—Error Rate Percentage of fixed assets misclassified ormisallocated
Better Practice Capitalisation threshold for fixed assets
Accounts Payable Cost—Overall Total accounts payable activity cost / Totalorganisational expenditure
Cost—Per Activity Total accounts payable activity cost / Number ofannual invoices
Efficiency—Per Total accounts payable invoices / TotalResource accounts payable FTEs
Efficiency—Size Total accounts payable payments / Number ofinvoices processed
Quality—Error Rate Total accounts payable errors / Number ofinvoices processed
Better Practice Total number of active vendors to organisation

103
Activity Dimension Formula
‘Close the Books’ Cost—Overall Total ‘close the books’ activity cost / Totalorganisational expenditure
Quality—Error Rate Total number of error correction journals / Totalnumber of journals
Better Practice Number of hard closes in excess ofrequirements
Accounts Cost—Overall Total accounts receivable activity cost / TotalReceivable organisational expenditure
Cost—Per Activity Total accounts receivable activity cost / Totalcredit activity
Efficiency Total number of remittances / Total accountsreceivable FTEs
Quality—Error Rate Total remittance errors / Total number ofremittances
Quality—Error Rate Total remittances matched first time / Totalremittances
Better Practice Elapsed days between customer invoicing andreceipt of payment
Payroll Cost—Overall Total payroll activity cost / Total organisationalexpenditure
Cost—Per Activity Total payroll activity cost / Annual number ofpays
Efficiency Total number of pays annually / Payroll activityFTEs
Quality—Error Rate Total number of pays with errors / Total numberof pays annually
Better Practice Payroll / Human Resources System Integration/ Interface
Total staff using direct debit / Total staff
Travel Cost—Overall Total indirect travel activity cost / Totalorganisational expenditure
Cost—Per Activity Total indirect travel cost / Number of travelrequisitions
Efficiency Total travel requisitions / Total travel FTEs
Better Practice Method of employee reimbursement
Appendices
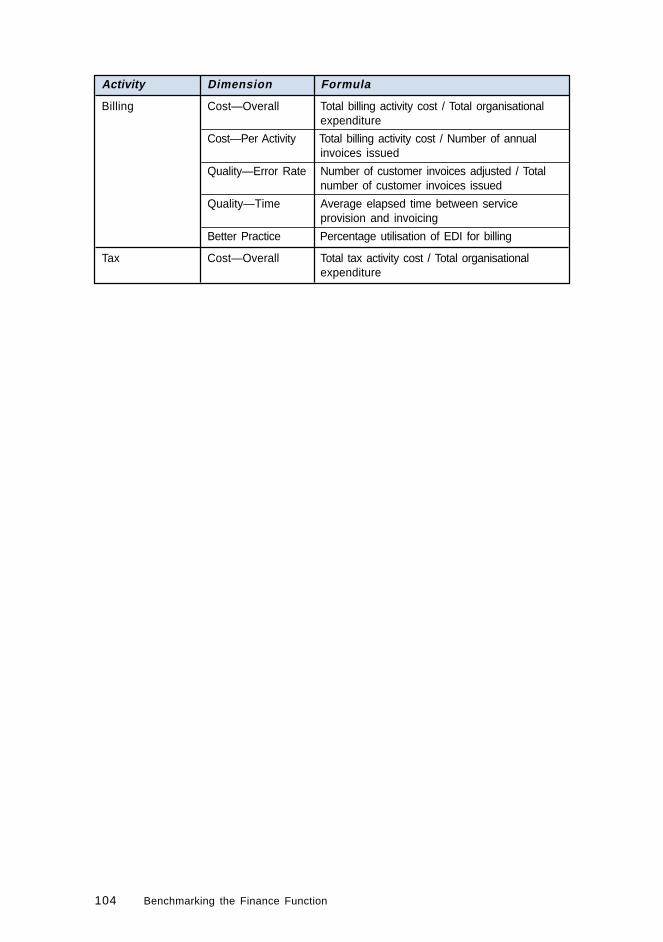
104 Benchmarking the Finance Function
Activity Dimension Formula
Billing Cost—Overall Total billing activity cost / Total organisationalexpenditure
Cost—Per Activity Total billing activity cost / Number of annualinvoices issued
Quality—Error Rate Number of customer invoices adjusted / Totalnumber of customer invoices issued
Quality—Time Average elapsed time between serviceprovision and invoicing
Better Practice Percentage utilisation of EDI for billing
Tax Cost—Overall Total tax activity cost / Total organisationalexpenditure
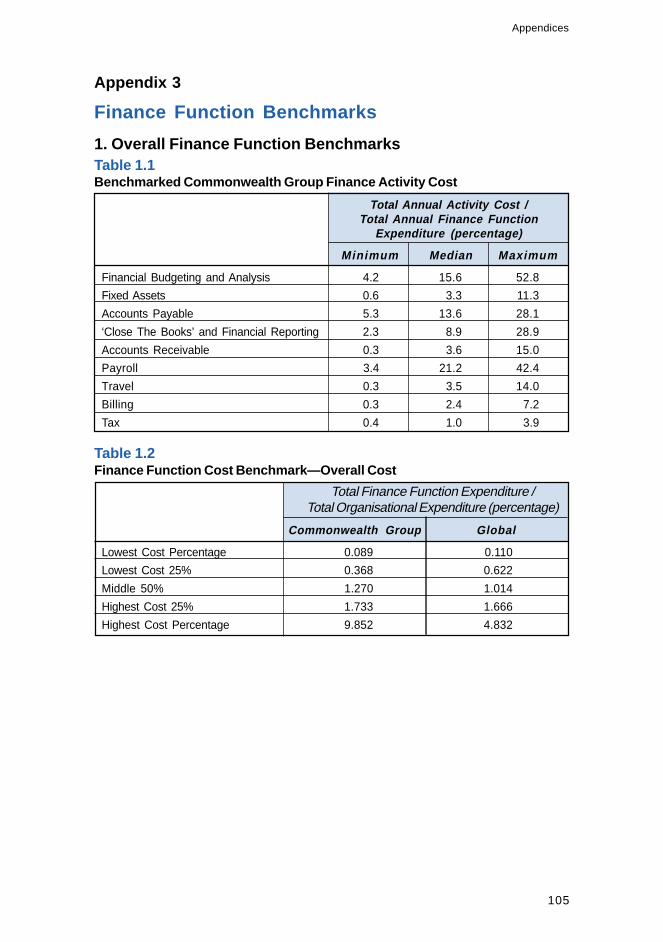
105
Appendix 3
Finance Function Benchmarks
1. Overall Finance Function BenchmarksTable 1.1Benchmarked Commonwealth Group Finance Activity Cost
Total Annual Activity Cost /Total Annual Finance Function
Expenditure (percentage)
Minimum Median M aximum
Financial Budgeting and Analysis 4.2 15.6 52.8
Fixed Assets 0.6 3.3 11.3
Accounts Payable 5.3 13.6 28.1
‘Close The Books’ and Financial Reporting 2.3 8.9 28.9
Accounts Receivable 0.3 3.6 15.0
Payroll 3.4 21.2 42.4
Travel 0.3 3.5 14.0
Billing 0.3 2.4 7.2
Tax 0.4 1.0 3.9
Table 1.2Finance Function Cost Benchmark—Overall Cost
Total Finance Function Expenditure /Total Organisational Expenditure (percentage)
Commonwealth Group G lobal
Lowest Cost Percentage 0.089 0.110
Lowest Cost 25% 0.368 0.622
Middle 50% 1.270 1.014
Highest Cost 25% 1.733 1.666
Highest Cost Percentage 9.852 4.832
Appendices

106 Benchmarking the Finance Function
Table 1.3Finance Function Cost Benchmark—Staffing
Total Finance Function Expenditure /Total Organisational Expenditure (percentage)
Commonwealth Group G lobal
Lowest Finance Staff per 0.72 0.17Organisational Staff Percentage
Lowest Finance Staff 25% 1.99 2.35
Middle 50% 3.50 3.75
Highest Finance Staff 25% 4.96 5.58
Highest Finance Staff per 12.38 13.33Organisational Staff Percentage
Table 1.4Finance Function Quality Benchmark—Staff Retention
Average Length of Employee Service (years)
Commonwealth Group Global
Longest Length of Service 18.8 24.0
Longest Length of Service 25% 6.9 11.4
Middle 50% 5.0 8.0
Shortest Length of Service 25% 3.0 5.0
Shortest Length of Service 1.0 0.6
Table 1.5Finance Function Quality Benchmark—Staff Qualifications
Finance Staff Education as a Percentage ofTotal Finance Staff
Management Staff
Commonwealth Global Commonwealth GlobalGroup Group
Educational Qualification
Accounting Degree 20.44 25.31 13.09 37.84
CPA 42.44 34.33 9.17 7.86
MBA 1.27 17.16 1.50 2.79
CPA and MBA 0.00 4.45 0.00 0.00
None of the above 35.85 18.67 76.24 50.86
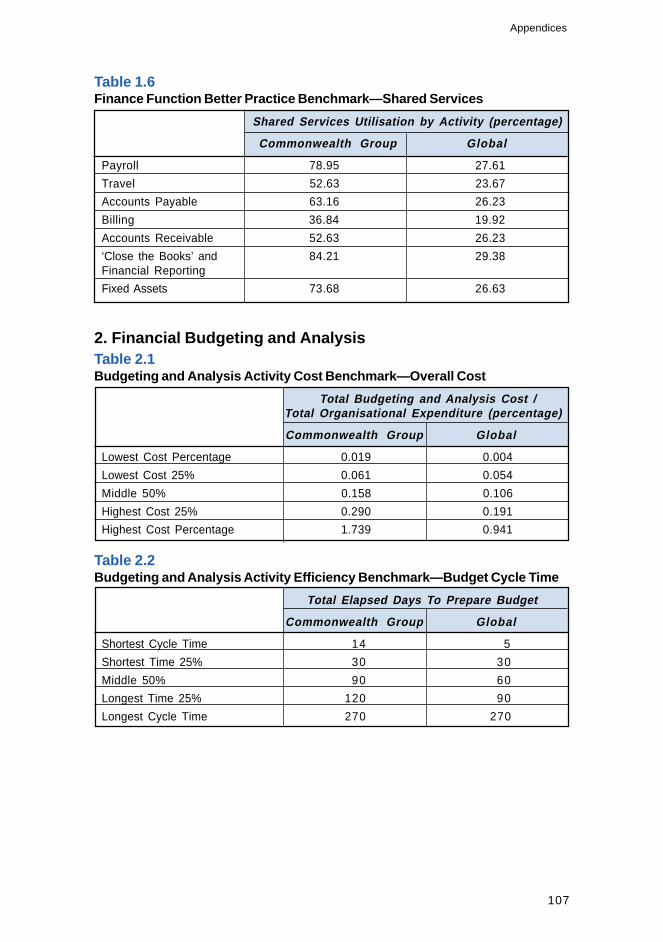
107
Table 1.6Finance Function Better Practice Benchmark—Shared Services
Shared Services Utilisation by Activity (percentage)
Commonwealth Group Global
Payroll 78.95 27.61
Travel 52.63 23.67
Accounts Payable 63.16 26.23
Billing 36.84 19.92
Accounts Receivable 52.63 26.23
‘Close the Books’ and 84.21 29.38Financial Reporting
Fixed Assets 73.68 26.63
2. Financial Budgeting and AnalysisTable 2.1Budgeting and Analysis Activity Cost Benchmark—Overall Cost
Total Budgeting and Analysis Cost /Total Organisational Expenditure (percentage)
Commonwealth Group Global
Lowest Cost Percentage 0.019 0.004
Lowest Cost 25% 0.061 0.054
Middle 50% 0.158 0.106
Highest Cost 25% 0.290 0.191
Highest Cost Percentage 1.739 0.941
Table 2.2Budgeting and Analysis Activity Efficiency Benchmark—Budget Cycle Time
Total Elapsed Days To Prepare Budget
Commonwealth Group Global
Shortest Cycle Time 14 5
Shortest Time 25% 30 30
Middle 50% 90 60
Longest Time 25% 120 90
Longest Cycle Time 270 270
Appendices

108 Benchmarking the Finance Function
Table 2.3Budgeting and Analysis Activity Better Practice Benchmark—Number ofAnnual Budgets
Total Number of Budgets Developed Annually
Commonwealth Group Global
Least Annual Budgets 1 1
Least Budgets 25% 2 3
Middle 50% 4 4
Most Budgets 25% 12 12
Most Annual Budgets 20 33
3. Fixed Assets Activity BenchmarksTable 3.1Fixed Asset Activity Cost Benchmark—Overall Cost
Total Fixed Asset Activity Cost /Total Organisational Expenditure (percentage)
Commonwealth Group Global
Lowest Cost Percentage 0.003 0.001
Lowest Cost 25% 0.018 0.010
Middle 50% 0.040 0.020
Highest Cost 25% 0.063 0.036
Highest Cost Percentage 0.167 0.146
Table 3.2Fixed Asset Activity Cost Benchmark—Cost / Fixed Asset Transaction
Total Fixed Asset Activity Cost /Annual Number of Fixed Asset Transactions
Commonwealth Group Global$ $
Lowest Cost Percentage 1 0
Lowest Cost 25% 28 14
Middle 50% 46 40
Highest Cost 25% 80 114
Highest Cost Percentage 1464 487

109
Table 3.3Fixed Assets Activity Efficiency Benchmark—Fixed Assets Tracked /FTE
Total Number of Fixed Assets Tracked /Total Fixed Assets FTE (numbers)
Commonwealth Group Global
Most Fixed Assets/FTE 11 429 50 000
Most Efficient 25% 5437 15 000
Middle 50% 3502 8353
Least Efficient 25% 2197 4762
Least Fixed Assets/FTE 297 100
Table 3.4Fixed Assets Activity Quality Benchmark—Error Rates
Percentage of Fixed Assets that areMisallocated or Misclassified (percentage)
Commonwealth Group Global
Lowest Error Rate 0.00 0.00
Lowest Error Rate 25% 0.88 0.05
Middle 50% 1.00 1.00
Highest Error Rate 25% 2.00 2.00
Highest Error Rate 50.00 10.00
Table 3.5Fixed Assets Activity Better Practice Benchmark—Capitalisation Threshold
Capitalisation Threshold for Fixed Assets
Commonwealth Group Global$ $
Highest Capitalisation Threshold 2000 16 284
Highest Capitalisation Threshold 25% 2000 4071
Middle 50% 2000 1628
Lowest Capitalisation Threshold 25% 1500 814
Lowest Capitalisation Value 500 2
Appendices

110 Benchmarking the Finance Function
4. Accounts Payable Activity BenchmarksTable 4.1Accounts Payable Activity Cost Benchmark—Overall Cost
Total Accounts Payable Activity Cost / Total Organisational Expenditure (percentage)
Commonwealth Group Global
Lowest Cost Percentage 0.007 0.005
Lowest Cost 25% 0.080 0.071
Middle 50% 0.164 0.120
Highest Cost 25% 0.314 0.192
Highest Cost Percentage 0.870 0.350
Table 4.2Accounts Payable Activity Cost Benchmark—Cost / Invoice
Total Accounts Payable Activity Cost /Number of Annual Invoices
Commonwealth Group Global$ $
Lowest Cost Percentage 9.51 0.83
Lowest Cost 25% 14.23 6.74
Middle 50% 18.88 10.99
Highest Cost 25% 28.11 26.10
Highest Cost Percentage 86.90 116.92
Table 4.3Accounts Payable Activity Efficiency Benchmarks—Processed Invoices / FTE
Total Accounts Payable Invoices /Total Accounts Payable FTEs (numbers)
Commonwealth Group Global
Most Invoices/FTE 12 960 50 000
Most Efficient 25% 4977 11 313
Middle 50% 3667 7412
Least Efficient 25% 2758 5068
Least Invoices/FTE 725 344

111
Table 4.4Accounts Payable Activity Efficiency Benchmark—Average Payment
Total Accounts Payable Payments /Number of Invoices Processed
Commonwealth Group Global$ $
Largest Average Payment 83 991 161 360
Largest Payment 25% 27 271 47 589
Middle 50% 9224 13 167
Smallest Payment 25% 5520 5230
Smallest Average Payment 1240 8
Table 4.5Accounts Payable Activity Quality Benchmark—Error Rates
Total Accounts Payable Errors /Number of Invoices Processed (percentage)
Commonwealth Group Global
Lowest Errors/Payment 0.07 0.05
Lowest Error Rate 25% 0.70 0.98
Middle 50% 1.52 2.74
Highest Error Rate 25% 3.07 8.16
Highest Errors/Payment 6.09 34.35
Table 4.6Accounts Payable Activity Better Practice Benchmarks—Number of ActiveVendors
Total Number of Active Vendors toOrganisation
Commonwealth Group Global
Least Active Vendors 827 132
Least Active Vendors 25% 2966 1000
Middle 50% 5457 2251
Most Active Vendors 25% 10 682 5909
Most Active Vendors 89 174 30 000
Appendices
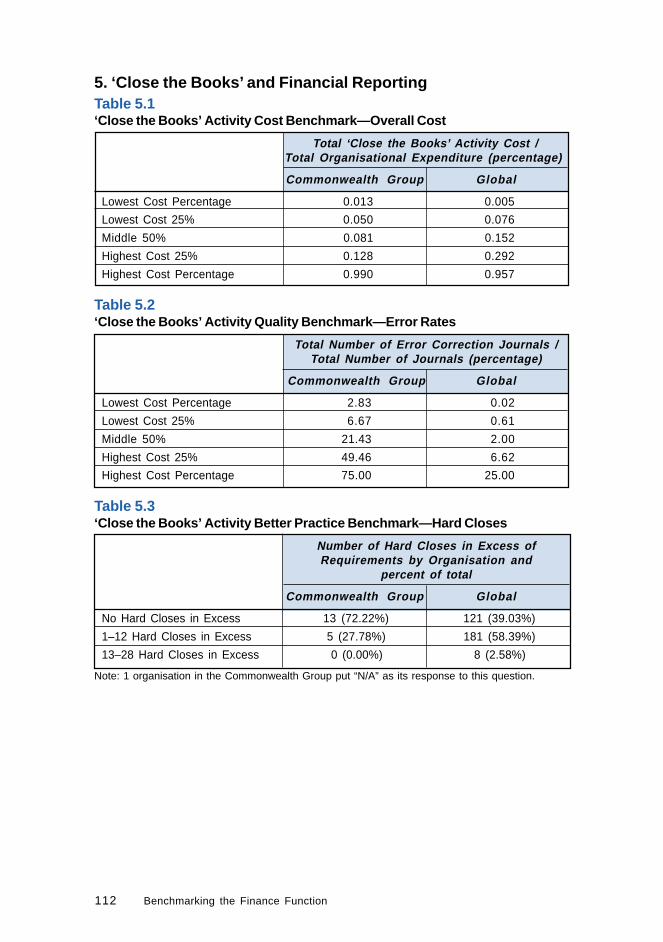
112 Benchmarking the Finance Function
5. ‘Close the Books’ and Financial ReportingTable 5.1‘Close the Books’ Activity Cost Benchmark—Overall Cost
Total ‘Close the Books’ Activity Cost /Total Organisational Expenditure (percentage)
Commonwealth Group Global
Lowest Cost Percentage 0.013 0.005
Lowest Cost 25% 0.050 0.076
Middle 50% 0.081 0.152
Highest Cost 25% 0.128 0.292
Highest Cost Percentage 0.990 0.957
Table 5.2‘Close the Books’ Activity Quality Benchmark—Error Rates
Total Number of Error Correction Journals /Total Number of Journals (percentage)
Commonwealth Group Global
Lowest Cost Percentage 2.83 0.02
Lowest Cost 25% 6.67 0.61
Middle 50% 21.43 2.00
Highest Cost 25% 49.46 6.62
Highest Cost Percentage 75.00 25.00
Table 5.3‘Close the Books’ Activity Better Practice Benchmark—Hard Closes
Number of Hard Closes in Excess ofRequirements by Organisation and
percent of total
Commonwealth Group Global
No Hard Closes in Excess 13 (72.22%) 121 (39.03%)
1–12 Hard Closes in Excess 5 (27.78%) 181 (58.39%)
13–28 Hard Closes in Excess 0 (0.00%) 8 (2.58%)
Note: 1 organisation in the Commonwealth Group put “N/A” as its response to this question.

113
6. Accounts Receivable Activity BenchmarksTable 6.1Accounts Receivable Activity Cost Benchmark—Overall Cost
Total Accounts Receivable Activity Cost /Total Organisational Expenditure (percentage)
Commonwealth Group Global
Lowest Cost Percentage 0.002 0.002
Lowest Cost 25% 0.029 0.067
Middle 50% 0.045 0.118
Highest Cost 25% 0.106 0.212
Highest Cost Percentage 0.293 0.840
Table 6.2Accounts Receivable Activity Cost Benchmark—Cost / Credit Activity
Total Accounts Receivable ActivityCost / Total Credit Activity
Commonwealth Group Global$ $
Lowest Cost Percentage 19 2
Lowest Cost 25% 41 164
Middle 50% 121 492
Highest Cost 25% 136 1258
Highest Cost Percentage 2576 4480
Table 6.3Accounts Receivable Activity Efficiency Benchmark—Remittances/FTE
Total Number of Remittances / TotalAccounts Receivables FTEs (numbers)
Commonwealth Group Global
Highest Efficiency 9353 28 215
Highest Efficiency 25% 3951 7361
Middle 50% 1761 3966
Lowest Efficiency 25% 1429 1909
Lowest Efficiency 846 154
Appendices
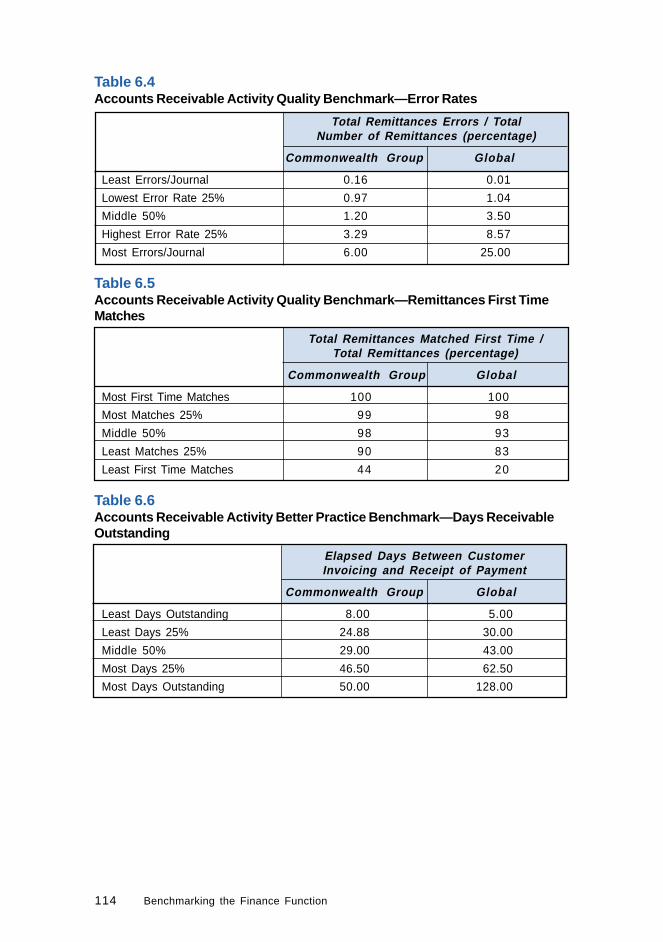
114 Benchmarking the Finance Function
Table 6.4Accounts Receivable Activity Quality Benchmark—Error Rates
Total Remittances Errors / TotalNumber of Remittances (percentage)
Commonwealth Group Global
Least Errors/Journal 0.16 0.01
Lowest Error Rate 25% 0.97 1.04
Middle 50% 1.20 3.50
Highest Error Rate 25% 3.29 8.57
Most Errors/Journal 6.00 25.00
Table 6.5Accounts Receivable Activity Quality Benchmark—Remittances First TimeMatches
Total Remittances Matched First Time /Total Remittances (percentage)
Commonwealth Group Global
Most First Time Matches 100 100
Most Matches 25% 99 98
Middle 50% 98 93
Least Matches 25% 90 83
Least First Time Matches 44 20
Table 6.6Accounts Receivable Activity Better Practice Benchmark—Days ReceivableOutstanding
Elapsed Days Between CustomerInvoicing and Receipt of Payment
Commonwealth Group Global
Least Days Outstanding 8.00 5.00
Least Days 25% 24.88 30.00
Middle 50% 29.00 43.00
Most Days 25% 46.50 62.50
Most Days Outstanding 50.00 128.00
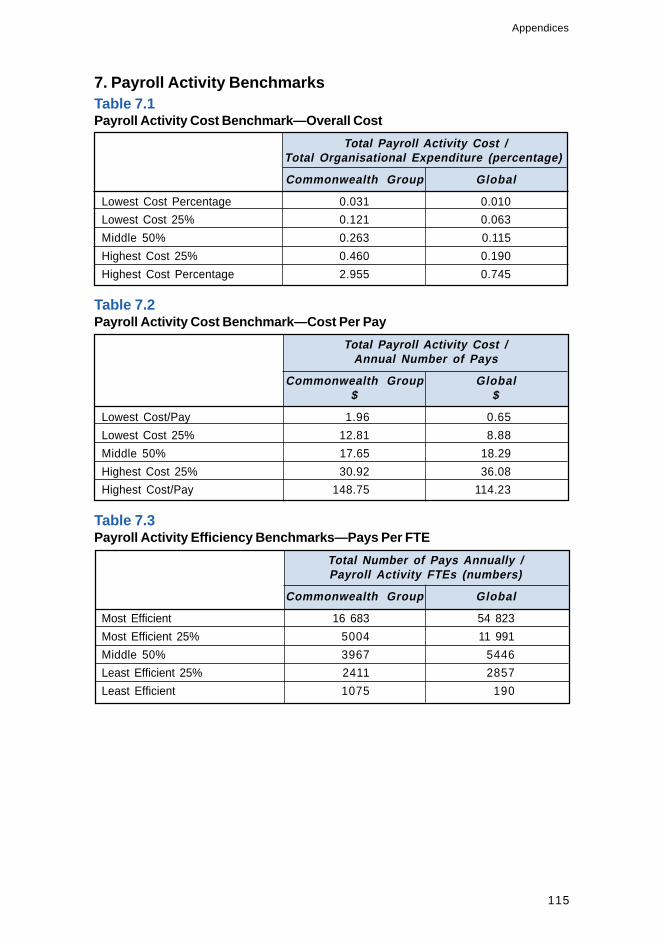
115
7. Payroll Activity BenchmarksTable 7.1Payroll Activity Cost Benchmark—Overall Cost
Total Payroll Activity Cost /Total Organisational Expenditure (percentage)
Commonwealth Group Global
Lowest Cost Percentage 0.031 0.010
Lowest Cost 25% 0.121 0.063
Middle 50% 0.263 0.115
Highest Cost 25% 0.460 0.190
Highest Cost Percentage 2.955 0.745
Table 7.2Payroll Activity Cost Benchmark—Cost Per Pay
Total Payroll Activity Cost /Annual Number of Pays
Commonwealth Group Global$ $
Lowest Cost/Pay 1.96 0.65
Lowest Cost 25% 12.81 8.88
Middle 50% 17.65 18.29
Highest Cost 25% 30.92 36.08
Highest Cost/Pay 148.75 114.23
Table 7.3Payroll Activity Efficiency Benchmarks—Pays Per FTE
Total Number of Pays Annually /Payroll Activity FTEs (numbers)
Commonwealth Group Global
Most Efficient 16 683 54 823
Most Efficient 25% 5004 11 991
Middle 50% 3967 5446
Least Efficient 25% 2411 2857
Least Efficient 1075 190
Appendices
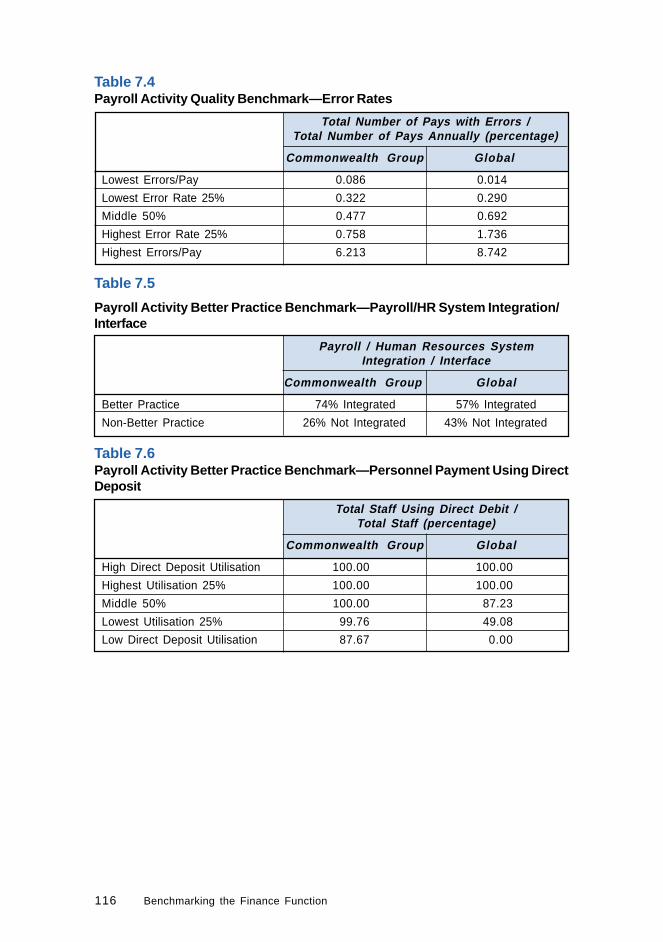
116 Benchmarking the Finance Function
Table 7.4Payroll Activity Quality Benchmark—Error Rates
Total Number of Pays with Errors /Total Number of Pays Annually (percentage)
Commonwealth Group Global
Lowest Errors/Pay 0.086 0.014
Lowest Error Rate 25% 0.322 0.290
Middle 50% 0.477 0.692
Highest Error Rate 25% 0.758 1.736
Highest Errors/Pay 6.213 8.742
Table 7.5
Payroll Activity Better Practice Benchmark—Payroll/HR System Integration/Interface
Payroll / Human Resources SystemIntegration / Interface
Commonwealth Group Global
Better Practice 74% Integrated 57% Integrated
Non-Better Practice 26% Not Integrated 43% Not Integrated
Table 7.6Payroll Activity Better Practice Benchmark—Personnel Payment Using DirectDeposit
Total Staff Using Direct Debit /Total Staff (percentage)
Commonwealth Group Global
High Direct Deposit Utilisation 100.00 100.00
Highest Utilisation 25% 100.00 100.00
Middle 50% 100.00 87.23
Lowest Utilisation 25% 99.76 49.08
Low Direct Deposit Utilisation 87.67 0.00

117
8. Travel Activity BenchmarksTable 8.1Travel Activity Cost Benchmark—Overall Cost
Total Indirect Travel Activity Cost /Total Organisational Expenditure (percentage)
Commonwealth Group Global
Lowest Cost Percentage 0.003 0.001
Lowest Cost 25% 0.019 0.008
Middle 50% 0.035 0.016
Highest Cost 25% 0.080 0.033
Highest Cost Percentage 0.826 0.270
Table 8.2Travel Activity Cost Benchmark—Cost/Travel Requisition
Total Indirect Travel Cost /Number of Travel Requisitions
Commonwealth Group Global$ $
Lowest Cost/Requisition 2.86 1.59
Lowest Cost 25% 20.22 12.64
Middle 50% 39.85 26.52
Highest Cost 25% 70.08 64.86
Highest Cost /Requisition 192.02 229.77
Table 8.3Travel Activity Efficiency Benchmarks—Travel Requisitions/FTE
Total Travel Requisitions /Total Travel FTEs (numbers)
Commonwealth Group Global
Most Requisitions/FTE 34 120 35 850
Most Efficient 25% 3556 9647
Middle 50% 1711 5338
Least Efficient 25% 970 3012
Least Requisitions/FTE 357 136
Appendices

118 Benchmarking the Finance Function
Table 8.4Travel Activity Better Practice Benchmark—Reimbursement through Payroll
Method of Employee Reimbursement (percentage of total)
Commonwealth Group Global
17 (Payroll) 17 (Payroll)
77 (Other) 17 (Other)
6 (AP Cheque) 66 (AP Cheque)
9. Billing Activity BenchmarksTable 9.1Billing Activity Cost Benchmarks—Overall Cost
Total Billing Activity Cost / TotalOrganisational Expenditure (percentage)
Commonwealth Group Global
Lowest Cost Percentage 0.002 0.002
Lowest Cost 25% 0.015 0.046
Middle 50% 0.087 0.118
Highest Cost 25% 0.103 0.282
Highest Cost Percentage 0.248 0.978
Table 9.2Billing Activity Cost Benchmark—Cost / Customer Invoice Issued
Total Billing Activity Cost /Number of Annual Invoices Issued
Commonwealth Group Global$ $
Lowest Cost Percentage 5.88 0.10
Lowest Cost 25% 14.31 4.23
Middle 50% 32.34 11.76
Highest Cost 25% 56.71 25.41
Highest Cost Percentage 213.14 77.72

119
Table 9.3Billing Activity Quality Benchmark—Error Rates
Number of Customer Invoices adjusted /Total Number of Customer Invoices
Issued (percentage)
Commonwealth Group Global
Least Adjustments/Invoice 0.43 0.10
Lowest Error Rate 25% 1.36 0.94
Middle 50% 3.40 2.18
Highest Error Rate 25% 5.19 4.27
Most Adjustments/Invoice 8.44 20.57
Table 9.4Billing Activity Quality Benchmark—Elapsed Time to Invoicing
Average Elapsed Time Between ServiceProvision and Invoicing (percentage)
Commonwealth Group Global
<1 Day 0.00 11.86
1–5 Days 16.67 59.68
6–10 Days 25.00 10.28
11–15 Days 25.00 9.49
>15 Days 33.33 8.70
Table 9.5Billing Activity Better Practice Benchmark—EDI Utilisation
Percentage Utilisation of EDIfor Billing (percentage)
Commonwealth Group Global
Better Practice EDI Utilisation 0.00 8.90
Middle 50% 0.00 4.45
Non-Better Practice EDI Utilisation 0.00 0.00
Appendices

120 Benchmarking the Finance Function
10. Tax Activity BenchmarksTable 10.1Tax Activity Cost Benchmark—Overall Cost
Total Tax Activity Cost / TotalOrganisational Expenditure (percentage)
Commonwealth Group Global
Lowest Cost Percentage 0.003 0.001
Lowest Cost 25% 0.005 0.015
Middle 50% 0.009 0.027
Highest Cost 25% 0.030 0.052
Highest Cost Percentage 0.720 0.144

121
Appendix 4
Previous Audit CoverageBetter Practice Guides, Building Better Financial Management Support—Functions, systems and activities for producing financial informationand Building a Better Financial Management Framework—Defining,presenting and using financial information, November 1999
The two financial management Better Practice Guides were designed toassist organisations to develop a sound financial management capability.The Functions Guide deals with the critical functions, systems andprocesses needed to deliver financial information efficiently andeffectively to users and examines current trends in the evolution of thefinance function.
The Defining Information Guide outlines some of the criticalconsiderations involved in using financial information that are essentialto the establishment of a valuable financial management framework.
Audit Report No. 16, Financial Control and Administration AuditPayment of Accounts, 1996–97 and Better Practice Guide Payment ofAccounts, November 1996
The payment of accounts audit assessed the management andadministration of the payment of accounts function in the Commonwealthand reported better practice with a view to promoting overallimprovements in public administration. The ANAO concluded that thepayment of accounts function was being administered satisfactorily withinthe context of the current financial legislative and management framework.However, better practices could be achieved through changes in themanagement and organisational framework for the payment of accountsand greater use of advanced information technology.
Audit Report No. 14, Financial Control and Administration AuditOfficial Travel by Public Sector Employees, 1997–98 and Better PracticeGuide Public Sector Travel, December 1997
The travel audit covered short-term travel undertaken by Commonwealthpublic sector employees on official business. It addressed direct travelcosts such as air fares, accommodation and allowances and consideredthe effectiveness of procedures and processes for managing travelexpenses. It also examined the indirect costs of travel associated withprocessing movement requisitions and expense claims and payinginvoices.
Appendices

122 Benchmarking the Finance Function
The Better Practice Guide provides guidance to Commonwealthorganisations on the implementation of the better practices and has twoparts. The first focuses on the creation of an environment in which travelreform can be effected. The second part examines the mechanics of travelprocess re-engineering and provides guidance on managing direct costs,stepping through a better practice model for travel administration.
Audit Report No. 19, Financial Control and Administration AuditManagement of Public Sector Travel Arrangements—Follow Up Audit,2000–01
The objective of this audit was to provide assurance to the Parliament onthe cost-effectiveness of public sector travel by ascertaining the degreeof acceptance, and the extent of implementation, of previous auditrecommendations and better practice principles and establishing whetherorganisations were managing travel efficiently and effectively, taking intoconsideration recommendations and findings detailed in previous auditreports and the Public Sector Travel Better Practice Guide. The ANAOconcluded that the establishment of cluster travel contracts had deliveredsignificant savings on airfares. However, organisations have taken onlylimited action to re-engineer travel management processes in responseto the recommendations made in previous Audit Reports and the ANAOBetter Practice Guide.
Audit Report No. 29, Financial Control and Administration AuditManagement of Accounts Receivable, 1997–98 and Better Practice GuideManagement of Accounts Receivable, December 1997
The accounts receivable audit assessed the cost-effectiveness of themanagement and administration of the accounts receivable function inthe general government sector and reported better practice to promoteoverall improvements in the management of accounts receivable.
The Better Practice Guide provides an overview of the current trendsand better practice approaches being adopted by organisations in themanagement of accounts receivable. It provides practical advice andassistance to managers directly involved in the key accounts receivableprocesses including invoicing, receipting payments and debt collection.
123
Audit Report No. 41, Financial Control and Administration Audit AssetManagement, 1997–98 and Better Practice Guide Asset Management, June1996
The ANAO first examined asset management in the general governmentsector in 1995. The outcome was presented in Audit Report No. 27, 1995–96, Asset Management. The 1997–98 audit reviewed the degree ofacceptance of the previous audit recommendations; the extent to whichorganisations were managing their assets in accordance with the assetmanagement principles identified in the Asset Management Handbook;and central coordination activities in asset management.
The Asset Management Better Practice Guide brings together theexperience of a broad cross-section of Commonwealth entities and buildson this by examining approaches adopted in the private sector and inother levels of government both within Australia and overseas. The Guideprovides a strategic overview of asset management for executives andsenior managers.
Appendices
124 Benchmarking the Finance Function
Index
A
Arthur Andersen Global BestPractice® KnowledgeBase 10,18, 35, 42, 53, 60, 68, 77, 80, 86,93, 97
B
Beyond Bean Counting 2000 ABenchmark of Effective FinancialManaagement in the AustraliaPublic Sector 21, 22, 29, 34
Beyond Bean Counting EffectiveFinancial Management in the APS -1998 & Beyond 21
P
public sector 9, 10, 17, 19, 20, 22, 29,31, 33, 40, 42, 43, 59, 74, 95
R
Reengineering Australia 18, 20, 35,53, 60, 68, 77, 86, 93
125
Series Titles
Titles published during the financial year 2000–01Audit Report No.24 Performance AuditFamily Relationships Services ProgramDepartment of Family and Community Services
Audit Report No.23 Financial Statement AuditAudits of the Financial Statements of Commonwealth Entities for the Period Ended30 June 2000
Audit Report No.22 Performance AuditFraud Control in DefenceDepartment of Defence
Audit Report No.20 Performance AuditSecond Tranche Sale of Telstra Shares
Audit Report No.19 Financial Control and Administration AuditManagement of Public Sector Travel Arrangements—Follow-up audit
Audit Report No.18 Performance AuditReform of Service Delivery of Business Assistance ProgramsDepartment of Industry, Science and Resources
Audit Report No.17 Performance AuditAdministration of the Waterfront Redundancy SchemeDepartment of Transport and Regional ServicesMaritime Industry Finance Company Limited
Audit Report No.16 Performance AuditAustralian Taxation Office Internal Fraud Control ArrangementsAustralian Taxation Office
Audit Report No.15 Performance AuditAgencies’ Performance Monitoring of Commonwealth GovernmentBusiness Enterprises
Audit Report No.14 Information Support Services ReportBenchmarking the Internal Audit Function
Audit Report No.13 Performance AuditCertified Agreements in the Australian Public Service
Audit Report No.12 Performance AuditPassenger Movement Charge—Follow-up AuditAustralian Customs Service

126 Benchmarking the Finance Function
Audit Report No.11 Performance AuditKnowledge System Equipment Acquisition Projects in DefenceDepartment of Defence
Audit Report No.10 Performance AuditAQIS Cost-Recovery SystemsAustralian Quarantine and Inspection Service
Audit Report No.9 Performance AuditImplementation of Whole-of-Government Information Technology InfrastructureConsolidation and Outsourcing Initiative
Audit Report No.8 Performance AuditAmphibious Transport Ship ProjectDepartment of Defence
Audit Report No.7 Performance AuditThe Australian Taxation Offices’ Use of AUSTRAC DataAustralian Taxtion Office
Audit Report No.6 Performance AuditFraud Control Arrangements in the Department of Health & Aged CareDepartment of Health & Aged Care
Audit Report No.5 Performance AuditFraud Control Arrangements in the Department of Industry, Science & ResourcesDepartment of Industry, Science & Resources
Audit Report No.4 Activity ReportAudit Activity Report: January to June 2000—Summary of Outcomes
Audit Report No.3 Performance AuditEnvironmental Management of Commonwealth Land—Follow-up auditDepartment of Defence
Audit Report No.2 Performance AuditDrug Evaluation by the Therapeutic Goods Administration—Follow-up auditDepartment of Health and Aged CareTherapeutic Goods Administration
Audit Report No.1 Performance AuditCommonwealth Assistance to the Agrifood Industry
127
Better Practice Guides
AMODEL Illustrative Financial Statements 2000 Apr 2000Business Continuity Management Jan 2000Building a Better Financial Management Framework Nov 1999Building Better Financial Management Support Nov 1999Managing APS Staff Reductions(in Audit Report No.47 1998–99) Jun 1999Commonwealth Agency Energy Management Jun 1999Corporate Governance in Commonwealth Authorities and Jun 1999Companies–Principles and Better PracticesManaging Parliamentary Workflow Jun 1999Cash Management Mar 1999Management of Occupational Stress inCommonwealth Agencies Dec 1998Security and Control for SAP R/3 Oct 1998Selecting Suppliers: Managing the Risk Oct 1998New Directions in Internal Audit Jul 1998Life-cycle Costing May 1998(in Audit Report No.43 1997–98)Controlling Performance and Outcomes Dec 1997Management of Accounts Receivable Dec 1997Protective Security Principles Dec 1997(in Audit Report No.21 1997–98)Public Sector Travel Dec 1997Audit Committees Jul 1997Core Public Sector Corporate Governance(includes Applying Principles and Practice of CorporateGovernance in Budget Funded Agencies) Jun 1997Administration of Grants May 1997Management of Corporate Sponsorship Apr 1997Return to Work: Workers Compensation Case Management Dec 1996Telephone Call Centres Dec 1996Telephone Call Centres Handbook Dec 1996Paying Accounts Nov 1996Performance Information Principles Nov 1996Asset Management Jun 1996Asset Management Handbook Jun 1996Managing APS Staff Reductions Jun 1996