Embed Size (px)
Citation preview
ORIGINAL PAPER
Benchmarking SCM performance and empirical analysis:a case from paint industry
Pratima Mishra • Rajiv Kumar Sharma
Received: 23 May 2013 / Accepted: 6 March 2014 / Published online: 26 March 2014
� The Author(s) 2014. This article is published with open access at Springerlink.com
Abstract The real challenge for managers is to develop
and implement a suitable supply chain performance
framework that not only helps in making right decisions
but also facilitates the benchmarking of their internal
supply chain. The main purpose of this study was to
develop a framework based on the performance metrics
such as (1) total length of the supply chain, (2) supply
chain inefficiency ratio and (3) supply chain working
capital productivity. Case study approach is used to
benchmark the SCM performance of two paint companies.
Further, in order to examine the relationship between SCM
practices and SCM performance measures, an empirical
analysis has been done by formulating research hypothesis.
Results show strong support for linkage between SCM
practices and selected performance metrics.
Keywords Supply chain � SCM performance �Benchmark � SCM practices
1 Introduction
In the recent years, a number of firms have realized the
potential of SCM in day-to-day operation management but
evaluating SCM performance is a complex task, because it
involves several dimensions be it strategic, tactical or
operational. According to the Shah [39], supply chain
management encompasses all activities involved in the
transformation of goods from the raw material stage to the
final stage when the goods and services reach to the end
customer. In order to attain competitive advantage over the
rivals, various business houses are paying more attention
towards the end consumer, i.e. customer. A key feature of
present day business is the idea that it is the supply chain that
competes, not companies, and the success or failure of
supply chain is ultimately determined in the marketplace by
the end consumer [14]. Brandenburg and Seuring [9] applied
benchmarking methodology for quantifying value contri-
butions in terms of cost of goods sold and working capital
from ten leading fast-moving consumer goods companies.
They further emphasized on cross-industry benchmarking
with different or extended content which may include key
supply chain partners, i.e. suppliers, service providers,
retailers and distributors. Previous researches [4, 19, 23, 26,
46] into supply chain benchmarking show that it may lead to
increased productivity of the supply chain, as managers
compare their practices to the best in the field.
Many researchers have stressed the importance of using
the right metrics to benchmark and manage supply chain
efficiently and effectively [1, 12, 21, 28, 34]. Gunasekaran
et al [21, 22], Hudson et al. [24], Folan and Browne [18]
identified key SCM metrics and proposed a framework to
classify them as financial and non-financial metrics. In the
literature, various models such as (1) analytic hierarchy
process (AHP), (2) balanced scorecard (BSC) and (3) sup-
ply chain operations and reference model (SCOR) were
developed for supply chain performance evaluation.
According to Bhagwat and Sharma [7], AHP can be the best
tool for prioritizing and choosing the best measure and
metric for day-to-day business operations. However, it is
argued that AHP is not stable in its theoretical foundation
P. Mishra (&) � R. K. Sharma
Department of Management and Social Sciences,
National Institute of Technology, Hamirpur, HP, India
e-mail: [email protected]
R. K. Sharma
Mechanical Engineering Department, National Institute
of Technology, Hamirpur, HP, India
e-mail: [email protected]
123
Logist. Res. (2014) 7:113
DOI 10.1007/s12159-014-0113-0
and could cause revision in decision-maker’s preference
because pairwise comparison metric fails to perfectly sat-
isfy the consistency required by the AHP approach [11].
BSC was first introduced by Kaplan and Norton in year
[25]. It consists of four perspectives: (1) financial, (2) cus-
tomers, (3) internal business process, (4) innovation and
learning. Bhagwat and Sharma [6] suggested putting dif-
ferent SCM metrics into different BSC perspectives to give
a balanced picture of SCM performance evaluation. Fur-
ther, they (Bhagwat and Sharma [7]) expanded the BSC
framework to include AHP in determining which measures
to include and at which level (strategic, tactical or opera-
tional) of the organization. Criticism of the BSC includes
the exclusion of people, competitive environments, envi-
ronmental and social aspects of industry [3, 36]. Epstein and
Weisner [17] argued that there is no rule for the right
number of measures to include in a balanced scorecard,
although including too many can distract from pursuing a
focused strategy. In a review conducted by [20], they con-
cluded that BSC is more like a strategic tool rather than a
true complete performance measurement system. SCOR
was developed by the Supply Chain Council. It defines
supply chain as the integrated process of plan, source, make,
deliver and return. It contains five level of analysis, i.e. (1)
process type, (2) process categories, (3) process elements,
(4) implementation and (5) performance metrics. However,
measurement models for supply chain performance evalu-
ation have their limitations. Firstly, there are too many
individual measures being used in the supply chain context.
For example, Shepherd and Gunter [40] have summarized
single supply chain performance indicators related to cost
(39), time (22), quality (or reliability) (35), flexibility (28)
and innovativeness (8), respectively. Though these mea-
sures offer valuable information for decision making,
selecting and trading off so many measures to obtain
effective and crucial improvement strategies is a difficult
task for different supply chain participants. Secondly, these
models do not provide definite cause–effect relationships
among numerous (and hierarchical) individual key perfor-
mance indicators [10]. According to Persoon and Araldi
[35], SCOR is basically used for the static operations of
supply chain rather than the dynamic effects like changes in
production rate, poor quality in raw materials and other
effects related to the bullwhip behaviour of a supply chain.
With all these problems highlighted with reference to
AHP, BSC and SCOR models, there seems to be no uni-
versal consensus regarding suitable measures of SCM
performance. Cai et al. [10] in their work found that many
measurement systems lacked strategic alignment, a bal-
anced approach and universal thinking; they have difficulty
in systematically identifying the most appropriate metrics.
According to Martin and Patterson [30], firms that were
engaged in SCM found inventory and cycle time to be the
most significant metrics, but the dimensions related to
inefficiency and working capital productivity are not
addressed adequately. There are many metrics considered
by different authors like cost, quality, flexibility, innova-
tion and responsiveness [5, 12, 21, 22, 40], but they lack
consideration of inefficiency ratio, total length of supply
chain and working capital productivity. Work by Wouters
and Wilderom [47] and Wouters [48] clearly supported the
need for a performance measurement system which should
clearly define the purpose, data collection and calculation
methods, and simple, easy to use, preferably in the form of
ratios rather than absolute numbers. Studies in the past
have shown that a well-planned and executed SCM will not
only enable organizations to reduce their inventories, but
also provide better customer services [13]. On one hand,
SCM’s short-term objective is targeted to enhance pro-
ductivity and reduce inventory and lead time, and on the
other hand, the long-term objective is targeted to increase
company’s market share and have external integration of
the supply chain processes, which needs to be further
investigated [27, 29]. Also, Akyuz and Erkan [1] in their
paper on ‘‘supply chain performance measurement: a lit-
erature review’’ concluded about immaturity of SCM
frameworks and models in their survey and believed that
future contribution to the area will come specifically from
framework development efforts and validation of devel-
oped performance measures.
To abridge this gap, authors in the present study
developed a benchmarking framework based upon perfor-
mance metrics given by Shah [39]. In the first part of work,
SCM performance of two paint companies is benchmarked
and DMAIC approach is explained which takes care of all
entities, i.e. supplier, distributor and retailer in a supply
chain network. In the second part, empirical testing of the
selected performance metrics is done by formulating vari-
ous research hypothesis.
The organization of this paper is as follows. After
introduction in Sect. 1, the Sect. 2 briefly describes the
theoretical background with research framework and for-
mulas of metrics considered in the work. The Sect. 3 pre-
sents the research objectives and methodology. The Sect. 4
discusses the analytical approach adopted in the study.
Empirical analysis based on various research hypotheses
formulated in the study is presented in the Sect. 5. The
discussions and theoretical implications are presented in
Sect. 6. Finally, concluding remarks and directions for
future research are given in Sect. 7.
2 Theoretical background
The section presents summary of some significant findings
with reference to supply chain performance measurement
113 Page 2 of 16 Logist. Res. (2014) 7:113
123
which takes into account (1) supply chain length (2) supply
chain inefficiency ratio and (3) working capital produc-
tivity with both theoretical and practical listing of related
literature (Table 1).
Having outlined the detailed interpretation of related
literature and necessary research gaps, the framework
(Fig. 1) and important formulas to measure the selected
performance metrics, i.e. (1) total length of the supply
chain, (2) supply chain inefficiency ratio and (3) supply
chain working capital productivity, are discussed as under
(Shah [39], Sriyogi [43]). Various indicators used in per-
formance metrics are presented in Fig. 2.
(1) Total length of the supply chain—The total length of
the supply chain is [given by Eq. (4)] arrived at by adding
up the days of inventory for raw materials (DRM), days of
work in progress (DWIP) and days of finished goods
(DFG). The firm that has the minimum total length of the
chain is said to have best performance.
Table 1 Summary of literature findings
Author and year of
publication
Category Focus objectives/Research gaps
Shah and Singh
[38]
Theoretical (performance
measures)
Authors proposed (1) supply chain length (2) supply chain inefficiency ratio (3) working
capital productivity as benchmarking metrics for internal supply chain performance.
Work can be extended by performing empirical investigations to validate the results.
Elmuti [16] Theoretical (performance
measures)
Studied the impact of SCM on overall organizational effectiveness and identified
problems affecting SCM success and found that the firms implement SCM are to
reduce cost, inventory and cycle time, which needs to be further investigated by
considering suitable SCM performance metrics in different supply chains.
Basnet et al. [4] Practical (case study) This paper illustrated an empirical study of benchmarking on supply chain practices in
New Zealand. Further work for identification and validation of SCM practices
particularly suited to manufacturing industries is required.
Dangayach and
Deshmukh [15]
Theoretical (survey study) Authors stressed that Indian industry is facing competition both from imports and from
multinational companies in the domestic market because new competition is in terms
of improved quality, products with higher performance, reduced cost, a wider range of
products, and better service, all delivered simultaneously but they failed to deliver on
time, so it needs to reduce the length of the supply chain by analysing the supply chain
network.
Gunasekaran et al.
[22]
Theoretical (performance
measures metrics)
Authors have concluded that many companies have not succeeded in maximizing their
supply chain’s potential because they have often failed to develop the performance
measures and metrics needed to fully integrate their supply chain to maximize
effectiveness and efficiency.
Sridharan et al.
[44]
Practical (case study) Authors conducted a practical study to investigate supply chain implementation issues
that could have major impact on the value of firms which is otherwise the capital
productivity of firms. The issue has been addressed along with length and inefficiency
in a paint supply chain by us as one of the important SCM metrics.
Singh et al. [41] Practical (performance
measures)
Authors utilized benchmarking and performance measurement to investigate SCM
practices at a number Indian manufacturing organizations by considering different
metrics such as improving on time delivery, reducing inventory costs, to secure supply
of raw materials and components, lowest possible product cost, reducing order to
delivery cycle time, integrating suppliers, etc. and stressed the need for further
analysis.
Wong and Wong
[46]
Theoretical (performance
measures)
Authors focused on the past literature of supply chain benchmarking and found that
most of the past literature had not viewed supply chain as whole entity and there is a
scarce of empirical studies. So, authors in the present study has focused on the
benchmarking and empirical study by considering three metrics, i.e. length,
inefficiency ratio and capital productivity.
Soni and Kodali
[42]
Theoretical (performance
measures and case study)
Authors proposed a methodology for the internal benchmarking to reduce the variability
in performance among supply chain of same focal firms by considering a case study
and stressed the need to develop a framework which can measure length and
inefficiency of a supply chain.
Arlbjorn et al. [2] Conceptual (exploratory study) Authors presented exploratory studies that aim to provide a better understanding of
supply chain innovation, mirroring leading edge practices, and providing a sound
terminological and conceptual basis for advanced academic work in the field. Author
emphasized that there is a lack of common terminology of agreement about the
conceptual understanding of key performance metrics, and of related empirical work
related to SCM performance which needs to be abridged.
Logist. Res. (2014) 7:113 Page 3 of 16 113
123

DRMi ¼RMi � 365
CRMi
ð1Þ
where i = index for time period which is taken as a year
(i.e. 365 days) DRMi = days of raw material inventory for
time period i RMi = raw material inventory for time per-
iod i CRMi = cost of raw material for time period i
DWIPi ¼SFGi � 365
CPi
ð2Þ
where DWIPi = days of work in process inventory for time
period i SFGi = semi-finished goods inventory for time
period i CPi = cost of production for time period i
DFGi ¼FGi � 365
CSi
ð3Þ
where DFGi = days of finished goods inventory for time
period i FGi = finished goods inventory for time period
i CSi = cost of sales for time period i
Total length of the chain (in days)
¼ DRMi þ DWIPi þ DFGi: ð4Þ
Cost of raw material is the total cost of raw material
consumed during the accounting period. It also includes
incidental expenses for procuring raw materials. In this
paper, cost of raw material value is directly considered
from financial statement and is represented by CRM.
(2) Supply chain inefficiency ratio—This ratio measures
the relative efficiency of internal supply chain manage-
ment. The ratio will be low for the firms with better
performance.
SCIi ¼SCCi
NSi
ð5Þ
SCCi ¼ DCi þ INVi � ICCi ð6Þ
where (1) SCIi = supply chain inefficiency ratio for the
time period i (2) SCCi = supply chain management costs
for the time period i (3) DCi = distribution cost for the
time period i (4) ICCi = inventory carrying cost percent-
age for the time period i (5) INVi = inventory for the time
period i (6) NSi = net sales for the time period i.
This measure is known as the internal supply chain
inefficiency ratio since the internal supply chain manage-
ment cost would be higher if the operations are not optimal
and there is inefficiency in the system. Distribution cost
includes the expenses incurred in transportation and
material handling. To have an efficient and flexible distri-
bution, firms try to achieve optimization in activities rela-
ted to transportation, loading, unloading and warehousing.
The firms that manage their internal supply chain processes
in an efficient manner will have lower levels of inventory.
The lower level inventory is achieved by better purchasing,
planning, manufacturing and distribution processes [43].
(3) Supply chain working capital productivity—The
analysis of firms on these metrics will also be based on the
level of inventory, accounts receivable and accounts
SCM Performance
metrics
Total length of the supply chain
Supply chain inefficiency ratio
Supply chain working capital
productivity
Firm performance
Fig. 1 Research framework
Total length of the supply chain
Indicators Indicates that
DRM Days of raw material RM Raw material inventory CRM Cost of raw material DWIP Days of work in process SFG Semi finished goods Inventory CP Cost of production DFG Days of finished goods Inventory FG Finished goods inventory CS Cost of sales
Supply chain inefficiency ratio
Indicators Indicates that
SCC Supply chain Management cost DC Distribution cost INV Inventories level ICC Inventory carrying Cost NS Net sales
Supply chain working capital productivity
Indicators Indicates that
SWC Supply chain Working capital INV Inventories level AR Account receivables AP Account payables SWCP Supply chain working Capital productivity NS Net sales
Fig. 2 Indicators of performance measurement metrics
113 Page 4 of 16 Logist. Res. (2014) 7:113
123

payable. Firms with efficient supply chains will have high
supply chain working capital productivity.
SWCi ¼ INVi þ ARi � APi ð7Þ
where SWCi = supply chain working capital for the
time period i INVi = inventory for the time period
i ARi = accounts receivable from the dealers/distributors
for the time period i APi = accounts payable to the sup-
pliers from the time period i
SWCPi ¼NSi
SWCi
ð8Þ
where SWCPi = supply chain working capital productivity
for the time period i NSi = net sales for the time period i.
Accounts receivable is termed as sundry creditors in the
public databases. These are basically the distributors and
the dealers who buy the products and owe payment to the
firm.
Inventory is a composite of raw materials, semi-finished
goods and finished goods inventories. Accounts payable is
termed as sundry debtors in the public data bases. These
are basically the suppliers of raw materials to whom the
firm owes payment.
3 Research methodology
The section provides details regarding the research objec-
tives/solution methodology along with description of case
settings/environment. The following research objectives
have been deduced for the study:
(1) To benchmark the SCM performance based upon
metrics, i.e. (a) total length of the supply chain, (b) supply
chain inefficiency ratio and (c) supply chain working
capital productivity.
(2) To find out correlation between performance mea-
sures and SCM practices.
(3) To empirically test the relationship between SCM
practices and performance measures by formulating vari-
ous hypothesis.
(4) To see whether significant difference with respect to
selected metrics exists between SCM firms and non-SCM
firms.
A framework to measure SCM performance based upon
two independent approaches, i.e. (1) analytical approach to
benchmark and compute SCM performance metrics based
on company data (2) empirical approach based upon
hypothesis formulation and statistical validation. In the first
approach, two paint companies (detail discussed in Sect. 4)
have been considered and data related to performance
metrics, i.e. (1) total length of the supply chain; (2) supply
chain inefficiency ratio; and (3) supply chain working
capital productivity is used to benchmark the performance
of supply chain. DMAIC (Define–Measure–Analyse–
Improve and Control), a six sigma process is used to
identify and analyse the problems for improving SCM
performance metrics.
Further, in order to examine the relationship between
best SCM practices and SCM performance measures,
empirical analysis has been done by formulating various
research hypotheses, i.e. (H1–H6).
H1 The use of good SCM practices results in improving
the total length of the supply chain.
H2 SCM practices helps to decrease the supply chain
inefficiency ratio.
H3 SCM practices have positive effect on the supply
chain working capital productivity.
H4 Firms those employing SCM practices will perceive
that their total length of the chain is better than those do not
employing SCM practices.
H5 Firms those employing SCM practices will perceive
that their inefficiency ratio is better than those do not
employing SCM practices.
H6 Firms those employing SCM practices will perceive
that their supply chain working capital productivity is
better than those do not employing SCM practices.
The case settings are described in the paragraph as
under:
A structured questionnaire (‘‘Appendix 2’’) was
designed based on the initial feedback received against a
pilot questionnaire and subsequent personal interactions
held with academicians, and people from paint companies
in the Northern region of the country. In order to measure
the variables of firm performance metrics, the question-
naire used a six-point Likert scale for supply chain prac-
tices in general and specifically mentioned the terms
related to total length of the chain, supply chain ineffi-
ciency ratio and supply chain working capital productivity.
In order to define the firms that are using SCM or not, a
dichotomous variable was used that expressed either the
existence of SCM (1) or without SCM (2). The sample was
selected randomly. Firms with less than 250 employees
were considered as SMEs. A total of 150 questionnaires
were mailed and sent out to the companies. The respon-
dents were followed up by phone and mail to increase the
response rate. A total of 60 usable surveys were received
representing a response rate of 40 %. From the 60
responses, 45 were employing SCM practices and the
remaining 15 were not employing SCM practices. Table 2
presents the distribution of the respondents by firm size.
Logist. Res. (2014) 7:113 Page 5 of 16 113
123

4 Case study analytical approach
A case from paint industry situated in Northern part of
India is under taken to describe the framework and validate
the performance measures. The cost data of two paint
companies is collected from the annual report of the paint
companies for financial year 2005–2006 to financial year
2009–2010 (shown in ‘‘Appendix 1’’), and benchmarking
exercise between two companies is done by measuring the
metrics, i.e. total length of the supply chain, inefficiency
ratio and working capital productivity metrics.
Based upon cost data extracted from the financial report
of companies, length of the supply chain, supply chain
inefficiency ratio and supply chain working capital pro-
ductivity for both companies are calculated using the for-
mulas listed in Sect. 2 for financial year (2005–2006) as
presented in the Table 3.
The yearwise comparison of financial year from
2005–2006 to 2009–2010 for all the three metrics is shown
in Figs. 3, 4, 5. As shown in the Fig. 3, company A is
having the minimum length as compared to company B.
The company A has maintained the total length, but the
company B is having more length during period 2005–2006
which was about 160 days which increased 170 days in
year 2006–2007 and further dropped to 132 days in year
2008–2009. This implies that supply chain length for pro-
cess of raw material, semi-finished goods and finished
goods is not balanced properly. The company A following
good SCM practices is having less total length of the chain
throughout the years. So, according to the trend in Fig. 3,
company A is performing better.
As shown in the Fig. 4, the company A is having less
inefficiency ratio than company B. But after that, company
B somehow manages to reduce his ratio. It was about 0.088
in year 2005–2006 and then it decreased to 0.087 in year
2006–2007, but after that, it dropped to between 0.07 and
0.06 in year 2008–2009 and year 2009–2010. It shows that
they have tried to manage inventory cost as well as dis-
tribution cost.
Figure 5 shows the comparison of the supply chain
working capital productivity of the companies. It is
expected that if the company is improving the total length
as well as the inefficiency ratio, then the productivity of the
Table 2 The distribution of the respondents by firm size
Number of
employee
Number of
respondent
Percent Cumulative
percent
0 B 50 6 10 10
[50 B 100 9 15 25
[100 B 150 13 21.67 46.67
[150 B 200 12 20 66.67
[200 B 250 15 25 91.67
[250 B 300 5 8.33 100.00
Table 3 SCM performance metrics calculation for year 2005–2006
Total length of supply chain (in days) Company A 106.09
Company B 160.54
Supply chain inefficiency ratio Company A 0.0648
Company B 0.088
Working capital productivity of SCM Company A 7.65
Company B 4.57
Fig. 3 Yearwise comparison of total length of supply chain
Fig. 4 Yearwise comparison of supply chain inefficiency ratio
Fig. 5 Yearwise comparison of supply chain working capital
productivity
113 Page 6 of 16 Logist. Res. (2014) 7:113
123
firm would increase. The company A is having more cap-
ital productivity than company B. But somehow, the
company B is improving the performance by practicing
SCM measures as evident from Fig. 5 which shows it is
possible only because of reduction in inefficiency ratio.
The details of improved plan with necessary definitions
and tools (based on DMAIC six sigma methodology) which
the company B has adopted to improve SCM performance
metrics in their supply chain network are presented in
Table 4.
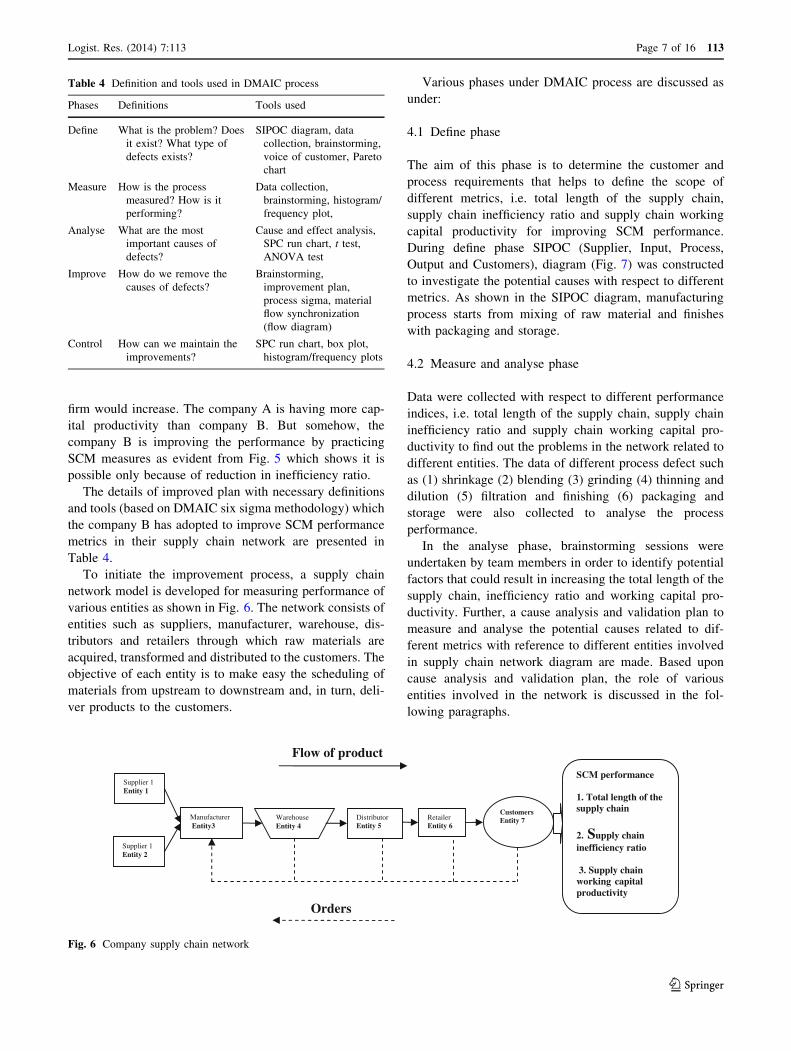
To initiate the improvement process, a supply chain
network model is developed for measuring performance of
various entities as shown in Fig. 6. The network consists of
entities such as suppliers, manufacturer, warehouse, dis-
tributors and retailers through which raw materials are
acquired, transformed and distributed to the customers. The
objective of each entity is to make easy the scheduling of
materials from upstream to downstream and, in turn, deli-
ver products to the customers.
Various phases under DMAIC process are discussed as
under:
4.1 Define phase
The aim of this phase is to determine the customer and
process requirements that helps to define the scope of
different metrics, i.e. total length of the supply chain,
supply chain inefficiency ratio and supply chain working
capital productivity for improving SCM performance.
During define phase SIPOC (Supplier, Input, Process,
Output and Customers), diagram (Fig. 7) was constructed
to investigate the potential causes with respect to different
metrics. As shown in the SIPOC diagram, manufacturing
process starts from mixing of raw material and finishes
with packaging and storage.
4.2 Measure and analyse phase
Data were collected with respect to different performance
indices, i.e. total length of the supply chain, supply chain
inefficiency ratio and supply chain working capital pro-
ductivity to find out the problems in the network related to
different entities. The data of different process defect such
as (1) shrinkage (2) blending (3) grinding (4) thinning and
dilution (5) filtration and finishing (6) packaging and
storage were also collected to analyse the process
performance.
In the analyse phase, brainstorming sessions were
undertaken by team members in order to identify potential
factors that could result in increasing the total length of the
supply chain, inefficiency ratio and working capital pro-
ductivity. Further, a cause analysis and validation plan to
measure and analyse the potential causes related to dif-
ferent metrics with reference to different entities involved
in supply chain network diagram are made. Based upon
cause analysis and validation plan, the role of various
entities involved in the network is discussed in the fol-
lowing paragraphs.
Table 4 Definition and tools used in DMAIC process
Phases Definitions Tools used
Define What is the problem? Does
it exist? What type of
defects exists?
SIPOC diagram, data
collection, brainstorming,
voice of customer, Pareto
chart
Measure How is the process
measured? How is it
performing?
Data collection,
brainstorming, histogram/
frequency plot,
Analyse What are the most
important causes of
defects?
Cause and effect analysis,
SPC run chart, t test,
ANOVA test
Improve How do we remove the
causes of defects?
Brainstorming,
improvement plan,
process sigma, material
flow synchronization
(flow diagram)
Control How can we maintain the
improvements?
SPC run chart, box plot,
histogram/frequency plots
Supplier 1 Entity 1
Supplier 1 Entity 2
Manufacturer Entity3
Warehouse Entity 4
Distributor Entity 5
Customers Entity 7 Retailer
Entity 6
Orders
Flow of product
SCM performance
1. Total length of the supply chain
2. Supply chain inefficiency ratio
3. Supply chain working capital productivity
Fig. 6 Company supply chain network
Logist. Res. (2014) 7:113 Page 7 of 16 113
123

4.2.1 Supplier to supplier variation
Suppliers are the person or groups providing key materials,
or other resources to the process. In our case, suppliers
(entity 1 and 2) provide all the raw materials which are
needed for paint manufacturing. To study the variation on
the part of suppliers, the data of the number of orders not
delivered to the manufacturer from supplier on specified
time were collected and t test was performed to compare
the supplier to supplier variation. The details of descriptive
statistics (t test) are given in Table 5. The Levene’s F test
for equality of variances equals 0.987 and is statistically
not significant at the 0.325 level. From the results, it is
observed that supplier to supplier variation is significant
and it is root cause, as significant value indicates that
p \ 0.05, and therefore, it is significant at less than the 0.05
level for a two-tailed test, i.e. t (58) = 5.246, p = 0.000.
So, a significant difference exists in the performance of
suppliers in providing raw material and information to the
manufacturer.
4.2.2 Manufacturer
Based on the historical records and observations, the dif-
ferent types of defects found in manufacturing process
were categorized as (1) shrinkage (2) blending (3) grinding
(4) thinning and dilution (5) filtration and finishing and (6)
packaging and storage. In order to investigate the role of
manufacturing, entity data related to the process defects
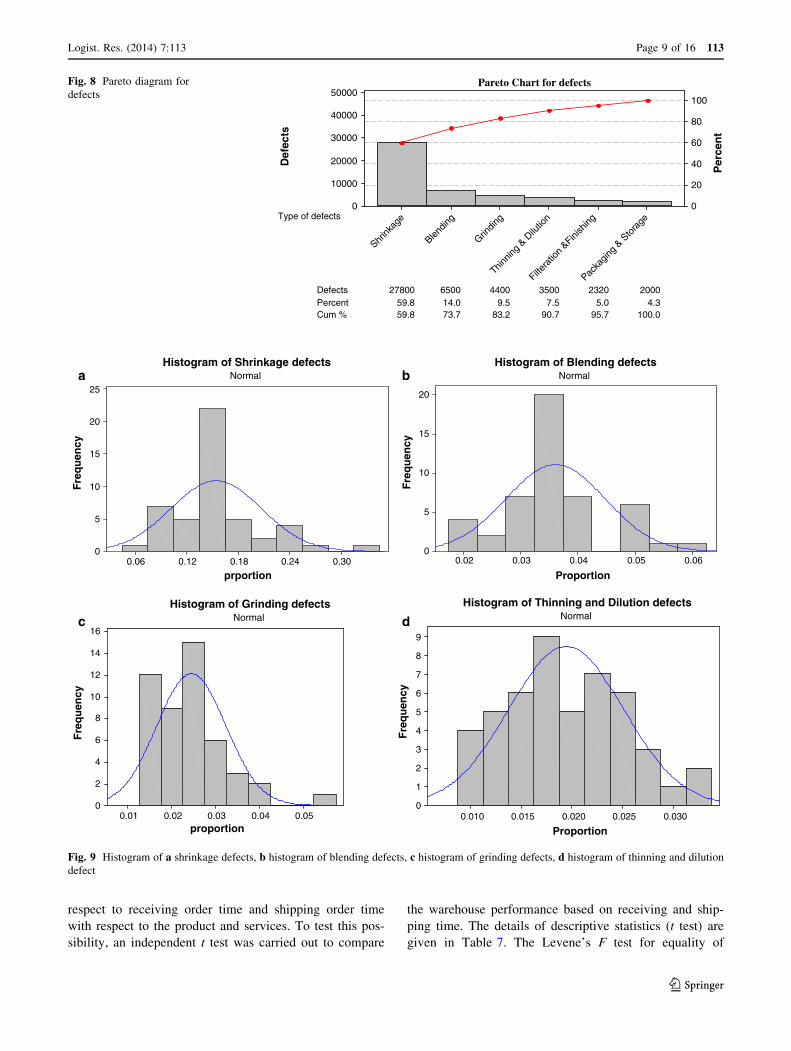
were collected. Pareto diagram in Fig. 8 shows the overall
distribution of defects with shrinkage as the major one
which contributes to 59.76 % of total defects. Other defects
with considerable percentage were blending (14 %),
grinding (9.5 %), thinning and dilution (7.5 %), filtration
and finishing (5.0 %) and packaging and storage (4.3 %)
[32]. This prioritization of defects using Pareto helps the
team to focus on improvement actions that are linked with
defects. To determine the overall distribution of percentage
defective and the frequency of a range of defects, histo-
gram plots are obtained, as shown in Fig. 9a–d, and sta-
tistical details such as mean, standard deviation are
presented in Table 6, respectively. From the results, it is
observed that process defects result in inefficient supply
chain, increase in supply chain length (by not meeting the
target at time) and reduction in capital productivity (loss
due to rework, wastage and overhead costs).
4.2.3 Warehouse
Warehouse is the most important entity in the supply chain
network. The efficiency and effectiveness in any distribu-
tion network in turn are largely determined by the functions
of the nodes in such a network, i.e. warehouses. The
functions performed by a warehouse include (1) receiving
the goods from a source, (2) Storing the goods until they
are required, (3) picking the goods when they are required
and (4) shipping the goods to the appropriate user. It was
suspected that there was a possibility of variation with
SuppliersRaw Material Process
Outputs
* Quality
* Process capability
* DPMO
* Cost
Inputs Pigments Binders Solvents Fillers Driers Plasticizers
Customers *Wholesalers *Offices *Houses *Factories *Furniture shops *Industries *Architectural Dept.
Requirements Right product Right time Right quality Right quantity
Mixing GrindingHomogeneity Checking
Thinning/ Dilution
Filtration & Finishing
Packaging & Storage
Fig. 7 SIPOC diagram
Table 5 Independent sample t test of suppliers
Group Mean N SD F value t value df Sig. (two-
tailed)
Supplier 1 22.10 30 3.8716 0.987 5.246 58 0.000
Supplier 2 26.66 30 2.7833
113 Page 8 of 16 Logist. Res. (2014) 7:113
123
respect to receiving order time and shipping order time
with respect to the product and services. To test this pos-
sibility, an independent t test was carried out to compare
the warehouse performance based on receiving and ship-
ping time. The details of descriptive statistics (t test) are
given in Table 7. The Levene’s F test for equality of
Defects 27800 6500 4400 3500 2320 2000Percent 59.8 14.0 9.5 7.5 5.0 4.3Cum % 59.8 73.7 83.2 90.7 95.7 100.0
Type of defects
Packa
ging
& Sto
rage
Filtera
tion
&Finish
ing
Thinnin
g & D
ilutio
n
Grindin
g
Blendin
g
Shrink
age
50000
40000
30000
20000
10000
0
100
80
60
40
20
0
Def
ects
Per
cen
t
Pareto Chart for defectsFig. 8 Pareto diagram for
defects
0.300.240.180.120.06
25
20
15
10
5
0
prportion
Fre
qu
ency
Histogram of Shrinkage defectsNormal
0.060.050.040.030.02
20
15
10
5
0
Proportion
Fre
qu
ency
Histogram of Blending defectsNormal
0.050.040.030.020.01
16
14
12
10
8
6
4
2
0
proportion
Fre
qu
ency
Histogram of Grinding defectsNormal
0.0300.0250.0200.0150.010
9
8
7
6
5
4
3
2
1
0
Proportion
Fre
qu
ency
Histogram of Thinning and Dilution defectsNormal
a b
c d
Fig. 9 Histogram of a shrinkage defects, b histogram of blending defects, c histogram of grinding defects, d histogram of thinning and dilution
defect
Logist. Res. (2014) 7:113 Page 9 of 16 113
123

variances equals 0.651 and is statistically not significant at
the 0.423 level. From the results, it is observed that
warehouse is not a root cause, as significant value indicates
that p [ 0.05, and therefore, it is not significant at greater
than the 0.05 level for a two-tailed test, i.e. t (58) = 1.819,
p = 0.074. So, no significant difference exists in the per-
formance of warehouse in receiving order time and ship-
ping time.
4.2.4 Distributor
Since different distributor is also involved in supply chain
network to fulfil the demand at specific time, it was sus-
pected that there was possibility of distributor variation in
received order time and delivery order time variation with
respect to the product and services. To test whether product
distributor variation affects and is a root cause of not ful-
filling the order on time, an independent t test was carried
out. The details of t test are given in Table 8. The table
contains descriptive statistics as well as t test. The Le-
vene’s F test for equality of variances equals 0.626 and is
statistically not significant at the 0.432 level. From the
table, it was found that distributors are not the root cause of
not fulfilling the order on time, as significant value indi-
cates that p [ 0.05, and therefore, it is not significant at
greater than the 0.05 level for a two-tailed test, i.e.
t (58) = 1.733, p = 0.088.
4.2.5 Retailer
Retailer is the most important entity in the supply chain
network. A retailer is a person who purchases a variety of
goods in small quantities from different wholesalers, dis-
tributors and sells them to the crucial consumer. Retailers
are the last entity in the supply chain of distribution from
the producer to the consumer. So they play a vital role in
fulfilling order on time to the customer. It was suspected
that there was possibility of retailer’s variation in received
order time and delivery order time variation with respect to
the product and services. To test whether product distri-
bution variation affects the performance and a root cause of
not fulfilling the order on time, an independent t test was
carried out to compare the retailer performance of pro-
ducing the product and services to the customers. The
details of t test are given in Table 9. The table contains
descriptive statistics as well as t test. The Levene’s F test
for equality of variances equals 2.210 and is statistically
not significant at the 0.142 level. From the table, it was
found that retailer is not the root cause of not fulfilling the
order on time, as significant value indicates that p [ 0.05,
and therefore, it is not significant at greater than the 0.05
level for a two- tailed test, i.e. t (58) = 1.350, p = 0.182.
4.3 Improve and control phase
The improvement efforts were planned to reduce variation
in supply chain process on continuous scale Deming’s P-D-
C-A cycle, i.e. (Plan- Do- Check, Act). The improvement
actions include a mix of 5 S and total productive mainte-
nance activities. Few of them are listed as under.
(1) Organization of the supply chain network: The
organization of a supply chain network means strengthen-
ing the link between entities and their operational policies,
making them more reliable and efficient aiming at deliv-
ering products to customer without any delay.
(2) Supplier development: Supplier development
involves a long-term cooperative effort between the buying
firms (manufacturer) and its suppliers (raw materials
Table 6 Statistical details of defects
Descriptive
statistics
(Defects)
Blending Shrinkage Grinding Thinning and
dilution
N 48 48 48 48
Mean 0.1544 0.0361 0.0244 0.0194
SD 0.0527 0.0086 0.0078 0.0056
Table 7 Independent sample t test of warehouse
Group Mean N SD F value t value df Sig.
(two-
tailed)
Order time 6.0 30 1.0171 0.651 1.819 58 0.074
Shipping
time
6.433 30 0.8172
Table 8 Independent sample t test of distributor
Group Mean N SD F value t value df Sig.
(two-
tailed)
Order time 6.0333 30 0.8892 0.626 1.733 58 0.088
Delivery
time
6.4333 30 0.8976
Table 9 Independent sample t test of retailer
Group Mean N SD F value t value df Sig.
(two-
tailed)
Order time 7.0333 30 1.1885 2.210 1.350 58 0.182
Delivery
time
7.4000 30 0.8944
113 Page 10 of 16 Logist. Res. (2014) 7:113
123

providers), and is aimed at creating and maintaining a
network of competent suppliers.
(3) Manufacturing Process: The manufacturing process
should be improved by working on the causes that result in
defects. For example, addition of solvents, pigments, in
right quantity at right time will reduce the loss due to
shrinkage defect.
(4) Coordination between entities: Coordination is one of
the important drivers for successful implementation of SCM
practices in a supply chain network. As lack of coordination
in supply chain network will result in distortion of demand,
i.e. bullwhip effect, it will result in increasing various costs,
i.e. manufacturing cost, inventory cost, transportation cost,
labour cost, and ultimately decrease in supply chain effi-
ciency and capital productivity.
5 Empirical analysis
In order to examine the relationship between best SCM
practices and SCM performance measures, empirical
analysis has been done by formulating research hypoth-
esis as discussed in Sect. 3. A structured questionnaire
was designed as shown in ‘‘Appendix 2’’. To determine
the reliability of the collected data and their scale using
questionnaire, reliability assessment is done using Cron-
bach’s alpha coefficient. All the alpha values were
greater than 0.65, and the data are considered reliable as
suggested by [27, 31]. In order to validate our hypothe-
sis, H1, H2 and H3, we performed correlation and
regression (Tables 10 and 11) between the SCM and
performance measures. For hypothesis H4, H5 and H6,
we performed t test (Table 12) to see significant differ-
ence between firms that practises SCM and those without
SCM exists or not.
5.1 Empirical results
Table 10 presents Pearson’s correlation between the
selected performance metrics. For interpretation of the
correlation coefficient, we have examined the coefficient
and its associated significant value p. Length and SCM
practices show ?ve correlation (r = 0.846). Similarly,
inefficiency ratio and SCM are strongly correlated
(r = 0.769), and there is significant positive correlation
exists between total length and inefficiency ratio, i.e.
(r = 0.671, p \ 0.05). Therefore, both inefficiency ratio
and total length are closely associated with each other.
The productivity has also significant correlation between
SCM (r = 0.764) and total length (r = -0.681) as well
as negative with the inefficiency ratio (r = -0.610). As
total length and efficiency increases, the productivity
decreases and vice versa as well. The correlation coeffi-
cient between supply chain inefficiency ratio and total
length of the supply chain is 0.671 and it is significant at
the 0.01 level.
Further, to understand the relationship between SCM
and performance measures, regression analysis (Table 11)
has been done. The simple linear regression analysis was
conducted to find out the relationship between SCM and
performance measures of total length of supply chain. R2
value was found out to be 0.717 which means that 71 % of
variance in performance was explained by the model which
is highly significant as indicated by the F value, i.e.
146.606, which indicates model is fit and valid. Significant
value of 0.000 indicates that the regression is significant.
There is no multivariate because no value is greater than or
equal to the critical chi-square value of 13.8 at an alpha
level of 0.001, if one examines the Mahalanobis (MAH1)
distance value. Also, variance inflation factor (VIF) is
2.315, so it shows that there is perfect correlation.
Secondly, for supply chain inefficiency ratio, the R2
value is 0.790, which suggests that 79 % of variance was
explained by the model which is highly significant as
indicated by the F value, i.e. 107.158, which indicates
model is fit and valid. Significant value of 0.000 indicates
that the regression is significant that there is useful linear
model.
Table 10 Pearson’s correlation between performance measures and SCM practices
Pearson correlation SCM practices Total length of supply chain Supply chain inefficiency ratio Working capital productivity
Total length of supply chain 0.846** 1 1 1
Supply chain inefficiency ratio 0.769** 0.671** -0.610**
Working capital productivity -0.764** -0.681**
** Correlation is significant at the 0.01 level
Table 11 Regression of SCM with selected performance measures
Performance measures F value P value R2 b VIF
Total length of supply
chain
146.606 0.000 0.717 0.469 2.315
Supply chain
inefficiency ratio
107.158 0.000 0.790 0.291 1.974
Supply chain working
capital productivity
88.132 0.000 0.825 -0.267 2.026
Logist. Res. (2014) 7:113 Page 11 of 16 113
123

Thirdly, for the supply chain, working capital produc-
tivity value of F is 88.132, and R2 is 0.825, which suggests
that there is 82.5 % of variance in performance measure,
i.e. working capital productivity. Significant value of 0.000
indicates that the regression is significant that there is a
useful linear model. The VIF is 2.026, so there is perfect
correlation between them.
The relationship between the dependent and indepen-
dent variables can be expressed in form of equation as:
y ¼ a þ b1x1 þ b2x2 þ b3x3
y ¼ 0:089 þ 0:469x1 þ 0:291x2 � 0:267x3
where y = supply chain management performance x1 =
total length of the supply chain x2 = supply chain Ineffi-
ciency Ratio x3 = supply chain working capital
productivity.
6 Discussions
In the study, the authors have discussed two independent
approaches to evaluate SCM performance, one based on
company data and another based upon empirical analysis.
Data related to various performance metrics, i.e. (1) total
length of the supply chain; (2) supply chain inefficiency
ratio and (3) supply chain working capital productivity were
collected and analysed to benchmark the SCM performance
of two companies. Further, an empirical analysis has been
done by formulating research hypothesis based upon critical
review of literature studies. The findings based upon sta-
tistical analysis clearly support our hypothesis H1, H2 and
H3, i.e. following SCM practices firms improve their SCM
performance. The beta values obtained by regression ana-
lysis help us to measure how strongly each performance
measure influence the SCM performance.
We also performed t test to see whether significant
differences between firms that practise SCM and those
without SCM exists or not and to test hypothesis H4, H5
and H6. The companies following SCM practices are
defined as group 1 with N = 45, and those not following
SCM practices are defined as group 2 with N = 15. Col-
umn 3 and 4 in Table 12 show the mean and standard
deviation of performance metrics with respect to both SCM
and non-SCM companies. We performed Levene’s test for
equality of variance, as p [ 0.05, and therefore, we can say
that variance is relatively equal for firm which following
SCM and those without SCM. The t value, df and two-
tailed significance for the equal variance to determine
whether significant difference between SCM and non-SCM
firms exists or not are presented in Table 12.
As evident from results, there is a significant difference
between two groups of firm with reference to the three
metrics exists, as significant value indicates that p \ 0.05,
and therefore, it is significant. For a two-tailed test, i.e.
t (58) = -12.108, -9.152 and 9.031, p = 0.000. This
result is also supported by Bowersox et al. [8], Martin and
Patterson [30] in literature. So, our Hypothesis H4, H5 and
H6 are tested by t test. Thus, we can conclude that the firms
which practise SCM outperform than those without SCM.
The results of the work bring forward the following
theoretical implications.
1. In order to attain competitive positioning, a firm can
benchmark its own profile with that of its competitors
in order to establish where it stands in terms of supply
chain length, inefficiency and capital productivity. In
the study, the benchmarking and performance mea-
surement using selected metrics help to investigate the
causes/entities in supply chain network which result in
low SCM performance. For instance, the use of
DMAIC in supply chain network shown in Fig. 6
helps to identify the entity, i.e. supplier which may
result in increase in supply chain length with statistics,
i.e. t (58) = 5.246, p = 0.000.
2. Companies that follow SCM practices manage their
supply chain length and hence reduce inefficiency ratio
Table 12 t test results for
firm’s performance measures
with SCM practices
Metrics Group statistics t test
Group N Mean SD t value df Sig
(two-trailed)
Total length (H4)
With SCM 1 45 97.933 10.90 – 58 0.000
Without SCM 2 15 146.66 19.51 12.108 58 0.000
Inefficiency ratio (H5)
With SCM 1 45 0.061 0.00758 58 0.000
Without SCM 2 15 0.0833 0.00900 -9.152
Working capital productivity (H6)
With SCM 1 45 8.488 1.2902
Without SCM 2 15 4.866 1.5055 9.031
113 Page 12 of 16 Logist. Res. (2014) 7:113
123
and increase overall capital productivity than those
without SCM. For SCM companies, the measures
supply chain length and inefficiency ratio had average,
i.e. 97.933, 0.061 lesser than those without SCM, i.e.
146.66, 0.0833, respectively. Also, the average of
overall capital productivity is more, i.e. 8.488 with
SCM as compared to 4.866 without SCM. Thus,
adoption of SCM practices by companies promote
efficient management of supply chain which can lead
to enhanced competitive advantage and improved
organizational performance. Studies conducted by
authors support the findings in this regard [29, 33, 45].
7 Conclusions
Our findings indicate that the firms that practise the SCM
perform better than those without SCM. Statistical tests
confirm that good SCM practices are able to decrease the
length of the supply chain and reduce supply chain ineffi-
ciency ratio and increase the capital productivity. Empiri-
cal analysis supports the positive correlation between the
SCM practices and SCM performance metrics. Also,
multiple regressions were used to determine the impact of
SCM practices on firm performance. Regression model
shows that the maximum contributor for the SCM perfor-
mance is total length of the supply chain, where the coef-
ficient is (0.469) followed by supply chain inefficiency
ratio (0.291). The results are supported by studies con-
ducted by Martin and Patterson, [30] and Sriyogi [43] in
which they concluded that firms that manage their internal
supply chain processes in an efficient manner will have
lower levels of inventory and the use of internal firm per-
formance measurement, inventory and cycle time offer the
best metrics for positioning the company into a supply
chain network.
Although the study presents an important contribution
first by developing a framework for benchmarking/mea-
suring an internal supply chain performance of the firm and
then by empirically testing the findings based on research
hypothesis, researchers can attempt to establish similar
framework of SCM metrics for some other industrial sec-
tors such as construction, food and agriculture and textile
industry. According to Ren et al., [37], the global compe-
tition worldwide forces the business houses to look at their
supply chain in order to reduce both costs and time
involved in their processes. It is therefore advised that
future research should study the relationship between
contextual factors, i.e. (1) size of the company (2) field of
operations, i.e. industrial or service sector (3) priorities for
competitive positioning that affect adoption of SCM
practices. Our results also demonstrate relatively low per-
formance level of non-SCM companies. So, work can be
further extended to find out the barriers which result in low
performance level with respect to selected metrics.
Open Access This article is distributed under the terms of the
Creative Commons Attribution License which permits any use, dis-
tribution, and reproduction in any medium, provided the original
author(s) and the source are credited.
Appendix 1
See Table 13
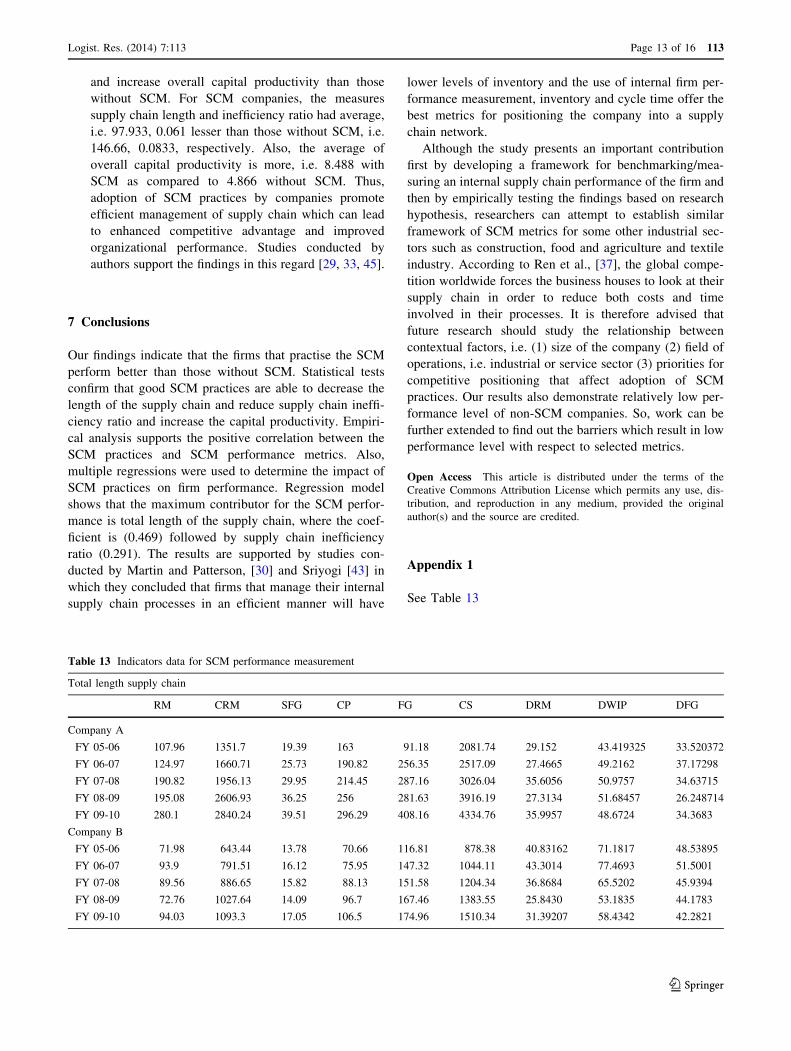
Table 13 Indicators data for SCM performance measurement
Total length supply chain
RM CRM SFG CP FG CS DRM DWIP DFG
Company A
FY 05-06 107.96 1351.7 19.39 163 91.18 2081.74 29.152 43.419325 33.520372
FY 06-07 124.97 1660.71 25.73 190.82 256.35 2517.09 27.4665 49.2162 37.17298
FY 07-08 190.82 1956.13 29.95 214.45 287.16 3026.04 35.6056 50.9757 34.63715
FY 08-09 195.08 2606.93 36.25 256 281.63 3916.19 27.3134 51.68457 26.248714
FY 09-10 280.1 2840.24 39.51 296.29 408.16 4334.76 35.9957 48.6724 34.3683
Company B
FY 05-06 71.98 643.44 13.78 70.66 116.81 878.38 40.83162 71.1817 48.53895
FY 06-07 93.9 791.51 16.12 75.95 147.32 1044.11 43.3014 77.4693 51.5001
FY 07-08 89.56 886.65 15.82 88.13 151.58 1204.34 36.8684 65.5202 45.9394
FY 08-09 72.76 1027.64 14.09 96.7 167.46 1383.55 25.8430 53.1835 44.1783
FY 09-10 94.03 1093.3 17.05 106.5 174.96 1510.34 31.39207 58.4342 42.2821
Logist. Res. (2014) 7:113 Page 13 of 16 113
123

Table 13 continued
Supply chain inefficiency ratio
DC INV ICC NS
Company A
FY 05-06 95.02 318.53 0.2 2447.78
FY 06-07 100.23 407.05 0.2 2953.37
FY 07-08 139.33 508.11 0.2 3595.53
FY 08-09 170.37 512.97 0.2 4510.12
FY 09-10 196.96 727.77 0.2 5367.72
Company B
FY 05-06 45.8 202.57 0.2 979.97
FY 06-07 50.2 257.34 0.2 1159.88
FY 07-08 53.27 256.96 0.2 1339.4
FY 08-09 59.02 254.31 0.2 1510.96
FY 09-10 50.32 286.04 0.2 1686.52
Supply chain working capital Productivity
INV AR AP NS
Company A
FY 05-06 318.53 185.1 183.68 2447.78
FY 06-07 407.05 233.96 267.35 2953.37
FY 07-08 508.11 251.9 375.73 3595.53
FY 08-09 512.97 311.02 358.51 4510.12
FY 09-10 727.77 331.43 571.71 5367.72
Company B
FY 05-06 202.57 109.51 98.06 979.97
FY 06-07 257.34 143.52 100.09 1159.88
FY 07-08 256.96 158.44 110.8 1339.4
FY 08-09 254.31 180.38 117.5 1510.96
FY 09-10 286.04 204.73 194.2 1686.52
RM raw material inventory, CRM cost of raw material, SFG semi-finished goods inventory, CP cost of production, FG finished goods inventory,
CS cost of sales, DRM days of raw material, DWIP days of work in process, DFG days of finished goods inventory, DC distribution cost, INV
inventories level, ICC inventory carrying cost, NS net sales, AR account receivables, AP account payables, SWCP supply chain working, capital
productivity
113 Page 14 of 16 Logist. Res. (2014) 7:113
123

Appendix 2
QUESTIONNAIRE
General Information
Name of organization Please indicate the number of employees in your organization.
0≤ ≤ ≤150
≤200 >200≤
100 >100
250 >250≤300
For empirical analysis
Q.1 How much day’s raw material takes to arrive in Inventory from vendor?
Q.2 How much days work in process takes in Inventory?
Q.3 How much days finished goods takes in Inventory?
Q.4 How much is your Inventory carrying cost per annum?
Q.5 How much is your distribution cost per annum?
Q.6 How much is your net sales per annum?
Q.7 How much is your supply chain inefficiency ratio?
Q.8 How much is your a/c receivable in your current asset per annum?
Q.9 How much is you’re a/c payable in your current liability per annum?
Q.10- How much is your working capital per annum?
Q.11- How much is your supply chain working capital productivity
50 >50
>150
10 days 20 days 30 days
40 days 50 days above 50 days
10 days 20 days 30 days
40 days 50 days above 50 days
10 days 20 days 30 days
40 days 50 days above 50 days
0 .05 0 .10 0.15
0 .20 0 .25 above .25
50cr 100cr 150cr
200cr 250cr above 250cr
Below 1000cr 2000cr 3000cr
4000cr 5000cr above 5000cr
0.05 0.06 0.07
0.08 0.09 above .09
100cr 150cr 200cr
250cr 300cr above 300cr
100cr 150cr 200cr
250cr 300cr above 300cr
100cr 150cr 200cr
250cr 300cr above 300cr
4 7 8
9 10 11
References
1. Akyuz GA, Erkan TE (2010) Supply chain performance mea-
surement: a literature review. Int J Prod Res 48(17):5137–5155
2. Arlbjorn JS, de Haas H, Munksgaard KB (2011) Exploring supply
chain innovation. Logist Res 3(1):3–18
3. Barber E (2008) How to measure the value in value chains. Int J
Phys Distrib Logist Manag 38(9):685–698
4. Basnet C, Corner L, Wiense J, Tan K (2003) Benchmarking
supply chain management practice in New Zealand. Supply
Chain Manag Int J 8(1):57–64
5. Beamon BM (1998) Supply chain design and analysis: models
and methods. Int J Prod Econ 55(3):281–294
6. Bhagwat R, Sharma MK (2007a) Performance measurement of
supply chain management: a balance scorecard approach. Com-
put Ind Eng 53(1):43–62
7. Bhagwat R, Sharma MK (2007b) Performance measurement of
supply chain management using the analytical hierarchy process.
Prod Plan Control 18(8):666–680
8. Bowersox DJ, Closs DJ, Keller SB (2000) How supply chain
competency leads to business success. Supply Chain Manag Rev
4(4):70–78
9. Brandenburg M, Seuring S (2011) Impact of supply chain
management on company value: benchmarking companies from
the fast moving consumer goods industry. Logist Res
3(4):233–248
10. Cai J, Liu X, Zhihui X, Liu J (2009) Improving supply chain
performance management: a systematic approach to analyzing
iterative KPI accomplishment. Decis Support Syst 46(2):512–521
11. Cao D, Leung LC, Law JS (2008) Modifying inconsistent com-
parison matrix in analytic hierarchy process: a heuristic approach.
Decis Support Syst 44(4):944–953
12. Carvalho H, Azevedo SG, Cruz-Machado V (2012) Agile and
resilient approaches to supply chain management: influence on
performance and competitiveness. Logist Res 4(1/2):49–62
13. Chong AYL, Ooi KB (2008) Adoption of inter-organizational
system standards in supply chains: an empirical analysis of
Rosetta Net standards. Ind Manag Data Syst 108(4):529–547
14. Christopher M, Towill DR (2001) An integrated model for the
design of agile supply chain. Int J Phys Distrib Logist Manag
31(4):235–246
15. Dangayach GS, Deshmukh SG (2003) Evidence of manufacturing
strategies in Indian industry: a survey. Int J Prod Econ
83:279–298
16. Elmuti D (2002) The perceived impact of SCM on organization
effectiveness. J SCM Global Rev Purch Supply 38(3):49–57
17. Epstein MJ, Weisner PS (2001) Good neighbors: implementing
social and environmental strategies with the BSC, Balanced
Scorecard Report, Reprint Number B0105C 33. Harvard Business
School, Cambridge
18. Folan P, Browne J (2005) A review of performance measurement:
towards performance management. Comput Ind 56(7):663–680
19. Gilmour P (1999) Benchmarking supply chain operations. Int J
Phys Distrib Logist Manag 5(4):259–266
20. Gomes CF, Yasin MM, Lisboa JV (2004) A literature review of
manufacturing performance measures and measurement in an
organizational context: a framework and direction for future
research. J Manuf Technol Manag 15(6):511–530
21. Gunasekaran A, Patel C, Tirtiroglu E (2001) Performance mea-
sures and metrics in a supply chain environment. Int J Oper Prod
Manag 21(1/2):71
22. Gunasekaran A, Patel C, McGaughey RE (2004) A framework
for supply chain performance measurement. Int J Prod Econ
87(3):333–347
Logist. Res. (2014) 7:113 Page 15 of 16 113
123

23. Hanman S (1997) Benchmarking your firm’s performance with
best practice. Int J Logist Manag 8(2):1–18
24. Hudson M, Lean J, Smart PA (2001) Improving control through
effective performance measurement in SMEs. Prod Plan Control
12(8):804–813
25. Kaplan RS, Norton DP (1992) The Balanced scorecard measures
that drive performance. Harv Bus Rev 70(1):71–79
26. Keebler JS, Plank RE (2009) Logistics performance measurement
in the supply chain: a benchmark. Benchmark Int J
16(6):785–798
27. Koh SC, Demirbag M, Bayraktar E, Tatoglu E, Zaim S (2007)
The impact of supply chain management practices on perfor-
mance of SMEs. Ind Manag Data Syst 107(1):103–124
28. Lambert DM, Pohlen TL (2001) Supply chain metrics. Int J
Logist Manag 12(1):1–19
29. Li S, Ragu-Nathan B, Ragu-Nathan TS, Rao SS (2006) The
impact of supply chain management practices on competitive
advantage and organizational performance. Int J Manag Sci
Omega 32(2):107–124
30. Martin RP, Patterson PW (2009) On measuring company per-
formance within a supply chain. Int J Prod Res 47(9):2449–2460
31. Martinez ACL (2008) Self-reported reading strategy use among
Spanish university students of English. RESLA 21:167–179
32. Mishra P and Sharma RK (2011) A framework imbibing leagile
and six -sigma culture to improve SCM performance. Proceed-
ings of the International Conference on ‘‘Advances in supply
Chain and Manufacturing Management’’, Kharagpur, India,
December 16–18
33. Mohanty RP, Desmukh SG (2000) Reengineering of a supply
chain management system: a case study. Prod Plan Control
11(1):90–104
34. Neely A, Gregory M, Platts K (2005) Performance measurement
system design. Int J Oper Prod Manag 25(12):1228–1263
35. Persoon F, Araldi M (2009) The development of a dynamic
supply chain analysis tool – Integration of SCOR and discrete
event simulation. Int J Prod Econ 121(2):574–583
36. Paranjape B, Rossiter M, Pantono V (2006) Performance mea-
surement systems: successes, failures and the future-a review.
Meas Bus Excell 10(3):4–14
37. Ren J, Yusuf YY, Burns ND (2009) A decision support frame-
work for agile enterprise partnering. Int J Adv Manuf Technol
41(1):180–192
38. Shah J, Singh N (2001) Benchmarking internal supply chain
performance: development of a framework. J Supply Chain
Manag 37(1):37–47
39. Shah J (2009) Supply chain management. Text and cases. Pearson
Education, New Jersey
40. Shepherd C, Gunter H (2006) Measuring supply chain perfor-
mance: current research and future directions. Int J Product
Perform Manag 55(3/4):242–258
41. Singh A, Narain R, Yadav RC (2006) Benchmarking and per-
formance measurement of supply chain management practices: a
survey of Indian organizations. Int J Serv Oper Manag
2(4):313–334
42. Soni G, Kodali R (2010) Internal benchmarking for assessment of
supply chain performance. Benchmarking Int J 17(1):44–76
43. Sriyogi K (2012) Internal benchmarking of supply chain perfor-
mance measures evidence from selected organizations. IUP J
Supply Chain Manag 9(1):40–71
44. Sridharan UV, Caines WR, Patterson CC (2005) Implementation
of supply chain management and its impact on the value of firms.
Supply Chain Manag Int J 10(4):313–318
45. Vaart V, Donk V (2008) A critical review of survey-based
research in supply chain integration. Int J Prod Econ
111(1):42–55
46. Wong WP, Wong KY (2008) A review on benchmarking of
supply chain performance measures. Benchmarking Int J
15(1):25–51
47. Wouters M, Wilderom C (2008) Developing performance mea-
surement systems as enabling formalization: a longitudinal field
study of a logistics department. Account Organ Soc 33(4/
5):488–516
48. Wouters M (2009) A development approach to performance
measures—results from a longitudinal case study. Euro Manag J
27(1):64–78
113 Page 16 of 16 Logist. Res. (2014) 7:113
123