Embed Size (px)
Citation preview
0
Benchmarking of Electricity
Distribution Networks in Austria and
Germany
Dr. Marcus Stronzik
WIK – Scientific Institute for Infrastructure
and Communication Services (Germany)
1
Overview
• Background
• History of Network Regulation
• General Approach
• Benchmarking
• Lessons
2
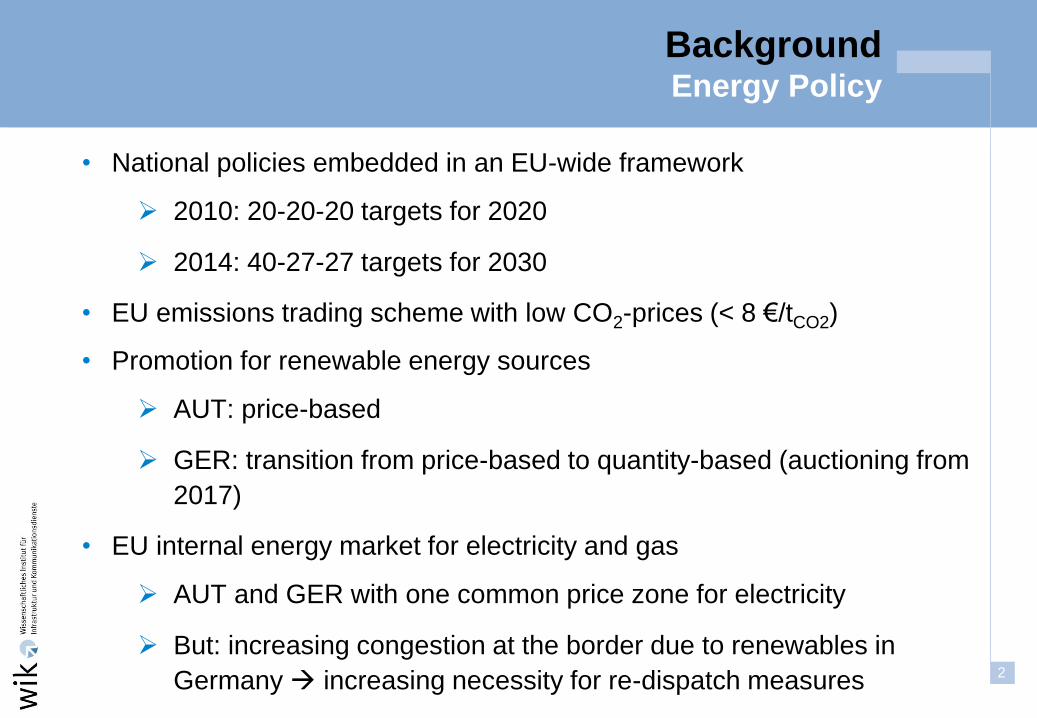
Background Energy Policy
• National policies embedded in an EU-wide framework
2010: 20-20-20 targets for 2020
2014: 40-27-27 targets for 2030
• EU emissions trading scheme with low CO2-prices (< 8 €/tCO2)
• Promotion for renewable energy sources
AUT: price-based
GER: transition from price-based to quantity-based (auctioning from
2017)
• EU internal energy market for electricity and gas
AUT and GER with one common price zone for electricity
But: increasing congestion at the border due to renewables in
Germany increasing necessity for re-dispatch measures
3
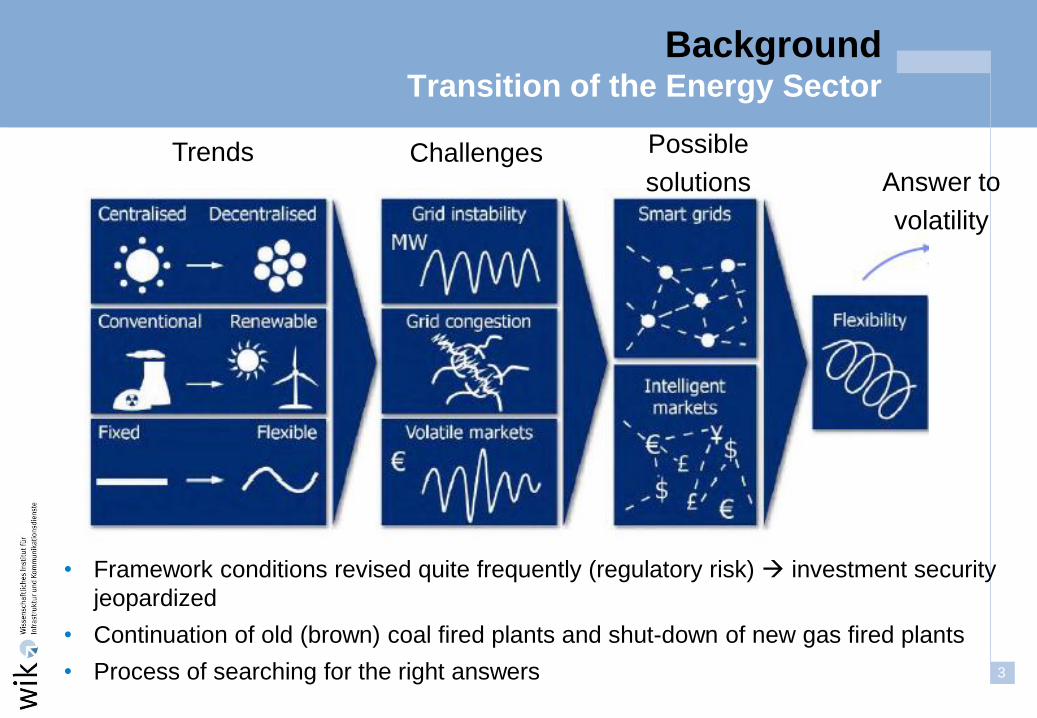
Background Transition of the Energy Sector
• Framework conditions revised quite frequently (regulatory risk) investment security
jeopardized
• Continuation of old (brown) coal fired plants and shut-down of new gas fired plants
• Process of searching for the right answers
Trends Possible
solutions Challenges
Answer to
volatility
4
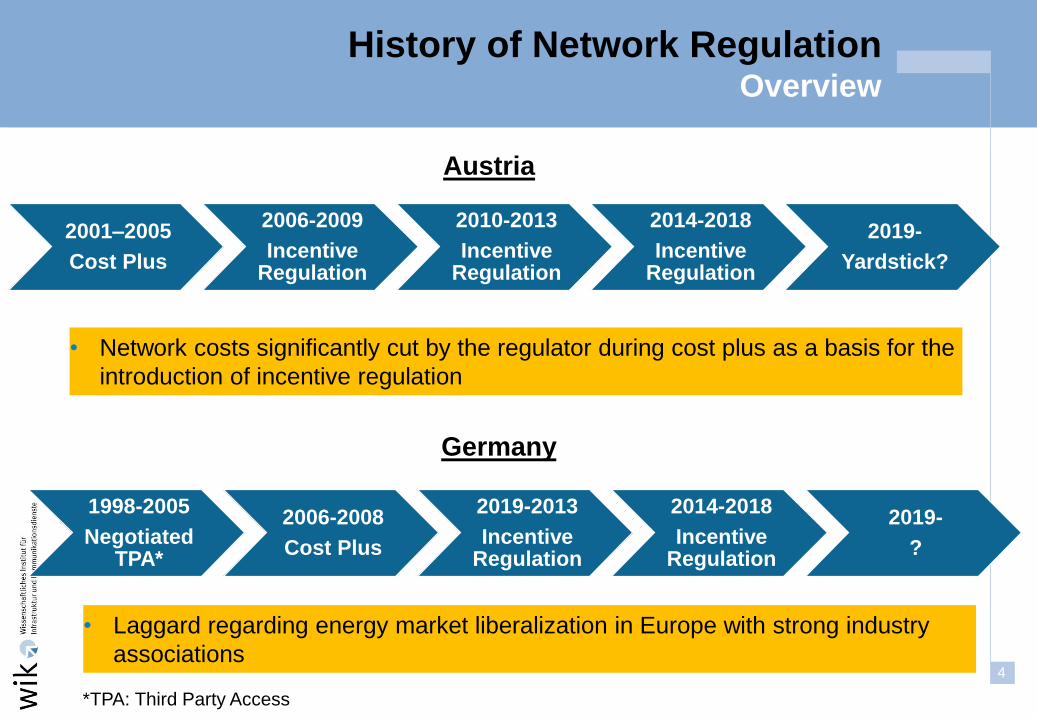
History of Network Regulation Overview
• Laggard regarding energy market liberalization in Europe with strong industry
associations
2001–2005
Cost Plus
2006-2009
Incentive Regulation
2010-2013
Incentive Regulation
2014-2018
Incentive Regulation
2019-
Yardstick?
Austria
1998-2005
Negotiated TPA*
2006-2008
Cost Plus
2019-2013
Incentive Regulation
2014-2018
Incentive Regulation
2019-
?
Germany
• Network costs significantly cut by the regulator during cost plus as a basis for the
introduction of incentive regulation
*TPA: Third Party Access
5
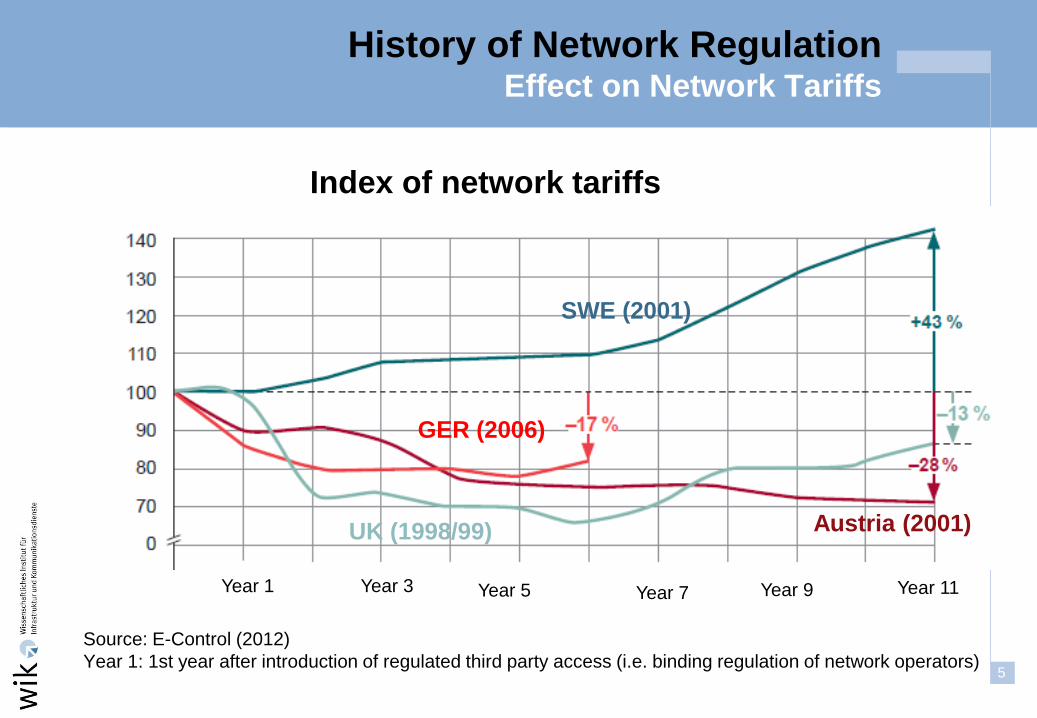
History of Network Regulation Effect on Network Tariffs
Source: E-Control (2012)
Year 1: 1st year after introduction of regulated third party access (i.e. binding regulation of network operators)
GER (2006)
UK (1998/99)
SWE (2001)
Austria (2001)
Year 1 Year 7 Year 9 Year 11 Year 3 Year 5
Index of network tariffs
6
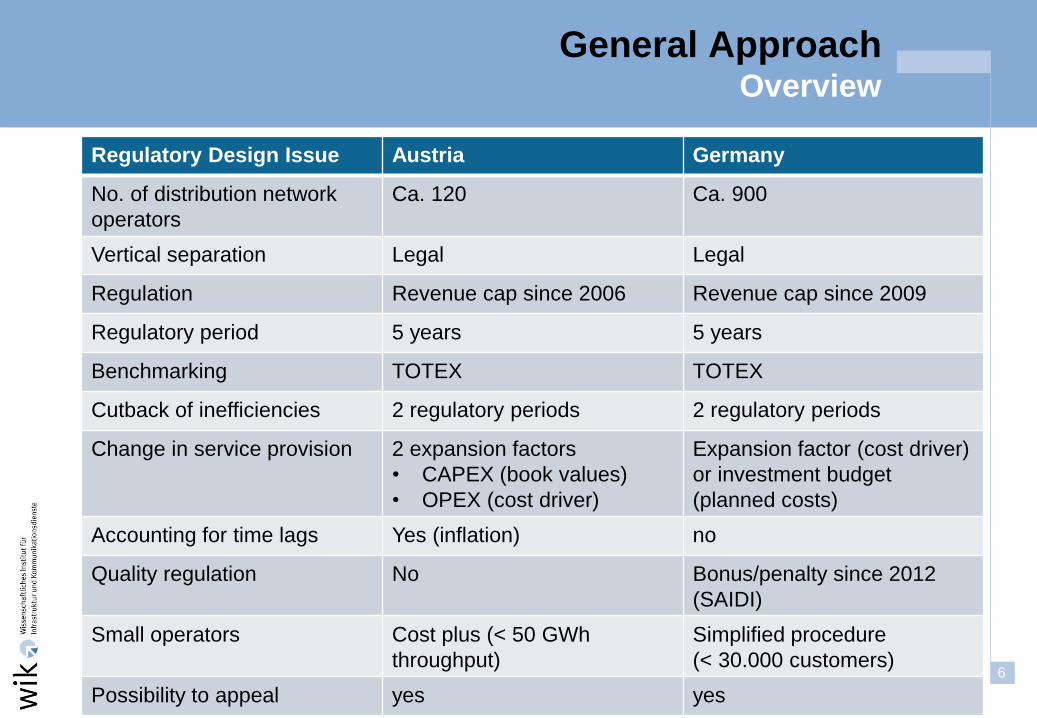
General Approach Overview
Regulatory Design Issue Austria Germany
No. of distribution network
operators
Ca. 120 Ca. 900
Vertical separation Legal Legal
Regulation Revenue cap since 2006 Revenue cap since 2009
Regulatory period 5 years 5 years
Benchmarking TOTEX TOTEX
Cutback of inefficiencies 2 regulatory periods 2 regulatory periods
Change in service provision 2 expansion factors
• CAPEX (book values)
• OPEX (cost driver)
Expansion factor (cost driver)
or investment budget
(planned costs)
Accounting for time lags Yes (inflation) no
Quality regulation No Bonus/penalty since 2012
(SAIDI)
Small operators Cost plus (< 50 GWh
throughput)
Simplified procedure
(< 30.000 customers)
Possibility to appeal yes yes
7
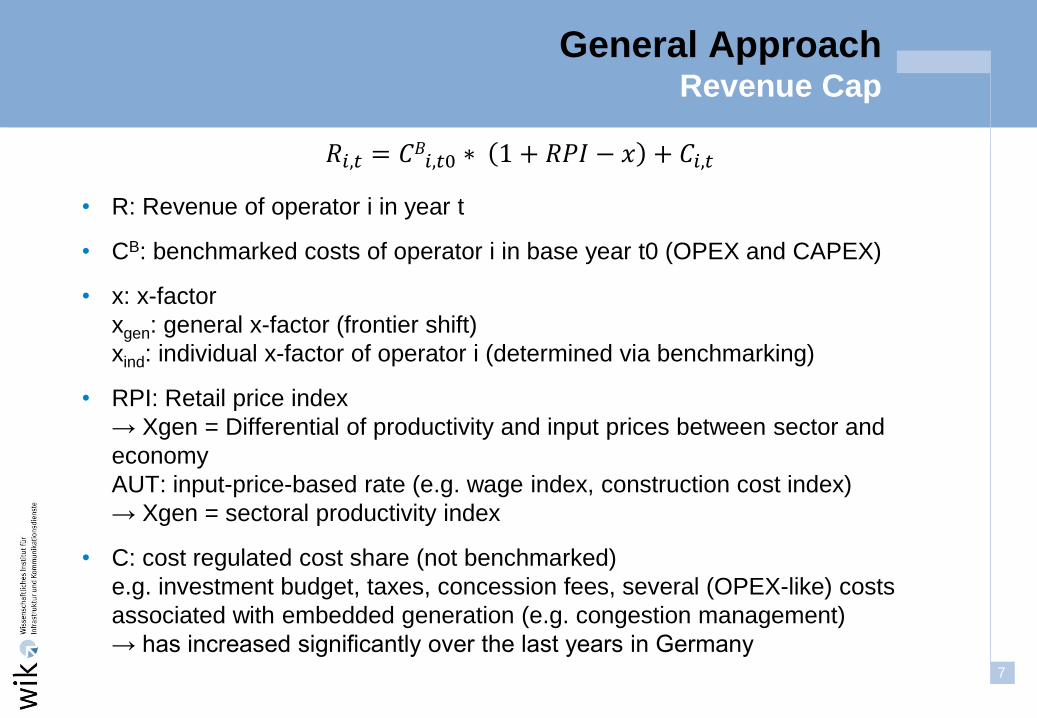
General Approach Revenue Cap
𝑅𝑖,𝑡 = 𝐶𝐵𝑖,𝑡0 ∗ 1 + 𝑅𝑃𝐼 − 𝑥 + 𝐶𝑖,𝑡
• R: Revenue of operator i in year t
• CB: benchmarked costs of operator i in base year t0 (OPEX and CAPEX)
• x: x-factor
xgen: general x-factor (frontier shift)
xind: individual x-factor of operator i (determined via benchmarking)
• RPI: Retail price index
→ Xgen = Differential of productivity and input prices between sector and
economy
AUT: input-price-based rate (e.g. wage index, construction cost index)
→ Xgen = sectoral productivity index
• C: cost regulated cost share (not benchmarked)
e.g. investment budget, taxes, concession fees, several (OPEX-like) costs
associated with embedded generation (e.g. congestion management)
→ has increased significantly over the last years in Germany
8
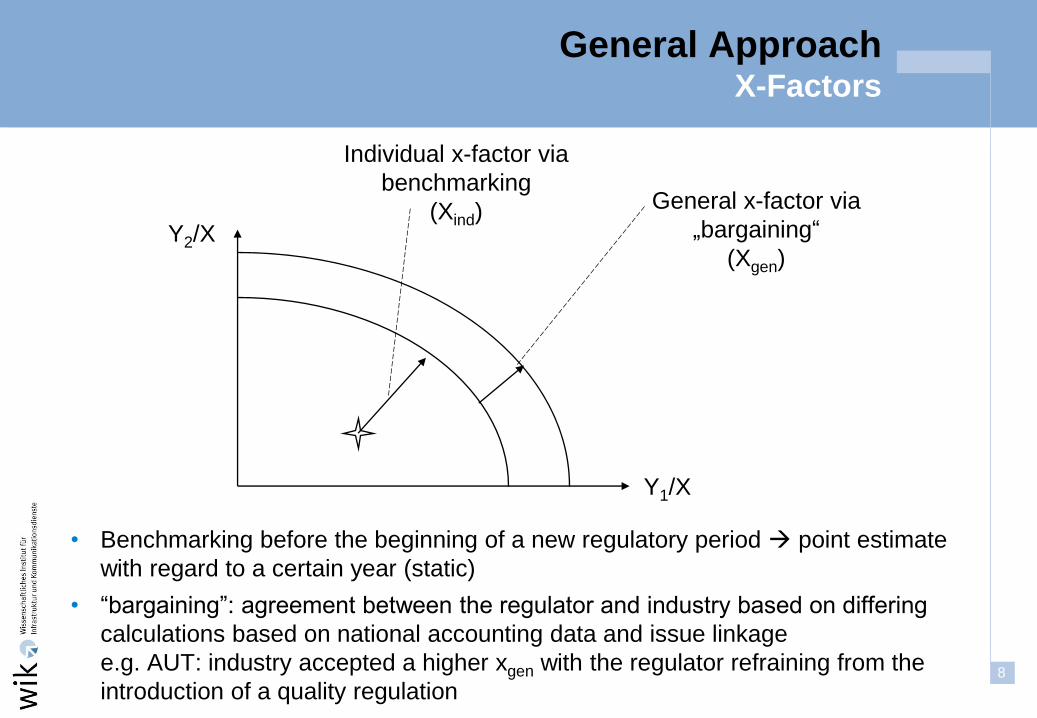
General Approach X-Factors
General x-factor via
„bargaining“
(Xgen)
Individual x-factor via
benchmarking
(Xind)
Y1/X
Y2/X
• Benchmarking before the beginning of a new regulatory period point estimate
with regard to a certain year (static)
• “bargaining”: agreement between the regulator and industry based on differing
calculations based on national accounting data and issue linkage
e.g. AUT: industry accepted a higher xgen with the regulator refraining from the
introduction of a quality regulation
9
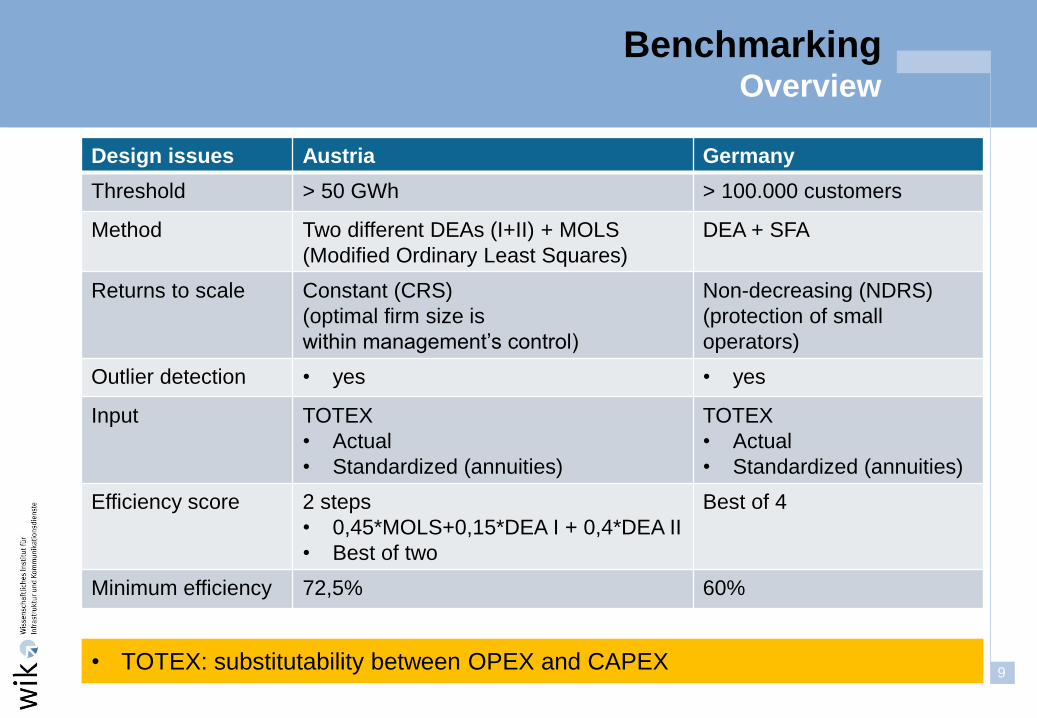
Benchmarking Overview
Design issues Austria Germany
Threshold > 50 GWh > 100.000 customers
Method Two different DEAs (I+II) + MOLS
(Modified Ordinary Least Squares)
DEA + SFA
Returns to scale Constant (CRS)
(optimal firm size is
within management’s control)
Non-decreasing (NDRS)
(protection of small
operators)
Outlier detection • yes • yes
Input TOTEX
• Actual
• Standardized (annuities)
TOTEX
• Actual
• Standardized (annuities)
Efficiency score 2 steps
• 0,45*MOLS+0,15*DEA I + 0,4*DEA II
• Best of two
Best of 4
Minimum efficiency 72,5% 60%
• TOTEX: substitutability between OPEX and CAPEX
10
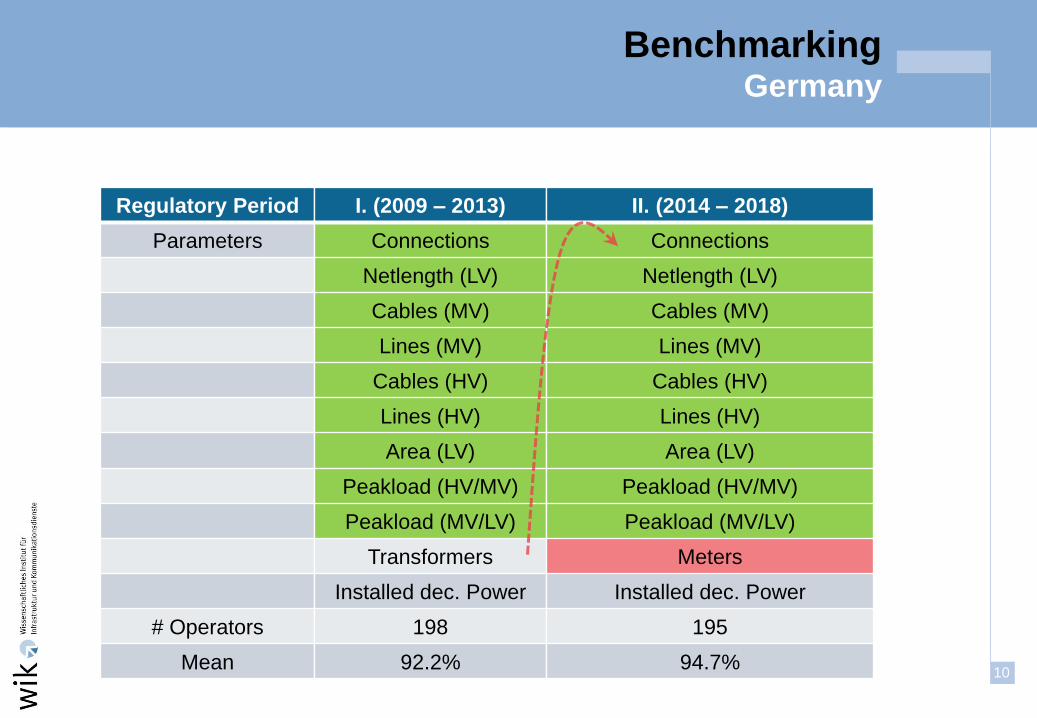
Benchmarking Germany
Regulatory Period
Parameters
# Operators
Mean
I. (2009 – 2013)
Connections
Netlength (LV)
Cables (MV)
Lines (MV)
Cables (HV)
Lines (HV)
Area (LV)
Peakload (HV/MV)
Peakload (MV/LV)
Transformers
Installed dec. Power
198
92.2%
II. (2014 – 2018)
Connections
Netlength (LV)
Cables (MV)
Lines (MV)
Cables (HV)
Lines (HV)
Area (LV)
Peakload (HV/MV)
Peakload (MV/LV)
Meters
Installed dec. Power
195
94.7%
11
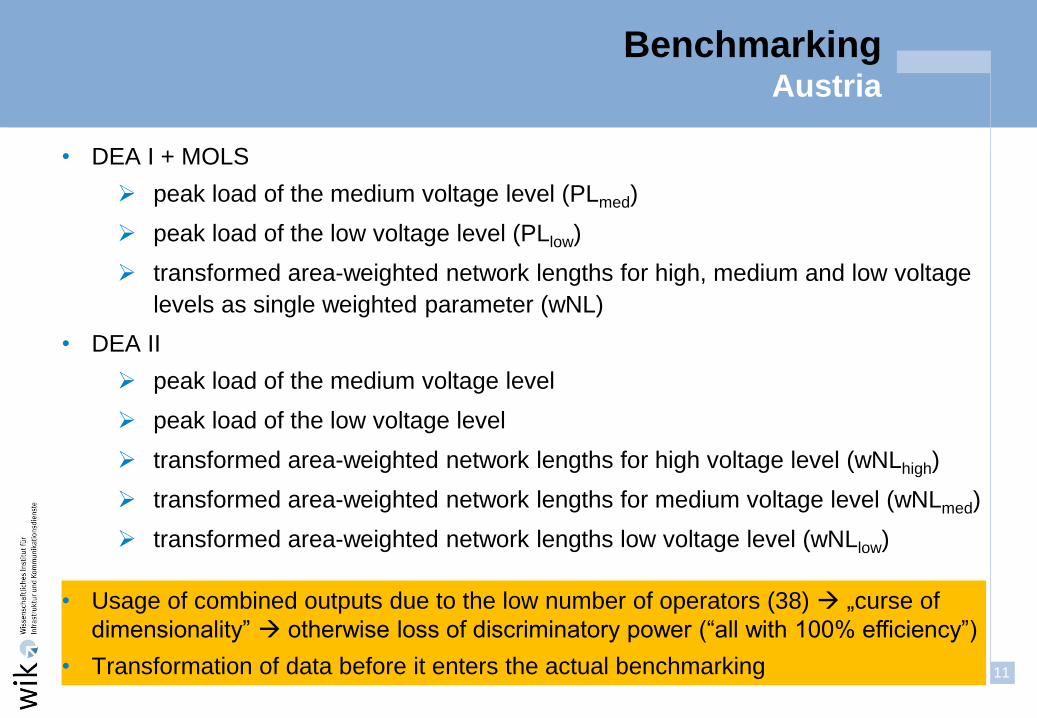
Benchmarking Austria
• DEA I + MOLS
peak load of the medium voltage level (PLmed)
peak load of the low voltage level (PLlow)
transformed area-weighted network lengths for high, medium and low voltage
levels as single weighted parameter (wNL)
• DEA II
peak load of the medium voltage level
peak load of the low voltage level
transformed area-weighted network lengths for high voltage level (wNLhigh)
transformed area-weighted network lengths for medium voltage level (wNLmed)
transformed area-weighted network lengths low voltage level (wNLlow)
• Usage of combined outputs due to the low number of operators (38) „curse of
dimensionality” otherwise loss of discriminatory power (“all with 100% efficiency”)
• Transformation of data before it enters the actual benchmarking

12
Benchmarking Austria
MOLS DEA I DEA II
Input TOTEX TOTEX
stand.
TOTEX TOTEX
stand.
TOTEX TOTEX
stand.
Outputs PLmed
PLlow
wNL
PLmed
PLlow
wNL
PLmed
PLlow
wNL
PLmed
PLlow
wNL
PLmed
PLlow
wNLlow
wNLmed
wNLhigh
PLmed
PLlow
wNLlow
wNLmed
wNLhigh
Ø-efficiency
score
89.44 % 88.85 % 85.80 % 90.28 % 89.26 % 82.48 %
Min. efficiency
score
69.03 % 74.23 % 62.83 % 70.14 % 63.07 % 54.05 %
Number of
efficient op. 6 9 6 9 13 10
13
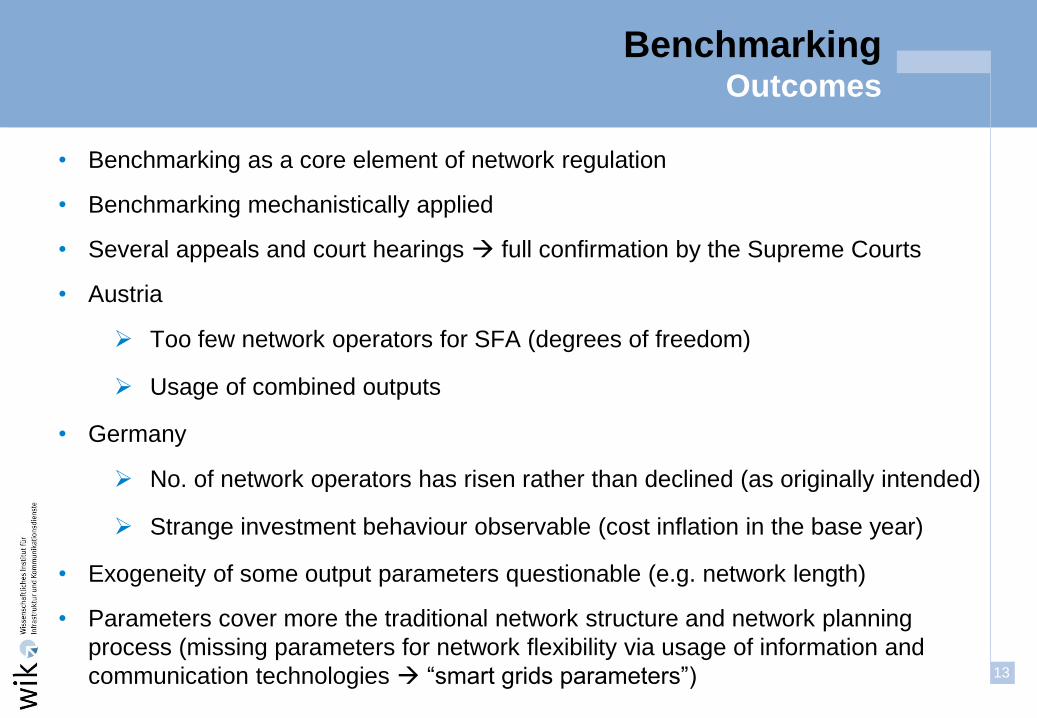
Benchmarking Outcomes
• Benchmarking as a core element of network regulation
• Benchmarking mechanistically applied
• Several appeals and court hearings full confirmation by the Supreme Courts
• Austria
Too few network operators for SFA (degrees of freedom)
Usage of combined outputs
• Germany
No. of network operators has risen rather than declined (as originally intended)
Strange investment behaviour observable (cost inflation in the base year)
• Exogeneity of some output parameters questionable (e.g. network length)
• Parameters cover more the traditional network structure and network planning
process (missing parameters for network flexibility via usage of information and
communication technologies “smart grids parameters”)
14
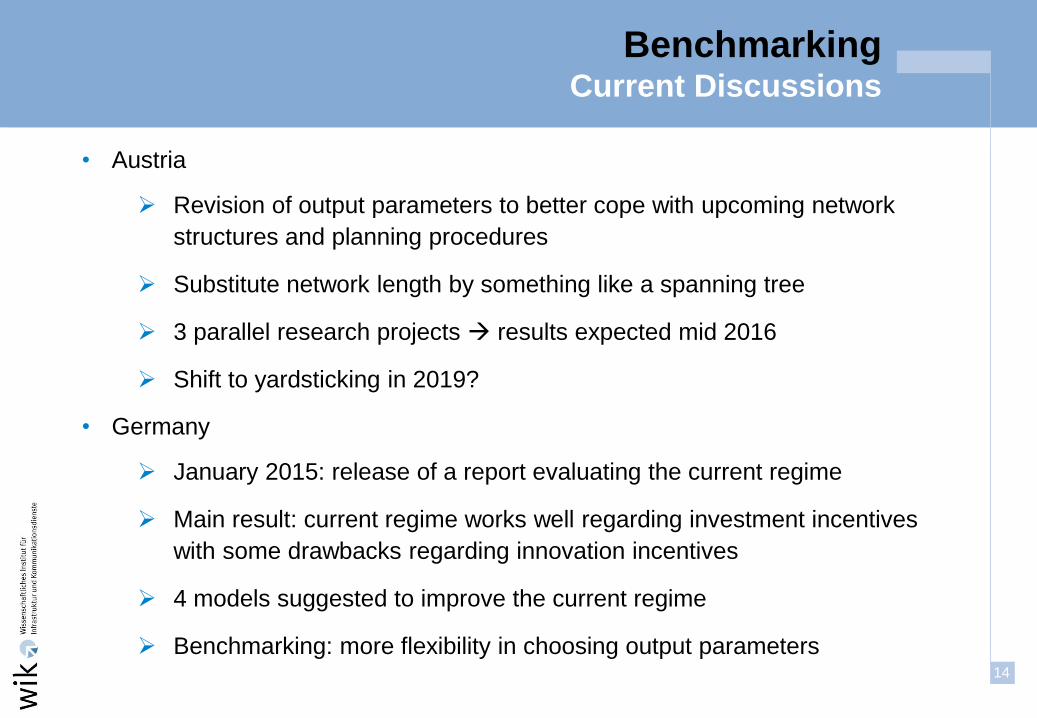
Benchmarking Current Discussions
• Austria
Revision of output parameters to better cope with upcoming network
structures and planning procedures
Substitute network length by something like a spanning tree
3 parallel research projects results expected mid 2016
Shift to yardsticking in 2019?
• Germany
January 2015: release of a report evaluating the current regime
Main result: current regime works well regarding investment incentives
with some drawbacks regarding innovation incentives
4 models suggested to improve the current regime
Benchmarking: more flexibility in choosing output parameters
15
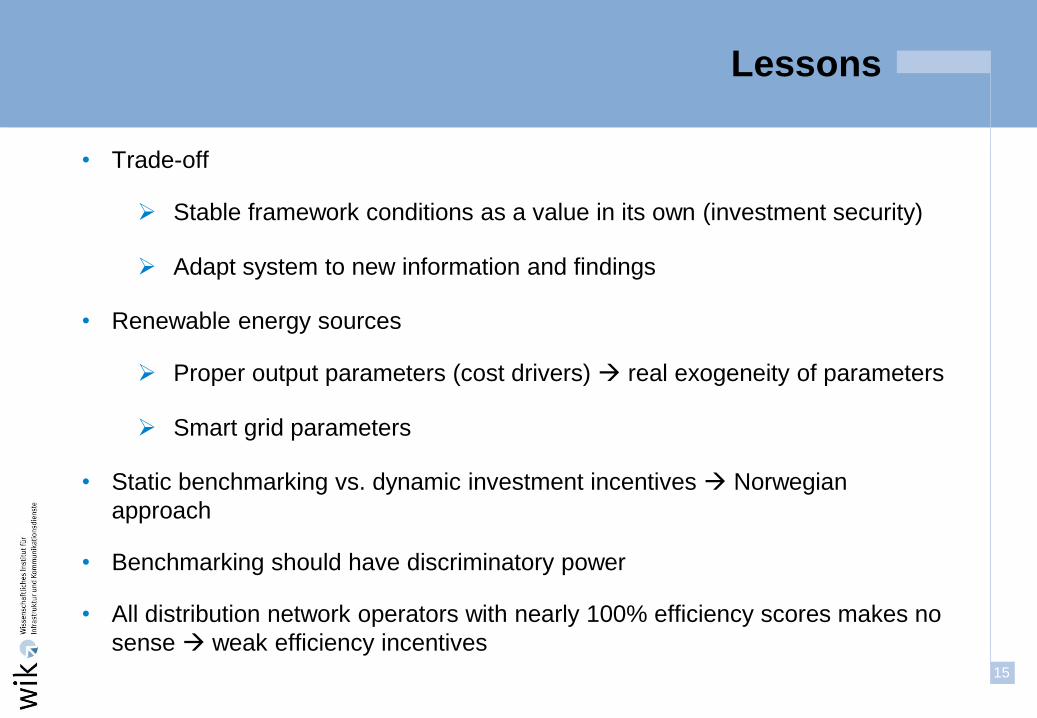
Lessons
• Trade-off
Stable framework conditions as a value in its own (investment security)
Adapt system to new information and findings
• Renewable energy sources
Proper output parameters (cost drivers) real exogeneity of parameters
Smart grid parameters
• Static benchmarking vs. dynamic investment incentives Norwegian
approach
• Benchmarking should have discriminatory power
• All distribution network operators with nearly 100% efficiency scores makes no
sense weak efficiency incentives
16
Contact Information
wik GmbH
Rhöndorfer Straße 68
D - 53604 Bad Honnef
Fon : + 49 - 2224 - 9225 - 83
Fax: + 49 - 2224 - 9225 - 69
http://www.wik.org
Dr. Marcus Stronzik Senior Economist Energy Markets and Energy Regulation
Thank you!