Embed Size (px)
Citation preview

METHODS ARTICLEpublished: 16 September 2014
doi: 10.3389/fpls.2014.00469
Belowground plant development measured with magneticresonance imaging (MRI): exploiting the potential fornon-invasive trait quantification using sugar beet as aproxyRalf Metzner*, Dagmar van Dusschoten , Jonas Bühler , Ulrich Schurr and Siegfried Jahnke
Institute of Bio- and Geosciences, IBG-2: Plant Sciences, Forschungszentrum Jülich GmbH, Jülich, Germany
Edited by:
Julie Dickerson, Iowa StateUniversity, USA
Reviewed by:
Courtney Coleman, University ofMissouri-Columbia, USAZhao Su, The Penn State University,USA
*Correspondence:
Ralf Metzner, Institute of Bio- andGeosciences, IBG-2: Plant Sciences,Forschungszentrum Jülich GmbH,Wilhelm-Johnen-Str., 52425 Jülich,Germanye-mail: [email protected]
Both structural and functional properties of belowground plant organs are critical forthe development and yield of plants but, compared to the shoot, much more difficultto observe due to soil opacity. Many processes concerning the belowground plantperformance are not fully understood, in particular spatial and temporal dynamics and theirinterrelation with environmental factors. We used Magnetic Resonance Imaging (MRI) asa noninvasive method to evaluate which traits can be measured when a complex plantorgan is monitored in-vivo while growing in the soil. We chose sugar beet (Beta vulgarisssp. vulgaris) as a model system. The beet consists mainly of root tissues, is rathercomplex regarding tissue structure and responses to environmental factors, and therebya good object to test the applicability of MRI for 3D phenotyping approaches. Over a timeperiod of up to 3 months, traits such as beet morphology or anatomy were followed inthe soil and the effect of differently sized pots on beet fresh weight calculated from MRIdata was studied. There was a clear positive correlation between the pot size and theincrease in fresh weight of a sugar beet over time. Since knowledge of the developmentof internal beet structures with several concentric cambia, vascular and parenchyma ringsis still limited, we consecutively acquired 3D volumetric images on individual plants usingthe MRI contrast parameter T2 to map the development of rings at the tissue level. Thisdemonstrates that MRI provides versatile protocols to non-invasively measure plant traitsin the soil. It opens new avenues to investigate belowground plant performance underadverse environmental conditions such as drought, nutrient shortage, or soil compactionto seek for traits of belowground organs making plants more resilient to stress.
Keywords: Beta vulgaris ssp. vulgaris (sugar beet), cambial rings, imaging (3D), magnetic resonance imaging
(MRI), non-invasive method, root development
INTRODUCTIONRoots of vascular plants are specialized in mechanical anchoringand resource acquisition often combined with nutrient storage, allof which are key processes for plant performance and crop yield(Waisel et al., 2002; Gregory, 2006). Nevertheless, our knowl-edge of the development of root structure and function is laggingbehind that of the shoot mainly due to the opacity of the soil,hindering direct observation. Roots are also sensitive to excava-tion, which further hampers studying intact and functional rootsystems (Gregory, 2006) as well as other belowground structuressuch as storage organs and their development. Another hindrancewhen studying roots is that they develop naturally in a 3D soilenvironment with biotic and abiotic factors (such as water, nutri-ents, mycorrhiza, or compaction zones) much less homogenouslydistributed than for shoots in the airspace. Roots have adaptedto this by developing in a flexible 3D pattern while exploringtheir soil environment and interacting with it, leading to strongdifferences between the root systems even of plants of the same
genotype (Gregory, 2006; Eshel, 2013). While the architectureof the root system can be complex, the anatomy of roots maybe relatively simple. On the other hand the anatomy of below-ground storage organs can be rather complicated in particularwhen supernumerary or anomalous cambia come into play asfor sugar beet (Artschwager, 1926) or sweet potato (Villordonet al., 2009), and also the resulting morphology may be impor-tant for their function, yield and economic value. Sugar beethas been investigated here as a proxy for a very complex below-ground plant structure, since it consists of tissues originatingfrom the stem, the hypocotyl and to the largest extent, the root(Artschwager, 1926; Draycott, 2006). During growth, all traits ofa beet may be affected by adverse circumstances like obstaclespresent or wounding with obvious growth distortions, giving vis-ible indication of suboptimal growth conditions (Draycott, 2006).Often more than a dozen concentric cambial rings, which aresimultaneously active (Artschwager, 1926), are responsible for theanomalous secondary thickening of the beet, and they are also
www.frontiersin.org September 2014 | Volume 5 | Article 469 | 1

Metzner et al. MRI on belowground sugar beet
tightly linked to the sugar storage function since each cambiumring produces both transport and storage tissues that form thebody of the beet (Artschwager, 1926; Fieuw and Willenbrink,1990; Draycott, 2006). Morphological traits of the beet may beresponsible for adhering soil at harvest that needs to be removedbefore processing (Elliot and Weston, 1993), which accountsfor additional costs, and different morphological sections of abelowground organ like sugar beet may differ in economic value(Mahn et al., 2002). Sugar beet (Beta vulgaris ssp. vulgaris L.), isan important crop contributing to about one quarter of globalsugar production of 160 Mt (Biancardi et al., 2010). Moderncultivars of sugar beet accumulate sucrose up to 20% of thebeet fresh weight (Draycott, 2006) but, as valid for all crops,there is need for continued research either to keep performanceunder less than optimal conditions or to increase performance.Destructive excavation studies delivered mainly snapshots of thedifferent growth stages (Artschwager, 1926, 1930; Rapoport andLoomis, 1986; Hoffmann, 2010). Non-invasive approaches withrhizotrons (Gregory, 2006; Neumann et al., 2009) are not wellsuited to study solid volumetric (3D) structures or gain anatom-ical information on ring development. Linking structure andfunction and correlating them to yield or yield stability has provento be difficult (Doney et al., 1981; Hoffmann, 2010), possibly dueto the lack of detailed developmental data.
Two methods are currently used for non-invasive 3D imagingof roots growing in soil: X-ray computed tomography (CT) andmagnetic resonance imaging (MRI). CT is more widely used dueto lower costs of the instruments and the high spatial resolutionit delivers (Mooney et al., 2012). The contrast is based on X-rayattenuation, which provides only low contrast both between dif-ferent plant tissues (Han et al., 2008; Jung et al., 2012) andbetween plant roots and soil (Gregory et al., 2003; Mooney et al.,2012), thus requiring highly advanced algorithms for automatedsegmentation of root structures (Mooney et al., 2012). MRI onthe other hand offers a wide range of contrast parameters for seg-mentation of organs and tissue structures. The basic principles ofMRI and its use in biomedical sciences are described in detail inseveral textbooks (Callaghan, 1993; Haacke et al., 1999) or arti-cles focusing on applications in plant biology (e.g., Köckenbergeret al., 2004; Blümler et al., 2009; Van As et al., 2009; Borisjuket al., 2012). In plant sciences, applications range from imagingof fruits, seeds, roots or shoot structures (Fedotov et al., 1969;Brown et al., 1986; Kuchenbrod et al., 1995; Köckenberger et al.,2004; Van As et al., 2009; Borisjuk et al., 2012) to measuring waterstatus or water flow in plant organs (Köckenberger, 2001; Windtet al., 2006). Pioneering work on storage organs has been con-ducted on sugar beet (Kano et al., 1993; Macfall and Johnson,1994) and Zantedeschia tuber (Robinson et al., 2000), which bothwere excavated prior to MRI measurements. Here, we employedMRI to monitor belowground storage organs of sugar beet in potsup to 117 mm inner diameter for which appropriate MRI instru-ments and protocols had to be established. A brief overview ofthe method will be given including specific challenges for MRIimaging of storage roots growing in soil.
MRI is based on nuclear magnetic resonance (NMR), whichexploits an intrinsic angular movement of atomic nuclei, calledspin, lending some of them like 1H (protons) a weak magnetic
moment. 1H is the most often used nucleus in MRI due toboth high detection sensitivity and abundant presence in liv-ing tissues. The imaging contrast in plant tissues is, beside thedifferences in proton density, most notably determined by thetime constant of the signal decay. It is also called “relaxation ofnuclear magnetization” and has a longitudinal (T1) and a trans-verse (T2) component with respect to the external magnetic field.Depending on the measurement settings, images can be producedthat are mainly contrasted by either proton density, T1, T2 or anymixture of these three. This can be exploited to obtain optimalvisibility of the targeted structures. The presence of ferromagneticparticles and other soil properties (such as particle size compo-sition) may have negative effects on image quality (Rogers andBottomley, 1987; Asseng et al., 2000) but, when substrates arecarefully selected for low content of ferromagnetic particles orfreed of the strongest ferromagnetic particles, MRI can providerather good images of roots growing in soil (Bottomley et al.,1986; Rascher et al., 2011).
First MRI images of sugar beet in the soil were to our knowl-edge shown in a study exploring the usability of combined MRI-PET (positron emission tomography) measurements on differentplant species (Jahnke et al., 2009). Studying the development ofsugar beet requires clear contrast against the surrounding soil,detecting 3D beet morphology, estimation of fresh weight andvisualization of the ring structures. Our goal was to test whichtraits, relevant for development and yield of belowground stor-age organs, could be monitored with specifically designed MRIinstrumentation and protocols. For sugar beets growing in potsfilled with soil, we acquired data that allowed quantification ofbeet morphology, tissue structures and their development as wellas pot size effects on the fresh weight of the investigated beets.
MATERIALS AND METHODSPLANT MATERIAL, SUBSTRATE AND POTSSugar beet plants (Beta vulgaris ssp. vulgaris var. altissima L.; cul-tivar “Pauletta,” KWS, Einbeck, Germany) were grown from seedin a growth chamber in a mixture of homogenized agriculturaltopsoil and coarse sand (1:2; v/v). This mix is suited for MRIapplication (Rascher et al., 2011; Hillnhütter et al., 2012) but wasnot tested yet for sugar beet cultivation. The agricultural soil,characterized as a gleyic cambisol, was collected by removing thetop 30 cm from a farmer’s field (Kaldenkirchen, Germany) andair dried. Subsequently, the soil was powdered and homogenizedin a drum hoop mixer (J. Engelsmann, Ludwigshafen, Germany),sieved to 2 mm and freed of stronger ferromagnetic particles bymoving it in a thin layer on a conveyor belt through a perpen-dicular magnetic field provided by rare earth magnets (NdFeBN42, 1.3 T; Webcraft GmbH, Gottmardingen, Germany). Coarsequartz sand (grain size 0.71–1.4 mm; Quartzwerke Witterschlick,Alfter, Germany) was similarly freed of ferromagnetic particles.In total, substrate preparation took about 8 min per liter. Theready mixture was filled into PVC tubes of two different sizeswith (a) an inner diameter (I.D.) of 81 mm, a height of 400 mmand a volume of 2.1 L and (b) an I.D. of 117 mm, a height of800 mm and a volume of 8.7 L. Both had 8 mm holes in the bot-tom caps for drainage and aeration covered with nylon mesh (gridsize 200 μm) to prevent loss of substrate and roots growing out.
Frontiers in Plant Science | Technical Advances in Plant Science September 2014 | Volume 5 | Article 469 | 2

Metzner et al. MRI on belowground sugar beet
PLANT CULTIVATIONThe pots were watered to above container capacity and, afterexcess water had drained away, three seeds were laid down inholes 2 cm deep and covered with soil. After germination (5–8days after sowing, DAS), the pots were watered automatically onceper day with a nutrient solution (0.01% Hakaphos blue; Compo,Münster, Germany) that was increased stepwise to 5 times per dayuntil week 8 after sowing. The nutrient concentration was raisedafter 3 weeks to 0.03% and after 8 weeks to 0.05%. The growthchamber was set to 16:8 h, light: dark and 20:16◦C, respectively,while relative humidity was kept constant at 60 ± 3%. Lightingwas provided by 5 × 400 W HPI and 5 × 400 W SON-T lamps(both Philips, Hamburg, Germany) that alternated every 2 h with5 min overlap giving PAR intensity between 350 and 450 μmolm−2 s−1 at canopy level.
HARVEST AND PHOTOGRAPHSImmediately after the respective last MRI measurement, plantswere photographed with a digital camera (D 70; Nikon, Tokyo,Japan) and removed from the pots. Beets were washed care-fully with tap water to remove adhering soil while keeping sideroots intact and dried with paper towels. Afterwards the wholeplants were again photographed from the same perspective asbefore. Fresh weight was taken after removal of the leaves andunthickened roots. Selected beets were sectioned by hand andstained with Astra blue and Safranine, and light micrographswere taken using an Axioplan/Axiophot 2 microscope (Zeiss,Oberkochen, Germany) with attached Nikon D3 Camera at ×50magnification.
MRI INSTRUMENT AND MEASUREMENT SETUPMRI measurements were performed on a plant dedicated verti-cal bore 4.7 T magnet equipped with gradient coils providing300 mT m−1 (Varian, Palo Alto, USA). For plants grown in81 mm I.D. pots, we used a 100 mm I.D. RF coil (sensitive ver-tical length 100 mm; Varian, Palo Alto, USA). For 117 mm pots,we used a 170 mm I.D. RF coil (sensitive vertical length 120 mm;RAPID Biomedical, Würzburg, Germany). Experimental con-trol was run on a Varian VNMRS console and a Linux PCusing the Varian software VnmrJ. During measurements theplants were positioned in the bore of the magnet at a tem-perature of 18◦C. For 3D images, a 3D spin echo sequencewas used (single echo) that subdivided a selected region intoa 3D voxel grid (voxel = volumetric pixel) and required a 3DFourier transformation for image reconstruction (Haacke et al.,1999). Repetition time (TR) was set to 200 ms and echo time(TE) was set to 12 ms. Each measurement took about 10 min.In case additional T2 maps were acquired, a multi spin echosequence (TR = 1200 ms, TE = 5.4+ n∗5.4 ms, n = 0 . . . 7) wasused giving multiple echoes for 5 slices positioned horizontallythrough the thickest part of the beet and spaced 4 mm apart.The sequence was custom written and, by keeping echo timesshort, negative effects of diffusion through background gradients(caused by air pockets inside the beet) were minimized (Edzeset al., 1998). Measurement time for T2 maps with a field ofview of 63 × 63 mm2 and pixel size of 164 × 164 μm2 was about30 min.
DATA HANDLING, IMAGE PROCESSING AND BIOMASS CALCULATIONFor image visualization and 3D representations of the datasets,the software package Mevislab (version 2.2.1, MeVis MedicalSolutions, Bremen, Germany) was used in combination withMatlab (Mathworks, Natick, USA) and the open source Matlabtoolbox AEDES (version r172, www.aedes.uef.fi). The 3D MRIdatasets of the sugar beets were processed with Mevislab wherethe beet volumes were segmented from noise, water in soil pock-ets, petioles and the unthickened taproot by manually setting anintensity threshold and a region of interest under visual control.From a segmented beet the maximal beet diameter was automat-ically measured for all virtual axial slices using a home writtenMatlab script. Here, the maximal beet diameter was defined asthe maximal possible distance line covering the centroid for allvirtual axial slices. For the eight plants grown in 81 mm pots, themean of the maximum diameters is shown in Table 1.
For an undisturbed beet plant growing in soil, a “calculatedfresh weight” (cFW) was obtained by multiplying the beet volumemeasured with MRI with a density derived from different beets ofthe same cultivar grown under similar conditions. For these refer-ence plants the beet volume was measured with MRI, and directlyafterwards the respective fresh weight (FW) of the harvested beetwas determined resulting in a mean density of 1.17 ± 0.16 g ml−1
(mean ± SD; n = 21 plants). Calculated fresh weight for each potsize is displayed in Figure 3 as mean ± SD (n = 8) along witha polynome of 2nd order fitted to the mean values (R2 = 0.9998)with Sigma Plot (version 11, Systat Software, San Jose, USA). Thisfit was also used to extrapolate values for the cFW-81 curve inFigure 3 beyond 129 DAS. For comparing the development ofbeet biomass we first plotted the individual data points from bothpot sizes (cFW-81 and cFW-117) against time and fitted quadraticregressions separately for each pot size and for all data in SigmaPlot. Then we performed a sum of squares reduction test (Gallant,1987) using Excel (version 14.0, Microsoft, Redmont, USA) toevaluate significance of pot size effects. The functions of those fitswere used to interpolate the values for cFW-81 on 53 DAS andcFW-117 (Table 2) on 118 DAS respectively.
T2-MAPS AND ANALYZING THE WIDTH OF BEET RINGST2 relaxation times are correlated to characteristics of differentplant tissues such as cell size, membrane permeability and solutecontent (Edzes et al., 1998; Van As et al., 2009) and may therefore
Table 1 | Development of the maximal diameter and volume of eight
sugar beet plants grown in 81 mm ID pots in a climate chamber,
including the specimen shown in Figure 2, given as arithmetic
mean ± SD.
DAS [days] Diameter [cm] Volume [cm3]
53 1.5 ± 0.3 5.5 ± 2.2
67 2.5 ± 0.4 15.3 ± 4.8
81 3.3 ± 0.4 31.0 ± 7.1
102 4.4 ± 0.3 57.4 ± 9.2
130 5.0 ± 0.4 104.0 ± 9.9
DAS, days after sowing.
www.frontiersin.org September 2014 | Volume 5 | Article 469 | 3
Metzner et al. MRI on belowground sugar beet
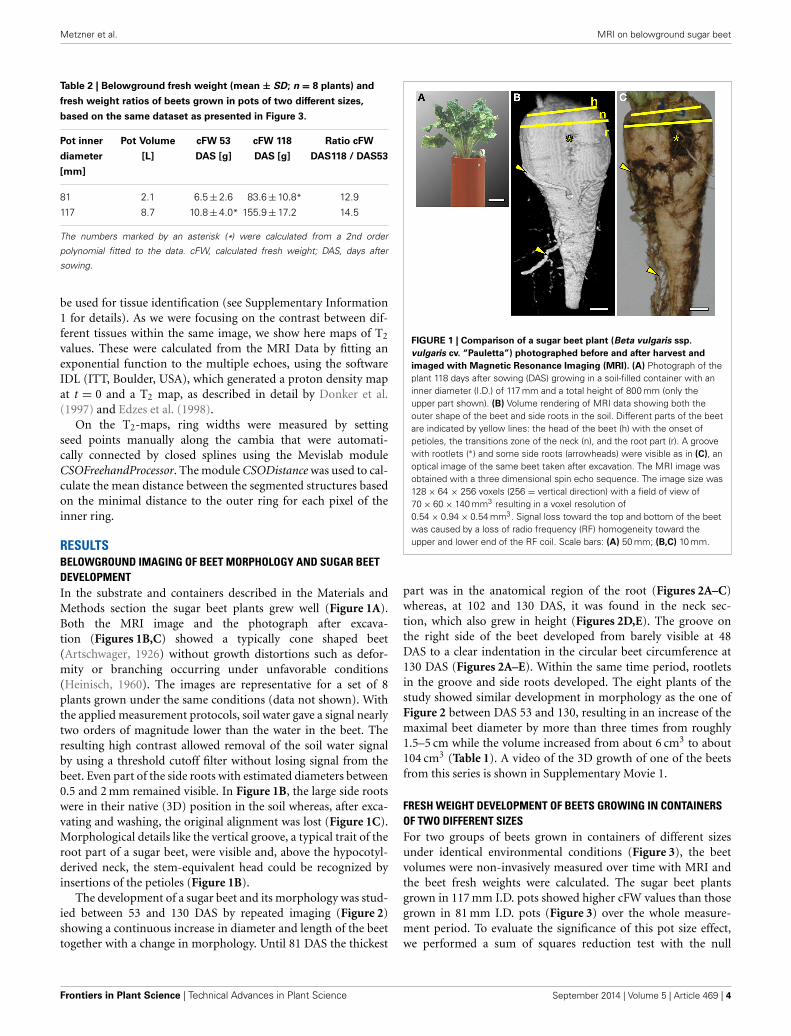
Table 2 | Belowground fresh weight (mean ± SD; n = 8 plants) and
fresh weight ratios of beets grown in pots of two different sizes,
based on the same dataset as presented in Figure 3.
Pot inner Pot Volume cFW 53 cFW 118 Ratio cFW
diameter [L] DAS [g] DAS [g] DAS118 / DAS53
[mm]
81 2.1 6.5 ± 2.6 83.6 ± 10.8* 12.9
117 8.7 10.8 ± 4.0* 155.9 ± 17.2 14.5
The numbers marked by an asterisk (*) were calculated from a 2nd order
polynomial fitted to the data. cFW, calculated fresh weight; DAS, days after
sowing.
be used for tissue identification (see Supplementary Information1 for details). As we were focusing on the contrast between dif-ferent tissues within the same image, we show here maps of T2
values. These were calculated from the MRI Data by fitting anexponential function to the multiple echoes, using the softwareIDL (ITT, Boulder, USA), which generated a proton density mapat t = 0 and a T2 map, as described in detail by Donker et al.(1997) and Edzes et al. (1998).
On the T2-maps, ring widths were measured by settingseed points manually along the cambia that were automati-cally connected by closed splines using the Mevislab moduleCSOFreehandProcessor. The module CSODistance was used to cal-culate the mean distance between the segmented structures basedon the minimal distance to the outer ring for each pixel of theinner ring.
RESULTSBELOWGROUND IMAGING OF BEET MORPHOLOGY AND SUGAR BEETDEVELOPMENTIn the substrate and containers described in the Materials andMethods section the sugar beet plants grew well (Figure 1A).Both the MRI image and the photograph after excava-tion (Figures 1B,C) showed a typically cone shaped beet(Artschwager, 1926) without growth distortions such as defor-mity or branching occurring under unfavorable conditions(Heinisch, 1960). The images are representative for a set of 8plants grown under the same conditions (data not shown). Withthe applied measurement protocols, soil water gave a signal nearlytwo orders of magnitude lower than the water in the beet. Theresulting high contrast allowed removal of the soil water signalby using a threshold cutoff filter without losing signal from thebeet. Even part of the side roots with estimated diameters between0.5 and 2 mm remained visible. In Figure 1B, the large side rootswere in their native (3D) position in the soil whereas, after exca-vating and washing, the original alignment was lost (Figure 1C).Morphological details like the vertical groove, a typical trait of theroot part of a sugar beet, were visible and, above the hypocotyl-derived neck, the stem-equivalent head could be recognized byinsertions of the petioles (Figure 1B).
The development of a sugar beet and its morphology was stud-ied between 53 and 130 DAS by repeated imaging (Figure 2)showing a continuous increase in diameter and length of the beettogether with a change in morphology. Until 81 DAS the thickest
FIGURE 1 | Comparison of a sugar beet plant (Beta vulgaris ssp.
vulgaris cv. “Pauletta”) photographed before and after harvest and
imaged with Magnetic Resonance Imaging (MRI). (A) Photograph of theplant 118 days after sowing (DAS) growing in a soil-filled container with aninner diameter (I.D.) of 117 mm and a total height of 800 mm (only theupper part shown). (B) Volume rendering of MRI data showing both theouter shape of the beet and side roots in the soil. Different parts of the beetare indicated by yellow lines: the head of the beet (h) with the onset ofpetioles, the transitions zone of the neck (n), and the root part (r). A groovewith rootlets (∗) and some side roots (arrowheads) were visible as in (C), anoptical image of the same beet taken after excavation. The MRI image wasobtained with a three dimensional spin echo sequence. The image size was128 × 64 × 256 voxels (256 = vertical direction) with a field of view of70 × 60 × 140 mm3 resulting in a voxel resolution of0.54 × 0.94 × 0.54 mm3. Signal loss toward the top and bottom of the beetwas caused by a loss of radio frequency (RF) homogeneity toward theupper and lower end of the RF coil. Scale bars: (A) 50 mm; (B,C) 10 mm.
part was in the anatomical region of the root (Figures 2A–C)whereas, at 102 and 130 DAS, it was found in the neck sec-tion, which also grew in height (Figures 2D,E). The groove onthe right side of the beet developed from barely visible at 48DAS to a clear indentation in the circular beet circumference at130 DAS (Figures 2A–E). Within the same time period, rootletsin the groove and side roots developed. The eight plants of thestudy showed similar development in morphology as the one ofFigure 2 between DAS 53 and 130, resulting in an increase of themaximal beet diameter by more than three times from roughly1.5–5 cm while the volume increased from about 6 cm3 to about104 cm3 (Table 1). A video of the 3D growth of one of the beetsfrom this series is shown in Supplementary Movie 1.
FRESH WEIGHT DEVELOPMENT OF BEETS GROWING IN CONTAINERSOF TWO DIFFERENT SIZESFor two groups of beets grown in containers of different sizesunder identical environmental conditions (Figure 3), the beetvolumes were non-invasively measured over time with MRI andthe beet fresh weights were calculated. The sugar beet plantsgrown in 117 mm I.D. pots showed higher cFW values than thosegrown in 81 mm I.D. pots (Figure 3) over the whole measure-ment period. To evaluate the significance of this pot size effect,we performed a sum of squares reduction test with the null
Frontiers in Plant Science | Technical Advances in Plant Science September 2014 | Volume 5 | Article 469 | 4

Metzner et al. MRI on belowground sugar beet
FIGURE 2 | Series of MRI images showing the development of a sugar
beet in the soil with largest diameter highlighted. (A–E) Volumerenderings of 3D volumetric MRI datasets between 53 and 130 DAS. Thesugar beet plant was grown and measured in a container with 81 mm I.D.and a height of 400 mm. Yellow planes denote the position of the largest
diameter of the beet. In (A–D) the field of view (FOV) was70 × 50 × 140 mm3 with an image size of 128 × 48 × 256 voxels and, in(E) the FOV was 70 × 70× 140 mm2 with an image size of 128 × 64 × 256voxels. The same measurement protocol as in Figure 1B was used. Scalebar: 20 mm.
FIGURE 3 | Development of sugar beets grown in containers with
either 117 mm I.D. (800 mm in height; cf. Figure 1) or 81 mm I.D.
(400 mm in height; cf. Figure 2) for which calculated fresh weights of
the beets (cFW-117 and cFW-81) were derived from MRI measurements
every second week. A polynomial of 2nd order was fitted to the datapoints (for both R2 = 0.9998). The fresh weight of the beets in the largecontainers was taken after harvest following the respective last MRImeasurement at 118 DAS (FW-117). For the small containers, the cFW-81curve beyond 129 DAS (dotted line) was extrapolated based on thepolynomial for comparison with the fresh weight taken at slightly delayedharvest on 139 DAS (FW-81). The MRI measurements used the same MRIsequences and parameters as of Figure 1B. The values and error bars aregiven as arithmetic mean ± SD (n = 8 plants, respectively).
hypothesis that there was no difference between plants growingin different pot sizes. The F-ratio turned out to be very high,FR = 80.3 leading to an extremely low p value, p < 0.0001. Thus,the null hypothesis was rejected, proving that there was a statisti-cally significant difference between the two groups of sugar beetplants over the time of observation. Between DAS 53 and 118,the cFW values of the beets increased by a factor of 12.9 in thesmall (I.D. 81) pots and a factor of 14.5 in the large (I.D. 117)pots (Table 2). The beet biomass in the large (8.7 L) pots was
66% and 86% higher than in the small (2.1 L) pots at DAS 53and DAS 118, respectively. Poorter et al. (2012a, see Appendix3 therein) observed that plant biomass generally scales with potvolume as fB = f s
v where fB = B2/B1 is the fraction by whichbiomass increases if pot size is increased by a factor fV = V2/V1;the slope S can be determined as S = log (fB)/ log (fV ). For a dou-bling of the pot volume, i.e., fV = 2, the increase in biomass isthen fB = 2S. Using this equation we calculated that the biomassof a double sized pot (4.2 L) compared to the small one (2.1 L)would have been 28 and 36% higher at DAS 53 and DAS 118,respectively.
IN VIVO ANALYSIS OF THE BEET ANATOMY AT TISSUE LEVELIn Figure 4A the positions of two virtual slices through the thick-est part of a sugar beet are indicated by intersecting planes.An MRI multi-echo multi-slice sequence was used to map thecontrast parameter T2 of both slices at the same time, result-ing in T2 maps (Figures 4B,D). Magnifications of the regionsmarked by cyan frames are shown in Figures 4C,E. The T2 mapsof Figures 4B–E show concentric rings, which are narrow andbright indicating longer T2 values, alternating with darker ringsof inhomogeneous gray values with shorter T2 times. Microscopicinvestigations on different beets harvested at the same age anddevelopmental stage revealed the narrow bright rings in the MRIimages as cambia (white arrowheads; Figures 4F,G). The border-ing darker zones were identified as xylem and phloem (red andblue arrowheads respectively; Figures 4C,F,G) and the broad lightgray rings between the cambial/vascular zones as parenchyma(Pa; Figures 4C,F–G). Both slices showed eight cambial rings,the two outermost barely visible by the bright lines of the cam-bia; the parenchyma in the upper slice (Figures 4B,C) appearedmuch darker than the cambia and only structured by radial lineswhereas, in the lower plane (Figures 4D,E), the parenchyma wasmuch brighter in the middle part and almost as bright as the cam-bia; the core of the beet had a diffuse split shape in the upper plane(Figure 4C), while in the lower plane (Figure 4E), it showed abright round structure. The onset of side roots disturbing the reg-ular ring structure is clearly visible in Figure 4D on the left side.
www.frontiersin.org September 2014 | Volume 5 | Article 469 | 5

Metzner et al. MRI on belowground sugar beet
FIGURE 4 | Internal structures of different regions of a sugar beet imaged
with MRI at 129 DAS and light microscopic images of cross sections
taken from another plant of similar age. (A) Volume rendering of the 3Ddataset of the whole beet, with virtual cuttings to visualize internallongitudinal structures. Colored planes (yellow and blue) denote the positionsof the virtual cross sections of (B,D). Magnified sections of (B,D) are shownin (C,E), respectively. The cross sections represent maps of the MRI contrastparameter T2 (transverse relaxation time) on virtual slices through the beetscaled from 0 to 35 ms; for clarity of view, T2 times >35 ms were set to35 ms. For identification of the structures indicated by arrows in the MRIimages they were highlighted in the microscopic images (stained with Astra
Blue and Safranin), with (F) showing an overview including the beet core andthree rings and (G) displaying higher magnification of a typical vascularbundle of such cambial rings. Identified tissues include parenchyma (Pa),cambium (Ca and white arrowheads), xylem (X and red arrowheads), andphloem (Ph and blue arrowheads). Plants were grown in tubes with 81 mminner diameter. Image (A) was acquired with the MRI protocol of Figure 1B
but with slightly modified parameters (FOV 70 × 70× 140 mm3 with animage size of 128 × 64 × 256 voxels). The T2maps of (B,D) were achievedwith a multi-echo sequence (slice thickness in vertical direction 1 mm, FOV inplane 63 × 63 mm3 with an image size of 384 × 384 pixels). Scale bars: (A–E)
5 mm; (F) 1 mm; (G) 0.1 mm.
These anatomical details of the core and the side roots both pointto the lower section (Figures 4D,E) belonging to the root part ofthe beet. The upper section (Figures 4B,C) on the other hand wasobviously located in the hypocotyl/shoot part of the beet.
From a sugar beet imaged regularly between 53 and 129 DAS,a time series of T2 maps of the same location within the beetshowed an increasing number of cambial rings during develop-ment: 5, 7, 8, and 9 at DAS 67, 81, 103, and 129, respectively(Figures 5A–D). The beet diameter increased by more than afactor of two between DAS 81 and 129, accompanied by a differ-ential broadening of the individual cambial rings. Figures 5E,F,showing magnifications of comparable regions of the beet atDAS 81 and 129, reveals that this increase in distance betweencambia appears to be caused by an increase in the width ofthe parenchyma rings. The width of the inner rings, especiallyrings two to four, more than tripled, while ring one showeda doubling in width (Figure 5G). During development of thebeet, the indentation of the grooves became more pronounced(Figures 5A–D).
DISCUSSIONINVESTIGATING ROOTS WITH MRI—SUGAR BEET AS A MODELThick roots or other belowground storage organs deliver a largenumber of agricultural products, such as potato, which ranks asthe fourth largest food crop (Viola, 2000), sugar beet, which isthe second most important source of sucrose (Biancardi et al.,2010), and ginger, which is used as both a spice and a phar-maceutical resource (Nair, 2013). Nevertheless, application ofrecently emerging techniques for 3D root imaging in soil has beenfocused mainly on (“ordinary”) roots of crops such as cereals orlegumes with X-ray CT (Mooney et al., 2012) as well as in thefirst studies involving MRI for investigating 3D root development(Jahnke et al., 2009; Rascher et al., 2011). A similar approachapplies for optical imaging of thin roots growing in the artifi-cial environment of transparent gel chambers for crops such asrice (Clark et al., 2011) or barley (Hargreaves et al., 2009). Largesize or intricately structured belowground plant organs on theother hand pose special requirements to the imaging methods.This is particularly the case for sugar beet, where the beet shows
Frontiers in Plant Science | Technical Advances in Plant Science September 2014 | Volume 5 | Article 469 | 6

Metzner et al. MRI on belowground sugar beet
FIGURE 5 | Development of the rings of a sugar beet at the thickest part
of the root region visualized and analyzed by MRI images (T2 maps). Thevirtual cross sections (A–D) show the development of the beet and the ringsbetween 81 and 129 DAS. Magnified areas at 81 (B) and 129 DAS (D) arepresented in (E) and (F), respectively. The development of the width of the
innermost four rings over time is shown in (G), including 53 DAS for whichthe T2-map is not shown here. Ring width was measured as the distancebetween the cambia. For identification of the particular tissues, abbreviationsand measurement parameters see Figure 4. Scale bars: (A–D) 10 mm;(E,F) 5 mm.
very complex tissue structures compared to most other storageorgans due to its anomalous secondary thickening (Artschwager,1926), which makes noninvasive assessing of the beet anatomyrather challenging. At later growth stages, the beet develops sideroots of increasing size toward its lower end (Artschwager, 1937).This fact can be used to monitor the actual position (align-ment) of these side roots in the soil and also to test which sizesof smaller roots can still be visualized with an imaging proto-col optimized for a bulk structure. Sugar beet also develops acharacteristic morphology and reacts to invasive manipulationwith growth disturbances (Artschwager, 1926; Heinisch, 1960),making it an adequate model plant to test the capabilities ofmonitoring changes of both morphology and anatomy with anon-invasive approach while the beet is growing in the soil.
For MRI measurements of roots growing in soil, some pre-requisites must be met concerning pot shape and size as well assubstrate properties. Cylindrical containers fit best in the boreof the 4.7 T MRI magnet used in this study. The described mixof agricultural topsoil and coarse sand proved to be well suitedfor both plant growth and MRI imaging of sugar beets as goodimage quality was obtained for both the 81 mm I.D. (Figure 4)and the 117 mm I.D. pots (Figures 1, 2). The mineral soil mixwas also closer to field conditions than commercial potting soilswith often unnaturally high contents of peat. It enabled pre-cise monitoring of belowground plant organs like beets in theirnative environment including the 3D-alignment of side roots(Figure 1B) not preserved after excavation (Figure 1C). Problemswith MRI measurements such as image distortions (Bottomleyet al., 1986; Tollner et al., 1991; Heeraman et al., 1997) renderedseveral authors (Asseng et al., 2000; Mooney et al., 2012) to doubtthe usability of MRI for investigating roots in soil in general,however, here we show that by appropriate MRI measurement
sequences and settings such artifacts could be minimized. Rootswith a diameter down to 500 μm were still detectable with MRI,even in the 117 mm I.D. pots, which fits well with the resultswhere early and therefore relatively simple root systems of maize(Jahnke et al., 2009) or bean (Rascher et al., 2011) were imaged inour lab.
Comparable studies on root systems in soil have been con-ducted so far mainly with X-ray CT (Mooney et al., 2012; Tracyet al., 2012). This technique can be used to image whole con-tent of pots including soil particles and roots accurately with highspatial resolution for segmenting root systems and their archi-tecture. However, due to the inherently low attenuation contrastlevels between roots and soil, rather sophisticated image analy-sis tools are needed (Mairhofer et al., 2012, 2013; Mooney et al.,2012). MRI offers a much better contrast between roots and soil,which is demonstrated by the fact that the images shown hereare only treated by a noise cut-off without any further process-ing. The requirement to remove strongly ferromagnetic particlesfrom the substrate limits the application of the MRI technique, assoil structure is disturbed after drying and sieving necessary forthe mechanized removal. A similar procedure has been reportedin high resolution CT studies to get a more homogenous back-ground for better segmenting roots from the soil in the imageprocessing (e.g., Gregory et al., 2003; Hargreaves et al., 2009;Zappala et al., 2013), so this appears to be a common limita-tion of both techniques. And even such processed soil is muchcloser to a natural soil compared to other 3D imaging approachessuch as gel chambers (Iyer-Pascuzzi et al., 2010). Albeit the soilmix used here worked fine, it remains to be clarified which othersoil types can be used. Preliminary experiments in our lab as wellas the older survey of a number of American agricultural soiltypes by Rogers and Bottomley (1987) suggests that several others
www.frontiersin.org September 2014 | Volume 5 | Article 469 | 7

Metzner et al. MRI on belowground sugar beet
might be suitable, which would make MRI applicable to a numberof different investigations targeting root system architecture anddevelopment of other crop species under different soil conditions.Both imaging modalities, MRI and X-ray CT, can be consideredto still being at the stage of method development in particularwith respect to investigating root biology in the soil. Since thetwo methods reveal similar but also complementary information,only application studies of root systems of various plants underdifferent conditions will reveal which approach might be best forspecific research questions.
As already mentioned we have chosen sugar beet here as aproxy for studying belowground storage organs of plants. Forcomparison of different plants or genotypes and the detectionof treatment effects, the quantification of specific (beet) traits ismandatory. Beet growth (in terms of volume) was non-invasivelygathered and the increase in fresh weight over time was approx-imated. While volume determination with MRI is rather precisedue to the high contrast between beet and soil, the accuracy ofcalculated fresh weight depends on the reliability of beet densitytaken from reference plants, which were harvested and weighedat similar ages as those in the experiments discussed here, aftersimilar volume determination by MRI. Eventually, the correct-ness of the calculated fresh weight was verified at the end of anexperimental series by measuring the true fresh weight (FW) afterharvest (Figure 3). The current study shows that cFW values werea rather good approximation of beet FW in the soil, which allowsmonitoring the development of individual sugar beet plants overtime. The number of samples that can be measured with MRIin studies on morphological development is markedly smallerthan in greenhouse trials with pots or rhizotrons. Even automatedsample handling systems do not allow measuring more than 20plants per day at the detail level shown here (Figures 4, 5). On theother hand, this bottleneck might be less relevant due to the factthat trait development monitored on individual plants has lessvariance compared to measurements by destructive approachesneeding different subgroups within a population. And the 3Dstructure and development of beets and their tissues can be stud-ied only with tomographic techniques providing good contrastand adequate spatial resolution.
IMAGING 3D DEVELOPMENT OF A SUGAR BEET AND ITS POTENTIALAPPLICATIONSThe distinct shape of a sugar beet and its correlation to sugarstorage capability has been studied in the past (De Vries, 1879;Artschwager, 1926; Heinisch, 1960), and researchers had to relyon large numbers of plants and several harvests to get informationon average beet development (Ulrich, 1952; Trebbi and Mcgrath,2009). While different shapes at harvest were extensively charac-terized and used as criteria in breeding selection, the developmentof individual beets and its role in performance and yield forma-tion could not be investigated. Here, noninvasive MRI was usedto study morphological beet parameters of individual sugar beetssuch as increase in diameter (Table 1) or different growth ratesof both neck and root part (see Figure 2) over time. While atharvest the content of sugar increases from the head to the rootregion of the beet, parameters lowering the quality for sugar pro-duction like potassium, sodium and α-amino N decrease (Mahn
et al., 2002), causing different economic values of the beet parts(Draycott, 2006). Therefore, a deeper knowledge of the devel-opment of different genotypes may also be valuable for a betterunderstanding of sugar yield. Furthermore, effects of environ-mental factors (both above- and belowground) on traits of thedifferent beet parts can be studied by repeated imaging. This abil-ity might also prove useful for investigating potatoes, where themorphological traits of the seed tubers affect shoot developmentin many ways (Struik, 2007). 3D imaging could also be appliedfor targeted sampling of tissues from actively growing regionsof a beet as applied to growing zones of leaves for genetic andmetabolic profiling (Matsubara et al., 2006). One important traitof sugar beet visible with MRI early in development is the beetshape, which also affects post-harvest processing. For example soilsticking to the roots in the beet grooves (Figures 2, 5) leads tolesser quality of sugar production and more cleaning efforts areneeded (Draycott, 2006).
QUANTIFICATION OF BEET DEVELOPMENT AND EFFECTS OFCONTAINER SIZEWhether pot size affected beet development was monitored byrepeatedly measuring individual sugar beet plants with MRIunder controlled conditions (Figure 3). Pot size is an importantparameter, which, in experimental approaches, should be opti-mized allowing good plant development while keeping space ina climate chamber and handling efforts within acceptable lim-its (Poorter et al., 2012b). This is particularly important forMRI experiments where plants and pots also have to fit insidethe instrument. In our experiment, beets growing in larger potsshowed significantly higher biomass than those in smaller onesalready starting at early developmental stages (Figure 3). We mea-sured a significant increase in cFW up to 86% when comparingthe plants in the small pots and those growing in the large pots(with a fourfold larger volume). We estimated from this that adoubling of pot size of the smaller pots would have increased thefresh weight by 36% on 118 DAS. This is slightly below the 43%increase of biomass Poorter et al. (2012a) calculated for a dou-bling of pot volume but within the range of the data cited inthe meta-analysis. Obviously the meta-analysis by Poorter et al.(2012a) and our data are not directly comparable since Poorteret al. (2012a) focused on total plant biomass whereas here onlythe storage organ of sugar beet plants was measured. It shows,however, that also for designing experiments with potted sugarbeets and maybe other storage organs, possible differences indevelopmental stages or accumulation of biomass need to beconsidered when different pot sizes are used. The statistically sig-nificant difference found for the whole growth curves in Figure 3demonstrates that the pot size effect was already effective at theearly stages of beet development when counter-pressure of thepot wall could not have come into play. Also, spacing betweenpots was large enough to prevent overlap of canopies and waterand nutrient supply was similar. Together, this indicates that con-finement not of the beets themselves but of the regular roots mayhave affected the beet fresh weight development as suggested forplant biomass in general by Poorter et al. (2012a). Studies onother root systems may benefit from such dynamic analysis ofroot biomass and its distribution within the pot for investigating
Frontiers in Plant Science | Technical Advances in Plant Science September 2014 | Volume 5 | Article 469 | 8

Metzner et al. MRI on belowground sugar beet
the mechanisms of growth limitation by root confinement. Thisis a relevant question in many respects as the high throughputsystems for automated phenotyping, which have been developedin recent years (Granier et al., 2006; Nagel et al., 2009), have potsize restrictions by necessity and, even in the field, rooting spacemay be limited e.g., by compacted soil patches (Hatfield, 1992). Inaddition to the pot size effects shown here on beet development,MRI can be used also to study other stress response dynamics suchas effects of pathogen infection on roots or storage organs, whichmay occur before they become detectable aboveground.
TISSUE IDENTIFICATION AND MAPPINGAll storage organs are composed of characteristic combinationsof tissues to fulfill their biological function, which is mainly stor-age of carbohydrates, lipids, and/or proteins to support offspringor following year development. At the same time the efficiencyof storage defines the commercial yield of crops such as potato,yam, sweet potato, or sugar beet. Concerning the internal struc-ture of a sugar beet, one of the key processes is the developmentof the rings consisting of cambia, vascular and storage tissues. T2
mapping with high spatial resolution allows for detailed investi-gations since T2 is often highly correlated with cell and/or vacuolesize (positive correlation; Macfall and Johnson, 1994; Edzes et al.,1998; Van Der Weerd et al., 2001) and membrane permeability(negative correlation; Van Der Weerd et al., 2002; Van As, 2007).Also negatively correlated are the usually weaker effects of cell wallthickness and the concentration of solutes like sugars in the vac-uoles (Callaghan et al., 1994; Raffo et al., 2005). A more detailedexplanation of the factors influencing T2 in plant tissues can befound in Supplementary information 1. The longest T2 timeswere found in the cambia (Figures 4, 5) possibly caused by verythin cell walls typical for meristematic tissues (Esau and Evert,2006) as validated in light microscopic images (e.g., Figure 4G).Similar long T2 times of cambia as compared to the surround-ing parenchyma were reported for apple fruits (Sibgatullin et al.,2010). The increasing T2 times in the middle of the parenchymarings over time (compare Figures 5E,F) can be explained by anincrease in vacuole size following cell expansion as describedfor this tissue (Artschwager, 1930; Zamski and Azenkot, 1981).Shorter T2 values of xylem and phloem areas may be due to tentimes smaller cell diameters for both tissues compared to thecells in the parenchyma rings (Artschwager, 1930; Zamski andAzenkot, 1981). For the xylem, the thick cell walls (Artschwager,1930) may also play a role in shortening T2 time just as the highsugar content of the sieve tubes and the apoplast of the phloemparenchyma in the phloem (Fieuw and Willenbrink, 1990). Whilea strong T2 contrast between the vascular bundles and the sur-rounding tissues was already reported by Macfall and Johnson(1994) for excavated sugar beets, this study shows that it can bemeasured also on undisturbed beets while growing in the soil. TheMRI T2-mapping of tissue structures is still challenging since thecorrelation of the T2 values with actual cell or tissue properties hasto be evaluated for each species against light microscopy of partic-ular tissue sections. Nevertheless, the possibility of studying tissuedevelopment in storage organs in vivo suggests possible applica-tions also on other plants with anomalous cambial developmentsuch as sweet potato (Villordon et al., 2009).
Beside the total biomass of sugar beet, a major factor deter-mining sugar yield is the sugar concentration, which is closelytied to the ring structure (Artschwager, 1926; Draycott, 2006).This has been studied extensively in the past (e.g., De Vries, 1879;Artschwager, 1926, 1930; Milford, 1973) to understand the ori-gins of the supernumerary cambia, which form the beet. Therings with their phloem and parenchyma zones are critical forproviding transport and sugar storage capacities (Artschwager,1926; Draycott, 2006). No clear correlation with sugar yield wasfound for simple traits such as number and width of rings orparenchyma cell size at harvest (Draycott, 2006), even though sev-eral studies argued that, with shorter distances between phloemand storage tissues, a higher sucrose content should be achiev-able (Milford, 1973; Wyse, 1979; Doney et al., 1981). Also cDNAcloning of extracellular and vacuolar sucrose cleaving enzymesrevealed a change in the mechanisms of the functional unloadingpathways during the first weeks of beet development, and tran-script profiles revealed developmental and metabolic changes atsimilar or later age (Godt and Roitsch, 2006; Bellin et al., 2007;Trebbi and Mcgrath, 2009). However, it could not be correlatedwith the development of structural traits such as tissue volumeor growth rates. This lack of understanding may be one reasonwhy the total sugar content of commercial sugar beet lines hasnot been risen significantly in the last decades (Draycott, 2006).The application of T2 mapping on sugar beets offers a way tonon-invasively identify different tissues, and to trace and ana-lyze the development of the tissues over time. This approachwill allow investigating mechanisms of structural and functionaldevelopment of sugar beets for example by investigating differ-ent genotypes with contrasting development patterns and alsoby correlating the MRI-data on temporal tissue developmentwith transcript and metabolic profiles at different time points.Noninvasive methods like MRI may thus contribute to a betterunderstanding of possible correlations between tissue develop-ment of storage organs and final yield of quality compoundsranging from sugar in sugar beet or starch in potato to specificdrug precursors as in red beet or ginseng.
AUTHOR CONTRIBUTIONSThe concept of the method and instruments was elaborated byDagmar van Dusschoten, Ulrich Schurr, and Siegfried Jahnke.Ralf Metzner, Dagmar van Dusschoten and Siegfried Jahnke didthe design of the study and development of experimental proto-cols. Experimental work and data acquisition was done by RalfMetzner. Data analysis was by Ralf Metzner and Jonas Bühlerwhile interpretation was by Siegfried Jahnke and Ralf Metzner.Ralf Metzner performed the drafting of the manuscript withaccompanying critical input from Jonas Bühler, Siegfried Jahnke,Dagmar van Dusschoten and Ulrich Schurr. All authors approvedthe final version and declare to be accountable for all aspects ofthe work published.
ACKNOWLEDGMENTSThis study was supported by the German Federal Ministryfor Education and Science (BMBF) in the Framework ofthe CROP.SENSe.net Network under the grant number0315529/CROP.SENSe.net. Part of this work was performed
www.frontiersin.org September 2014 | Volume 5 | Article 469 | 9

Metzner et al. MRI on belowground sugar beet
within the German-Plant-Phenotyping Network funded also byBMBF (project identification number 031A053). The authorswould like to thank Johannes Kochs for technical support indesigning and building hardware for MRI, Beate Uhlig andMarcel Schneider for help with plant cultivation, Esther Breuerfor doing the light microscopy, Gregor Huber and DanielPflugfelder for support with data evaluation, and Carel Windt forinspiring scientific discussions.
SUPPLEMENTARY MATERIALThe Supplementary Material for this article can be foundonline at: http://www.frontiersin.org/journal/10.3389/fpls.2014.
00469/abstract
REFERENCESArtschwager, E. (1926). Anatomy of the vegetative organs of the sugar beet. J. Agric.
Res. 33, 143–176.Artschwager, E. (1930). A study of the structure of sugar beets in relation to sugar
content and type. J. Agric. Res. 40, 867–915.Artschwager, E. (1937). Observations on the effect of environmental conditions on
the structure of the lateral roots in sugar beet. J. Agric. Res. 55, 0081–0086.Asseng, L. A. G., Aylmore, J. S., MacFall, J. R., Hopmans, J. W., and Gregory,
P. J. (2000). “Computer-assisted tomography and magnetic resonance imag-ing,” in Root Methods–a Handbook, eds A. L. Smit, A. G. Bengough, C. Engels,M. van Noordwijk, S. Pellerin, and S. C. van de Geiijn (Berlin: Springer),343–364.
Bellin, D., Schulz, B., Soerensen, T. R., Salamini, F., and Schneider, K. (2007).Transcript profiles at different growth stages and tap-root zones identify cor-related developmental and metabolic pathways of sugar beet. J. Exp. Bot. 58,699–715. doi: 10.1093/jxb/erl245
Biancardi, E., McGrath, J. M., Panella, L. W., Lewellen, R. T., and Stevanato, P.(2010). “Sugar beet,” in Root and Tuber Crops, Vol. 1, ed J. E. Bradshaw (NewYork, NY: Springer Science+Business Media), 173–243.
Blümler, P., Windt, C. W., and van Dusschoten, D. (2009). Magnetic resonance inplants. Nova Acta Leopoldina 357, 17–30.
Borisjuk, L., Rolletschek, H., and Neuberger, T. (2012). Surveying the plant’s worldby magnetic resonance imaging. Plant J. 70, 129–146. doi: 10.1111/j.1365-313X.2012.04927.x
Bottomley, P. A., Rogers, H. H., and Foster, T. H. (1986). NMR Imaging showswater distribution and transport in plant-root systems in situ. Proc. Natl. Acad.Sci. U.S.A. 83, 87–89. doi: 10.1073/pnas.83.1.87
Brown, J. M., Johnson, G. A., and Kramer, P. J. (1986). In vivo magnetic reso-nance microscopy of changin water-content in Pelargonium Hortorum roots.Plant Physiol. 82, 1158–1160. doi: 10.1104/pp.82.4.1158
Callaghan, P. T. (1993). Principles of Nuclear Magnetic Resonance Microscopy. NewYork, NY: Oxford University Press.
Callaghan, P. T., Clark, C. J., and Forde, L. C. (1994). Use of static and dynamicNMR microscopy to investigate the origins of contrast in images of biologicaltissues. Biophys. Chem. 50, 225–235. doi: 10.1016/0301-4622(94)85034-8
Clark, R. T., Maccurdy, R. B., Jung, J. K., Shaff, J. E., McCouch, S. R., Aneshansley,D. J., et al. (2011). Three-dimensional root phenotyping with a novel imag-ing and software platform. Plant Physiol. 156, 455–465. doi: 10.1104/pp.110.169102
De Vries, H. (1879). Beiträge zur speciellen Physiologie landwirtschaftlicherCulturpflanzen. Landwirtschaftliches Jahrb. 8, 417–498.
Doney, D. L., Wyse, R. E., and Theurer, J. C. (1981). The relationship between cell-size, yield and sucrose concentration of the sugar beet root. Can. J. Plant Sci. 61,447–453. doi: 10.4141/cjps81-060
Donker, H. C. W., Vanas, H., Snijder, H. J., and Edzes, H. T. (1997). QuantitativeH-1-NMR imaging of water in white button mushrooms (Agaricus bisporus).Magn. Reson. Imaging 15, 113–121. doi: 10.1016/S0730-725X(96)00328-1
Draycott, A. P. (ed.). (2006). Sugar Beet. Oxford: Blackwell Publishing. doi:10.1002/9780470751114
Edzes, H. T., Van Dusschoten, D., and Van As, H. (1998). Quantitative T-2 imagingof plant tissues by means of multi-echo MRI microscopy. Magn. Reson. Imaging16, 185–196. doi: 10.1016/S0730-725X(97)00274-9
Elliot, M. C., and Weston, G. D. (1993). “Biology and physiology of the sugar beetplant,” in The Sugar Beet Crop: Science into Practice, eds D. A. Cooke and R. K.Scott (London: Chapman and Hall), 37–66.
Esau, K., and Evert, R. F. (2006). Esau’s Plant Aanatomy: Meristems, Cells, andTissues of the Plant Body: their Structure, Function and Development / Ray F.Evert. New York, NY: Wiley.
Eshel, A. (2013). Plant Roots: The Hidden Half. Boca Raton, FL: CRC Press.Fedotov, V. D., Miftakhu, F. G., and Murtazin, S. F. (1969). Investigation of pro-
ton relaxation in live plant tissues by spin echo method. Biophysics-Ussr 14,918–928.
Fieuw, S., and Willenbrink, J. (1990). Sugar transport and sugar metabolizingenzymes in sugar beet storage roots (Beta vulgaris ssp. altissima) J. Plant Physiol.137, 216–223. doi: 10.1016/S0176-1617(11)80084-2
Gallant, A. R. (1987). Nonlinear Statistical Models. New York, NY: John Wiley andSons. doi: 10.1002/9780470316719
Godt, D., and Roitsch, T. (2006). The developmental and organ specific expressionof sucrose cleaving enzymes in sugar beet suggests a transition between apoplas-mic and symplasmic phloem unloading in the tap roots. Plant Physiol. Biochem.44, 656–665. doi: 10.1016/j.plaphy.2006.09.019
Granier, C., Aguirrezabal, L., Chenu, K., Cookson, S. J., Dauzat, M., Hamard, P.,et al. (2006). PHENOPSIS, an automated platform for reproducible phenotyp-ing of plant responses to soil water deficit in Arabidopsis thaliana permittedthe identification of an accession with low sensitivity to soil water deficit. NewPhytol. 169, 623–635. doi: 10.1111/j.1469-8137.2005.01609.x
Gregory, P. J. (2006). Plant Roots. Oxford: Blackwell Publishing Ltd. doi:10.1002/9780470995563
Gregory, P. J., Hutchison, D. J., Read, D. B., Jenneson, P. M., Gilboy, W. B.,and Morton, E. J. (2003). Non-invasive imaging of roots with high resolu-tion X-ray micro-tomography. Plant Soil 255, 351–359. doi: 10.1023/A:1026179919689
Haacke, E. M., Brown, R. W., Thompson, M. R., and Venkatesan, R. (1999).Magnetic Resonance Imaging. New York, NY: John Wiley and Sons.
Han, L., Dutilleul, P., Prasher, S. O., Beaulieu, C., and Smith, D. L. (2008).Assessment of common scab-inducing pathogen effects on potato undergroundorgans via computed tomography scanning. Phytopathology 98, 1118–1125. doi:10.1094/PHYTO-98-10-1118
Hargreaves, C. E., Gregory, P. J., and Bengough, A. G. (2009). Measuring root traitsin barley (Hordeum vulgare ssp. vulgare and ssp. spontaneum) seedlings usinggel chambers, soil sacs and X-ray microtomography. Plant Soil 316, 285–297.doi: 10.1007/s11104-008-9780-4
Hatfield, J. L. (1992). Limitations to Plant Root Growth: Limitations to Plant RootGrowth. New York, NY: Springer. doi: 10.1007/978-1-4612-2894-3
Heeraman, D. A., Hopmans, J. W., and Clausnitzer, V. (1997). Three dimensionalimaging of plant roots in situ with x-ray computed tomography. Plant Soil 189,167–179. doi: 10.1023/B:PLSO.0000009694.64377.6f
Heinisch, O. (1960). Die Zuckerrübe. Berlin: Akademie-Verlag GmbH.Hillnhütter, C., Sikora, R. A., Oerke, E. C., and Van Dusschoten, D. (2012).
Nuclear magnetic resonance: a tool for imaging belowground damage causedby Heterodera schachtii and Rhizoctonia solani on sugar beet. J. Exp. Bot. 63,319–327. doi: 10.1093/jxb/err273
Hoffmann, C. M. (2010). Sucrose accumulation in sugar beet under drought stress.J. Agron. Crop Sci. 196, 243–252. doi: 10.1111/j.1439-037X.2009.00415.x
Iyer-Pascuzzi, A. S., Symonova, O., Mileyko, Y., Hao, Y. L., Belcher, H., Harer,J., et al. (2010). Imaging and analysis platform for automatic phenotypingand trait ranking of plant root systems. Plant Physiol. 152, 1148–1157. doi:10.1104/pp.109.150748
Jahnke, S., Menzel, M. I., Van Dusschoten, D., Roeb, G. W., Bühler, J.,Minwuyelet, S., et al. (2009). Combined MRI-PET dissects dynamic changesin plant structures and functions. Plant J. 59, 634–644. doi: 10.1111/j.1365-313X.2009.03888.x
Jung, I. C., Jeong, I. S., and Kim, C. S. (2012). Distinction of internal tissue ofraw ginseng root using a computed tomography scanner. J. Ginseng Res. 36,469–476. doi: 10.5142/jgr.2012.36.4.469
Kano, H., Ishida, N., Takagishi, H., Shirata, K., and Koizumi, M. (1993). Tracingeffects of Na+ on morphology, phosphate-metabolism and accumulated com-pounds of a sugar beet root by NMR. Jpn. J. Crop Sci. 62, 95–104. doi:10.1626/jcs.62.95
Köckenberger, W. (2001). Functional imaging of plants by magnetic resonanceexperiments. Trends Plant Sci. 6, 286–292. doi: 10.1016/S1360-1385(01)01984-7
Frontiers in Plant Science | Technical Advances in Plant Science September 2014 | Volume 5 | Article 469 | 10

Metzner et al. MRI on belowground sugar beet
Köckenberger, W., De Panfilis, C., Santoro, D., Dahiya, P., and Rawsthorne, S.(2004). High resolution NMR microscopy of plants and fungi. J. Microsc. 214,182–189. doi: 10.1111/j.0022-2720.2004.01351.x
Kuchenbrod, E., Haase, A., Benkert, R., Schneider, H., and Zimmermann, U.(1995). Quantitative NMR microscopy on intact plants. Magn. Reson. Imaging13, 447–455. doi: 10.1016/0730-725X(94)00118-M
Macfall, J. S., and Johnson, G. A. (1994). The architecture of plant vasculatureand transport as seen with magnetic resonance microscopy Can. J. Bot. 72,1561–1573.
Mahn, K., Hoffmann, C., and Marlander, B. (2002). Distribution of quality com-ponents in different morphological sections of sugar beet (Beta vulgaris L.). Eur.J. Agron. 17, 29–39. doi: 10.1016/S1161-0301(01)00139-3
Mairhofer, S., Zappala, S., Tracy, S. R., Sturrock, C., Bennett, M., Mooney, S. J., et al.(2012). RooTrak: automated recovery of three-dimensional plant root archi-tecture in soil from X-Ray Microcomputed Tomography images using visualtracking. Plant Physiol. 158, 561–569. doi: 10.1104/pp.111.186221
Mairhofer, S., Zappala, S., Tracy, S., Sturrock, C., Bennett, M. J., Mooney, S. J., et al.(2013). Recovering complete plant root system architectures from soil via X-raymu-Computed Tomography. Plant Methods 9:8. doi: 10.1186/1746-4811-9-8
Matsubara, S., Hurry, V., Druart, N., Benedict, C., Janzik, I., Chavarria-Krauser,A., et al. (2006). Nocturnal changes in leaf growth of Populus deltoides arecontrolled by cytoplasmic growth. Planta 223, 1315–1328. doi: 10.1007/s00425-005-0181-0
Milford, G. F. J. (1973). Growth and development of storage root of sugar beet. Ann.Appl. Biol. 75, 427–439. doi: 10.1111/j.1744-7348.1973.tb07991.x
Mooney, S. J., Pridmore, T. P., Helliwell, J., and Bennett, M. J. (2012). DevelopingX-ray computed tomography to non-invasively image 3-D root systems archi-tecture in soil. Plant Soil 352, 1–22. doi: 10.1007/s11104-011-1039-9
Nagel, K. A., Kastenholz, B., Jahnke, S., Van Dusschoten, D., Aach, T., Muhlich, M.,et al. (2009). Temperature responses of roots: impact on growth, root systemarchitecture and implications for phenotyping. Funct. Plant Biol. 36, 947–959.doi: 10.1071/FP09184
Nair, K. P. P. (2013). “The agronomy and economy of ginger,” in The Agronomy andEconomy of Turmeric and Ginger, ed K. P. P. Nair (Oxford: Elsevier), 225–292.doi: 10.1016/B978-0-12-394801-4.00015-6
Neumann, G., George, T. S., and Plassard, C. (2009). Strategies and methods forstudying the rhizosphere-the plant science toolbox. Plant Soil 321, 431–456. doi:10.1007/s11104-009-9953-9
Poorter, H., Bühler, J., Van Dusschoten, D., Climent, J., and Postma, J. A. (2012a).Pot size matters: a meta-analysis of the effects of rooting volume on plantgrowth. Funct. Plant Biol. 39, 839–850. doi: 10.1071/FP12049
Poorter, H., Fiorani, F., Stitt, M., Schurr, U., Finck, A., Gibon, Y., et al. (2012b). Theart of growing plants for experimental purposes: a practical guide for the plantbiologist review. Funct. Plant Biol. 39, 821–838. doi: 10.1071/FP12028
Raffo, A., Gianferri, R., Barbieri, R., and Brosio, E. (2005). Ripening of banana fruitmonitored by water relaxation and diffusion H-1-NMR measurements. FoodChem. 89, 149–158. doi: 10.1016/j.foodchem.2004.02.024
Rapoport, H. F., and Loomis, R. S. (1986). Structural aspects of root thickening inBeta-vulgaris L–Comparative thickening in sugar beet and chard. Bot. Gaz. 147,270–277. doi: 10.1086/337594
Rascher, U., Blossfeld, S., Fiorani, F., Jahnke, S., Jansen, M., Kuhn, A. J., et al. (2011).Non-invasive approaches for phenotyping of enhanced performance traits inbean. Funct. Plant Biol. 38, 968–983. doi: 10.1071/FP11164
Robinson, A., Clark, C. J., and Clemens, J. (2000). Using H-1 magnetic resonanceimaging and complementary analytical techniques to characterize developmen-tal changes in the Zantedeschia Spreng. tuber. J. Exp. Bot. 51, 2009–2020. doi:10.1093/jexbot/51.353.2009
Rogers, H. H., and Bottomley, P. A. (1987). In situ Nuclear Magnetic Resonanceimaging of roots - Influence of soil type, ferromagnetic particle content and soilwater. Agron. J. 79, 957–965. doi: 10.2134/agronj1987.00021962007900060003x
Sibgatullin, T. A., Vergeldt, F. J., Gerkema, E., and Van As, H. (2010). Quantitativepermeability imaging of plant tissues. Eur. Biophys. J. 39, 699–710. doi:10.1007/s00249-009-0559-1
Struik, P. C. (2007). “Above-ground and below-ground plant development,” inPotato Biology and Biotechnology, eds D. Vreugdenhil, J. Bradshaw, C. Gebhardt,F. Govers, D. K. L. Mackerron, M. A. Taylor, and H. A. Ross (Amsterdam:Elsevier Science B.V.), 219–236.
Tollner, E. W., Verma, B. P., Malko, J. A., Shuman, L. M., and Cheshire, J. M. (1991).Effect of soil total iron on magnetic-resonance image quality. Commun. Soil Sci.Plant Anal. 22, 1941–1948. doi: 10.1080/00103629109368548
Tracy, S. R., Black, C. R., Roberts, J. A., Sturrock, C., Mairhofer, S., Craigon, J.,et al. (2012). Quantifying the impact of soil compaction on root system architec-ture in tomato (Solanum lycopersicum) by X-ray micro-computed tomography.Ann. Bot. 110, 511–519. doi: 10.1093/aob/mcs031
Trebbi, D., and Mcgrath, J. M. (2009). Functional differentiation of the sugar beetroot system as indicator of developmental phase change. Physiol. Plant. 135,84–97. doi: 10.1111/j.1399-3054.2008.01169.x
Ulrich, A. (1952). The influence of temperature and light factors on the growthand development of sugar beets in controlled climatic environments Agron. J.44, 66–73. doi: 10.2134/agronj1952.00021962004400020003x
Van As, H. (2007). Intact plant MRI for the study of cell water relations, mem-brane permeability, cell-to-cell and long distance water transport. J. Exp. Bot.58, 743–756. doi: 10.1093/jxb/erl157
Van As, H., Scheenen, T., and Vergeldt, F. J. (2009). MRI of intact plants. Photosyn.Res. 102, 213–222. doi: 10.1007/s11120-009-9486-3
Van Der Weerd, L., Claessens, M., Efde, C., and Van As, H. (2002). Nuclearmagnetic resonance imaging of membrane permeability changes in plantsduring osmotic stress. Plant Cell Environ. 25, 1539–1549. doi: 10.1046/j.1365-3040.2002.00934.x
Van Der Weerd, L., Claessens, M., Ruttink, T., Vergeldt, F. J., Schaafsma,T. J., and Van As, H. (2001). Quantitative NMR microscopy of osmoticstress responses in maize and pearl millet. J. Exp. Bot. 52, 2333–2343. doi:10.1093/jexbot/52.365.2333
Villordon, A. Q., La Bonte, D. R., Firon, N., Kfir, Y., Pressman, E., and Schwartz,A. (2009). Characterization of adventitious root development in sweetpotato.Hortscience 44, 651–655.
Viola, R. (2000). “Tuber filling and starch synthesis in potato,” in Developmentsin Crop Science, eds G. Anil Kumar and K. Narinder (Amsterdam: Elsevier),169–194.
Waisel, Y., Eshel, A., and Kafkafi, U. (eds.). (2002). Plant Roots: The Hidden Half.New York, NY: Dekker.
Windt, C. W., Vergeldt, F. J., De Jager, P. A., and Van As, H. (2006). MRI oflong-distance water transport: a comparison of the phloem and xylem flowcharacteristics and dynamics in poplar, castor bean, tomato and tobacco. PlantCell Environ. 29, 1715–1729. doi: 10.1111/j.1365-3040.2006.01544.x
Wyse, R. (1979). Parameters controling sucrose content and yield of Sugarbeetroots. J. Am. Soc. Sugar Beet Technol. 20, 368–385. doi: 10.5274/jsbr.20.4.368
Zamski, E., and Azenkot, A. (1981). Sugar beet vasculature.1. cambial developmentand the 3-dimensional structure of the vascular system. Bot. Gaz. 142, 334–343.doi: 10.1086/337232
Zappala, S., Mairhofer, S., Tracy, S., Sturrock, C. J., Bennett, M., Pridmore, T.,et al. (2013). Quantifying the effect of soil moisture content on segmentingroot system architecture in X-ray computed tomography images. Plant Soil 370,35–45. doi: 10.1007/s11104-013-1596-1
Conflict of Interest Statement: The authors declare that the research was con-ducted in the absence of any commercial or financial relationships that could beconstrued as a potential conflict of interest.
Received: 02 July 2014; paper pending published: 07 August 2014; accepted: 27 August2014; published online: 16 September 2014.Citation: Metzner R, van Dusschoten D, Bühler J, Schurr U and Jahnke S (2014)Belowground plant development measured with magnetic resonance imaging (MRI):exploiting the potential for non-invasive trait quantification using sugar beet as aproxy. Front. Plant Sci. 5:469. doi: 10.3389/fpls.2014.00469This article was submitted to Technical Advances in Plant Science, a section of thejournal Frontiers in Plant Science.Copyright © 2014 Metzner, van Dusschoten, Bühler, Schurr and Jahnke. This is anopen-access article distributed under the terms of the Creative Commons AttributionLicense (CC BY). The use, distribution or reproduction in other forums is permitted,provided the original author(s) or licensor are credited and that the original publica-tion in this journal is cited, in accordance with accepted academic practice. No use,distribution or reproduction is permitted which does not comply with these terms.
www.frontiersin.org September 2014 | Volume 5 | Article 469 | 11