Embed Size (px)
DESCRIPTION
Bellringer week 8. Remember to write your name, teacher’s name , date and bellringer week 8 in the upper right hand corner of your paper. Question 1& 2. 1.Which of these tools would be best for studying plant cells? A a hand lens B a microscope C a telescope D binoculars - PowerPoint PPT Presentation
Citation preview

Bellringer week 8Remember to write your name,
teacher’s name , date and bellringer week 8 in the upper right hand corner
of your paper.

Question 1& 2
1.Which of these tools would be best for studying plant cells?
A a hand lensB a microscopeC a telescopeD binoculars
2. Technology may not provide the best solution forA judging what is beautifulB forecasting the weatherC communication over long distancesD keeping home temperatures constant

Question 3 & 4
3. The metric system is a system based on what number?
4. Light is an example ofA forceB energyC matterD heat

Question 5
The graph shows the motion of a car traveling through town:How much time did it take the car to travel 200 meters?A 10 secondsB 20 secondsC 30 secondsD 40 seconds
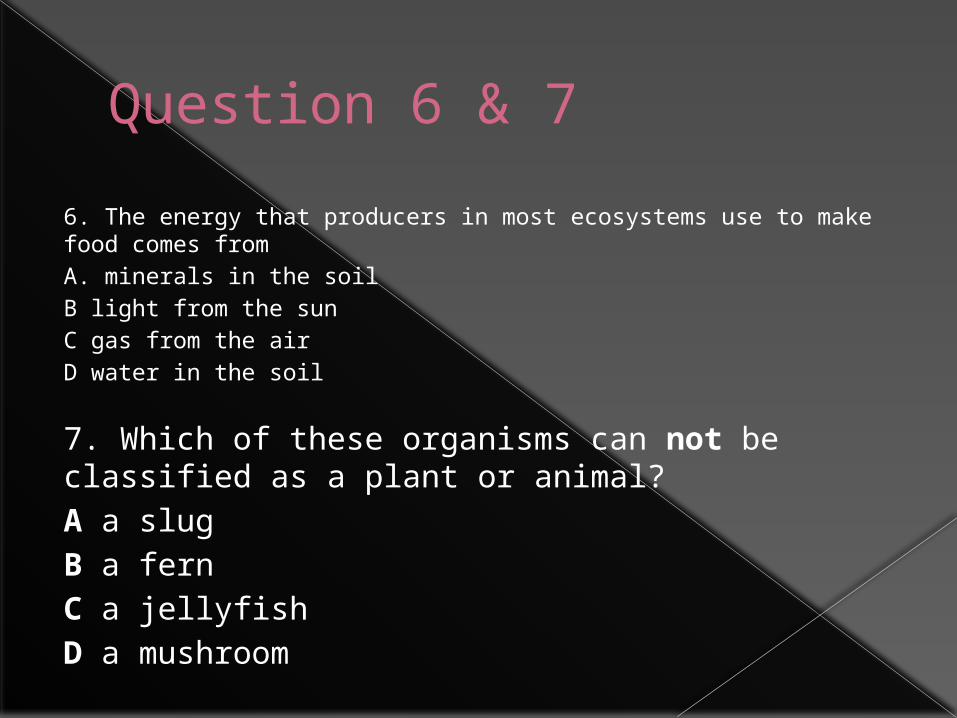
Question 6 & 7
6. The energy that producers in most ecosystems use to make food comes fromA. minerals in the soilB light from the sunC gas from the airD water in the soil
7. Which of these organisms can not be classified as a plant or animal?A a slugB a fernC a jellyfishD a mushroom

Question 8 & 9
8. Which of these systems is responsible for a person feeling pain?A the nervous systemB the skeletal systemC the respiratory systemD the muscular system
9. Which of these locations would still remain mostly unexplored without special technologies?A the ocean floorB riverbedsC mountainsD fresh water lakes

Question 10A student counted the number of bees on different colors of flowers in a garden. There were 2 bees onwhite flowers, 4 bees on red flowers, 6 bees on yellow flowers, and 9 bees on blue flowers. Which graph would be the best way to correctly show this data?
A
B
C
D