Embed Size (px)
Citation preview

1
BELLAMACK OWSTON AVENUE BIORETENTION SYSTEM
Functional Design Report
Prepared for the Northern Territory Department of Planning and Infrastructure GPO Box 2520
Darwin NT 0801
April 2008 07512593.01
EDAW Level 1, 2-14 Mountain Street, Ultimo NSW 2007
T 02 9212 3666 F 02 9212 4499 www.edaw.com.au

Functional Design of Owston Avenue Bioretention System i
This document has been prepared solely for the benefit of Department of Planning and Infrastructure and is issued in confidence for the purposes only for which it is supplied. Unauthorised use of this document in any form whatsoever is prohibited. No liability is accepted by EDAW Pty Ltd or any employee, contractor, or sub-consultant of this company with respect to its use by any other person.
This disclaimer shall apply notwithstanding that the document may be made available to other persons for an application for permission or approval to fulfil a legal obligation.
Document Control Sheet
Report title: Functional Design of Owston Ave Bioretention Systems
Suggested Reference: Ecological Engineering (2007), Bellamack WSUD Strategy.
Version: Draft
Author(s): David Knights
Approved by: Richard McManus
Signed:
Date: April 2008
File Location: Sydney Server
Distribution: DPI, SKM

Functional Design of Owston Avenue Bioretention System ii
TABLE OF CONTENTS
1 Introduction ..............................................................................................1
2 Catchment and Design Flows....................................................................3 2.1 Catchment Areas .............................................................................................................3 2.2 Delivery to Bioretention System .......................................................................................4 3 Bioretention System Operation..................................................................6 3.1 Introduction ....................................................................................................................6 3.2 Overview of Operations ...................................................................................................6 3.3 Services Analysis .............................................................................................................8 3.4 Inlet Design .....................................................................................................................8 3.5 Bioretention System Cross Section...................................................................................9 3.6 Overflow Pits ...................................................................................................................9 3.7 Vegetation.....................................................................................................................11 3.8 Irrigation .......................................................................................................................13 3.9 Filter Media ...................................................................................................................13 3.10 Collection Pipes.............................................................................................................14 3.11 Liner..............................................................................................................................15 3.12 Connection to Existing Drainage System........................................................................16 3.13 Amenity and Aesthetics .................................................................................................17 3.14 Aquifer Recharge...........................................................................................................18 3.15 Monitoring.....................................................................................................................18 3.16 Construction Cost Estimate ...........................................................................................19 4 References ..............................................................................................20
Appendix A: Soil Filtration Media Specifications ..........................................................1
Appendix B: Concept Design Sketches ........................................................................1

Functional Design of Owston Avenue Bioretention System iii
List of Tables
Table 1 Summary of Catchment Details................................................................... 3
Table 2 List of potential plant species ................................................................... 12
Table 3 Preliminary Construction Cost Estimate .................................................... 19
List of Figures
Figure 1 Bellamack WSUD Strategy ......................................................................... 2
Figure 2 Catchment Contributing to Owston Avenue bioretention system ............... 4
Figure 3 Flow Cumulative Frequency Distribution .................................................... 5
Figure 4 Proposed location of bioretention treatment system.................................. 6
Figure 5 Cross section of vegetation showing high (H), low (L) and base (B) planting sections within the bioretention system. ............................................................... 11

Functional Design of Owston Avenue Bioretention System iv
EXECUTIVE SUMMARY
Report Objective and Background
The major objective of this report is to provide the basis for detailed design documentation of a stormwater treatment system at Bellamack Residential Sub-division within Palmerston City Council. Bellamack has been chosen as a showcase development for WSUD in the Darwin region.
The concept designs are based on the preliminary concepts described in Bellamack WSUD Strategy (Ecological Engineering, 2007a).
Bioretention System Overview
The Owston Avenue bioretention systems will form an attractive landscape feature along the open stormwater drainage channel running parallel to Owston Avenue. The bioretention systems will have a footprint of approximately 4500m2 and will treat runoff from a 22 hectare catchment in the Bellamack Residential Subdivsion.
Treated stormwater from these systems will be delivered back to the existing stormwater system. The treated stormwater is ultimately discharged into Mitchell Creek, a subcatchment of Elizabeth River.
Catchments
The catchments that will be treated by the bioretention systems are residential catchments and consist of predominantly single dwellings and local and collector roads.
Bioretention Systems Performance
The bioretention systems have been designed to remove 80% of total suspended solids and 45% of total nitrogen and 45% of total phosphorous. The bioretention system has few site constraints, the most noticeable being the potential shallow groundwater levels.
Water Quality Monitoring
A water quality monitoring program has also been discussed in the report. Water quality monitoring is feasible at the site and monitoring is recommended at the site and would be particularly advantageous to have monitoring undertaken to ‘proof up’ the performance of bioretention systems in the wet dry tropics.
Functional Design of Owston Avenue Bioretention Systems 1
1 INTRODUCTION
Ecological Engineering was commissioned by Department of Planning and Infrastructure to develop detailed designs for stormwater treatment systems for Bellamack Residential Subdivision. Bioretention systems have been proposed as one treatment measure. Specifically the bioretention systems proposed for the treatment of stormwater runoff is located at:
(i) Owston Avenue and Roystonea Rd
The detailed designs are a key step in the implementation of the integrated approach to managing stormwater within Bellamack. The integrated approach to management has been formalised in the Bellamack WSUD Strategy a program was undertaken to develop a plan for urban water management within the development. The strategy for Bellamack is based on a series of multi-disciplinary and multiple stakeholder planning workshops. The stormwater management strategy is shown in Figure 1.
The current detailed design is based on concepts broadly described in the Bellamack WSUD Strategy (Ecological Engineering, 2007a) and Stormwater Treatment Options for Darwin (Ecological Engineering, 2007b). The wider goal of the strategy is to provide integrated urban water management to best management practice standards and to meet the WSUD objectives for Darwin such as those outlined in WSUD Design Objectives (Ecological Engineering, 2007b).
The objective of this report is to document the detailed design for the treatment systems in sufficient detail to inform key stakeholders, including Department of Planning and Infrastructure and Palmerston Council and to provide a basis for detailed design drawings.

Functional Design of Owston Avenue Bioretention Systems 2
Figure 1 Bellamack WSUD Strategy

Functional Design of Owston Avenue Bioretention Systems 3
2 CATCHMENT AND DESIGN FLOWS
This section discusses the catchment areas that will be treated by the bioretention system, the volume of the flows that will be treated by the bioretention systems and the delivery of the stormwater to the bioretention system.
2.1 Catchment Areas The design philosophy for the bioretention system is to treat stormwater runoff that drains from a 22 hectare residential catchment before it is discharged into the existing open channel along Owston Avenue.
The catchment area, O1, of the Owston Avenue system is approximately 22 hectares (refer Figure 2), consisting of 17 hectares of single and multi dwelling residential and 4 hectares of road and footpath and 1 hectare of community and open space. The percentage imperviousness of the catchment is estimated to be approximately 50%.
The details of the catchment areas are summarised in Table 1.
Table 1 Summary of Catchment Details
Land Use Road Catchment
(ha)
Estimated % Impervious
Roads and footpath 4.2 100
Open Space 0.31 10
Community 0.49 30
Multi-dwelling 2 50
Single Dwelling 15.4 40
TOTAL 22.4 51
Functional Design of Owston Avenue Bioretention Systems 4
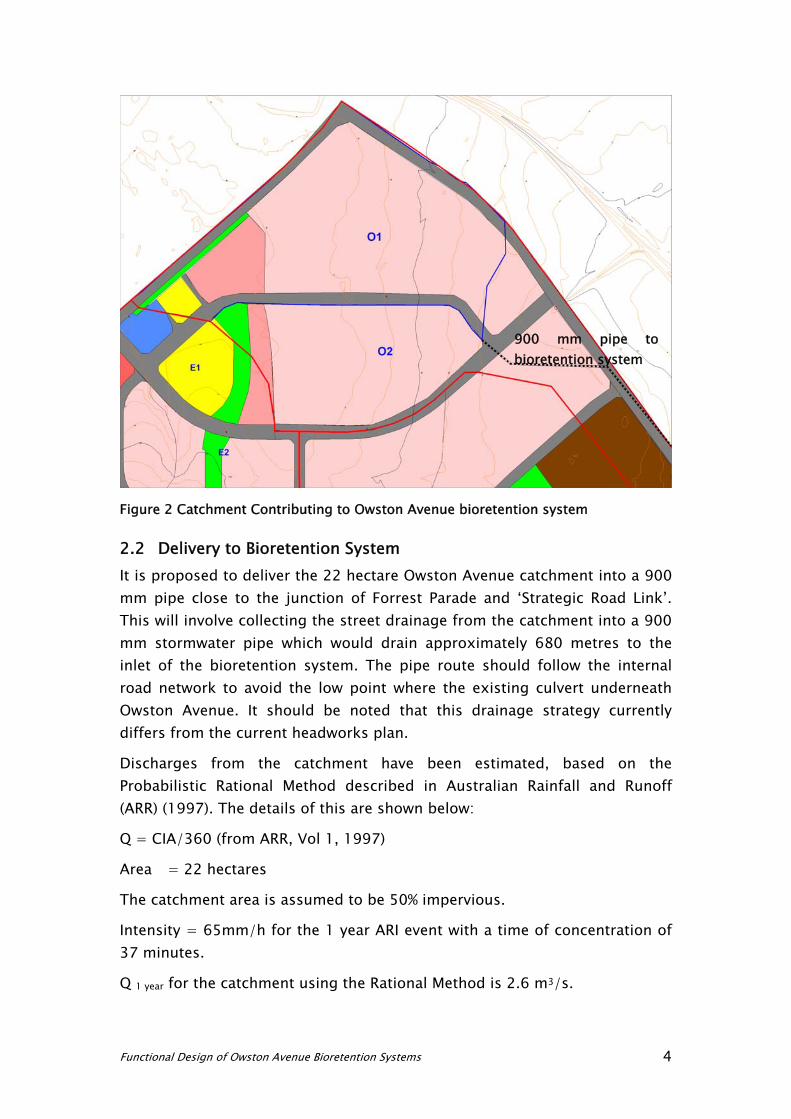
Figure 2 Catchment Contributing to Owston Avenue bioretention system
2.2 Delivery to Bioretention System It is proposed to deliver the 22 hectare Owston Avenue catchment into a 900 mm pipe close to the junction of Forrest Parade and ‘Strategic Road Link’. This will involve collecting the street drainage from the catchment into a 900 mm stormwater pipe which would drain approximately 680 metres to the inlet of the bioretention system. The pipe route should follow the internal road network to avoid the low point where the existing culvert underneath Owston Avenue. It should be noted that this drainage strategy currently differs from the current headworks plan.
Discharges from the catchment have been estimated, based on the Probabilistic Rational Method described in Australian Rainfall and Runoff (ARR) (1997). The details of this are shown below:
Q = CIA/360 (from ARR, Vol 1, 1997)
Area = 22 hectares
The catchment area is assumed to be 50% impervious.
Intensity = 65mm/h for the 1 year ARI event with a time of concentration of 37 minutes.
Q 1 year for the catchment using the Rational Method is 2.6 m3/s.
900 mm pipe to bioretention system

Functional Design of Owston Avenue Bioretention Systems 5
This value was compared with a cumulative frequency distribution based on 6 minute intensity rainfall data modelled in MUSIC. This showed that a diversion value of 2.0 m3/s diverted approximately 98% of flows from the catchment.
Figure 3 Flow Cumulative Frequency Distribution
Thus, up to 2 m3/s through the system will divert the overwhelming majority of flows through the system. A diversion flow rate of 2 m3/s was adopted in MUSIC and found to have minimal impacts on water quality performance of the system.
It is proposed to place a gross pollutant trap to remove anthropogenic litter and coarse sediment upstream of the entrance to the bioretention system, such as a “Humegard” HG40A or equivalent suitable for a 900mm inlet and outlet. The GPT will ensure that maintenance is concentrated in one located and reduce the likelihood of blockage in the inlet of the bioretention system.
Flow (cubic metres per second)2.01.0
Cum
ulat
ive
Freq
uenc
y (%
)
95908580757065605550454035302520151050

Functional Design of Owston Avenue Bioretention Systems 6
3 BIORETENTION SYSTEM OPERATION
3.1 Introduction This section documents the individual design elements of the bioretention system. It discusses the inlet surface area and depth of the bioretention system, how the stormwater will be delivered to the bioretention system, how stormwater will leave the bioretention system and how treated water will be conveyed to the existing stormwater systems. The design process has, in general, been based on the WSUD Engineering Procedures: Stormwater (Melbourne Water, 2006)
3.2 Overview of Operations The bioretention system will be located north east of the junction of the Roytonea Ave and Owston Ave and to the west of the Owston Ave open channel. The current area is currently vegetated with open forest in varying condition and is shown in Figure 4. The concept sketches, including plan views, cross sections, long sections and details, are shown in Appendix B and are described in detail below.
Figure 4 Proposed location of bioretention treatment system

Functional Design of Owston Avenue Bioretention Systems 7
Flows will enter the bioretention system via a rock lined distribution channel approximately 5m wide and 0.3 to 0.4m wide. The distribution channel ensures a more even distribution of water throughout the system.
The stormwater will then percolate through a prescribed soil filtration media and be collected with perforated pipes at the base and conveyed to the existing sediment basin located at the end of the open channel running along Owston Ave. surface and subsequently infiltrate through the prescribed filtration media. The bioretention media is planted with native vegetation ranging from grasses and sedges to shrubs and trees.
The bioretention system will be ringed by three bunds. The bunds primarily divide the bioretention system into three cells to provide a more even distribution of flows in the system. It should be noted the cells are not completely disconnected from one another. These bunds provide a number of secondary functions including:
• Provision of a landscape element which differentiates the surface of the basin
• Provision of a greater planting depth for vegetation such as trees and large shrubs which will benefit from greater soil depths.
When the soil infiltration capacity is exceeded, flows will temporarily pond up to 300 mm above the bioretention surface, and above the bunds and subsequently infiltrate through the prescribed filtration media. When levels exceed 300 mm ponding, water will discharge out through 4 overflow pits into a pipe to the sediment basin. Water will briefly pond up to a depth of 0.2m above the overflow pits (0.5m above the surface in total). An overflow weir is not required for the bioretention system to discharge larger flows and if water overtops the banks due to more than 50% blockage of pits water will flow overland and into the open channel.
Sandy loam has been selected as the filtration media and the filtration media specification is attached in Appendix A. Laid directly underneath the filter layer is a 100mm transition layer
A 150 mm gravel drainage layer is laid underneath the transition layer. A series of subsurface drainage pipes will be laid in the drainage layer which drains to a collection pipe where the water will be directed into the existing sediment basin via a 900 mm stormwater pipe.

Functional Design of Owston Avenue Bioretention Systems 8
3.3 Services Analysis A complete services analysis check will be required to be undertaken to determine if there are any conflicts with any services or future services including:
• water and sewer
• electricity cables
• gas mains
• telstra communication services
• optic fibre cables
3.4 Inlet Design As described in Section 2.1 the bioretention inlet will comprise of a GPT and a 900 mm inlet pipe which delivers stormwater into the bioretention system. From the 900 mm stormwater pipe a scour pad has been designed. The scour pad has been designed based on a maximum outlet velocity to prevent erosion and scour. In principle the continuity equation is used to determine the outlet velocity with an outlet control. The downstream cross section of the distribution channel is used as the downstream cross sectional area.
In practice a standard culvert software program has been used to determine the maximum velocity discharging The maximum outlet velocity has been determined to be approximately 3.5 m/s.
A scour pad is required at the outlet due to the reasonably high outlet velocities. The scour pad will require carefully placed rocks with a d50 greater than 300mm and a length of 7.5m spanning from 1m wide at the inlet of the 900mm pipe to 4.7m wide at the outlet of the scour pad into the main distribution channel running south west to north east.
The channel is not required to convey the full 2 m3/s, its main purpose is to distribute the majority of flows along the length of the bioretention system. Stormwater will be required to pond in the distribution channel before it can exit the channel into the bioretention system.
The distribution channels will be
• a trapezoidal in shape with a 3m base and 1 in 3 batter slopes
• 0.3m deep at the inlet of the scour pad and 0.45m deep at the centre
• 4.7m wide at the edge and 5.4m wide at the centre of the bioretention system.

Functional Design of Owston Avenue Bioretention Systems 9
• laid at a 0.25% slope into the centre of the bioretention system and -0.25% slope from the centre to the opposite side of the bioretention system.
• gravel lined (d50 > 20mm)
• vegetated
• underlain with filter media to ensure the channel drains
The main distribution channel will intersect at with a secondary distribution channel which runs from the south east to the north west of the bioretention system. This channel has the same cross section and slope as the main distribution channel.
Based on the characteristics above, Manning’s equation predicts for a flow depth 0.3m, a discharge of 0.9 m3/s and a velocity of 0.77 m/s.
It is proposed that boardwalks be provided over the distribution channel to allow access into the centre of the bioretention system.
3.5 Bioretention System Cross Section The typical depth of the bioretention system is 850 mm and the typical cross section of the bioretention system is
• 600 mm of a specially selected filter media (RL 5.0) underlain by
• 100mm of a coarsely graded sand (RL 4.4) of 0.5 mm to 1.0 mm underlain by
• 150mm of a drainage layer consisting of coarsely graded gravel (2mm to 5mm) (RL4.3) which is laid with a series of 150 mm drainage pipes
The total depth of the bioretention filter media is 1050 mm in the location of the bunds (RL 5.2) where the filter media is 800 mm deep.
3.6 Overflow Pits To allow flows from the Owston Ave bioretention system to discharge back into the existing stormwater system when the bioretention system is full (i.e. extended detention is fully engaged) a series of overflow pits will be constructed with the crest at the same level as the top of extended detention (RL 5.3m).
The overflow system must be able to pass the peak design flow entering the system (i.e. 2 m3/s). The riser has been sized such that the maximum height of water over the riser crest is 200 mm. Two scenarios are checked:
• drowned conditions (orifice equation) and

Functional Design of Owston Avenue Bioretention Systems 10
• free overfall conditions (weir equation).
For drowned conditions at the riser pipe using the orifice equation:
A = Q/B.C.√2gh with
C = orifice coefficient (0.6),
B = blockage factor (0.5),
Q = 2 m3/s
H = available head (0.2 m)
Assuming 50% blockage, a minimum area of 3.4 m2 is required.
To check free overfall conditions, using the weir equation:
L = Qdes/B.C.H3/2 with
B = blockage factor (0.5)
C = weir coefficient (1.7),
H = head over weir (0.2 m) and
L = outlet circumference
Assuming 50% blockage, a minimum length of 14.7 m2 is required.
A series of four 1000 mm square overflow pits are recommended. These pits provide:
• an area of 4 m2 area (capacity of 2.4 m3/s)
• an overflow weir length of 16m (capacity of 2.2 m3/s)
Blockage of the overflow pit is one of risk factors in any overflow design. Blockage can occur from leaf litter or rubbish depositing on the grated inlet. The risk of blockage is managed by providing
• design of the overflow pit so that if the top of the overflow pit blocks the pit can still function as an overflow weir. A combined overflow weir pit and orifice is less prone to blockage
• a conservative blockage factor of 50%
• separate pits
• gross pollutant removal
• placement of the overflow pits at a significant distance from the inlet point

Functional Design of Owston Avenue Bioretention Systems 11
3.7 Vegetation Vegetation enhances the function of the filter media by preventing erosion of the surface of the filter media, continuously breaking up the soil through plant and root growth to prevent clogging of the system and providing biofilms on plant roots that pollutants can adsorb to. Generally the denser and higher the vegetation, the better the filtration process. Vegetation is critical to maintaining porosity of the filtration layer and retention of nutrients within the filter media.
The bioretention systems will have a total vegetated area of 4500 m2. The proposed area of planting is slightly greater than the area of the bioretention system filter area as it is proposed to plant the batter slopes with native vegetation as well.
Indicative species for the bioretention system are listed in Table 2. Figure 5 shows the zones of planting across the bioretention system.
Figure 5 Cross section of vegetation showing high (H), low (L) and base (B) planting sections within the bioretention system.
Note that this is not an exhaustive list of species that are suitable and other local native species will be substituted if those listed above are not available. In general the species from the L and H zone are the most flexible.
The planting densities are suggested minimums and can be increased with project budget which will assist in reducing weed invasion and reduce the need to replant if some plants have difficulty establishing.
Exact planting specifications can be confirmed during the production of construction drawings and in consultation with local nurseries and organisation such as Greening Australia to understand their ability to supply various species.

Functional Design of Owston Avenue Bioretention Systems 12
Table 2 List of potential plant species
Scientific Name Common Name Type of Plant Maximum Height (m)
Planting Density
Bioretention Media - Trees on sandy media Eucalyptus miniata Woollybutt Tree 8-20 1 per 10 m2 Eucalyptus tetradonta Stringybark Tree 10-30 1 per 10 m2 Bioretention Media - Shrubs on sandy media Boronia gradisepala Shrub 0.5 1 per 3 m2 Boronia lanuginosa Shrub 0.5-1.5 1 per 3 m2 Bossaiea bossaioides Shrub 1-2 1 per 3 m2 Calytrix exstipulata Turkey bush Shrub 1-4 1 per 3 m2 Grevellea pungens Shrub 1-1.5 1 per 3 m2 Grevillea angulata Shrub 1-4 1 per 3 m2 Jacksonia dilatata Shrub 2-4 1 per 3 m2 Templetonia hookeri Shrub 1-3 1 per 3 m2 Verticordia cunninghamii Shrub 1.5-5 1 per 3 m2 Bioretention Media - understorey on sandy media Grevillea formosa Shrub 0.5 1 per 3 m2 Imperata cylindrica Blady grass Grass 1 8 per m2 Platyzoma microphyllum fern Fern 0.15-0.5 8 per m2 Sorghum plumosum Grass 8 per m2 Sorghum stipodeum Grass 8 per m2 Extended Detention Area Trees on clay soils Melaleuca dealbata Paperbark Amphibious tree 12 1 per 8 m2 Melaleuca viridiflora Paperbark Amphibious tree 12 1 per 8 m2 Extended Detention Area - Understorey on clay soils Cyperus scariosis Sedge Amphibious sedge 0.8 8 per m2 Fimbristylis dichotoma Sedge Amphibious sedge 1 8 per m2 Isoetes coromandelina Quillwort Amphibious fern 0.8 8 per m2 Upper Batter (terrestrial vegetation) Eucalyptus miniata Woollybutt Tree 8-20 1 per 10 m2 Eucalyptus tetradonta Stringybark Tree 10-30 1 per 10 m2 Sorghum plumosum Shrub 8 per m2 Sorghum stipodeum Shrub 8 per m2 Themeda australis Kangaroo grass Grass 0.75 8 per m2 Bunds - trees Melaleuca dealbata Paperbark Amphibious tree 12 1 per 8 m2 Melaleuca viridiflora Paperbark Amphibious tree 12 1 per 8 m2 Pandanus spiralis Screw palm Amphibious tree 10 1 per 8 m2 Bunds - understorey Cynodon dactylon Couch Grass 0.6 8 per m2 Isoetes coromandelina Quillwort Amphibious fern 0.8 8 per m2 Sorghum plumosum Grass 8 per m2 Sorghum stipodeum Grass 8 per m2
The scour velocity over the vegetation should be less than 0.5 m/s to ensure the integrity of the vegetation. The scour velocity is calculated by dividing the maximum flow by the flow area. The maximum flow that can be carried by the channel is 2000 m3/s and the depth of the flow in the bioretention system will be approximately 0.3m. Based on this the flow area will need to be a minimum of 6.5m to ensure that the flow velocity will be less than 0.5m/s. This width is significantly lower than the typical widths in the

Functional Design of Owston Avenue Bioretention Systems 13
bioretention system hence the flow velocity in the bioretention will be significantly less than this as the cross sectional area is significantly greater.
3.8 Irrigation The vegetation will require irrigation during the dry season to ensure that it is sufficiently robust at the end of the dry season that the surface of the media is not compromised by the first few events at the beginning of the wet season. If the vegetation is not robust enough to maintain the surface of the system then it is possible that erosion and scour of the surface could occur as well as clogging of the surface due to deposition of sediment on the surface of the bioretention system and subsequent loss of permeability.
The local native species that are planted in the bioretention system do not require irrigation. However irrigation provides a number of benefits including
• stronger and more vigorous planting growth
• provide greater local landscape amenity due to a perceived more attractive planting palette
An automatic aboveground sprinkler irrigation system is proposed to irrigate the bioretention system during the dry season. The irrigation system will be designed to provide minimal irrigation but sufficient irrigation events to maintain vigorous plant growth. The irrigation system will supply
• 10mm per square meter
• at an irrigation frequency of one irrigation event every week
• during the dry season months (typically from the end of April to early October)
• during the early hours of the night, when evaporation rates are lowest
Based on this regime approximately 1170 kl/yr of water will be used or the equivalent of water consumption of three typical single dwellings in Darwin.
Native plants have a significantly lower crop factor and can also withstand significant periods of water stress. Crop factors for native plants have been adopted as 0.3 to 0.4 to determine the required irrigation volume during the dry season. However the irrigation volume can be modified post construction to optimise the irrigation regime
It is recommended that plants in the bioretention system be planted at the beginning of the wet season with the bioretention system off line to reduce irrigation establishment requirements.
3.9 Filter Media

Functional Design of Owston Avenue Bioretention Systems 14
The filter media will be a sandy loam with a hydraulic conductivity of approximately 50 to 200 mm/hr (assumed 100 mm/hr) and an effective particle diameter of 0.3 to 0.5 mm (See Appendix 1 for detailed specification).
The maximum infiltration rate through the filter media has been calculated using Darcy’s Equation. The maximum head of water over the bioretention surface is equal to the extended detention depth (0.3m).
Q=k.A.(h+d)/d with,
k = hydraulic conductivity (100 mm/hr),
h= maximum height of pondage (0.30 m),
d = depth of filter media (0.6 m),
A = surface area (4500 m2).
The maximum infiltration rate into the perforated pipes is
• 0.19 m3/s.
3.10 Collection Pipes The water that infiltrates through the filter media will be collected in perforated pipes located within a gravel drainage layer that will run the length of the bioretention system. A series of 13 perforated pipes will be laid in a north to south direction spaced at 5m intervals. A total of 632.5m of subsoil drainage pipe are proposed. The pipes will drain to a central collection pipe in the centre of the bioretention system running west to east. The upstream invert of the drainage pipes are set at 4.65 and drain to the central collection pipe at between RL 4.5 m and RL 4.275 m at a slope of 0.5% to 1%.
To ensure that the perforated pipes are adequately sized, the following checks were made:
• ensure the pipe itself has capacity; and
• ensure the perforations are adequate to pass the maximum infiltration rate.
The capacity of a 150 mm diameter pipe was checked using Manning’s Equation. The recommended Manning’s n value for perforated pipes 0.017 and it is planned to lay the pipes at a 0.5% grade.

Functional Design of Owston Avenue Bioretention Systems 15
with, Q = pipe capacity (m3/s); n = Manning’s n (0.017); A = pipe internal area (m2); R = pipe internal hydraulic radius; and S = hydraulic gradient = 0.005 m/m
The capacity of one 150 mm diameter pipe is therefore 0.013 m3/s.
The perforation capacity of a standard diameter 150 mm perforated pipe was determined using the orifice equation. A standard perforated pipe with a minimum of 1500 mm2/m of perforations was selected. It is conservatively assumed that 50% of the holes are blocked. The maximum head over the perforated pipes is the maximum head of water over the bioretention surface (0.3 m) plus the filter media depth (0.6 m), plus the section of the transition layer above the perforated pipe (0.1 m).
BghCAQ 2= with,
Q = perforation capacity L/s;
C = 0.61 (sharp edged orifice);
A = total orifice area (m2) = 1500/10-6;
g = 9.81 m3/s;
h = total head = 1 m
B = blockage factor = 0.5
The perforation capacity of a standard 150 mm pipe is therefore 0.0019 m3/s per meter of pipe. The total capacity of the 632.5m pipes is 1.26 m3/s which is in excess of the maximum infiltration rate (0.19m3/s).
The collection pipe will be a solid PVC pipe laid at 0.5% slope and 375mm in capacity. The upstream invert of this pipe is RL 4.5 m draining and connecting into the overflow pit at RL 4.275m.
The perforated pipes are to extend to the surface of the bioretention system in order to allow access for inspection and maintenance when required. This vertical section of the under-drain must be a solid pipe with a cap placed on the end of the pipe to avoid short circuiting of untreated water directly to the underdrain.
3.11 Liner It is not proposed to line the bioretention system. The treated stormwater will have contribute to recharging the local groundwater during the early wet. The drainage within the bioretention system will be free draining ensuring
2/13/21 SRAn
Q ××=

Functional Design of Owston Avenue Bioretention Systems 16
that the majority of the treated stormwater will be collected in the drainage pipes.
Groundwater levels are not known in the vicinity of the bioretention system. Due to its proximity to the existing drainage path it is likely that groundwater levels are close to the current drainage invert of approximately 3.5m to 4m AHD. There is some chance that the bioretention system will intercept the local groundwater levels. The current groundwater levels in the vicinity of the bioretention system are not. However the consequences of this are considered low risk as the bioretention drainage levels is not significant different from the invert of the current free drainage path that currently exists.
3.12 Connection to Existing Drainage System It is possible for the bioretention system to drain either to
• the existing sediment basin pit located at the end of the Owston Ave open channel or
• directly into the channel
The invert of the basin is not known accurately but the survey determine that that the lowest surface level is 3m AHD. The depth of the Owston Basin is not known and the invert of the basin could be much lower than the surface level. The basin is approximately 75m away from the nearest edge of the basin. With 1% grade the invert of the overflow pit would need to be 3.75AHD, which is slightly higher than the invert of the underdrain collection system. Other issues with draining to the basin include
• the pipeline would need to pass underneath the proposed Roystonea Ave and would require minimum cover
• the pipeline would need to pass under the maintenance road to the existing sediment basin with a minimum cover or would require casing to prevent damage
Hence it is proposed to connect the bioretention system directly into the existing channel. The invert of the channel adjacent to the bioretention system is RL 3.6 m. Thus it is proposed to discharge the 900mm pipe into the channel at RL 3.7m. The 900 mm invert in the upstream overflow pit is 3.85 allowing 1% slope.
This requires a much shorter length of pipeline but requires breaking into the channel and rectification works to the edge of the channel. The cost of the rectification works is estimated to have a lower cost and be more feasible than connecting to the sediment basin.

Functional Design of Owston Avenue Bioretention Systems 17
3.13 Amenity and Aesthetics Urban design is a key component of the bioretention system. Typically bioretention systems are landscaped to look similar to gardens. This is because of their vegetated surfaces. A bioretention system can either be “soft-landscaped” or “hard-landscaped”. Soft landscaping involves only the use of vegetation to define the boundaries of the bioretention system while hard landscaping uses “engineered” structures such as fences, retaining walls and seats to define the boundaries.
It is proposed to soft landscape the bioretention system .The batter slopes of the bioretention will be heavily vegetated with grasses and sedges, shrubs and trees. The appearance and aesthetics of the bioretention system will look similar to a native garden. The use of soft landscaping matches with the existing landscape in this area adjacent to the channel.
During workshops there was strong advocacy for native planting and this has been reflected in the choice of vegetation. Illegal dumping was observed during site visits. Hence it is proposed to have dense planting of vegetation to prevent any illegal dumping within the site and bollards off Roystonea Avenue.
Hard landscaping elements that could be incorporated into the bioretention system include.
• A boardwalk which runs through the middle of the bioretention system. The boardwalk could also be connected to a pathway that takes local residents down to Mitchell Creek or connects with a bridge across the channel and to the Roystonea Hub
• Signage, especially along the Roystonea Avenue street side which could provide educational opportunities to explain the role, and function of the bioretention system
• The area also connects to a an open parkland which connects to the proposed future urban development site on the east of Owston Avenue. Picnic, playground, shelter facilities etc could also be linked to views over the bioretention system as well as educational signage.
These landscape elements need to be decided in consultation with the landscape designs for the future development and the direction of the open parkland, but are considered essential elements to the design of the bioretention system.

Functional Design of Owston Avenue Bioretention Systems 18
3.14 Aquifer Recharge Currently the dolomite aquifer fully recharges during the wet season despite the significant extraction undertaken by Palmerston City Council for irrigation. The aquifer has a sustainable yield of 4 to 6 ML/d during (Yin Foo, 1988).
The long term sustainability of aquifer extraction is not known due to the lack of metering of extraction for irrigation and the impacts of urbanisation on recharge of the aquifer.
For this reason it is proposed to adopt an adaptive management process to the aquifer. The aquifer water levels should be monitored. In particular the water level in the aquifer at the end of the wet season and at the end of the dry season are key water levels that need to be monitored annually as a minimum. If full recharge does not occur during the wet season due to changes in the catchment then aquifer recharge will be required.
The bioretention system has been designed with the ability to be modified for aquifer recharge. The treated stormwater that flows through the media filter is approximately 139 ML/yr. This value flows at a constant rate up to 190 L/s. A pit has been designed in the bioretention system from whereby future diversions to a aquifer recharge pumping system could be located. This system captures all the flows that have passed through the media filter but avoids storing the partially treated overflows. This is to ensure that the highest quality of treated stormwater is stored in the aquifer to reduce the risk of causing a deterioration in the aquifer water quality. However the while still providing a significant portion (more than 75%) of the flows into the system.
3.15 Monitoring For stormwater managers to effectively deliver stormwater quality management programs the performance of stormwater treatment devices is of key concern. Monitoring is the best way to assess the performance of these systems. A more detailed monitoring strategy will be developed in consultation with Councils and the NT Government. This section discusses how the designs have incorporated future monitoring requirements into the design.
Monitoring requires sampling points at the inlet and outlet of the system. Monitoring can be undertaken at the inlet into the GPT. A pit will be provided for access for monitoring for water quality sampling and flow monitoring. A good flow monitoring site requires steady flow conditions with

Functional Design of Owston Avenue Bioretention Systems 19
minimal changes in pipe direction or pipe size. This area is easily accessible from Owston Avenue and from Roystonea Ave.
Monitoring will also need to be undertaken at the outlet of the bioretention system. A pit will be provided which is accessible from Roystonea Avenue and along Owston Ave channel. A pit will be provided for access for monitoring for water quality sampling and flow monitoring. This area is easily accessible from Owston Avenue and from Roystonea Ave.
3.16 Construction Cost Estimate Preliminary cost estimates for the Owston Avenue bioretention system have been produced for constructing the treatment system. Cost estimates were developed from determining expected earthworks required for construction and by quantifying key element and structures of the systems. These are detailed in Table 3.
Table 3 Preliminary Construction Cost Estimate Item Quantity Unit Unit Cost CostClear Site of vegetation 6000 sqm 0.45$ 2,700$ 900 mm FRC Non pressure Class 2 690 m 455$ 313,950$ Trench Excavation 2070 cum 30$ 62,100$ 1200 by 1200 mm pits 7 Unit 1,500$ 10,500$ Humegard HG40A (or similar) GPT 1 Unit 85,500$ 85,500$ Inlet to Bioretention and Scour Pad 1 Unit 20,000$ 20,000$ Delivery Channel - 30mm coarse gravel 0.1mm thick layer 50 cum 56$ 2,800$ Excavation and Earthworks 5569 cum 10$ 55,693$ Filter Media 2775 cum 30$ 83,260$ Transition Layer 450 cum 56$ 25,200$ Gravel Layer 675 cum 56$ 37,800$ 150mm flexible coil PE subsoil pipes 720 m 20$ 14,400$ 375mm PVC Collection Pipe 45 m 135$ 6,075$ Vegetation 5200 sqm 15$ 78,000$ 1m by 1m overflow pits 4 unit 2,500$ 10,000$ 900mm outlet pipe 45 m 375$ 16,875$ Connection to Existing Channel 1 Unit 10,000$ 10,000$ Irrigation System 0.5 Has 12,000$ 6,000$ Subtotal 840,853$ Contingency 25% 210,213$ TOTAL 1,050,000$

Functional Design of Owston Avenue Bioretention Systems 20
4 REFERENCES
Cooperative Research Centre for Catchment Hydrology (2002), Model for Urban Stormwater Improvement Conceptualisation (MUSIC), User manual.
Ecological Engineering (2007a), WSUD Strategy for Bellamack.
Ecological Engineering (2007b), WSUD Design Objectives for Darwin Discussion Paper.
Ecological Engineering (2007), Stormwater Treatment Options Discussion Paper
Institution of Engineers Australia (1997), Australian Rainfall and Runoff, Sydney.
Institution of Engineers Australia (2005), Australian Runoff Quality – A guide to Water Sensitive Urban Design, Sydney.
Melbourne Water, (2005), WSUD Engineering Procedures: Stormwater, CSIRO Publishing, Melbourne.
Rawlinsons, (2006), Australian Construction Handbook, Rawlhouse Publishing Pty Ltd, 24th edition.
U.S. Department of Transportation (2001), Urban Drainage Design Manual, Hydraulic Engineering Circular 22, Second Edition.

APPENDIX A: SOIL FILTRATION MEDIA SPECIFICATIONS

Bioretention and Tree Pit Media Specifications, Prepared for Facility for Advancing Water Biofiltration (FAWB) by Ecological Engineering, Sydney Environmental & Soil Laboratory Pty. Limited (SESL) and Dr Peter May (The University of Melbourne), July 2006
1
GUIDELINE SPECIFICATIONS FOR SOIL MEDIA IN BIORETENTION SYSTEMS
The following guideline specifications for soil media in bioretention systems have been prepared on behalf of the Facility for Advancing Water Biofiltration (FAWB) to assist in the development of bioretention systems, including the planning, design, construction and operation of those systems.
The guideline specifications are in two parts:
• Soil Media Specifications for Bioretention Systems with a Range of Vegetation Types • Soil Media Specifications for Tree Pod Bioretention Applications
Disclaimer The Guideline Specifications for Soil Media in Bioretention Systems are made available and distributed solely on an "as is" basis without express or implied warranty. The entire risk as to the quality, adaptability and performance is assumed by the user. It is the responsibility of the user to make an assessment of the suitability of the guideline specifications for its own purposes and the guideline specifications are supplied on the understanding that the user will not hold Ecological Engineering Holdings Pty Ltd, Monash University, Sydney Environmental & Soil Laboratory Pty. Limited (SESL), Dr Peter May or The University of Melbourne or parties to the Facility for Advancing Water Biofiltration (FAWB) (“the Licensor”) liable for any loss or damage resulting from their use. To the extent permitted by the laws of Australia, the Licensor disclaims all warranties with regard to this information including all implied warranties of merchantability and fitness. In no event shall the Licensor be liable for any special, direct or consequential damages or any damages whatsoever resulting from loss or use, whether in action of contract, negligence or other tortious action, arising out of the use of, or performance of this information..
1 SOIL MEDIA SPECIFICATIONS FOR BIORETENTION SYSTEMS WITH A RANGE OF VEGETATION TYPES
1.1 Bioretention Systems with Imported Media The bioretention soil media specifications require three layers of media. Filter media (600mm deep or as specified in the engineering design), a transition layer (100mm deep) and a drainage layer (150mm deep).
1.1.1 Filter Media - General Description The material can be of siliceous or calcareous origin. Only, minimal light compaction to avoid subsidence and uneven drainage should be carried out. The bioretention system will operate so that water will infiltrate into the filter media and move vertically down through the profile. The prescribed hydraulic conductivity will generally be between 50-300mm/hr.
Maintaining the prescribed hydraulic conductivity is crucial. Permeability testing using the Australian Standard (AS4419-2003 Appendix H) method will generally be suitable for determining the hydraulic conductivity of a particular soil. However, in some circumstances, additional hydraulic conductivity testing will be required (see below for further details).

Bioretention and Tree Pit Media Specifications, Prepared for Facility for Advancing Water Biofiltration (FAWB) by Ecological Engineering, Sydney Environmental & Soil Laboratory Pty. Limited (SESL) and Dr Peter May (The University of Melbourne), July 2006
2
The media is required to support a range of vegetation types (from groundcovers to trees) that are adapted to freely draining soils with occasional flooding.
In general the media should be a sandy loam to loamy sand soil with an appropriately high permeability under compaction and should be free of rubbish and deleterious material. The soils should contain some organic matter for increased water holding capacity but be low in nutrient content. In general appropriate material is likely to be approximated by a mix of 80-90% sand, 10-20% loam soil and 3-10% composted organics or peat. A detailed specification for filter media is described below.
1.1.2 Filter Media - Testing Requirements To determine whether a soil is suitable the following tests should be undertaken:
1. Particle size distribution (PSD)
2. AS4419-2003 – Soils for landscaping and garden use (specification for natural soil or soil blend unless stated above)
3. Water Holding Capacity – required where PSD does not meet specifications but silt + clay is <12% or in regions likely to experience extended dry spells
4. Saturated Hydraulic Conductivity - required where PSD does not meet specifications
Information from suppliers In some cases, suppliers may have PSD and AS4419-2003 testing results available for various soils. If the testing was carried out on the batch of soil available for purchase these results should be adequate. (Additional hydraulic conductivity and water holding capacity testing may still be required).
Soils that do not meet PSD Soils that do not lie within the specified PSD may be suitable if the silt plus clay content is less than 12% and it meets the specifications for the following tests:
1. AS4419-2003
2. Additional Hydraulic Conductivity Testing (e.g. McIntyre and Jakobsen (1998) method)
3. Water Holding Capacity
1.1.3 Filter Media - Detailed Specifications Detailed specifications (compiled with assistance from Sydney Environmental and Soil Laboratory, March 2006) are listed below. Testing requirements to confirm the suitability of a soil will vary depending on the information provided by the supplier and the quantity of soil required (see ‘testing requirements below).
1. Particle Size Distribution
Soils with infiltration rates in the appropriate range typically vary from sandy loams to loamy sands. Soils with the following composition (percentage range w/w) are likely to have an infiltration rate in the appropriate range and have suitable structural integrity (adapted from United States Golf Association: Method of Putting Green Construction, 1993)–
Clay 2-4% (<0.002 mm)
Silt 4-8% (0.002-0.05 mm)
Very Fine Sand 5-10% (0.05-0.15 mm)
Fine Sand 10-25% (0.15-0.25 mm)
Medium to Coarse Sand 60-70% (0.25-1.0 mm)
Coarse Sand 7-10% (1.0-2.0 mm)
Fine Gravel <3% (2.0-3.4 mm)

Bioretention and Tree Pit Media Specifications, Prepared for Facility for Advancing Water Biofiltration (FAWB) by Ecological Engineering, Sydney Environmental & Soil Laboratory Pty. Limited (SESL) and Dr Peter May (The University of Melbourne), July 2006
3
Variation in large particle sizes is flexible (i.e. an approved material does not have to be screened). However, the particle size distribution of the smaller particles (clay and silt) is a crucial element of the filter media specification. Where soils are prone to structural collapse the hydraulic conductivity may change dramatically depending on the state of collapse of the soil. However, ensuring the total clay and silt mix is less than 12% reduces the likelihood of structural collapse of such soils.
2. AS4419- 2003 (Soils for Landscaping and Garden Use)
i. Bulk density – as specified for ‘natural soils and soil blends’ >0.7 kg/L
ii. Organic Matter Content – between 3 and 10% w/w (For soils low in organic matter content the top layer (~300mm) of the filter media should be amended to meet the specified organic matter content (3 -10% w/w))
iii. Wettability - as specified for ‘natural soils and soil blends’ >5 mm/hr
iv. pH - as specified for ‘natural soils and soil blends’ 5.5 - 7.5 (pH 1:5 in water).
v. Electrical Conductivity (EC) - as specified for ‘natural soils and soil blends’ <1.2dS/m
vi. Phosphorus - <20mg/kg
vii. Nitrogen Drawdown (NDI) – as specified for ‘natural soils and soil blends’ >0.5 NDI150 (NDI assesses the ability of a soil to drawdown or immobilize soluble nitrogen).
viii. Toxicity - as specified for ‘natural soils and soil blends’
ix. Dispersibility - as specified for ‘natural soils and soil blends’ Category 1 or 2
x. Permeability – hydraulic conductivity as specified in engineering design. The prescribed hydraulic conductivity will generally be between 50-300mm/hr. A suitable soil will demonstrate a saturated hydraulic conductivity within ±20% of the hydraulic conductivity prescribed in the engineering designs.
xi. Texture – sandy loam to loamy sand
xii. Large particles - as specified for ‘natural soils and soil blends’
3. Additional Hydraulic Conductivity Testing – required where PSD does not meet specifications but silt + clay is <12%
Saturated hydraulic conductivity - as specified in engineering design. (Suitable methods include: McIntyre and Jakobsen (1998) method, AS/NZS 1547 permeability testing method).
4. Water Holding Capacity – required where PSD does not meet specifications but silt + clay is <12% or in regions likely to experience extended dry spells
Water Holding Capacity- at least 15-20% by volume at 300mm of suction using the McIntyre and Jakobsen (1998) method.
Any component or soil found to contain high levels of salt, high levels of clay or silt particles (exceeding the particle size limits set above), extremely low levels of organic carbon or any other extremes which may be considered retardant to plant growth and denitrification should be rejected.
Testing requirements to determine suitable soils are described in Filter Media – Testing Requirements. It may be possible to ‘construct’ a suitable filter media by amending the local soils. A procedure for constructing a suitable filter media is outlined below.

Bioretention and Tree Pit Media Specifications, Prepared for Facility for Advancing Water Biofiltration (FAWB) by Ecological Engineering, Sydney Environmental & Soil Laboratory Pty. Limited (SESL) and Dr Peter May (The University of Melbourne), July 2006
4
1.1.4 Transition Layer - Detailed Specifications Transition layer material shall be sand/ coarse sand material. An indicative particle size distribution is provided below:
% passing 1.4 mm 100 % 1.0 mm 80 % 0.7 mm 44 % 0.5 mm 8.4 % This grading is based on a Unimin 16/30 FG sand grading.
Geotextile fabrics are not recommended for use in bioretention systems due to the risk of clogging. An open knitted shade cloth can be placed between the transition layer and the drainage layer to help reduce the downward migration of smaller particles.
1.1.5 Drainage Layer - Detailed Specifications The drainage layer is to be fine gravel, such as a 2-5 mm screenings.

Bioretention and Tree Pit Media Specifications, Prepared for Facility for Advancing Water Biofiltration (FAWB) by Ecological Engineering, Sydney Environmental & Soil Laboratory Pty. Limited (SESL) and Dr Peter May (The University of Melbourne), July 2006
5
1.2 Constructing Filter Media from In-situ Soils 1. Identify if local top soil is capable of supporting vegetation growth and if there is enough top
soil (some top soils are very shallow) be used as a base for the filter media (may require active collection of top soil during the construction process). Any topsoil found to contain high levels of salt, extremely low levels of organic carbon (<<5%), or any other extremes which may be considered retardant to plant growth should be rejected. If the top soil is not suitable, a sandy loam soil can be purchased from a supplier for use as a base soil.
2. Conduct laboratory tests to establish hydraulic conductivity, water holding capacity, particle size distribution, and AS4419-2003 parameters.
3. If the soil needs to be amended to achieve the desired design saturated hydraulic conductivity and particle size distribution either mix in a loose non-angular sand (to increase saturated hydraulic conductivity) or a loose soft clay (to reduce saturated hydraulic conductivity).
4. The required content of sand or clay (by weight) to be mixed to the base soil will need to be established in the laboratory by incrementally increasing the content of sand or clay until the desired saturated hydraulic conductivity is achieved (within reasonable bounds). The sand or clay content (by weight) that achieves the desired hydraulic conductivity should then be adopted on-site.
5. The base soil should have sufficient organic content to establish vegetation on the surface of the bio-retention system. If the proportion of base soil in the final mix is less than 50% then it may be necessary to add in additional organic material. This will be limited to 10% organic content (measured in accordance with AS1289 4.1.1).
6. The pH of the soil mixture for the filtration layer is to be amended to between 5.5 and 7.5, before delivery to the site.
7. Ensure soil meets the specifications for:
a. hydraulic conductivity,
b. water holding capacity,
c. particle size distribution, and
d. AS4419-2003 parameters.
as set out in the Section 1.1.3 – Filter Media Detailed Specifications.
1.3 Targeting Specific Pollutants The media specification described above is designed for applications where the types and concentrations of pollutants are expected to be similar to ‘normal’ urban pollutant loads. In some cases, receiving waters may be more sensitive or target pollutants may differ (excessive heavy metals or increased nutrient concentrations for example). For sensitive sites or where the runoff is expected to have a composition that differs from general urban pollutant loads, media can be further amended to increase treatment efficiency.
For example, activated carbon (or another material with a high adsorption capacity) can be added where high concentrations of heavy metals are expected; the organic matter content of the media can be increased for sites where nitrogen is the target pollutant (and therefore denitrification is the target process); commercial products with high adsorption capacity that target specific pollutants such as phosphorus can also be added to the media where required.

Bioretention and Tree Pit Media Specifications, Prepared for Facility for Advancing Water Biofiltration (FAWB) by Ecological Engineering, Sydney Environmental & Soil Laboratory Pty. Limited (SESL) and Dr Peter May (The University of Melbourne), July 2006
6
2 SOIL MEDIA SPECIFICATIONS FOR TREE POD BIORETENTION APPLICATIONS
2.1 Bioretention Systems for trees For trees, the hydraulic conductivity will generally be prescribed to be within the range of 30 – 100 mm/hr. Maintaining the prescribed hydraulic conductivity is crucial.
Where soils are prepared for trees the pH of the soil mixture is to be corrected to between 5.5 and 7.5, using dolomite, before delivery to the site.
The filter media of ‘Tree Bioretention Pods’ consists of two layers, the base layer and the surface layer. The difference between the layers is the organic content, as discussed below. The total depth of the filter media profiles for trees must be deep enough to provide tree stability
As in other bioretention applications, a transition layer and a drainage layer are also required.
2.1.1 Base Layer The tree media base layer should meet the same specifications as described for bioretention filter media with exception to the Organic Matter Content which should be low. PSD and AS4419-2003 testing should be carried out and a suitable media will demonstrate the following characteristics:
1. Particle Size Distribution
Soils with infiltration rates in the appropriate range typically vary from sandy loams to loamy sands. Soils with the following composition are likely to have an infiltration rate in the appropriate range and have suitable structural integrity –
Clay 2-4% (<0.002 mm)
Silt 4-8% (0.002-0.05 mm)
Very Fine Sand 5-10% (0.05-0.15 mm)
Fine Sand 10-25% (0.15-0.25 mm)
Medium Sand 60-70% (0.25-0.5 mm)
Coarse Sand 7-10% (1.0-2.0 mm)
Fine Gravel <3% (2.0-3.4 mm)
Variation in large particle sizes is flexible (i.e. an approved material does not have to be screened). However, the particle size distribution of the smaller particles (clay and silt) is a crucial element of the filter media specification. Where soils are prone to structural collapse the hydraulic conductivity may change dramatically depending on the state of collapse of the soil. However, ensuring the total clay and silt mix is less than 12% reduces the likelihood of structural collapse of such soils.
2. AS4419- 2003 (Soils for Landscaping and Garden Use)
Bulk density – as specified for ‘natural soils and soil blends’ >0.7 kg/L
Organic Matter Content – less than 3-5% w/w
Wettability - as specified for ‘natural soils and soil blends’ >5 mm/hr
pH – as specified for ‘natural soils and soil blends’ 5.5 - 7.5 (pH 1:5 in water)

Bioretention and Tree Pit Media Specifications, Prepared for Facility for Advancing Water Biofiltration (FAWB) by Ecological Engineering, Sydney Environmental & Soil Laboratory Pty. Limited (SESL) and Dr Peter May (The University of Melbourne), July 2006
7
Electrical Conductivity (EC) - as specified for ‘natural soils and soil blends’ <1.2dS/m
Phosphorus - <20mg/kg
Nitrogen Drawdown (NDI) – as specified for ‘natural soils and soil blends’ >0.5 NDI150
Toxicity - as specified for ‘natural soils and soil blends’
Dispersibility - as specified for ‘natural soils and soil blends’ Category 1 or 2
Permeability – hydraulic conductivity as specified in engineering design
Texture – sandy loam to loamy sand
Large particles - as specified for ‘natural soils and soil blends’
2.1.2 Surface Layer The tree media surface layer is the top 150mm of soil (placed onto the base layer). The tree media surface layer should be the same as the base layer however further amended to include:
Organic matter at 10% by volume.
Suitable organic matter will be coco peat or fine compost. Any compost used should conform to the description of “composted soil conditioner” in Australian Standard AS 4454-1999.
2.1.3 Transition Layer Transition layer material shall be sand/coarse sand material. An indicative particle size distribution is provided below:
% passing 1.4 mm 100 %
1.0 mm 80 %
0.7 mm 44 %
0.5 mm 8.4 %
This grading is based on a Unimin 16/30 FG sand grading.
2.1.4 Drainage Layer The drainage layer is to be fine gravel, such as a 2-5 mm screenings.

APPENDIX B: CONCEPT DESIGN SKETCHES

Exi
stin
g S
edBa
sin
Bat
ter a
t 1 in
3 to
ex
istin
g su
rface
A
A
B
B
Inle
t Sco
ur P
ad
(see
det
ail)
Dis
tribu
tion
Cha
nnel
(see
de
tail)
Ow
ston
Ave
Bio
rete
ntio
n Su
rfac
e Pl
an
Bun
dsRed
irect
cha
nnel
to
con
cret
e lin
ed
chan
nel
050
met
res
N

Exi
stin
g S
edBa
sin
Bat
ter a
t 1 in
3 to
ex
istin
g su
rface
A
A
B
B900
mm
out
let t
o ex
istin
g O
wst
onAv
e C
hann
el
150m
m s
ubso
il dr
ains
Ow
ston
Ave
Bio
rete
ntio
n D
rain
age
Plan
900m
m
inle
t pip
e
1m b
y 1m
ov
erflo
w p
its
Flus
h po
ints
GP
T
375
mm
col
lect
ion
pipe
030
met
res
N
IL 3
.7
IL 3
.85
IL 4
.05
IL 4
.275
IL 4
.5 IL 4
.7
IL 4
.7
IL 4
.7
IL 4
.5

Ow
ston
Ave
Bio
rete
ntio
n In
let Filter
RL 5.5m
Top of batter RL 6m
1.5m
1.5m
5m
7.5m
900
mm
pip
e
1m
1m
1.5m
5.1
5.2
5.3
5.4
5.5
5.6
5.7
5.8
5.96
6.1
02
46
810
1214
Sec
tion
thro
ugh
cent
re o
f inl
et
900
mm
pi
pe
d 50=
300m
m
Roc
ks to
be
care
fully
pla
ced
and
inte
rlock
ing
d 50=
30 m
m
(eg
coar
se g
rave
l)
d 50
to g
rade
dow
n
d=
600m
m
d=
600m
m
d 50=
300m
m
d=
600m
m
d 60
0mm
d 60
0mm

Ow
ston
Ave
Bio
rete
ntio
n O
verf
low
Pit
Inle
t Gra
ted
Cov
er (o
r sim
ilar)
1m
300 mm
900m
m o
utle
t to
conn
ect t
o ch
anne
l
Filte
r Med
ia60
0mm
150m
m
Filte
r Med
ia
Dra
inag
e La
yer
Ove
rflo
w P
it C
ross
Sec
tion
Det
ail
Ove
rflo
w P
it Pl
an V
iew
Det
ail
Gra
ted
Inle
t Pit
(50-
75 m
m s
paci
ng)
900m
m o
utle
t to
con
nect
to
chan
nel
Out
let P
it60
0mm
inle
t
600m
m in
let
Vege
tate
d Fi
lter M
edia
1m
1m
Flus
h Po
int S
ectio
n 1-
1 D
etai
l
Tran
sitio
n La
yer 1
00m
m
‘Y’ B
ranc
h
Scre
w c
ap a
nd 3
50 x
350
x 1
50
conc
rete
sur
roun
ding
cap
.
Filte
r Med
ia s
urfa
ce
‘Dra
inag
e La
yer F
lush
Poi
nt
150
diam
eter
sol
id p
ipe
11
Scre
w C
ap a
nd 3
50 x
350
x 1
50
conc
rete
sur
roun
ding
cap
.
150
mm
per
fora
ted
pipe
Flus
h Po
int P
lan
View

Ow
ston
Ave
Bio
rete
ntio
n D
istr
ibut
ion
Cha
nnel
Det
ails
1m
5m
(Var
ies
from
5m
to
5.4
m)
1m 3m
Edge
of c
hann
el
Edge
of c
hann
el
2 2
4.65
4.75
4.85
4.95
5.05
5.15
5.25
5.35
5.45
5.55
01
23
45
6
Tran
sitio
n La
yer
Filte
r Med
ia
Dra
inag
e La
yer
0.3m
Batte
r at 1
in 3
Surfa
ce L
aid
with
coa
rse
grav
el (d
50 >
30m
m) a
nd
plan
ted
out
Filte
r Med
ia S
L

44.
24.
44.
64.
855.
25.
45.
65.
866.
26.
4
05
1015
2025
3035
4045
5055
6065
70
Ow
ston
Ave
Bio
rete
ntio
n C
ross
Sec
tions
Sec
tion
A-A
44.
24.
44.
64.
855.
25.
45.
65.
866.
26.
4
05
1015
2025
3035
4045
5055
6065
70
Exis
ting
Top
of E
xten
ded
Det
entio
n (5
.8)
Max
imum
Wat
er L
evel
(6.0
m)
Ove
rflow
Pit
Bund
sD
istri
butio
n C
hann
el
Exis
ting
Filte
r Med
ia S
L1
in 3
bat
ter
150m
m p
erfo
rate
d pi
pes

44.
24.
44.
64.
855.
25.
45.
65.
866.
26.
4
05
1015
2025
3035
4045
5055
6065
7075
8085
9095
44.
24.
44.
64.
855.
25.
45.
65.
866.
26.
4
05
1015
2025
3035
4045
5055
6065
7075
8085
9095
Ow
ston
Ave
Bio
rete
ntio
n C
ross
Sec
tions
Sec
tion
B-B
Bund
sD
istri
butio
n C
hann
el
Filte
r Med
ia S
L
Top
of E
xten
ded
Det
entio
n (5
.8)
Max
imum
Wat
er L
evel
(6.0
m)
Exis
ting
Ow
ston
Ave
Cha
nnel
Ow
ston
Ave
Cha
nnel
1 in
3 b
atte
r
150m
m p
erfo
rate
d pi
pes

![Bioretention Brownbag 072412.pptx [Read-Only]iswm.nctcog.org/training/Bioretention_PPT/Bioretention_booklet.pdfJuly 23, 2011 Bioretention Design 2 Basics of Bioretention • Also called](https://img.dokumen.tips/doc/110x75/5ae800237f8b9ae1578fcfc3/bioretention-brownbag-read-onlyiswmnctcogorgtrainingbioretentionpptbioretentionbookletpdfjuly.jpg)