Embed Size (px)
Citation preview

BELIEVING IN BETTERHow Aspirations and Academic Self Concept Shape
Young People’s Outcomes
Professor Pam Sammons, Dr Katalin Toth &
Professor Kathy Sylva June 2016

1
The relative importance of aspirations and attainment has been much debated by researchers, but the relationship between the two has not always been clear. Yet believing in oneself is increasingly seen by researchers as important in having the motivation to succeed.
As today’s research shows, the relationship is even more important than that. The research finds that there is a growing gender gap in university admissions already apparent in the higher aspirations of girls by the age of 13, whilst by the age of 15 or 16 such aspirations make a big difference to A level choices, particularly for disadvantaged students.
That’s why programmes like Sutton Scholars – working with bright teenagers to raise their aspirations before they embark on GCSEs – are so important, and why we need the government to do more to support those ambitions through targeted support particularly for the highly able from less advantaged homes.
Believing in Better is important new research from Professor Pam Sammons, Dr Katalin Toth and Professor Kathy Sylva at Oxford University which helps explain why some young people from disadvantaged backgrounds are missing out on achieving their potential.
The report and the previous two in the series, Subject to Background and Background to Success, have other important policy implications. Study and reading opportunities should not be a middle class preserve. Disadvantaged students – especially boys - should have additional encouragement and support to enable them to engage in self-directed study, do sufficient homework and read more books, the activities that are linked to aspirations and self-belief. Schools should provide such opportunities where they are unlikely to be available at home.
I am very grateful to the researchers for their work on this report, the third of four reports for the Sutton Trust.
SIR PETER LAMPL
Chairman of the Sutton Trust and of the Education Endowment Foundation
FOREWORD

2
Low aspirations are often cited as crucial in determining differences in students’ post 16 choices.1 In this report, we explore recent evidence about young people’s views and the importance they attach to going on to university, their beliefs about their own academic ability and their experiences of school to see how far these influences shape differences in A-level outcomes at age 18.
This report is the third in a series produced using EPPSE datai for the Sutton Trust and it explores students’ aspirations in relation to their views on the importance of getting a degree, their own university plans and their beliefs about their academic performance and abilities (described in this report as their ‘academic self-concept’). Our first report focused on high attaining students (identified at Key Stage 2 in primary school) who were followed up to Key Stage 5.2 Our second report investigated gender, ethnicity and 'place' poverty differences in academic outcomes during Key Stage 5 when students were in Year 12 and Year 13 of secondary education, attending either school or college.3 This report explores different factors that can shape young people’s goals, including parental, peer and school influences on students’ aspirations and their beliefs about their academic performance and abilities.
More specifically, we address the following research questions:
• What are the individual, family, neighbourhood and school predictors of general academic self-concept in Year 11, at age 16?
• What are the individual, family, neighbourhood and school predictors of aspirations in Year 11?
• What is the relationship between academic self-concepts, aspirations and A-level entry?
Key findings
Our results show that students’ aspirations, in terms of the importance they attach to getting a degree and their plans to go to university, are shaped from an early age by background, neighbourhood and educational influences.
Nonetheless, academic self-concept and aspirations both play a significant part in students’ A-level outcomes, over and beyond the important influence of background.
There are important differences among students in the general aspirations in terms of the importance they attach to getting a university degree and these are already evident at age 14. Around 61% believe it is very important to get a degree, and only 13% think it is of little or very little importance. In Year 11, 56% thought that it was very important to get a degree, while 20% did not attach much importance to it. Year 11 students also differ in how likely they think it is that they themselves will go on and get a degree. Only 27% of disadvantaged students compared with 39% of those not experiencing disadvantage thought it likely they would go on to university for a degree.
1. General academic self-concept - Higher levels of general academic self-concept were found for:
i The longitudinal Effective Provision of Pre-school Primary and Secondary school study (EPPSE) was funded by the Department for Education and tracked a sample of children from ages 3 to 16 years. The Sutton Trust follow-up covers academic outcomes to age 18 at A-level.
EXECUTIVE SUMMARY

3
o Older students (within their year group) o Pakistani students o Students whose mothers are older o Students whose mothers have a degree or higher degree o Students from families with higher socio-economic status (SES) o Students living with both parents o Students who had experienced more support at home during their early years and
early secondary school years o Students who had attended a more academically effective primary school o Students who rated their secondary school as having a strong emphasis on learning
and reported it had good learning resources o Students who spent more time (2-3 hours a weeknight) on homework at age 13/14
2. Aspirations - Girls reported higher levels of aspiration (thinking it was very important to get a university
degree and planning to go to university) than boys. - Those from ethnic minority backgrounds typically had higher levels of aspirations than white
British students. - Additionally, higher levels of aspirations were found for:
o students from families with higher salaries; o students who experienced higher levels of enrichment at home between at age 13/14
- Students who lived in a neighbourhood with higher levels of unemployment were five times more likely to consider a university degree as very important.
- Students who had attended a pre-school that was highly effective in promoting early number concepts were almost twice more likely to believe that they would go to university than students who had not attended any pre-school.
- Students who had attended a more academically effective primary school in promoting English attainment were also almost twice as likely to consider getting a university degree was very important and believe they themselves would go on to university than those that had attended a less academically effective primary school.
- Students who rated their secondary schools highly in terms of learning resources were almost six times more likely to believe it is very important to get a university degree (compared with those attending less well-resourced secondary schools) and almost five times more likely to believe that they would go to university.
3. Academic self-concept, aspirations and academic attainment
The research shows that both academic self-concept and aspirations are shaped by students' background characteristics. However, we find they both also play an additional and significant role in predicting differences in A-level outcomes. These findings points to the practical importance for schools and teachers of promoting both self-belief and attainment as mutually reinforcing outcomes.
- Students who had a stronger belief in their own abilities in English and maths at age 13/14 were twice as likely to go on to take three or more A-levels than those with less favourable views of their own abilities.
- Students with a stronger belief in their own abilities in Year 11 (aged 15 to 16) were almost four times more likely to go on to take three or more A-levels than students with a weaker belief.

4
- Students who felt it was very important to get a university degree when they were in Year 9 were found to be twice as likely to go on to take three or more A-levels, while those who felt it very important to get a degree when they were in Year 11 were almost three times more likely to take three or more A-levels than those who felt it less important to get a degree.
- Similarly, students who believed in Year 11 that it was very likely to go to university were twice as likely to take three or more A-levels as those who felt it less likely to continue an academic career.
- After taking into account students’ GCSE outcomes, their aspirations and general academic concept in Year 11 remain significant positive predictors, both doubling the chances that a student went on to take three or more A-levels.
- Disadvantaged students with higher aspirations in KS4 go on to get better A-level results than disadvantaged students with lower aspirations, even when we take account of their GCSE results at age 16.

5
Our results show that students’ aspirations, in terms of the overall importance attached to getting a degree and plans to go to university are shaped from an early age by a range of background, neighbourhood and educational influences.
Academic self-concept and aspirations both play a significant part in shaping students’ chances of A-level entry, over and beyond the important influence of background.
Educational experiences can also promote more favourable outcomes.
Attending a more academically effective primary boosts early attainment and progress in primary school and into Key Stage 3. It is also linked to better academic self-concept and aspirations in adolescence. Ensuring primary schools promote better progress in maths and English has long term consequences.
Secondary school experiences are also influential. Students themselves point to the importance of attending a well-resourced school and one that places a strong emphasis on learning, where good behaviour is the norm.
Time spent on homework is linked with stronger self-belief and aspirations as well as promoting better academic outcomes. This highlights the need to ensure that all students are encouraged to engage in independent study out of school on a regular basis during Key Stage 3.
The home learning environment in the early years and during adolescence also shapes students’ confidence in their own abilities as well as aspirations. Schools need to provide extra support for those students from families that are unable to offer such home learning experiences.
This report, therefore, recommends:
1. Support to encourage reading for pleasure, educational trips and out-of-school studying opportunities should be provided to promote attainment for disadvantaged students at all ages, and especially those who were found to be high attaining at age 11. Enrichment vouchers should be funded through the pupil premium for both primary and secondary pupils.
2. Disadvantaged students should have more opportunities to go to the best schools – those rated outstanding – by Ofsted with fairer admissions policies linked to free school transport.
3. Disadvantaged children should be given the opportunity to attend good pre-school settings with qualified staff.
4. Disadvantaged students should have additional encouragement and support to enable them to engage in self-directed study, do sufficient homework and read more books, the activities that provide extra academic dividends and are linked to aspirations and self-belief. Schools should provide such opportunities where they are unlikely to be available at home.
CONCLUSIONS AND RECOMMENDATIONS

6
Academic self-concepts and aspirations are relevant to educational policies and can be used to reduce inequalities experienced by disadvantaged students.4,5 Academic self-concept has been defined as a subjective judgement of students own academic achievement in specific academic subjects or general ability.6 Academic self-concept can be influenced by prior academic achievement and can also influence future academic attainment, being in a reciprocal relationship.7 Furthermore, there is evidence that the academic self-concept is not only based on the perception of ones’ own academic abilities, but it can be also affected by the standard of ability of the peer group (the classroom or school). This has been labelled the “big-fish-little-pond effect” by Marsh and his colleagues.8,9,10 In line with this, when students are put into a higher ability environment, their academic self-concept declines.6 On the other hand, students from schools with a higher proportion of students eligible for free school meals were found to have significantly higher academic self-concepts.11 Thus, it is important to consider the broader context when studying the complex relationship between academic self-concept and academic attainment.
Besides low levels of self-belief in academic abilities, low aspirations are often cited as potential barriers to closing the gap in academic attainment and increasing social mobility.1 These are claimed to reinforce inequality and might account for the differences in educational outcomes and career opportunities of different income and ethnic groups. 12,13
However, as aspirations are complex, it is still unclear how they are shaped and the ways they influence academic outcomes.1, 14 Thus, there is a lack of clarity whether the low levels of aspirations are the issue, especially for children from disadvantaged families, or the disadvantage itself raises other barriers that impede even high aspirations to be fulfilled.14 Aspirations are affected by the individual experiences of the children, the influences of their peer groups and families, and the pressures and opportunities offered by the schools, communities and society. All these factors mutually reinforce aspirations and need to be taken into account when exploring the relationships with academic outcomes and career opportunities.14
Both aspirations and academic self-concepts are multidimensional, potentially influenced by the family or the broader community and schools contexts and do not inevitably translate into better academic attainment. There is little evidence that intervention programs designed to raise aspirations have a positive effect on academic attainment as well.13,14,15,16
Sample The sample for this research is drawn from the Effective Pre-school, Primary and Secondary Education Project (EPPSE3+-16), a major large-scale, longitudinal study of the progress and development of children from pre-school through to post-compulsory education in England. 17,18,19,20,21 It has investigated various aspects of pre-school, primary and secondary school provision that shape children's attainment, progress and development over successive phases of education up to age 16. This Sutton Trust follow-up study explores different factors that can have an impact on young people’s goals, including parental, peer and teacher influences on students’ aspirations and their beliefs about their own academic performance and abilities. It also considers the relationships between their beliefs, abilities and academic attainment at A-level.
The EPPSE datasets provide rich information on around 2700 young people’s lives and educational progress and social development from the early years at age 3+ to age 16+. In this report we focus particularly on self-concept and aspirations.
INTRODUCTION

7
Information on changing home circumstances was collected from parents and later from students themselves (at ages three, seven, and 14) and assessments of these students’ academic, social and attitudinal development were available for eight time points in the period 3-18 years.
Self-belief: Measuring students' academic self-concept Academic self-concept (a person's knowledge, beliefs and perceptions about their own academic ability) is regarded as a key feature of self-concept and is increasingly recognised as important in its own right by psychologists and educational practitioners. Research by Marsh and colleagues have revealed the links between academic attainment and self-concept and indicated that students' self-beliefs can vary in different subjects or domains (e.g., maths and English).22,23 Marsh and Craven while showing that academic attainment and academic self-concept have reciprocal effects argued that teachers and schools need to pay attention to promoting both.7
In this report, we describe two different measures of self-concept, created from the Year 9 and Year 11 student survey responses. These are measures of the students’ beliefs about their own academic performance and abilities. The first factors relate to the Year 9 academic self-concepts for English and maths, and are based on existing well established academic self-concepts scales (see Tables A.1 and A.2).24, 4, 7,28 We investigated whether these two measures of academic self-concept predicted students' later academic attainments at A-level.
Based on EPPSE data and following the general academic self-concept model of Marsh, Sammons and colleagues constructed a measure of general self-concept when students were in Year 11 based on six questionnaire items:25, 26,11
• I have always done well in most school subjects • Compared to others my age I am good at most school subjects • I get good marks in most school subjects • Work in most school subjects is easy for me • I learn things quickly in most school subjects • I am satisfied with how well I do in most school subjects
These items were closely related to each other and reliably represented general academic self-concept (Cronbach=0.89). This measure was standardised to have a mean of a 100 and a standard deviation of 15.
Students who had a higher general academic self-concept were also found to report that they enjoyed school more and showed more favourable responses in terms of mental well-being.9
As expected, general academic self-concept at age 16 was related to measures of earlier self-concepts from Year 9 when students were age 14. Thus, general academic self-concept was positively and significantly associated with both maths and English academic self-concept, the relationship being stronger with maths academic self-concept (r=0.42) than English academic self-concept (r=0.31).11

8
Figure 1: Distribution of the weighted general academic self-concept scale
n=1666, Mean =2.83, Standard deviation=0.71
Source: Sammons et al., 2014
Aspirations In Years 9 and 11, students were asked about the importance of getting a university degree and their responses represent our first measurement of their level of aspiration related to pursuing higher level academic studies. In both Year 9 and 11, more than half of the students believed it is very important to get a university degree (with a slightly higher percentage in Year 9). Only about 13% of the Year 9 students and 20% of the Year 11 students reported that getting a university degree is not very or not at all important (see Table 1). For both measures, we grouped those who reported getting a university degree as very important against the rest of the students. The Year 9 measure was used as a predictor, while the Year 11 measure represented our main outcome for the logistic models.
Table 1: Overall distribution of students’ aspirations – Perceived importance of getting a university degree in Year 9 and 11
How important is it to you to get a university degree? Year 9 Year 11
N % N %
Very important 1070 61.4 924 56.3
Fairly important 449 25.8 389 23.7
Not very important 187 10.7 218 13.3 Not at all important 37 2.1 109 6.6
Total 1743 100 1640 100
The second measure of aspiration refers to the perceived likelihood that the student felt they would be going to university within the next five years. Students’ responses are presented in Table 2. Proportionately fewer students felt it very likely that they would go to university (34%). We compared those who said that they were very likely to go to university against all other categories of responses and explored in logistic regression models the predictive power of individual, family, neighbourhood and school characteristics.

9
Table 2: Overall distribution of students’ aspirations – Perceived likelihood of going to university Year 11 How likely is it that you will go to university within the next 5 years or so?
N %
Very likely 568 34.20 Fairly likely 574 34.56 Not very likely 222 13.37 Not at all likely 196 11.80 Do not know 101 6.08 Total 1,661 100.00
Building on the earlier analyses reported in the previous two Sutton Trust reports, we used individual, family, neighbourhood, home learning environment, pre-school, primary school, secondary school measures of effectiveness and qualities and views of schools to explore their potential influences on the main outcomes.

10
This report explores different factors that can have a shape on young people’s goals, including parental, peer and school influences on students’ aspirations and their beliefs about their academic performance and abilities.
More specifically, we examine the following research questions:
• What are the individual, family, neighbourhood and school predictors of general self-concept in Year 11, at age 16?
• What are the individual, family, neighbourhood and school predictors of aspirations in Year 11?
• What is the relationship between academic self-concepts, aspirations and A-level results?
Relationship between background characteristic and aspirations Tables 3 and 4 show that girls were significantly more likely to think that it was very important to get a university degree than boys (Year 9 - 65% vs. 58%; Year 11 - 59% vs. 53%). No significant gender differences were found for the likelihood of going to university.
Table 3: Perceived importance of getting a university degree in Year 9 by gender
Year 9 - It is very important to you to get a university degree
Gender No Yes Total
N % N % N %
Boys 356 42.4 483 57.6 839 100 Girls 317 35.1 587 64.9 904 100 Total 673 38.6 1070 61.4 1743 100
Pearson chi2(1) = 9.9583 Pr = 0.002
Table 4: Perceived importance of getting a university degree in Year 11 by gender
Year 11 - It is very important to you to get a university degree
Gender No Yes Total
N % N % N %
Boys 349 46.9 395 53.1 744 100 Girls 367 41.0 529 59.0 896 100 Total 716 43.7 924 56.3 1640 100
Pearson chi2(1) = 5.8478 Pr = 0.016
In contrast, statistically significant FSM differences were found for the likelihood of going to university, but not for the importance of getting a university degree. Thus, students receiving free school meals in Year 11 were significantly less likely to think they would go to university (27%) than students who did not receive free school meals (36%).
MAIN FINDINGS

11
Table 5: Perceived likelihood of going to university by FSM
Year 11 - It is very likely that you will go to university
Year 11 Free school meal No Yes Total
N % N % N %
No 904 64.5 497 35.5 1401 100
Yes 149 73.4 54 26.6 203 100
Total 1053 65.6 551 34.4 1604 100
Pearson chi2(1) = 6.1911 Pr = 0.013
Previous reports that focused on disadvantaged children described in details this measure.,2,3 Disadvantaged students were less likely to consider getting a university degree as very important (51%) than less disadvantaged students (60%). Similarly, disadvantaged students were also less likely to think they would go to university (27%) than less disadvantaged students (39%).
Table 6: Perceived importance of getting a university degree by disadvantage Year 11 - It is very important to you to get a university degree
Disadvantaged No Yes Total
N % N % N %
No 393 39.9 591 60.1 984 100 Yes 323 49.2 333 50.8 656 100
Total 716 43.7 924 56.3 1640 100
Pearson chi2(1) = 13.8360 Pr = 0.000
Table 7 Perceived likelihood of going to university by disadvantage
Year 11 - It is very likely that you will go to university
Disadvantaged No Yes Total
N % N % N %
No 605 61.1 385 38.9 990 100 Yes 488 72.7 183 27.3 671 100 Total 1093 65.8 568 34.2 1661 100
Pearson chi2(1) = 23.9819 Pr = 0.000
Relationship between general academic self-concept and aspirations There is a positive and statistically significant relationship between students’ general belief in their own academic abilities – academic self-concept - and their aspirations, measured in two ways. Firstly, in terms of the importance attached to going to university and secondly in terms of students' own plans for going to university. Overall, students with higher general academic self-concept consider

12
getting a university degree more important (r=0.38). Moreover, there is a slightly stronger positive association between general academic self-concept and students' beliefs about the likelihood that they themselves will go to university (r=0.44). A similar pattern of relationships is evident when we calculated the average levels of general academic self-concept and different levels of aspirations. The averages increase according to the importance of getting a degree and the likelihood of going to university reported by the Year 11 students (see Tables A.2 and A.3 in the Appendix).
Relationship between self-concept, aspirations and A-level results Students who went on to take three or more A-levels were significantly more likely to believe in their own academic abilities than those who did not. The lowest mean score for general academic self-concept was found for those students that did not continue onto an academic routeii after post compulsory education, as seen in Table 8.
Table 8: Means of general academic self-concept by A-levels
Year 11 General academic self-concept
Take three or more A-levels? N Mean SD
No A-levels 398 97.5 13.1
Less than 3 A-levels 173 101.3 13.4
Three or more A-levels 626 107.8 13
KS5 Data unavailable 469 91.3 14.2
Total 1666 100 15
Half of the students who believed it was very important to get a university degree when they were in Year 11 went on to take three or more A-levels, while only a third of those who felt it fairly important to get a degree went on to take three or more A levels. Moreover, only 11 percent of those who believed it was not very important to get a university degree took three or more A-levels. Over 75 per cent of those who thought it was not at all important did not continue onto an academic route post 16 (no A-levels or no Key Stage 5 record, see Figure 2 or Table A.4).
ii This group refers to students who did not have A-levels data available.

13
Figure 2: Levels of aspiration and A-levels – Perceived importance of getting a university degree in Year 11
Over 60% of the students who believed it as very likely that they would continue their educational career with a university degree took three or more A-levels. By contrast, three quarters of those who felt they were not at all likely to go to university did not continue onto an academic route (no Key Stage 5 record, see Figure 3 or Table A.5).
Figure 3: Levels of aspiration and A-levels – Perceived likelihood of going to university in Year 11

14
Predicting Year 11 general academic self-concept The various associations presented so far do not take into account the simultaneous influences of multiple characteristics that can shape students' views and outcomes. Sammons and colleagues in a previous report on students’ dispositions, used a variety of measures to model for potential influence on Year 11 general academic self-concept:11
• Individual student factors (such as gender, birth weight, ethnicity, mother tongue) • Family factors (e.g. eligibility for free school meals, family, socio-economic status, parental
qualifications, family income, family structure) • Home learning environment in the early years, Key Stage 1, Key Stage 2 and Key Stage 3 • Neighbourhood characteristics of the students.
Multilevel regression models showed that the following characteristics were statistically significant net predictors of Year 11 general academic self-concept (see Table 9). Results are expressed in effect sizes.iii These effects show the strength of associations, while controlling for the influence of all other predictors in the model.
• Age (ES=0.17) • Ethnicity (ES=0.35) • Mother’s qualifications (ES=0.42; ES=0.45) • Family SES (ES=-0.17; ES=-0.41) • Mother’s age (ES=0.19; ES=0.20) • Family structure (ES=-0.18) • Early years HLE (ES=0.26) • Key Stage 3 HLE Supervision (ES=0.22) • Key Stage 3 HLE Enrichment (ES=0.39)
Table 9: Significant ‘net’ effects for predictors of general academic self-concept at age 16
Characteristic Effect Size
Description
Age 0.17 Older students (within their year group) have higher academic self-concept.
Ethnicity 0.35 Pakistani heritage have higher academic self-concept than white UK heritage.
Mother’s qualifications 0.42 0.45
Mother’s higher degree is related to higher academic self-concept (vs. no qualifications). Mother’s professional qualifications are related to higher academic self-concept (vs. no qualifications).
Family SES
-0.17 -0.41
Family in skilled and unskilled occupation lower academic self-concept (compared to professional non manual group).
Mother’s age
0.19 0.20
Older mothers; (26-35 years old) and (36+ years old) higher academic self-concept (compared to 16-25 years old).
Family structure -0.18 Step parent in the house predicts lower academic self-concept versus both parents
Early years HLE
0.26
Highest early HLE group higher academic self-concept (vs .low HLE).
KS3 HLE Supervision 0.22 High parental supervision in KS3 (vs. low) higher academic self-concept. Enrichment HLE in KS3
0.39 0.16
High enrichment (vs. low) higher academic self-concept. Medium enrichment (vs. low) also predicts higher academic self-concept.
iii An effect size is a statistical measure representing the strength of the effect of each predictor variable on the outcome after taking account of other predictor variables in the model. An ES of 0.2 can be seen as representing a small to moderate influence while a relatively strong influence would be an ES of 0.6 or above.
USING STATISTICAL MODELS TO PREDICT DIFFERENCES IN STUDENTS’ ACADEMIC SELF-CONCEPT AND ASPIRATIONS

15
Interestingly, no gender differences were found for general academic self-concept at age 16: boys and girls were just as likely to believe in their own abilities. This is different from what we found at age 13 when girls showed were significantly less likely to believe in their own mathematical abilities than boys.11 This may well be because the scale measures self-concept across all school subjects. Girls are outperforming boys academically in Year 11 in terms of overall GCSE results, and have been doing so consistently at different previous time points, suggesting that, as a group, girls may be underestimating their academic ability.iv
Additional to these significant predictors, Sammons et al. also found that students who had attended a more academically effective primary school for promoting English and Maths showed higher scores for general academic self-concept later on in Year 11, than other students.11 Students who had attended a highly effective primary school for English or maths showed more favourable general academic self-concepts at age 16 than those who had attended a less effective primary school. This seems likely to reflect the positive effect found for attending such schools on these students' own academic progress in these two subjects in primary school and their resultant better attainment in Year 6 before going to secondary school.
Those attending secondary schools with a higher proportion of students eligible for free school meals were found to have significantly higher general academic self-concept (ES=0.17). This seems to be in line with the big-fish-little-pond effect of academic self-concept, where a student‘s belief in their own abilities is found to develop relative to the general attainment of other students in their peer group.4
All the measures of students' own reporting of their school experiences in Year 9 were significant predictors of general academic self-concept in Year 11 when tested individually. However, the factor measuring the secondary school's emphasis on learning proved to be the most important aspect of school and teaching process that predicted students' general academic self-concept when measures were tested together (ES=0.29). Attending a secondary school that had better learning resources also predicted general academic self-concept (ES=0.15, see Table A.6).
We also tested an overall model that included predictors previously identified as significant. It should be noted that ethnicity, mother’s age and primary school academic effectiveness are no longer significant in this model and therefore that mother’s age and primary school academic effectiveness were removed from the final model presented below.
Attending a secondary school that has higher proportion of students with free school meals remained associated with higher levels of general academic self-concept when other individual, family and background characteristics were taken into account. Similarly, completing between two and three hours of homework per school night in Year 9 (age 13/14) also predicted a more favourable general confidence in students’ own abilities in Year 11 (age 15/16) (see Table A.7).
iv When ability level was taken into account girls were significantly more negative about their general academic self-concept than boys (ES=-0.19).

16
Predicting Year 11 aspirations
We used logistic regressions to investigate the net effect of individual, parental, neighbourhood and school factors to predict the level of aspiration in Year 11. We used two separate outcomes for the logistic models. The first refers to the importance a student attached to getting a university degree, while the second one related to the likelihood they reported that they themselves would go to university.
For both outcomes (Tables A.8 and A.9), we found that girls were significantly more likely to have high levels of aspirations (thinking it was very important to get a university degree – OR=1.34 and planning to go to university – OR=1.29) than boys. Those from ethnic minority backgrounds typically were more aspirational than white British students. Students from families with higher salaries were significantly more likely to believe that it was very important to get a university degree (OR=2.29) or that they would go to university (OR=2.61) than students from families with no salary. Students whose mothers had higher qualification levels were more than twice as likely to think that getting a university degree was very important (OR=2.56) or that it was very likely that they would go to university (OR=2.58) than students whose mother had no qualifications. Furthermore, students who engaged in higher levels of enrichment activities were more likely to have high aspirations than students who engaged less.
To the models presented above we added other predictors like neighbourhood and school characteristics and tested their individual influences on the likelihood that a student felt it was very important to get a university degree or on the likelihood that they would definitely go to university.
Higher levels of unemployment in the neighbourhood were statistically significantly associated with higher probabilities of believing it very important to get a university degree. Students from a neighbourhood with higher levels of unemployment were five times more likely to consider getting a university degree was very important (OR=5.28) compared with those from neighbourhoods with lower unemployment rates. It may be that students brought up in areas of high unemployment are more likely to see education as a route to future success and way of reducing the risk of unemployment.
Students who had attended a pre-school school that was highly effective in promoting early number concepts were almost twice more likely to believe that they would go to university (OR=1.78) than students who had not attended any pre-school.
Students who had attended a primary school that was highly academic effective in English were almost twice as likely to consider getting a university degree as very important (OR=1.75) or to definitely plan to go to university (OR=1.71) than those who had attended a school in the low academically effective group.
Students’ reports on their secondary school experiences were also statistically significant predictors of their later views on the importance of a university degree or the likelihood of going to university. The highest positive effect was found for the factor measuring school and learning resources. Students who perceived that their secondary schools had good learning resources were almost six times more likely to also say that it is very important to get a university degree (OR=5.74) or almost five times more likely to believe that they would go to university (OR=4.93).
Students’ reports of their secondary school’s emphasis on learning, its behaviour climate, the environment and teachers’ behavioural management were all also found to be positive predictors of

17
the importance attached to continue on to university or to the likelihood of going to university (see Table A.10 and A.11).
When tested together the factor related to school learning resources showed the strongest significant effect (OR =3.48) when predicting the importance of getting a university degree in Year 11.
We found evidence that spending two-three hours a night on homework in Year 9 showed the strongest effect on the levels of aspirations, almost tripling the likelihood that a student believed getting a university degree was very important (OR=2.96).
It has already been shown that academic self-concept and aspirations are related at a descriptive level (or in terms of averages). Measures of subject specific academic self-concepts from Year 9 were tested as predictors in the models and were found to be significant predictors of aspirations, even after controlling for individual and family characteristics.
As expected, students who believed it very important to get a university degree in Year 9, were also significantly more likely to think this two years later (OR=3.23) or to believe that they would continue onto university (OR=2.75).
The relationships between general academic self-concept, aspirations and A-level entry We explored the relationships between the measures of general academic self-concept, aspirations and students’ later patterns of A-level entry in a contextualised model that controlled for the various individual, family, neighbourhood and school effects identified as significant in previous analyses in this report.
Our findings show that both academic self-concept and the level of aspirations are important predictors of students’ A-level entries. Thus, having higher academic self-concepts in English and maths in Key Stage 3 at age 14 doubles the likelihood of a student going on to take three or more A-levels, controlling for other influences. Additionally, students with such self-belief in Year 11 were almost four times more likely to go on to take three or more A-levels than students with lower general academic self-concept, taking account of the effects of other influences. This shows that earlier beliefs about their own academic ability continue to shape students’ later academic outcomes.
Students are twice as likely to take three or more A-levels if they had felt it was very important to get a university degree in Year 9 (see Table A.12). The likelihood increases almost threefold when the importance of getting a degree measured in Year 11 was used as predictor of academic attainment.
Of course A-level entry is affected by students’ GCSE results, with many schools and colleges only accepting students that had achieved a benchmark of 5A*-C GCSE grades. Further analyses therefore controlled for students’ GCSE outcomes, particularly the key indicator likely to affected A-level entry at the time these students were in secondary school, whether they achieved 5A*-C GCSE grades, including English and maths at age 16. We did this to see if aspirations and academic self-concept play any additional role in shaping A-level entry beyond their links with GCSE outcomes at age 16 (see Table A.13).
The results show that after taking into account students’ GCSE outcomes, their Year 9 and 11 aspirations and Year 11 general academic concept remain significant positive predictors. Year 11 aspirations and academic self-concept both double the chances that a student went on to take three

18
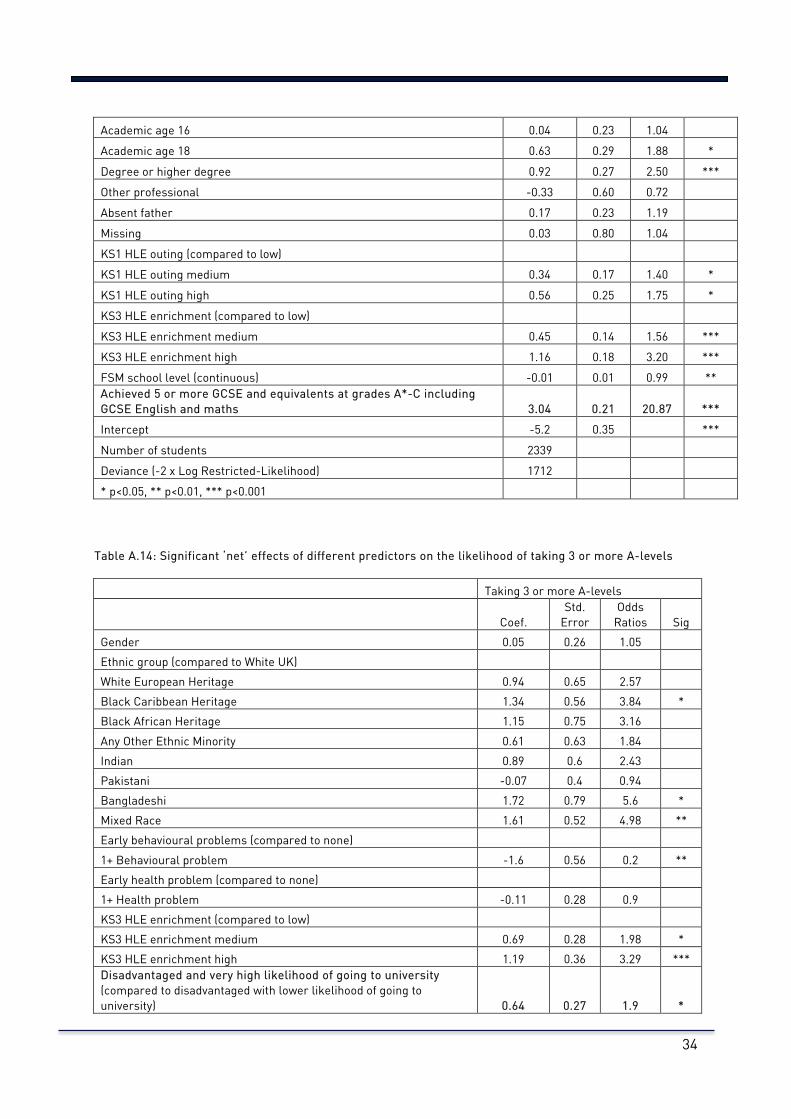
or more A-levels (see Table 10). Moreover, disadvantaged students with higher aspirations in KS4 go on to get better A-level results than disadvantaged students with lower aspirations, even when we take account of their GCSE results at age 16 (see Table A.14).The results also indicate that homework behaviour at younger ages (in Year 9) continued to be a strong predictor of going on to take three or more A-levels. This is one of the few studies on students' aspirations that is able to take into account students' GCSE examination attainment when explaining later A-level outcomes.
Table 10: Significant ‘net’ effects of different predictors on the likelihood of taking 3 or more A-levels
Taking 3 or more A-levels
Coef. Std.
Error Odds
Ratios Sig
Girls 0.17 0.16 1.19
Ethnic group (compared to White UK) White European Heritage 0.78 0.50 2.18
Black Caribbean Heritage 1.32 0.52 3.75 *
Black African Heritage 0.37 0.73 1.44 Any Other Ethnic Minority -0.23 0.73 0.79 Indian 1.66 0.59 5.28 **
Pakistani -0.38 0.42 0.68 Bangladeshi 1.17 0.78 3.21 Mixed Race 0.52 0.36 1.68 Early behavioural problems (compared to none)
1+ Behavioural problem -0.78 0.28 0.46 **
Early health problem (compared to none) 1+ Health problem -0.22 0.18 0.80
KS1 family salary (compared to no salary) £2500-15000 0.63 0.32 1.88
£17500-27500 0.64 0.31 1.89 *
£30000-35000 1.03 0.34 2.80 **
£37500-66000 1.02 0.32 2.78 **
£67500-132000 1.07 0.40 2.91 **
Missing 0.72 0.35 2.05 *
Mother's highest qualifications level at age 3/5 (compared to none) Vocational 0.34 0.34 1.40
Academic age 16 0.33 0.30 1.39 Academic age 18 0.66 0.37 1.94 Degree or higher degree 0.79 0.35 2.21 *
Other professional 1.09 0.61 2.97 Missing -0.26 0.93 0.77 Father's highest qualifications level at age 3/5 (compared to none)
Vocational 0.42 0.36 1.52 Academic age 16 0.47 0.33 1.61 Academic age 18 1.00 0.39 2.71 *
Degree or higher degree 1.19 0.37 3.29 **

19
Other professional 0.60 0.76 1.82 Absent father 0.32 0.34 1.38 Missing 1.31 1.14 3.71 KS3 HLE enrichment (compared to low)
KS3 HLE enrichment medium 0.38 0.19 1.47 *
KS3 HLE enrichment high 0.86 0.23 2.36 ***
Year 11 - Is it very likely that I will go to university 0.71 0.17 2.03 ***
Year 11 General academic self-concept 0.89 0.13 2.42 *** Achieved 5 or more GCSE and equivalents at grades A*-C including GCSE English and maths 2.08 0.26 8.04 ***
Year 9 Time spent on homework (compared to none) Less than 1/2 hour 0.59 0.58 1.81
1/2-1 hour 0.99 0.55 2.70 1-2 hours 0.78 0.56 2.18 2-3 hours 1.69 0.63 5.42 **
Over 3 hours 2.22 0.96 9.23 *
Intercept -5.52 0.71
***
Number of students 1221 Deviance (-2 x Log Restricted-Likelihood) 1055 * p<0.05, ** p<0.01, *** p<0.001

20
This report builds on and extends the two previous EPPSE reports for the Sutton Trust that explored the role of students’ background and educational influences in shaping A-level outcomes in Key Stage 5. Here we have analysed data for the same sample of young people to investigate the contributions of aspirations and academic self-concept to later academic success at age 18. We did this to see how far aspirations and academic self-concept shape outcomes over and beyond the important influences of students’ individual, family and neighbourhood characteristics.
The research shows that both academic self-concept and aspirations are also shaped by such background characteristics. However they also play an additional role in predicting differences in A-level outcomes.
The data indicate that girls attach more importance to getting a university degree than boys, but they do not have higher academic self-concepts. In addition, economically disadvantaged students show lower aspirations and are less likely to think they will go on to university to take a degree. In general, ethnic minority students tend to have higher aspirations (in terms of going to university) and academic self-concepts than white British students.
Our results show that students’ aspirations, in terms of the importance attached to getting a degree and plans to go to university, are shaped from an early age by background, neighbourhood and educational influences.
Nonetheless, academic self-concept and aspirations both play a significant part in students’ A-level outcomes, over and beyond the important influence of background.
The findings reveal that educational experiences in school can also promote academic success over and above social background.
Attending a more academically effective primary boosts early attainment and progress and is also linked to academic self-concept and aspirations. Ensuring primary schools promote better progress in maths and English has long term consequences.
Secondary school experiences are also influential. Student reports on their secondary school experiences point to the importance of attending a well-resourced school and one that places a strong emphasis on learning in promoting aspirations and academic self-concept. Our findings on the potential of educational influences on the students’ outcomes and achievement and promoting social mobility chime with the conclusion of the recently published report by the Fair Education Alliance.29
Time spent on homework is linked with academic self-concept and aspirations as well as promoting better academic outcomes. This highlights the need to ensure that all students are encouraged to engage in independent study out of school on a regular basis.
The home learning environment in the early years and during adolescence also shapes academic self-concept and aspirations. Schools need to provide extra support for those students from families that are unable to offer such home learning experiences.
CONCLUSIONS AND MESSSAGES

21
1) Baker, W., Sammons, P., Siraj-Blatchford, I., Sylva, K., Melhuish, E. C., & Taggart, B. (2014). Aspirations, education and inequality in England: insights from the Effective Provision of Pre-school, Primary and Secondary Education Project. Oxford Review of Education, 40(5), 525-542.
2) Sammons, P., Toth, K., & Sylva, K. (2015). Subject to background: What promotes better achievement for bright but disadvantaged students?, London: Sutton Trust.
3) Sammons, P., Toth, K., & Sylva, K. (2015). Background to success: Differences in A-level entries by ethnicity, neighbourhood and gender, London: Sutton Trust.
4) Marsh, H. W. & Hau, K. T. (2003). Big fish little pond effect on academic self-concept: A crosscultural (26 country) test of the negative effects of academically selective schools. American Psychologist, 58(5), 364-376.
5) Marsh, H. W., & Hau, K. T. (2004). Explaining paradoxical relations between academic self-concepts and achievements: Cross-cultural generalizability of the internal/external frame of reference predictions across 26 countries. Journal of Educational Psychology, 96(1), 56-67.
6) Marsh, H. W., Chessor, D., Craven, R., & Roche, L. (1995). The effects of gifted and talented programs on academic self-concept: The big fish strikes again. American Educational Research Journal, 32(2), 285-319.
7) Marsh, H. W., & Craven, R. G. (2006). Reciprocal effects of self-concept and performance from a multidimensional perspective: Beyond seductive pleasure and unidimensional perspectives. Perspectives on psychological science, 1(2), 133-163.
8) Marsh, H. W. (1984). Self-concept, social comparison, and ability grouping: A reply to Kulik and Kulik. American Educational Research Journal, 21(4), 799-806.
9) Marsh, H. W. (1984). Self-concept: The application of a frame of reference model to explain paradoxical results. Australian Journal of Education, 28(2), 165-181.
10) Marsh, H. W., & Parker, J W. (1984). Determinants of student self-concept: Is it better to be a relatively large fish in a small pond even if you don't learn to swim as well? Journal of Personality and Social Psychology, 47(1), 213-231.
11) Sammons, P., Sylva, K., Melhuish, E. C., Siraj, I., Taggart, B., Smees, R., & Welcomme, W. (2014). Effective Pre-school, Primary and Secondary Education project (EPPSE 3-16+): influences on students' dispositions and well-being in Key Stage 4 at age 16. Project Report. Institute of Education, London.
12) Department of Education (2010). The importance of teaching: Schools White Paper, (CM7980), London.
13) Strand, S., & Winston, J. (2008). Educational aspirations in inner city school. Educational Studies, 34(4), 249-267.
14) Kintrea, K, St.Clair, R., and Houston, M. (2011). The influence of parents, places and poverty on educational attitudes and aspirations. York: Joseph Rowntree Foundation.
REFERENCES

22
15) Cummings, C., Laing, K., Law, J., McLaughlin, J., Papps, I., Todd, L., & Woolner, P. (2012). Can changing aspirations and attitudes impact on educational attainment? York: Joseph Rowntree.
16) Gorard, S., See, B. H., & Davies, P. (2012). The impact of attitudes and aspirations on educational attainment and participation. York: Joseph Rowntree Foundation.
17) Sammons, P., Sylva, K., Melhuish, E., Siraj-Blatchford, I., Taggart, B. and Hunt, S. (2008). Effective Pre-school and Primary Education 3-11 Project (EPPE 3-11): Influences on children’s attainment and progress in Key Stage 2: Cognitive outcomes in Year 6. Research Report No. DCSF-RR048. Nottingham: DCSF Publications.
18) Sammons, P., Sylva, K., Melhuish, E., Siraj-Blatchford, I., Taggart, B., Toth, K., Draghici, D. and Smees, R. (2012). Effective Pre-School, Primary and Secondary Education Project (EPPSE 3-14) - Influences on students’ attainment and progress in Key Stage 3: Academic outcomes in the core subjects in Year 9. London: Institute of Education, University of London / Department for Education.
19) Sammons, P., Sylva, K., Melhuish, E., Siraj-Blatchford, I., Taggart, B., Toth, and Smees, R. (2014). Effective Pre-School, Primary and Secondary Education Project (EPPSE 3-14) - Influences on students’ GCSE attainment and progress at age 16. DfE Research Report 352, London: Institute of Education, University of London / Department for Education.
20) Sylva, K., Melhuish, E., Sammons, P., Siraj-Blatchford, I. and Taggart, B. (Eds) (2010), Early childhood matters: Evidence from the Effective Pre-school and Primary Education project. London: Routledge.
21) Sylva, K. Melhuish, E., Sammons, P., Siraj-Blatchford, I. and Taggart, B. (2014) Students’ educational and developmental outcomes at age 16. EPPSE Final Report on Key Stage 4, DfE Research Report 354 , London: DfE.
22) Marsh, H. W., Walker, & Debus, R. (1991). Subject-specific components of academic self-concept and self-efficacy. Contemporary Educational Psychology 16(4), 331-345.
23) Marsh, H. W. (1992). Content specificity of relations between academic achievement and academic self-concept. Journal of Educational Psychology, 84(1), 35-42.
24) Marsh, H.W. (1990). The structure of academic self-concept: The Marsh/Shavelson Model. American Psychological Association, 82 (4), 623-636.
25) Marsh, H. W. (1992). Self-Description Questionnaire (SDQ) III: A theoretical and empirical basis for the measurement of multiple dimensions of late adolescent self-concept. An interim test manual and research monograph. Macarthur, New South Wales, Australia: University of Western Sydney, Faculty of Education.
26) Marsh, H. W. (1999). Self-Description Questionnaire–SDQ II. MacArthur, Australia: University of Western Sydney, SELF Research Centre.
27) JCQ (2015). Provisional GCE A Level results - June 2015, London: Joint Council for Qualifications http://www.jcq.org.uk/examination-results/a-levels/2015

23
28) Sammons, P., Sylva, K., Melhuish, E., Siraj-Blatchford, I., Taggart, B., Smees, R., Draghici, D., & Toth, K. (2011). Effective Pre-school, Primary and Secondary Education Project (EPPSE 3-14): Influences on students’ dispositions in Key Stage 3: Exploring enjoyment of school, popularity, anxiety, citizenship values and academic self-concepts in Year 9 Full report. London: Institute of Education, University of London/DfE.
29) The Fair Education Alliance (2016). Report card 2015.
http://static1.squarespace.com/static/543e665de4b0fbb2b140b291/t/570d7fac37013bba012cc50f/1460502515137/Fair+Education+Alliance+Report+Card+2015.pdf

24
The original EPPSE sample of 3,172 children was assessed at the start of pre-school, when they were about three years old and their development was monitored until they entered school around the age of five. This original sample also includes over 300 ‘home’ children who had not attended any type of pre-school and who were recruited to the study at age five, representing a comparator ‘no pre-school’ group. The sample was followed up across primary school into adolescence and children were assessed again in Key Stage 3 (age 13/ 14) until the end of Key Stage 4 in secondary school. These young people were most recently followed through their final year of compulsory schooling and on to their post 16 educational, training and employment choices.
In this report, we focus on the sample that were tracked up to the age of 16 (n=2812, representing 86% of the original sample). In total, just over 60% of the main tracked sample (n=1690) went on to continue their education beyond the age of 16. In line with national figures, we found that more than a third, 37% of the tracked EPPSE sample actually entered A-level exams (n=1045).27
Data provided by the Department for Education’s National Pupil Database (number of AS and A-levels attained, subjects taken, Key Stage 5 grades and total point scores) were used to investigate these students' A-level and AS achievement and identify the factors that predict academic success.
The research used descriptive statistics, multilevel regression, multiple and logistic regression as appropriate to predict differences in students’ examination results at A-level. Results are presented in effect sizes and odds ratios. An effect size (ES) is a statistical measure representing the strength of the effect of each predictor variable on the outcome after taking account of all the other predictor variables in the model.v Odds ratios (OR) are used to show the effects of different predictors in increasing or decreasing the likelihood of good outcomes for different groups of students (for example the likelihood of entering or taking three or more A-levels, for example).
v An ES of 0.2 can be seen as representing a relatively small influence while a moderate influence would be represented by ES of 0.3-0.5 and a relatively stronger influence would be an ES of 0.6 or above.
METHODOLOGICAL NOTE

25
Table A.1: Items used in creating the measure of math and English academic self-concept in Year 9 Maths academic self-concept I learn things quickly in my Maths classes I have always done well in my Maths classes Compared to others my age I am good at Maths Work in my Maths classes is easy for me I get good marks in Maths
Cronbach=0.91
English academic self-concept I learn things quickly in my English classes I have always done well in my English classes Compared to others my age I am good at English Work in my English classes is easy for me I get good marks in English
Cronbach=0.90
Source: Sammons et al. 2011
Table A.2: Means of general academic self-concept by aspiration - Perceived importance of getting a university degree
Year 11 General academic self-concept
Year 11 How important is it to you to get a university degree? N Mean SD
Very important 924 104.6 13.9
Fairly important 387 98.0 13.4
Not very important 218 91.5 14.0
Not at all important 108 87.2 13.9
Total 1637 100.2 15.0 Table A.3: Means of general academic self-concept by aspiration - Perceived likelihood of going to university
Year 11 General academic self-concept
Year 11 How likely is it that you will go to university within the next 5 years N Mean SD
Very likely 568 108.8 12.3
Fairly likely 572 99.6 13.4
Not very likely 221 91.8 13.9
Not at all likely 196 87.7 13.2
Do not know 100 95.4 13.1
Total 1657 100.1 15
APPENDICES

26
Table A.4: Levels of aspiration and A-levels - Perceived importance of getting a university degree
Take three or more A-levels?
Year 11 How important is it to you to get a university degree?
No A-levels Less than 3 A-levels
Three or more A-levels
KS5 Data unavailable
Total
N % N % N % N % N %
Very important 198 21.4 110 11.9 465 50.3 151 16.3 924 100
Fairly important 109 28.0 42 10.8 130 33.4 108 27.8 389 100
Not very important 64 29.4 20 9.2 24 11.0 110 50.5 218 100
Not at all important 23 21.1 1 0.9 3 2.8 82 75.2 109 100
Total 394 24.0 173 10.5 622 37.9 451 27.5 1640 100
Pearson chi2(9) = 310.4137 Pr = 0.000
Table A.5: Levels of aspiration and A-levels - Perceived likelihood of going to university
Take three or more A-levels?
Year 11 How likely is it that you will go to university within the next 5 years
No A-levels Less than 3 A-levels
Three or more A-levels
KS5 Data unavailable
Total
N % N % N % N % N %
Very likely 93 16.4 60 10.6 345 60.7 70 12.3 568 100
Fairly likely 158 27.5 78 13.6 237 41.3 101 17.6 574 100
Not very likely 80 36.0 13 5.9 19 8.6 110 49.5 222 100
Not at all likely 36 18.4 8 4.1 5 2.6 147 75.0 196 100
Do not know 31 30.7 14 13.9 19 18.8 37 36.6 101 100
Total 398 24 173 10.4 625 37.6 465 28.0 1661 100
Pearson chi2(12) = 525.7119 Pr = 0.000
Table A.6: Significant ‘net’ effects of Year 9 reports of school factors on general academic self-concept at age 16
General academic self-concept Tested individually Tested together Fixed Effects Coef SE ES Sig Coef SE ES Sig Emphasis on Learning 0.292 0.047 0.35 *** 0.243 0.052 0.29 *** Poor behaviour climate -0.122 0.039 0.19 ** Ns ns ns ns Headteacher qualities 0.085 0.031 0.15 ** Ns ns ns ns School environment 0.098 0.038 0.15 * Ns ns ns ns Valuing students 0.165 0.038 0.25 *** ns ns ns ns Learning resources 0.190 0.041 0.26 *** 0.109 0.045 0.15 * Teacher discipline ns Ns ns Ns ns ns ns ns Teacher support 0.185 0.043 0.24 *** ns ns ns ns
Source: Sammons et al. 2014

27
Table A.7: Significant ‘net’ effects for predictors of general academic self-concept
Coef. Std.
Error Effect Size
Sig
Age 0.44 0.11 0.23 ***
Ethnic group (compared to white UK) White European Heritage -2.27 2.42 -0.17
Black Caribbean Heritage 3.55 2.94 0.27 Black African Heritage 1.79 3.61 0.13 Any Other Ethnic Minority 0.80 3.82 0.06 Indian -2.18 2.67 -0.16 Pakistani 0.35 2.17 0.03 Bangladeshi 2.40 4.66 0.18 Mixed Race -0.09 1.73 -0.01 Family structure (compared to both parents)
Missing -15.64 6.07 -1.18 **
Single parent (mother or father) -1.09 1.04 -0.08 Natural parent and step parent (mother or father) -2.92 1.25 -0.22 *
Other (extended family/ssc/just stepparents/other parents) -5.69 3.07 -0.43 Highest family SES (compared to professional)
Missing -5.26 5.54 -0.40 Skilled -3.42 1.03 -0.26 ***
Semi-skilled -2.86 1.64 -0.22 Unskilled -8.27 3.73 -0.62 *
Never worked 0.76 3.19 0.06 Mother’s highest qualifications level at age 3/5 (compared to none)
Vocational -2.33 1.59 -0.18 Academic age 16 -0.10 1.33 -0.01 Academic age 18 0.35 1.83 0.03 Degree or higher degree 3.08 1.68 0.23 Other professional 6.95 3.10 0.52 *
Missing -2.66 4.04 -0.20 Early years HLE (compared to lowest)
Missing 0.32 3.16 0.02 14-19 1.18 1.89 0.09 20-24 4.71 1.91 0.35 *
25-32 2.67 1.84 0.20 33-45 3.63 2.05 0.27 KS3 HLE Enrichment (compared to low)
Missing 3.99 2.51 0.30 High HLE 5.18 1.31 0.39 ***
Middle 1.79 1.09 0.13 FSM school level (continuous) 0.09 0.04 0.20 *
Year 9 Time spent on homework (compared to none) Less than 1/2 hour 2.00 2.12 0.15

28
1/2-1 hour 2.06 2.02 0.15 1-2 hours 4.05 2.10 0.30 2-3 hours 6.59 2.64 0.50 *
Over 3 hours 2.08 4.74 0.16 Secondary school’s Emphasis on learning (continuous) 15.46 2.50 0.38 ***
Intercept 95.98 2.95
***
Variance-school level 0vi 0
***
Variance-student level 176.47 7.39
***
Total variance 176.47 Number of students 1141 Number of schools 375 Deviance (-2 x Log Restricted-Likelihood) 9140.61 Intra-school correlation (ICC) 0 % Reduction student variance 17 % Reduction school variance 100 % Reduction total variance 21.7 * p<0.05, ** p<0.01, *** p<0.001
viDue to small number of children in each school and the complexity of the model, it is difficult to estimate the school level variance so this should be interpreted with caution. The multilevel model is retain to improve the model fit.

29
Predicting Year 11 aspirations Table A.8: Significant ‘net’ effects for Year 11 aspirations – It is very important to get a university degree
Coef. Std.
Error Odds
Ratios Sig
Girls 0.29 0.11 1.34 **
Ethnic group (compared to White UK) White European Heritage 0.48 0.3 1.62
Black Caribbean Heritage 1.02 0.35 2.78 **
Black African Heritage 2.37 0.75 10.65 **
Any Other Ethnic Minority 0.66 0.42 1.93 Indian 1.92 0.46 6.80 ***
Pakistani 1.77 0.32 5.84 ***
Bangladeshi 3.19 1.04 24.35 **
Mixed Race 0.39 0.23 1.47 KS1 family salary (compared to no salary)
£2500-15000 -0.01 0.19 0.99 £17500-27500 0.16 0.19 1.17 £30000-35000 0.34 0.22 1.40 £37500-666000 0.38 0.2 1.46 £67500-132000 0.83 0.27 2.29 **
Missing 0.36 0.2 1.44 Mother's highest qualifications level at age 3/5 (compared to none)
Vocational 0.03 0.21 1.03 Academic age 16 0.06 0.17 1.06 Academic age 18 0.82 0.23 2.27 ***
Degree or higher degree 0.94 0.21 2.56 ***
Other professional 0.41 0.43 1.50 Missing -0.35 0.36 0.71 KS3 HLE enrichment (compared to low)
KS3 HLE enrichment medium 0.36 0.12 1.43 **
KS3 HLE enrichment high 0.52 0.15 1.68 ***
Intercept -0.91 0.2
***
Number of students 1640 Deviance (-2 x Log Restricted-Likelihood) 2027 * p<0.05, ** p<0.01, *** p<0.001

30
Table A.9: Significant ‘net’ effects for Year 11 aspirations – It is very likely that you will go university
Coef. Std.
Error Odds
Ratios Sig
Girls 0.26 0.12 1.29 *
Ethnic group (compared to White UK)
White European Heritage 0.13 0.31 1.13
Black Caribbean Heritage 0.64 0.34 1.90
Black African Heritage 2.00 0.50 7.40 ***
Any Other Ethnic Minority 0.77 0.41 2.15
Indian 1.62 0.35 5.07 ***
Pakistani 0.82 0.27 2.26 **
Bangladeshi 0.64 0.53 1.90
Mixed Race 0.35 0.24 1.42
KS1 family salary (compared to no salary)
£2500-15000 -0.11 0.21 0.89
£17500-27500 -0.19 0.21 0.83
£30000-35000 0.23 0.23 1.26
£37500-66000 0.11 0.21 1.12
£67500-132000 0.96 0.26 2.61 ***
Missing -0.07 0.22 0.93
Mother's highest qualifications level at age 3/5 (compared to none)
Vocational -0.17 0.23 0.84
Academic age 16 -0.07 0.19 0.94
Academic age 18 0.78 0.23 2.19 ***
Degree or higher degree 0.95 0.21 2.58 ***
Other professional 0.86 0.42 2.37 *
Missing -0.70 0.42 0.50
KS3 HLE enrichment (compared to low)
KS3 HLE enrichment medium 0.36 0.13 1.44 **
KS3 HLE enrichment high 0.64 0.15 1.89 ***
Intercept -1.59 0.22 ***
Number of students 1661
Deviance (-2 x Log Restricted-Likelihood) 1903
* p<0.05, ** p<0.01, *** p<0.001

31
Table A.10: Significant ‘net’ effects of Year 9 reports of school factors on aspirations It is very important to you to get a university
degree Tested individually Fixed Effects Coef SE OR Sig Emphasis on learning 1.24 0.37 3.45 *** Behaviour climate 0.45 0.18 1.58 * School environment 0.76 0.25 2.13 ** School/learning resources 1.75 0.42 5.74 *** Teacher behavioural management 0.85 0.37 2.35 *
Table A.11: Significant ‘net’ effects of Year 9 reports of school factors on aspirations It is very likely that you will go to university Tested individually Fixed Effects Coef SE OR Sig Emphasis on learning 1.52 0.38 4.59 *** Behaviour climate 1.01 0.19 2.74 *** School environment 0.81 0.26 2.24 ** Valuing pupils 0.46 0.23 1.59 * School/learning resources 1.6 0.43 4.93 *** Teacher behavioural management 1.3 0.38 3.67 *** Teacher support 0.52 0.21 1.68 *
The relationships between general academic self-concept, aspirations and A-level results
Table A.12: Significant ‘net’ effects of different predictors on the likelihood of taking 3 or more A-levels
Taking 3 or more A-levels
Coef.
Std. Error
Odds Ratios Sig
Age 0.01 0.02 1.01 Girls 0.29 0.14 1.34 *
Ethnic group (compared to White UK) White European Heritage 0.56 0.4 1.75
Black Caribbean Heritage 1.17 0.41 3.23 **
Black African Heritage 1.24 0.53 3.45 *
Any Other Ethnic Minority -0.08 0.52 0.92 Indian 1.49 0.45 4.44 ***
Pakistani -0.09 0.43 0.91 Bangladeshi 2.5 0.77 12.21 **
Mixed Race 0.76 0.3 2.13 *
Early behavioural problems (compared to none) 1+ Behavioural problem -0.75 0.23 0.47 **
Early health problem (compared to none) 1+ Health problem -0.36 0.16 0.7 *
KS1 family salary (compared to no salary) £2500-15000 0.47 0.26 1.61
£17500-27500 0.78 0.26 2.18 **
£30000-35000 1.06 0.28 2.87 ***
£37500-66000 0.97 0.27 2.64 ***

32
£67500-132000 1.64 0.4 5.16 ***
Missing 0.59 0.3 1.81 * Parents' highest SES at age 3/5 (compared to professional, non-manual)
Other professional non-manual 0.07 0.28 1.07 Skilled non-manual -0.3 0.3 0.74 Skilled manual -0.66 0.36 0.52 Semi-skilled -0.48 0.38 0.62 Unskilled -1.26 0.85 0.28 Never worked 0.36 0.57 1.44 Missing -1.93 1.78 0.15 Mother's highest qualifications level at age 3/5
(compared to none) Vocational 0.01 0.28 1.01
Academic age 16 0.37 0.24 1.44 Academic age 18 0.54 0.31 1.72 Degree or higher degree 0.75 0.31 2.11 *
Other professional 1.03 0.53 2.8 *
Missing -0.71 0.81 0.49 Father's highest qualifications level at age 3/5
(compared to none) Vocational 0.34 0.28 1.41
Academic age 16 0.33 0.25 1.4 Academic age 18 0.65 0.32 1.91 *
Degree or higher degree 1.01 0.32 2.76 **
Other professional -0.72 0.71 0.49 Absent father 0.27 0.26 1.31 Missing 1.73 1.62 5.63 Early years HLE (compared to 0-13)
14-19 -0.06 0.28 0.94 20-24 -0.07 0.29 0.94 25-32 -0.14 0.28 0.87 >33 0.36 0.32 1.43 KS1 HLE outing (compared to low)
KS1 HLE outing medium 0.43 0.18 1.53 *
KS1 HLE outing high 0.47 0.26 1.61 KS2 HLE individual activities (compared to low)
KS2 HLE individual activities medium 0.23 0.16 1.26 KS2 HLE individual activities high 0.27 0.24 1.31 KS3 HLE support (compared to low)
KS3 HLE support medium 0.15 0.16 1.16 KS3 HLE support high -0.19 0.21 0.83 KS3 HLE enrichment (compared to low)
KS3 HLE enrichment medium 0.72 0.16 2.06 ***

33
KS3 HLE enrichment high 1.37 0.19 3.92 ***
FSM school level (continuous) -0.02 0.01 0.98 **
% White British (continuous) -0.01 0 0.99 Year 9 - It is very important to you to get a
university degree? 0.65 0.14 1.91 ***
Intercept -3.62 0.54
***
Number of students 1541 Deviance (-2 x Log Restricted-Likelihood) 1456 * p<0.05, ** p<0.01, *** p<0.001
Table A.13: Significant ‘net’ effects of different predictors on the likelihood of taking 3 or more A-levels
Taking 3 or more A-levels
Coef.
Std. Error
Odds Ratios Sig
Girls 0.35 0.12 1.41 **
Ethnic group (compared to White UK) White European Heritage 0.63 0.38 1.89
Black Caribbean Heritage 1.00 0.30 2.72 ***
Black African Heritage 0.92 0.47 2.51 Any Other Ethnic Minority 0.40 0.44 1.49 Indian 1.43 0.37 4.17 ***
Pakistani 0.56 0.32 1.75 Bangladeshi 2.06 0.60 7.86 ***
Mixed Race 0.94 0.28 2.56 ***
Early behavioural problems (compared to none) 1+ Behavioural problem -0.43 0.21 0.65 *
Early health problem (compared to none) 1+ Health problem -0.39 0.15 0.67 **
KS1 family salary (compared to no salary) £2500-15000 0.30 0.23 1.35
£17500-27500 0.50 0.24 1.65 *
£30000-35000 0.79 0.26 2.20 **
£37500-66000 0.64 0.24 1.90 **
£67500-132000 1.63 0.39 5.08 ***
Missing 0.55 0.25 1.73 *
Mother's highest qualifications level at age 3/5 (compared to none) Vocational -0.03 0.24 0.97
Academic age 16 0.23 0.21 1.26 Academic age 18 0.85 0.27 2.35 **
Degree or higher degree 0.76 0.27 2.13 **
Other professional 0.63 0.46 1.88 Missing -0.61 0.65 0.54 Father's highest qualifications level at age 3/5 (compared to none)
Vocational 0.31 0.26 1.36
34
Academic age 16 0.04 0.23 1.04 Academic age 18 0.63 0.29 1.88 *
Degree or higher degree 0.92 0.27 2.50 ***
Other professional -0.33 0.60 0.72 Absent father 0.17 0.23 1.19 Missing 0.03 0.80 1.04 KS1 HLE outing (compared to low)
KS1 HLE outing medium 0.34 0.17 1.40 *
KS1 HLE outing high 0.56 0.25 1.75 *
KS3 HLE enrichment (compared to low) KS3 HLE enrichment medium 0.45 0.14 1.56 ***
KS3 HLE enrichment high 1.16 0.18 3.20 ***
FSM school level (continuous) -0.01 0.01 0.99 ** Achieved 5 or more GCSE and equivalents at grades A*-C including GCSE English and maths 3.04 0.21 20.87 ***
Intercept -5.2 0.35
***
Number of students 2339 Deviance (-2 x Log Restricted-Likelihood) 1712 * p<0.05, ** p<0.01, *** p<0.001
Table A.14: Significant ‘net’ effects of different predictors on the likelihood of taking 3 or more A-levels
Taking 3 or more A-levels
Coef. Std.
Error Odds
Ratios Sig
Gender 0.05 0.26 1.05 Ethnic group (compared to White UK)
White European Heritage 0.94 0.65 2.57 Black Caribbean Heritage 1.34 0.56 3.84 *
Black African Heritage 1.15 0.75 3.16 Any Other Ethnic Minority 0.61 0.63 1.84 Indian 0.89 0.6 2.43 Pakistani -0.07 0.4 0.94 Bangladeshi 1.72 0.79 5.6 *
Mixed Race 1.61 0.52 4.98 **
Early behavioural problems (compared to none) 1+ Behavioural problem -1.6 0.56 0.2 **
Early health problem (compared to none) 1+ Health problem -0.11 0.28 0.9
KS3 HLE enrichment (compared to low) KS3 HLE enrichment medium 0.69 0.28 1.98 *
KS3 HLE enrichment high 1.19 0.36 3.29 *** Disadvantaged and very high likelihood of going to university (compared to disadvantaged with lower likelihood of going to university) 0.64 0.27 1.9 *

35
Year 11 General academic self-concept 0.67 0.22 1.96 ** Achieved 5 or more GCSE and equivalents at grades A*-C including GCSE English and maths 2.99 0.42 19.82 ***
Intercept -4.5 0.49
***
Number of students 625 Deviance (-2 x Log Restricted-Likelihood) 420 * p<0.05, ** p<0.01, *** p<0.001