Embed Size (px)
Citation preview

2018 First Quarter
Corporate InsightsBehind the numbers:Mastering M&A

Credit Suisse Corporate Insights2

Credit Suisse Corporate Insights 3
Introduction
We are nearly a decade into an economic recovery in the wake of the 2008 financial crisis and its aftermath. In typical economic recoveries, a rising stock market and equity values are accompanied by increasing strategic activity among corporates, as rising equity values boost executive confidence in deal-making and enhanced profitability and rising stock prices provide ample firepower to pay for those deals. However, we have recently seen that deal activity in the U.S. does not seem to be rising in tandem with equity markets, as it has previously. The graph below1 shows us the breaking of that trend, causing one market observer to dub this “M&A MIA”2
We find this decline in M&A activity puzzling, since growth strategies driven by M&A have consistently outperformed the broader market during the latest recovery. Exhibit 2 revisits an analysis we did at the end of 2016, and shows that those
companies that have turbocharged their growth strategies via M&A, in particular since 2012, have consistently outperformed the market and their peers on a TSR basis … and continue to do so.3
Exhibit 1: M&A deal volume vs. S&P500
12 month rolling average deal volume (left-axis)S&P 500 Index (right-axis)
0
500
1,000
1,500
2,000
2,500
3,000
0
50
100
150
200
250
300
USD ($ in billions) Index
1982 1984 1986 1988 1990 1992 1994 1996 1998 2000 2002 2004 2006 2008 2010 2012 2014 2016 2018
The market index and M&A deal volume has recently lost its correlation

Credit Suisse Corporate Insights4
So what is going on?
A recent survey of more than 500 C-level executives reveals that a surprising confidence gap may be responsible for the absence of a strong recovery in M&A activity.4 What lies behind this confidence gap? Executives cited a number of things, including the increasing attraction of joint ventures, as well as continuing uncertainty around key economic and geopolitical issues, such as U.S. tax and trade policy and the consequences of Brexit.
It may also be that this confidence gap is further exacerbated by a pervasive – but, we believe, mistaken – belief that “most M&A deals destroy value”.5
In this paper, the ninth in our ongoing series of Credit Suisse Corporate Insights, we revisit M&A and – in particular – the usefulness of some simplistic M&A mathematical shortcuts. First, is there any truth to the notion that “most M&A deals destroy value”? Second, does conventional M&A math provide the right signals about the viability of doing a deal and taking advantage of M&A’s demonstrated ability to drive and sustain shareholder value? To answer this second question, we will look at several accounting-centric ways in which M&A is typically assessed – the math around EPS accretion/dilution, the size of any premium paid, and whether goodwill and intangibles adversely impact the market’s view of operating performance. We believe that each of these ideas needs fresh thinking and – upon revisiting each in turn – we will show that M&A remains a vital and value-creating means of growing businesses, providing platforms for new products, markets and ideas.
Exhibit 2: Total shareholder return for aggregates: Acquirers vs. non-acquirers
AcquirersNon-acquirers
80
90
100
110
120
130
140
150
2011 2012 2013 2014 2015 2016 2017 Today
+36% +47%
+54%+29%
+47%
137
94

Credit Suisse Corporate Insights 5
TSR: 40 days before announcement to 40 days after announcement, relative to MSCI World Index
Value creation in M&A
The inherent purpose of M&A is to create efficiencies that have a positive impact on the overall economy. The combination of two entities is meant to create a more competitively-advantaged firm with increased market power to which investors may justifiably ascribe a premium valuation multiple. Synergies and efficiencies create a “value pool” which is allocated between both the acquirer and the target. Thus, net of how M&A impacts the buyer and seller separately, M&A is a value-creating event when taken as whole.
Short-term performance of buyers and sellers around the announcement
Sellers almost always demonstrably create value in the course of the sale. From the perspective of the seller, it is a singular,
one-time event, and the price paid is easily compared to the market price (at least for publicly-traded companies). In most circumstances, if the owners were not getting a premium or other value out of the deal, they would not sell.
M&A from the point of view of a buyer is more nuanced and is thus where most of the debate arises. The acquirer not only pays a premium, but also carries execution risk. The short-term value created for the acquirer (and its shareholders) is best measured by the market’s collective reaction around the announcement of a deal. In Exhibit 3 we examined an 80-day TSR, comparing all public-to-public transactions6 of the acquiring and selling companies to the performance of the MSCI World Index, from 40 days pre-announcement to 40 days after announcement.
Exhibit 3: 80 day total shareholder return performance around deal announcement since 1981
Targets Acquirers
0
20
40
60
80
100
120
140
Pre-announcementTSR (Indexed at 100)
Change in TSR Post-announcementTSR
100
+30
130On average, targets’ stock prices rise ~30%...
0
20
40
60
80
100
120
140
Pre-announcementTSR (Indexed at 100)
Change in TSR Post-announcementTSR
100
+4104
..and acquirers’ stock prices are up ~4% over the same period

Credit Suisse Corporate Insights6
While M&A is a value-creating event in the short-term, the objective for an acquirer in a transaction is to improve its long-term share price performance. The pitfalls of how to communicate the strategic logic of an acquisition, how to think about EPS, what do premia and goodwill do to the market’s sense of the deal … these are all the challenges faced by acquirers. And it is from that particular perspective – the point of view of an acquirer – that we address the bulk of this paper.
Long-term value creation from the perspective of the acquirer
The simplicity of an M&A analysis from the seller’s point of view is mirrored by the more complex analysis of a buyer’s point of view. From the buyer’s point of view, each deal can be quite challenging to measure value creation or destruction.
The ideal analysis would compare the total shareholder return (TSR) of the acquirer post any acquisition to the TSR of the acquirer had the deal not occurred. Unfortunately, the latter is not observable, so we are left with comparing the TSR of the acquirer to a large basket of other companies … our assumption being that if the market favors a deal, the TSR is better than market performance overall.
In this study, we evaluated approximately 110,000 public M&A transactions since 1981 (publicly-traded acquirers). From that universe, we then filtered for acquirers from the U.S., Canada, and Western Europe with an enterprise value of at least $200mm. Of the approximately 6,000 deals remaining, we measured the long-term TSR of the acquirers relative to the MSCI World Index which is illustrated in Exhibit 4.7
Exhibit 4: Long-term total shareholder return after deal vs. frequency since 1981
Instances
TSR: 4 months before announcement to 3 years after closing, relative to MSCI World Index
Average TSR for acquirers across all deals
Long-term total shareholder return
0
50
100
150
200
250
300
350
400
(90%) (70%) (50%) (30%) (10%) 10% 30% 50% 70% 90% 110% 130% 150% 170% 190% 210% 230% 250%
Average long-term TSR of acquirers8.7%

Credit Suisse Corporate Insights 7
8.7%
This graph shows us that the average TSR performance for acquirers since 1981 is actually quite positive, with acquirers earning an average TSR in excess of the market of 8.7%. So, over a nearly four-decade time frame, on average, the expected value of M&A for an acquirer is positive. Another key takeaway from Exhibit 4 is that the right side of the curve reveals a large number of successful acquirers that are able to double or even triple returns to shareholders in excess of the market within the first three years of a deal closing. Thus, successful acquisitions can yield outsized returns and, as the risk-taker in a transaction, the acquirer reaps these benefits.
Acquirers are indeed getting better and better at M&A over time, leading to continually higher expected value creation. This improvement is likely a result of several things. Buyers today have more and better information at their disposal to analyze targets, their products and their markets than ever before. There are now widely accessible financial databases, deep and dynamic company websites, and the ability to gather, synthesize and analyze large amounts of data quickly throughout the due diligence process. And companies that have done well through M&A over the past decades have learned how to do it well – and have institutionalized this thinking, to ensure that their next deal is even better.
To that very point, studies by the City University of London’s M&A Research Center have found that the most successful acquirers were those that had developed a standardized approach to target identification and a focused methodology
But it is worth repeating that the data in this graph includes all deals over the entirety of the past three and a half decades. Quite a lot has changed in that time: computing power has vastly increased, a great deal more information transparency, corporate finance and thinking about corporate operating performance has evolved. So is it possible that, since 1981, the expected outcome for acquirers has improved? The data responds with a resounding “yes.” From the same data, we isolated acquirer performance by decades to observe how the payoffs from M&A have evolved over time (Exhibit 5).
to reducing post-merger integration costs throughout the due diligence process. This skill, honed through repetition, ensures that serial acquirers outperform less acquisitive firms, and that these serial acquirers become more efficient at discovering and valuing M&A targets.8 Practice makes perfect.
Acquirers now have the opportunity to identify, execute, and integrate deals with a higher expected value of success than at any point since 1981. But since the bar is rising, there is also more responsibility on the acquirer to do appropriate and exhaustive operational and strategic due diligence. Acquirers must filter and interpret the right value drivers and metrics in order to benefit from these opportunities to create value through M&A.
Getting the strategic logic of a deal right is vital … but let’s not allow bad M&A math to derail the opportunity.
Exhibit 5: Long-term total shareholder return of acquirer by time period
Average long-term TSR for acquirers: Based on time period since 1981
TSR: 4 months before announcement to 3 years after closing, relative to MSCI World Index
Average long-term TSR for acquirers: Overall since 1981
On average, acquirers have improved post-deal performance over time and are creating significant excess returns today
(5%)
0%
5%
10%
15%
1980s
(3.5%)
1990s
6.3%
2000s
11.8%

Credit Suisse Corporate Insights8
Making M&A math work for your deals
The recent outperformance of acquisitive companies in the market isn’t just a contemporary idea, but rather part of a longer-term trend of M&A being more and more successful in the collective mind of the market. But – returning to a question we posed at the beginning of this paper – why are we not seeing as big of an upswing in M&A activity in the current market as we should expect?
There is clearly a lot of positive momentum behind M&A-driven growth strategies in the past decade or more. Furthermore, the average value accruing to acquirers continues to increase. But
not every deal is inherently value-creating. Each company must still find the right acquisitive fit for its strategy, articulate that and navigate the “price vs. value equation” of a transaction.9
This cardinal rule aside, conventional accounting-centric M&A math may undermine an otherwise good strategic idea. We have looked at three key areas that management teams are traditionally focused on in the context of an acquisition: (i) the impact of EPS accretion/dilution, (ii) the accumulation of goodwill and intangibles to the acquirer’s balance sheet and (iii) the premium the acquirer will be required to pay.

Credit Suisse Corporate Insights 9
I. EPS
EPS analysis has conventionally been used as a shortcut to evaluate deals. The extent to which earnings per share (EPS) are enhanced (accretion) or diluted by virtue of an M&A deal serves as one of the first signals investors and management tend to focus on. Although EPS analysis acts as a proxy for comparative cash flows, it cannot be relied on in isolation of other considerations.
One limitation of EPS analysis is that it does not always fully capture the initial cash expenditure of the acquisition that shows up on the cash flow statement. In addition, an acquirer’s EPS will
There is very little correlation between whether a deal is EPS accretive or dilutive and the short-term market reaction to news of it on the data set as a whole. There are a substantial number of EPS dilutive deals that see acquirers’ stock prices outperform and conversely there are a substantial number of EPS accretive deals that see acquirers’ stock prices underperform.
almost always increase when purchasing a profitable company in an all-cash deal, but that result does not tell us anything about whether the acquirer paid the right price for that asset nor – for that matter – how the market will respond to news of the deal.
Exhibit 6 evaluates different levels of EPS accretion and dilution versus the observed short-term market reaction to those deals.10 The graph shows us that EPS accretion/dilution may be relevant to the market reaction around a deal announcement, but not a conclusive tool for management teams to rely on in order to predict how the market is going to move.
However, we do see a general theme that EPS accretive deals outperform the market twice as often as they underperform, and the opposite is true of dilutive deals. Also, EPS accretive deals earn about a 9% higher TSR than their EPS dilutive counterparts. On balance, EPS accretive deals appear to be somewhat more preferred by the market but – as noted above – it is not a definitive metric.
Exhibit 6: EPS accretion / dilution vs. short-term total shareholder return (90 days before announcement to 90 days after closing, relative to MSCI World Index)
In the short-term, investors tend to slightly favor EPS accretive deals as shown by higher density in the top right quadrant
What % of accretive and dilutive deals have positive and negative TSR in the short-term?
(100%)
(60%)
(20%)
20%
60%
100%
(50%) (30%) (10%) 10% 30% 50%
R2: 1.3%Average TSR:26.4%
Average TSR:34.7%
Average TSR:(25.7%)
Average TSR:(17.0%)
Sho
rt-t
erm
tota
l sha
reho
lder
ret
urn
Change in EPS
0%
20%
40%
60%
80%
100%
Expected EPSdilutive deals
Expected EPSaccretive deals
65.6%
33.2%
34.4%
66.8%
Positive TSR dealsNegative TSR deals

Credit Suisse Corporate Insights10
How does EPS impact longer-term market performance of M&A? If it really were true that EPS accretion/dilution were the primary driver of long-term TSR then we would expect an overwhelming aggregation of points in the bottom left and top right quadrants when we switch the focus from short-term TSR to long-term TSR in Exhibit 7. But looking at this data for
This analysis suggests that, even if an announcement of EPS accretion is well-received by the market in the short-term, that is no guarantee for the market’s assessment of the longer-term success of that deal. EPS accretion/dilution analysis may be a helpful shorthand approach up front; it does not guarantee deal
longer-term11 share price performance against the same EPS accretion/dilution universe, we see a visibly greater vertical dispersion. Nearly 27% of dilutive deals, and nearly 37% of accretive deals, moved from negative TSR in the short-term to positive TSR in the long-term. Similar movements occurred from positive in the short-term to negative in the long-term.
success or failure in the long run. Management should consider the EPS implications of a deal – but a company’s ability to articulate a strategy and to execute on a long-term vision plays a vital role in a deal’s success. EPS analysis is thus useful – but not determinative.
Exhibit 7: EPS accretion / dilution vs. long-term total shareholder return
As time progresses, EPS accretion or dilution does not solely dictate the long-term success of a deal
TSR: 4 months before announcement to 3 years after closing, relative to MSCI World Index
% of companies with negative TSR in the short-term that moved to positive in the long-term
(100%)
(60%)
(20%)
20%
60%
100%
(50%) (30%) (10%) 10% 30% 50%
R2: 0.1%Average TSR:59.8%
Average TSR:75.2%
Average TSR:(45.2%)
Average TSR:(41.6%)
Sho
rt-t
erm
tota
l sha
reho
lder
ret
urn
Change in EPS
0%
10%
20%
30%
40%
50%
Percent movers indilutive deals
Percent movers inaccretive deals
26.7%
36.7%
Dilutive Accretive
Credit Suisse Corporate Insights 11
II. Goodwill and intangibles
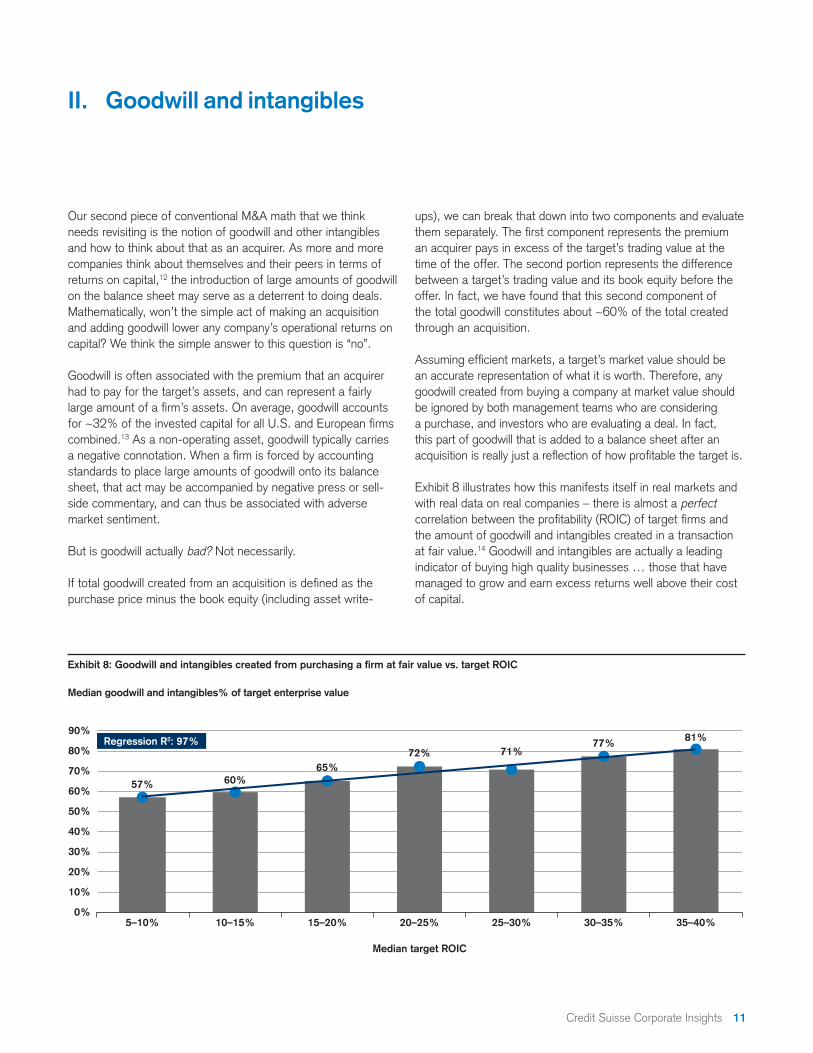
Our second piece of conventional M&A math that we think needs revisiting is the notion of goodwill and other intangibles and how to think about that as an acquirer. As more and more companies think about themselves and their peers in terms of returns on capital,12 the introduction of large amounts of goodwill on the balance sheet may serve as a deterrent to doing deals. Mathematically, won’t the simple act of making an acquisition and adding goodwill lower any company’s operational returns on capital? We think the simple answer to this question is “no”.
Goodwill is often associated with the premium that an acquirer had to pay for the target’s assets, and can represent a fairly large amount of a firm’s assets. On average, goodwill accounts for ~32% of the invested capital for all U.S. and European firms combined.13 As a non-operating asset, goodwill typically carries a negative connotation. When a firm is forced by accounting standards to place large amounts of goodwill onto its balance sheet, that act may be accompanied by negative press or sell-side commentary, and can thus be associated with adverse market sentiment.
But is goodwill actually bad? Not necessarily.
If total goodwill created from an acquisition is defined as the purchase price minus the book equity (including asset write-
ups), we can break that down into two components and evaluate them separately. The first component represents the premium an acquirer pays in excess of the target’s trading value at the time of the offer. The second portion represents the difference between a target’s trading value and its book equity before the offer. In fact, we have found that this second component of the total goodwill constitutes about ~60% of the total created through an acquisition.
Assuming efficient markets, a target’s market value should be an accurate representation of what it is worth. Therefore, any goodwill created from buying a company at market value should be ignored by both management teams who are considering a purchase, and investors who are evaluating a deal. In fact, this part of goodwill that is added to a balance sheet after an acquisition is really just a reflection of how profitable the target is.
Exhibit 8 illustrates how this manifests itself in real markets and with real data on real companies – there is almost a perfect correlation between the profitability (ROIC) of target firms and the amount of goodwill and intangibles created in a transaction at fair value.14 Goodwill and intangibles are actually a leading indicator of buying high quality businesses … those that have managed to grow and earn excess returns well above their cost of capital.
Exhibit 8: Goodwill and intangibles created from purchasing a firm at fair value vs. target ROIC
Median goodwill and intangibles% of target enterprise value
10%
20%
30%
40%
50%
60%
70%
80%
90%
0%5–10% 10–15% 15–20% 20–25%
Median target ROIC
25–30% 30–35% 35–40%
57% 60%65%
72% 71%77% 81%Regression R2: 97%

Credit Suisse Corporate Insights12
Because this goodwill reflects the operating prowess of the business, we believe that it should produce little to no reaction by the market. Exhibit 9 verifies this idea that markets largely ignore the amount of this type of goodwill created, as we see no TSR
Now that we have identified the larger portion of goodwill, we shift gears to the remaining goodwill that is generated in an
correlation: larger levels of goodwill have no positive or negative impact on either the average or median TSR of an acquirer’s post-deal announcement. It is simply ignored by the market.
acquisition: the amount attributed to the premium.
Exhibit 9: Goodwill created from purchasing a firm at fair value vs. total shareholder returns
Long-term total shareholder returns
TSR: 4 months before announcement to 3 years after closing, relative to MSCI World Index
Average short-term TSR
Median short-term TSR
(100%)
(75%)
(50%)
(25%)
0%
25%
50%
75%
100%
125%
150%
0% 20% 40%
Goodwill % of enterprise value
60% 80% 100%
Regression R2: 0.3%
0%
2%
4%
6%
< 50% goodwill > 50% goodwill
4.2%
5.5%
0%
2%
4%
6%
< 50% goodwill
(0.0%) 0.1%
> 50% goodwill

Credit Suisse Corporate Insights 13
III. Premia paid
The third and final piece of conventional M&A math that we wrestle with is the premium paid for an acquired public company. In most M&A transactions, the acquirer has to pay a premium – a value on top of the market price of the stock – in order to convince the board to recommend a sale to its shareholders. The premia paid can be small or substantial, change over time,15 and vary with leverage and payment consideration.
Although premia have been trending down since the economic upswing of 2010,16 the amount of required premia on top of robust trading multiples today does give many companies pause … can I justifiably pay a control premium on top of a fully-valued company? Won’t the market punish me for doing so? We think the answer to this question may be surprising. Conventional thinking could lead you to believe that paying lower premia, and setting upper limits on the premia paid to market valuations is the prudent approach in evaluating M&A. As an extension
of this logic, companies that overpay for acquisitions should underperform, right?
In reality, the market seems quite relaxed about premia. From a short-term perspective, we have seen that the old M&A arbitrage trade has disappeared in the past few years as the average short-term share price reaction for acquirers around the announcement of a deal has meaningfully increased.17
What about share price performance over a longer period, and the reactions to long-term value creation after a deal? The graphs in Exhibit 10 show the relationship between the premium acquirers pay and long-term value creation. The scatter plot on the left side of Exhibit 10 establishes that there is virtually no correlation between premia and long-term TSR.
Exhibit 10: Long-term total shareholder return vs. premium paid
Long-term total shareholder return
TSR: 4 months before announcement to 3 years after closing, relative to MSCI World Index
Long-term total shareholder return
(100%)
(50%)
0%
50%
100%
150%
200%
0% 20% 40% 60% 80% 100%
Premium paid
Regression R2: 0.1%
Premium paid
High premiaLow premia
71%Average TSR
49%
% left side % right side
0%TSR
30% premium
50%
51% 50%
73%Average TSR
(39%)Average TSR
(42%)Average TSR
Out
perf
orm
ers
Und
erpe
rfor
mer
s

Credit Suisse Corporate Insights14
Even though there is no correlation between premia and long-term TSR, make no mistake, premia do matter; they do impact long-term TSR performance. However, the premium alone does not determine the success of a deal, as other factors such as operational performance and target selection also play important roles. Let’s look at the market response to deals at a variety of
premia paid in more detail. In Exhibit 11, we bucket each public-to-public deal since 2000 in our dataset by the premium paid in increments of 10%, and show the trading multiple of the targets, post-deal EBITDA growth for acquirers, as well as the average TSR across each bucket of premium paid.
Exhibit 11: Premium analysis – Does the level of premium paid drive performance post-deal?
Target trading multiple pre-deal (EV / EBITDA)Long-term Acquirer TSR post-deal (left y-axis)Acquirer EBITDA growth post-deal (right y-axis)
29.4%
20.5%
3.4%
9.2%
15.6% 17.5% 15.1%
3.8%
(10.8%)
(10%)
(5%)
0%
5%
10%
15%
20%
(20%)
(10%)
0%
10%
20%
30%
40%
Highest average TSR Lowest average TSR
Premium paid buckets
0–10% 10–20% 20–30% 30–40% 40–50% 50–60% 60–70% 70–80% 80–90%
12.1x 10.8x 9.6x 9.1x 9.0x 9.0x 8.8x 7.5x 9.9x
Long
-ter
m T
SR EB
ITDA
growth
TSR performance tends to be high in scenarios where
the lowest premia were paid…
…despite acquiring high quality businesses that
earned the highest EBITDA growth for acquirers
post-deal, cases where very large premia were paid
(60%+) negatively offset the growth in EBITDA
…in the premium paid buckets where most deals occur, TSR performance actually improves as EBITDA growth for acquirers post-deal increases because EBITDA growth more than offsets the incrementally higher
premium; additionally, trading multiples tend to be lower for targets in the higher premium buckets…

Credit Suisse Corporate Insights 15
Apart from the extreme (premia above 80%), across all premium categories since 2000, the average long-term TSR is positive. The results of the acquirer’s TSR at the lowest premia make intuitive sense; the market clearly favors deals where an asset is acquired for little to no control premium. At the book ends of the exhibit – the highest and lowest premia – we see that there is also an intuitive relationship since the TSR performance declines as premia rise.
The most intriguing results, however, are in the 20–60% premia range where most of the transactions occur and TSR performance rises alongside with the premia paid. Since 2000, most deals have been done with premia in the 20–30% range and it is in this cohort where TSRs tick downwards to the positive single digits. One explanation for this is that since more deals occur in the 20–30% premium range, competition for assets is greatest and the increased demand nudges prices upward from where they might otherwise be. There may also be a threshold or hurdle price that a potential buyer must reach to bring the seller to the negotiating table. This control premium may not be fundamentally supported by expected synergies, and the market appears to acknowledge that.
As premia rise beyond 30%, relative TSR actually improves. The explanation for this relates back to one of our core concepts – value creation is driven by the ability to improve operating performance. M&A value for acquirers is often achieved through cost synergies and target firms acquired at higher premia may be assets that have recently underperformed operationally. Acquirers hunting in this space recognize that depressed valuations may not necessarily reflect long-term intrinsic value. Thus, buyers in this space can take advantage of potential turn-around opportunities and purchase a business with considerable upside.
Exhibit 12 proves this second explanation empirically. When comparing the targets in the 20–30% premium range to the targets in the 50–60% premium range, targets demanding a 50–60% premium generally have lower ROIC profiles and lower trading multiples pre-acquisition, indicating that these assets could be either in distress or strategic turn-around candidates. Also in Exhibit 12, the post-acquisition performance of acquirers appears to support that purchasing companies in the 50–60% range do better on both growth and margin expansion18 compared to those in the 20–30% range.
These numbers reaffirm our belief in the importance of the price vs. value equation, where the incentive to purchase should be based on the underlying strategic and operational value of the asset being acquired. The core takeaway here is that, by itself, the premium paid does not necessarily define or predict whether the market will favor a deal or not. Premia do matter,
but identifying the right target and executing the integration process will drive long-term share price outperformance. The key is finding the right asset, the right strategic fit, and making a compelling case for the acquisition, while not being encumbered by “traditional” thinking around M&A math. The price matters far more than the premium.
Exhibit 12: Comparing operating metrics between buckets of premium paid
Pre-announcement data Post-announcement performance
Target LFYROIC pre-deal
Target trading multiplepre-deal (EV / EBITDA)
14.0%
10.8%9.6x 9.0x
20–30% premium50–60% premium
Acquirer EBITDA growthpost-deal (T+3 / T+1)
Acquirer margin expansionpost-deal (T+3 / T+1)
3.9%
8.6%
+0.2x
+2.4x

Credit Suisse Corporate Insights16
Conclusion
M&A remains a strong catalyst to generate and retain a competitive advantage for some of the most successful firms across industries. When two corporates combine forces through M&A, they create a value pool through synergies, improved efficiencies, cross-institutional learning, and increased market power that contributes to the overall economy. Since 1981, the value proposition of M&A has continued to improve; so it is essential that firms seeking to create value recognize the importance of M&A in their strategies.
The ability to succeed in M&A hinges upon numerous factors. As information transparency has improved and companies benefit from experience, acquirers have enhanced their success rate and the opportunities continue to grow. Information transparency also carries with it the need to appropriately filter the information to identify the most relevant value drivers – and to appropriately interpret some of the conventional shorthand approaches to evaluating M&A.
In this paper, we show that current market conditions remain very supportive and rewarding of M&A. The somewhat lower pace of M&A activity in the market led us to wonder why – and to revisit a number of themes that have repeatedly raised their heads in conversations we have with our corporate clients.
We looked at three critical analyses in EPS, goodwill and premia to show how each relates to value creation in M&A:
• EPS accretion/dilution is useful in managing investor expectations, but long-term success in M&A may be independent of EPS implications.
• Goodwill and intangibles are largely a function of how profitable the target business is, and has no correlation to deal success or failure in the market’s mind.
• Premia are one important element of value creation in any transaction but do not solely drive the success of a deal, suggesting the importance of astute target selection and the ability to achieve operational improvement post-deal.
There is no magic formula for M&A success. Each deal is unique. However, our work suggests that our corporate clients should not have too narrow a focus on conventional metrics to evaluate deals. Short-hand metrics of EPS accretion/dilution, goodwill and premia paid are helpful, but not determinative of M&A success. Rather, we believe that our corporate clients should evaluate deals with fresh thinking and with firm notions of the strategic context and rationale of a given transaction. That is the path to strategic success.

Credit Suisse Corporate Insights 17
End notes
1 Source: Datastream, Credit Suisse IDC – December 13, 2017.2 Source: Authers, John. “Authers’ Note: M&A MIA”, Financial Times, December 19, 2017.3 ThisfigurehasbeenadoptedandupdatedfromourpreviousCredit Suisse Corporate Insightsseries“Tyingtheknot:M&Aasapathtovalue
creation”.UniverseconsistsofcompaniesintheU.S.,Canada,andDevelopedEuropeacrossallsectorswithmarketcapitalizationgreaterthan$200mm(3,462companies).AcquirersaredefinedasthecompanieswithcumulativeM&Aspendasapercentageofcumulativecashflowbetween2011and2017inthetop25%ofuniverse,andnon-acquirersaredefinedascompaniesinthebottom25%ofM&Aspendasapercentageofcumulativecashflow.SourcedfromCreditSuisse’sHOLTframeworkandglobaldatabase.
4 SourcedfromEY’s“GlobalCapitalConfidenceBarometer:HowcanM&Adealwithtoday’sdemandswhileactivatingyourdigitaltomorrow?”October2017,17thedition.ey.com/ccb.
5 Source:Lewis,Alan,andDanMcKone.“SoManyM&ADealsFailBecauseCompaniesOverlookThisSimpleStrategy.”HarvardBusinessReview,Mergers&Acquisitions,May10th,2016.Thisstudy,alongwithvariousothersinthefinanceindustry,mentionvaluedestructionduetoM&Atransactions.ManyofthesestudieshavewidevariationsinmethodologyandlackaconsensusviewofhowtomeasurevaluecreationinM&A.
6 Cumulativeaverageabnormalreturns(CAARs)arecalculatedasthe80dayweightedaveragereturncentralizedaroundtheannouncementdate (T–40daystoT+40days),andconsistsofonlythepublic-to-publicwhole-companytransactionssince1981withintheentiredatasetof5,613transactionsfromtheU.S.,Canada,andDevelopedEurope.SourcedfromThomsonReutersDatastream®viaCassBusinessSchool’sM&AResearchCenter(MARC).MARChasfoundinpreviousresearchthat40daysbefore&aftertheannouncementofadealreasonablyincorporatesnear-terminvestorreactionunbiasedofpotentialrumorsrelatedtoatransaction.
7 ThedatasetconsistsoftransactionsfromcompanieswithintheU.S.,Canada,andDevelopedEurope.Thecompanymusthaveatleast$200mminenterprisevalueandthedealvaluemustaccountforatleast10%oftheacquirer’senterprisevalue.Thedataincludesalldealswiththesethresholdswithreputabledatadatingbackto1981(5,613transactionsamong3,475companies).Long-termTSRiscalculatedasthechangeinshareholderreturnfrom4monthsbeforetheannouncementofadealto3yearsafterthedealclosing.AllTSRdatainthisstudyisshownrelativetotheMSCIWorldIndex,indicatingreturnsinexcessofthemarket.SourcedfromFactSetandThomsonReutersDatastream®viaCassBusinessSchool’sM&AResearchCenter(MARC).
8 SourcedfromCassBusinessSchool’sM&AResearchCenter(MARC).Thearticlesreferenced,“SuccessfulDealmaking”,and“Dealclosureisthestartingpointnottheendpoint”arederivedfromMARC’sWorkingPaperSeriesfromJanuary2014andFebruary2016,respectively.
9 Toavoidvaluedestruction,thepricepaidforanassetshouldnotexceedthevalueofthatassettoitsnewowner–ortheperceptionofthatvaluebythemarket.
10 EPSaccretion/dilutionisdefinedastherelativechangeinFY2EPSforecastsandiscalculatedas(90daysafterthedealclose/90daysbeforethedealclose).Short-termTSRiscalculatedasthechangeinshareholderreturnfrom90dayspriortothedealannouncementto90daysafterthedealclosing.AllTSRdatainthisstudyisshownrelativetotheMSCIWorldIndex,indicatingreturnsinexcessofthemarket.SourcedfromFactSetconsensus estimates.
11 Pleaserefertoendnote7.12 Source:Mauboussin,MichaelJandCallahan,Dan.“CalculatingReturnoninvestedCapital:HowtodetermineROICandAddressCommon
Issues”.CreditSuisse.GlobalFinancialStrategies.June2014.13 UniverseconsistsofcompaniesintheU.S.,Canada,andDevelopedEuropeacrossallsectorswithmarketcapgreaterthan$200mm(3,462
companies).Goodwillisdefinedasgoodwillandnon-operatingintangibles.Investedcapitalincludesworkingcapital,inflation-adjustedgrossplant,capitalizedR&D,capitalizedoperatingleases,andgoodwillandnon-operatingintangibles.SourcedfromCreditSuisse’sHOLTframeworkandglobaldatabase.
14 ROICiscalculatedas[(Post-taxEBIT+D&A)/(Totalassets+accumulateddepreciation–non-interestbearingcurrentliabilities–goodwillandintangibles)].Goodwillfrompurchaseatfairvalueiscalculatedastargetenterprisevaluelessthetargetbookequity.SourcedfromThomsonReutersDatastream®viaCassBusinessSchool’sM&AResearchCenter(MARC).
15 Premiaaredefinedas[offerprice/targetstockpricefourweekspriortodealannouncement].Stockpriceistakenfoursweekpriortotheannouncementtoavoidbiasandfocusonunaffectedmarketprices.Therearealternativemethodsofassessingpremia,includingthestockprice 1day,5daysand16dayspriortoannouncementdate.Ourapproachisacademicallyaccepted,asderivedfromCassBusinessSchoolstudiessuchas“TheEconomicImpactofM&A:ImplicationsforUKfirms”.Premiawereobservedovertimeandcalculatedastheannualrollingaveragepremiumforeachdealinthegivenyearsinceyear2000.SourcedfromThomsonReutersDatastream®viaCassBusinessSchool’sM&AResearchCenter(MARC).
16 Premiawereatapeakin2000buthavebeentrendingdowninrecentyearsasthepremiumpaidonequitytendstobecountercyclicalinrelationtomarketpeaksandtroughs.ThereisastrongcorrelationbetweenthepeaksofhighpremiaandrecessionaryperiodsinNorthAmericaandEurope.
17 In2015and2016acquirershaveseentheirsharepriceappreciatebynearly4%onaverageimmediatelyfollowingadealannouncementversusthe~1%pricebumptheyexperiencedonaverageduringthedecadeprior.SourcedfromCreditSuisse’sHOLTframeworkandglobaldatabase.
18 EBITDAgrowthandEBITDAmarginexpansionaredefinedas(T+3/T+1)performancepost-dealforacquirers.SourcedfromThomsonReutersDatastream®viaCassBusinessSchool’sM&AResearchCenter(MARC).

Credit Suisse Corporate Insights18
Authors from Credit Suisse Investment Banking and Capital Markets
Rick Faery, Managing DirectorEli Muis, DirectorAndy Canovali, AssociateAustin Rutherford, AnalystMarc Franco, Analyst
Co-Authors from the Cass Business School, City, University of London
Professor Scott Moeller, Director of M&A Research Center (MARC) and Professor in the Practice of FinanceDr. Valeriya Vitkova, Research Fellow, M&A Research Center (MARC)Jiayi Tang, Research Assistant, M&A Research Center (MARC)Nhu Doan, Research Assistant, M&A Research Center (MARC)
With thanks for their time, contributions and valuable insights
Chris Morck, Vice President, HOLT Equities, Credit Suisse Global MarketsAlex Ciejka, Associate, Credit Suisse Investment Banking and Capital Markets
About Investment Banking and Capital Markets
Credit Suisse Investment Banking and Capital Markets is a division of Credit Suisse, one of the world’s leading financial services providers. We offer a broad range of investment banking services to corporations, financial institutions, financial sponsors and ultra-high-net-worth individuals and sovereign clients. Our range of products and services includes advisory services related to mergers and acquisitions, divestitures, takeover defense mandates, business restructurings and spin-offs. The division also engages in debt and equity underwriting of public securities offerings and private placements.
Authors and acknowledgements

Credit Suisse Corporate Insights 19
Credit Suisse Corporate Insights
Our Credit Suisse Corporate Insights series provides our perspective on the key and critical corporate decision points many of you face, regarding corporate strategy, market valuation, debt and equity financing, capital deployment and M&A. For more information, please visit: credit-suisse.com/corporateinsights.
Latest papers

This material has been prepared by personnel of Credit Suisse Securities (USA) LLC and its affiliates (“CSSU”) and not by the CSSU research department. It is not investment research or a research recommendation, as it does not constitute substantive research or analysis. This document is not directed to, or intended for distribution to or use by, any person or entity who is a citizen or resident of or located in any locality, state, country or other jurisdiction where such distribution, publication, availability or use would be contrary to law or regulation or which would subject CSSU to any registration or licensing requirement within such jurisdiction. It is provided for informational purposes only, is intended for your use only, does not constitute an invitation or offer to subscribe for or purchase any of the products or services, and must not be forwarded or shared except as agreed with CSSU. The information provided is not intended to provide a sufficient basis on which to make an investment decision. It is intended only to provide observations and views of certain personnel, which may be different from, or inconsistent with, the observations and views of CSSU research department analysts, other CSSU personnel, or the proprietary positions of CSSU. Observations and views expressed herein may be changed by the personnel at any time without notice. This material may have previously been communicated to other CSSU clients.
The information provided, including any tools, services, strategies, methodologies and opinions, is expressed as of the date hereof and is subject to change. CSSU assumes no ob-ligation to update or otherwise revise these materials. The information presented in this document has been obtained from or based upon sources believed to be reliable, but CSSU does not represent or warrant its accuracy or completeness and is not responsible for losses or damages arising out of errors, omissions or changes or from the use of information presented in this document. This material does not purport to contain all of the information that an interested party may desire and, in fact, provides only a limited view. Any headings are for convenience of reference only and shall not be deemed to modify or influence the interpretation of the information contained.
Backtested, hypothetical or simulated performance results have inherent limitations. Simulated results are achieved by the retroactive application of a backtested model itself designed with the benefit of hindsight. The backtesting of performance differs from the actual account performance because the investment strategy may be adjusted at any time, for any reason and can continue to be changed until desired or better performance results are achieved. Alternative modeling techniques or assumptions might produce significantly different results and prove to be more appropriate. Past hypothetical backtest results are neither an indicator nor a guarantee of future returns. Actual results will vary from the analysis. Past performance should not be taken as an indication or guarantee of future performance, and no representation or warranty, expressed or implied is made regarding future performance.
CSSU may, from time to time, participate or invest in transactions with issuers of securities that participate in the markets referred to herein, perform services for or solicit business from such issuers, and/or have a position or effect transactions in the securities or derivatives thereof. To obtain a copy of the most recent CSSU research on any company mentioned please contact your sales representative or go to research-and-analytics.csfb.com. FOR IMPORTANT DISCLOSURES on companies covered in Credit Suisse Investment Banking Division research reports, please see www.credit-suisse.com/researchdisclosures
Nothing in this document constitutes investment, legal, accounting or tax advice or a representation that any investment strategy or service is suitable or appropriate to your individual circumstances. This document is not to be relied upon in substitution for the exercise of independent judgment. This document is not to be reproduced, in whole or part, without the written consent of CSSU.
The HOLT methodology does not assign ratings or a target price to a security. It is an analytical tool that involves use of a set of proprietary quantitative algorithms and warranted value calculations, collectively called the HOLT valuation model, that are consistently applied to all the companies included in its database. Third-party data (including consensus earnings estimates) are systematically translated into a number of default variables and incorporated into the algorithms available in the HOLT valuation model. The source financial statement, pricing, and earnings data provided by outside data vendors are subject to quality control and may also be adjusted to more closely measure the underlying economics of firm per-formance. These adjustments provide consistency when analyzing a single company across time, or analyzing multiple companies across industries or national borders. The default scenario that is produced by the HOLT valuation model establishes a warranted price for a security, and as the third-party data are updated, the warranted price may also change. The default variables may also be adjusted to produce alternative warranted prices, any of which could occur. The warranted price is an algorithmic output applied systematically across all companies based on historical levels and volatility of returns. Additional information about the HOLT methodology is available on request.
CSSU does not provide any tax advice. Any tax statement herein regarding any US federal tax is not intended or written to be used, and cannot be used, by any taxpayer for the purpose of avoiding any penalties. Any such statement herein was written to support the marketing or promotion of the transaction(s) or matter(s) to which the statement relates. Each taxpayer should seek advice based on the taxpayer’s particular circumstances from an independent tax advisor.
This document does not constitute an offer to sell, or a solicitation of an offer to purchase, any business or securities.
This communication does not constitute an invitation to consider entering into a derivatives transaction under U.S. CFTC Regulations §§ 1.71 and 23.605 or a binding offer to buy/sell any financial instrument.
CREDIT SUISSE SECURITIES (USA) LLCEleven Madison AvenueNew York, NY 10010credit-suisse.com