Embed Size (px)
Citation preview
Behavioral/Systems/Cognitive
Functional Magnetic Resonance Imaging-Assessed BrainResponses during an Executive Task Depend on Interactionof Sleep Homeostasis, Circadian Phase, and PER3 Genotype
Gilles Vandewalle,1 Simon N. Archer,2 Catherine Wuillaume,1 Evelyne Balteau,1 Christian Degueldre,1 Andre Luxen,1
Pierre Maquet,1 and Derk-Jan Dijk2
1Cyclotron Research Centre, University of Liege, B-4000 Liege, Belgium, and 2Surrey Sleep Research Centre, University of Surrey, Guildford, Surrey GU27XP, United Kingdom
Cognition is regulated across the 24 h sleep-wake cycle by circadian rhythmicity and sleep homeostasis through unknown brain mecha-nisms. We investigated these mechanisms in a functional magnetic resonance imaging study of executive function using a workingmemory 3-back task during a normal sleep-wake cycle and during sleep loss. The study population was stratified according to homozy-gosity for a variable-number (4 or 5) tandem-repeat polymorphism in the coding region of the clock gene PERIOD3. This polymorphismconfers vulnerability to sleep loss and circadian misalignment through its effects on sleep homeostasis. In the less-vulnerable genotype,no changes were observed in brain responses during the normal-sleep wake cycle. During sleep loss, these individuals recruited supple-mental anterior frontal, temporal and subcortical regions, while executive function was maintained. In contrast, in the vulnerablegenotype, activation in a posterior prefrontal area was already reduced when comparing the evening to the morning during a normalsleep-wake cycle. Furthermore, in the morning after a night of sleep loss, widespread reductions in activation in prefrontal, temporal,parietal and occipital areas were observed in this genotype. These differences occurred in the absence of genotype-dependent differencesin circadian phase. The data show that dynamic changes in brain responses to an executive task evolve across the sleep-wake andcircadian cycles in a regionally specific manner that is determined by a polymorphism which affects sleep homeostasis. The findingssupport a model of individual differences in executive control, in which the allocation of prefrontal resources is constrained by sleeppressure and circadian phase.
IntroductionThe human brain can uphold cognitive activity throughout awaking day via a putative arousal signal driven by the circadianpacemaker (Czeisler and Dijk, 2001; Dijk and von Schantz, 2005),which counters the progressive increase in homeostatic sleeppressure (Cajochen et al., 2002). When wakefulness is extendedinto the circadian night, cognitive function is jeopardized, be-cause the circadian arousal signal dissipates (Dijk et al., 1992).The vulnerability to the effect of sleep loss differs markedly be-tween individuals and does so in a trait-like manner (Van Don-gen et al., 2004). The brain bases for maintenance of cognitionduring the day, its deterioration during the night and individual
differences herein, have not yet been elucidated (Aston-Jones,2005; Chee and Chuah, 2008).
Previous functional brain imaging studies on the effects ofsleep deprivation on cognition yielded a variety of sometimesdivergent results (Chee and Chuah, 2008). After sleep depriva-tion, the most consistent decreases in responses to working mem-ory tasks are observed in posterior (parietal, occipital, temporal)cortices (Chee and Choo, 2004; Habeck et al., 2004), in additionto frontal areas (Habeck et al., 2004; Choo et al., 2005; Mu et al.,2005). In contrast, albeit not always detected (Choo et al., 2005),response increases, which are deemed compensating for the det-rimental effects of sleep deprivation, are typically reported inthalamic nuclei (Chee and Choo, 2004; but see Thomas et al.,2000; Habeck et al., 2004), anterior cingulate cortex (Habeck etal., 2004; Choo et al., 2005) and prefrontal areas (Chee and Choo,2004; Habeck et al., 2004; Mu et al., 2005). Moreover, these re-gionally specific response patterns appear to differentiate vulner-able participants from subjects resilient to sleep deprivation.Thus, the decrease in parietal activation after sleep deprivationhas been proposed as a physiological marker of vulnerability tosleep deprivation (Lim et al., 2007). In contrast, sleepdeprivation-induced increases in ventral prefrontal cortex aretypically reported in the less-vulnerable individuals (Chuah et al.,2006).
This post hoc interpretation of these studies suggests that the
Received Jan. 14, 2009; revised April 15, 2009; accepted April 24, 2009.This work was supported by the Belgian Fonds de la Recherche Scientifique (FNRS), the Fondation Medicale Reine
Elisabeth, the University of Liege, the Poles d’Attraction Interuniversitaire/Interuniversity Attraction Poles (GrantP6/29), and by the Wellcome Trust (Grant GR069714MA) and the Biotechnology and Biological Sciences ResearchCouncil (Grant BB/F022883/1) (D.J.D., S.N.A.). P.M. is supported by the FNRS. G.V. was supported by the FNRS andthe Fonds de recherche sur la nature et les technologies (Quebec). We thank A. Darsaud, L. James, K. Jones, B.Middleton, C. Phillips, C. Schmidt, V. Sterpenich, and A. Viola for their help.
Correspondence should be addressed to Pierre Maquet, Centre de Recherches du Cyclotron, Universite de Liege,B30, Sart Tilman, B-4000 Liege, Belgium. E-mail: [email protected].
G. Vandewalle’s present address: Department of Psychology, Universite de Montreal, Montreal QC H2V 2S9,Canada.
DOI:10.1523/JNEUROSCI.0229-09.2009Copyright © 2009 Society for Neuroscience 0270-6474/09/297948-09$15.00/0
7948 • The Journal of Neuroscience, June 24, 2009 • 29(25):7948 –7956

brain response patterns of vulnerable and less-vulnerable indi-viduals dissociate in a predictable way when exposed to sleep loss.A stringent test of this prediction requires a prospective study ofbrain responses to a working memory task in subjects who are apriori classified as vulnerable or less vulnerable.
We contrasted the dynamics of functional magnetic reso-nance imaging (fMRI)-assessed brain responses to a workingmemory task during a normal sleep-wake cycle and after sleeploss, while assessing circadian phase, in a study population strat-ified according to homozygosity for a variable-number (4 or 5)tandem-repeat primate-specific (Jenkins et al., 2005) polymor-phism in the coding region of the clock gene PERIOD3 (PER3)(Archer et al., 2003). This polymorphism confers vulnerability tosleep loss through its effects on sleep homeostasis (Viola et al.,2007). Thus, subjects homozygous for the long repeat (PER35/5)are characterized by a more rapid increase in low frequency EEGoscillations during wakefulness and more slow wave activity dur-ing sleep (Viola et al., 2007), and are more vulnerable to deterio-ration of executive function (Groeger et al., 2008).
Materials and MethodsMore details are presented in the online supplemental material, availableat www.jneurosci.org.
Participants. Participants gave their written informed consent and thestudy was approved by the Ethics Committee of the Faculty of Medicineof the University of Liege. DNA samples were collected and analyzed in254 right-handed individuals, aged between 18 and 30 years old (supple-mental Methods). Among these individuals, 105 and 29 were homozy-gous for the PER34 and PER35 alleles, respectively. We excluded homozy-gous individuals with a body mass index �27, those who had worked onnight shifts during the last year or traveled through more than one timezone during the last 2 months, as well as those who were on medication orconsumed psychoactive drugs or excessive caffeine and alcohol (i.e., �4caffeine units/d; �14 alcohol units/week—1 unit is equivalent to a half-pint (220 ml) of beer or 1 (25 ml) measure of spirits or 1 glass (125 ml) ofwine). The absence of medical, traumatic, psychiatric or sleep disorders
was established in a semistructured interview.Fifteen PER34/4 and 13 PER35/5 individuals wereenrolled in the study. They were matched for ageand gender, and did not differ with respect toother potential confounders (e.g., mood, anxietylevel, IQ, education, see supplemental Table S1,available at www.jneurosci.org as supplementalmaterial). None of these subjects participated inour previous PER3 sleep deprivation study (Violaet al., 2007). One PER35/5 individual fell asleepduring the fMRI session that followed sleep depri-vation (he missed more than half of the trials –performance �20%) and was discarded. There-fore, 15 PER34/4 and 12 PER35/5 were included inthe analyses (demographics, fMRI and behavior).
Protocol and theoretical background. Thestudy was conducted between the 15th of No-vember 2006 and the 14th of April 2007 at theCyclotron Research Centre of the University ofLiege. Individuals from both genotypes were re-cruited to the study throughout the 5 monthperiod. At least 8 d before the first segment ofthe experiment, subjects were habituated tosleeping in the laboratory while instrumentedfor polysomnographic recording. At this time, ad-ditional characteristics of the participants werecollected, but these were not used as selection cri-teria (supplemental Table S1, available at www.jneurosci.org as supplemental material).
Each subject participated in two experimen-tal segments (Sleep and Sleep deprivation) sep-arated by at least 1 week (Fig. 1). The order of
the segments was counter-balanced across subjects. During the 7 d pre-ceding each laboratory segment, volunteers were instructed to follow aregular sleep schedule and this was verified using wrist actigraphy (Acti-watch, Cambridge Neuroscience, UK) and sleep diaries (supplementalTable S2, available at www.jneurosci.org as supplemental material). Thetwo segments were identical except for the presence or absence of sleepbetween the evening and morning fMRI recordings. In one segment,subjects slept in darkness for 7.5 h (EEG was recorded during the sleepepisodes), whereas in the other they stayed awake in dim light through-out the night (a member of the research staff ensured they were awake atall times). The timings of fMRI acquisitions were scheduled with respectto the habitual sleep-schedule, to minimize the confounding effects ofvariation in sleep-wake timing and circadian phase (see supplementalTable S3, available at www.jneurosci.org as supplemental material, foractigraphy-assessed sleep-wake times). For each laboratory segment,subjects arrived at the laboratory 7.5 h before and left 6 h after theirscheduled habitual sleep midpoint (Fig. 1). Functional MRI acquisitionswere scheduled in the evening, 2 h before habitual bedtime, i.e., close tothe crest of the circadian arousal signal, and in the morning, 1.5 h afterwake time, close to the nadir of the circadian arousal signal (Fig. 1a). Thisresulted in 4 fMRI sessions: a morning session after sleep (MS; after �1.5h of wakefulness, at �08:30 h on average), a morning session after sleepdeprivation (MSD; after �25 h of wakefulness, at �08:30 h on average),an evening session before sleep (ES; after �14 h of wakefulness, at�21:30 h on average), and an evening session before sleep deprivation(ESD; after �14 h of wakefulness, at �21:30 h on average). Thus, themorning and evening sessions differed with respect to both time awakeand circadian phase (see supplemental Results and supplemental TableS3, available at www.jneurosci.org as supplemental material, for precisetime awake before each session and clock time of fMRI sessions in eachgenotype—no significant difference between genotypes were detected,p � 0.1). In contrast, the two morning sessions were scheduled at thesame circadian phase and differed only with respect to time awake beforethe session.
The fMRI sessions can also be compared with respect to the previouslyestablished difference between the genotypes in the wake-dependent in-crease and sleep-dependent decline of homeostatic sleep pressure (Viola
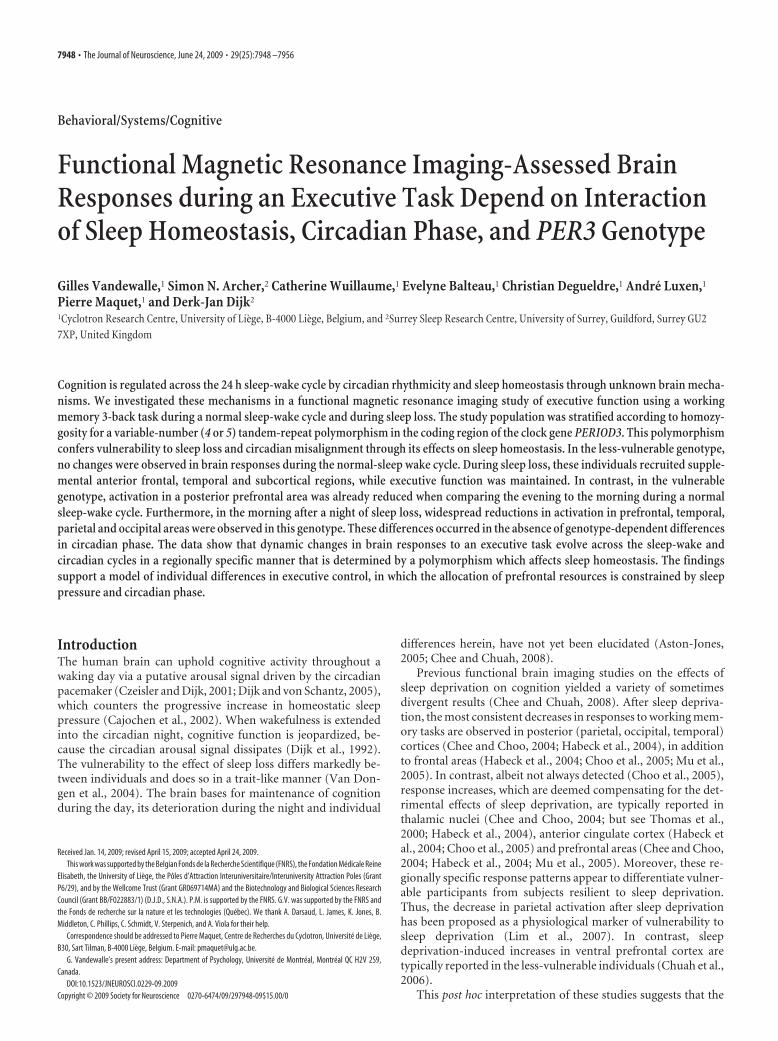
Figure 1. Schematic representation of the protocol and the homeostatic and circadian processes in PER34/4 andPER35/5. All times are in clock time (h). a, Circadian arousal signal (Sleep-Wake) [arbitrary units (a.u.)], which promoteswakefulness during the day and sleep at night (based on data published in Dijk et al., 1997) oscillates independently fromsleep-wake behavior and similarly in PER34/4 and PER3 5/5. The nadir of the circadian arousal rhythm is located in the earlymorning and its crest at the end of the habitual waking day. The time course of melatonin during the sleep deprivationcondition (means � SE; SEs are not plotted for n �2) is plotted to the right. b, Homeostatic sleep pressure (a.u.) increasesduring wakefulness, declines during sleep, and increases further during sleep deprivation. Based on waking and sleep EEGdata (Viola et al., 2007), homeostatic sleep pressure increases and declines more rapidly in PER35/5. Vertical lines, Positionsof the different fMRI sessions.
Vandewalle et al. • PER3 Genotype Predicts Cerebral Sleep-Loss Effect J. Neurosci., June 24, 2009 • 29(25):7948 –7956 • 7949
et al., 2007) (Fig. 1b). Based on this established difference, we predictedthat, despite near identical wake durations, the change in brain responsesover a normal sleep-wake cycle, i.e., the difference between MS and ES,may differ between the genotypes. We further predicted that thesegenotype-dependent differences would be enhanced after sleep depriva-tion, i.e., when comparing the difference between MS and MSD.
Description of activities and measurements. Throughout each experi-mental segment, subjects were maintained in dim light at all times (� 5lux), except for the fMRI sessions, which were conducted in near-complete darkness (� 0.01 lux), and for the sleep episodes, during whichthey were maintained in complete darkness (0 lux). During sleep depri-vation, movements were only allowed at hourly intervals (toilet andstretching), hourly standardized light snacks were provided, and quietactivities were authorized (quiet games, video [� 5 lux], and reading).Saliva samples for the determination of the melatonin rhythm were col-lected once 20 min before the evening fMRI session and hourly after-ward, until the morning fMRI session (11 samples in total) (see supple-mental Methods for assays, available at www.jneurosci.org assupplemental material). Activity was strictly controlled for 60 min beforeeach fMRI session, during which only social interactions were allowed(no reading, snacks, or movements). Subjective alertness scores, as as-sessed by the Karolinska Sleepiness Scale (KSS) (Akerstedt and Gillberg,1990), were collected every 30 min upon arrival and until the end of theprotocol the next day, when the participants were awake (i.e., not duringthe sleep episode of the sleep segment).
In the MR scanner, subjects performed an auditory 3-back task (Co-hen et al., 1997), which requires them to state whether or not each audi-torily presented consonant was identical to the consonant presented 3stimuli earlier, using an MR-compatible keypad. They were trained onthe task at least a week before the first experimental segment. Seven3-back task blocks were presented in each session. Sessions lasted 9.5–10min. The task was kept relatively short (10 min) to prevent differencesbetween genotypes in the sleep deprivation-induced alterations in per-formance, which occur if this task is embedded in a longer duration testbattery (Groeger et al., 2008).
fMRI data acquisition. Functional MRI time series were acquired usinga 3T MR scanner (Allegra, Siemens, Erlangen, Germany). Blood OxygenLevel Dependent (BOLD) signal was recorded using multislice T2*-weighted fMRI images, which were obtained with a gradient echo-planarsequence (EPI) using axial slice orientation (32 slices; voxel size: 3.4 �3.4 � 3 mm 3 with 30% of gap; matrix size 64 � 64 � 32; repetitiontime � 2130 ms; echo time � 40 ms; flip angle � 90°). Structural brainimages were acquired during the training session and consisted of a T1-weighted 3D MDEFT (Deichmann et al., 2004) (repetition time � 7.92ms, echo time � 2.4 ms, time of inversion � 910 ms, flip angle � 15°,field of view 230 � 173 cm 2, matrix size � 256 � 224 � 173, voxel size �1 � 1 � 1 mm 3).
fMRI data analysis. Functional volumes were analyzed using StatisticalParametric Mapping 5 (SPM5; http://www.fil.ion.ucl.ac.uk/spm). Theywere corrected for head motion, spatially normalized (standard SPM5parameters) and smoothed. The analysis of fMRI data was conducted intwo serial steps, accounting, respectively, for fixed and random effects.For each subject, changes in brain regional responses were estimatedusing a general linear model, in which the blocks of the 3-back task weremodeled using boxcar functions, convolved with a canonical hemody-namic response function. Subject errors (false positives, false negativesand omissions, separately) were modeled using stick functions and con-volved with a canonical hemodynamic response function. The regressorsderived from errors and realignment of the functional volumes wereconsidered as covariates of no interest. High-pass filtering was imple-mented in the matrix design using a cutoff period of 128 s to remove lowfrequency drifts from the time series. Serial correlations in the fMRIsignal were estimated using an autoregressive (order 1) plus white noisemodel and a restricted maximum likelihood algorithm.
The effects of interest were then tested by linear contrasts in eachsubject, generating statistical parametric maps. These contrasts of inter-est included: main effects of the 3-back task during a normal sleep-wakecycle [MS and ES] and after sleep deprivation [MSD]; differences be-tween the evening session and the morning session after sleep in the brain
activity related to the 3-back task [MS vs ES]; differences between themorning session after sleep and the morning session after sleep depriva-tion in the brain activity related to the 3-back task [MS vs MSD]; differ-ences between the evening session and the morning session after sleepdeprivation in the brain activity related the 3-back task [MSD vs ESD].The summary statistic images resulting from these different contrastswere then entered in a second-level analysis accounting for intersubjectvariance in the effects of interest (random effects model). We first wantedto identify the brain areas involved in the 3-back task during a normalsleep-wake cycle (MS and ES) and after sleep deprivation (MSD) thatwere common to both genotypes. We therefore computed one-sample ttests for brain responses to the 3-back blocks on one genotype andmasked it (inclusive mask thresholded at puncorrected � 0.001) by thesame one-sample t tests in the other genotype. We then computed two-sample t tests for the various contrasts of interest to assess whether thesedifferences were statistically significant across groups.
The resulting set of voxel values for each contrast constituted maps ofthe t statistics thresholded at puncorrected � 0.001. Statistical inferenceswere performed after correction for multiple comparisons at a thresholdof p � 0.05. Corrections for multiple comparisons (Family Wise Errormethod) were based on the Gaussian random field theory and computedon the entire brain volume or on small spherical volumes (10 mm radius)around a priori locations of activation. Activations were expected instructures involved in the n-back tasks, working memory, arousal regu-lation, or reported in previous investigation of the effects of SD in fMRIor PET (See supplemental Methods for the literature used).
Trait-like sleep propensity was assessed in all subjects at screeningusing the Epworth Sleepiness Scale (Johns, 1991). Each scale score wasassigned to its corresponding subject in a multiple regression analysis atthe random effects level on the contrast (summary statistics) imagesrepresenting the difference between genotypes in the session (morning vsevening) by segment (sleep deprivation vs sleep) interaction [(MSD �ESD) � (MS � ES) * (PER34/4 � PER35/5)].
ResultsSleep-wake timing and melatonin circadian rhythmSleep-wake timing and sleep duration (mean � SD; PER34/4,465 � 24 min; PER35/5, 454 � 22 min; supplemental Table S2,available at www.jneurosci.org as supplemental material) beforeeach segment, the duration of wakefulness before each fMRI ses-sion (supplemental Table S3, available at www.jneurosci.org assupplemental material), as well as the phase and amplitude of themelatonin rhythm during the night of sleep deprivation—a reli-able marker of circadian phase (Klerman et al., 2002)— did notdiffer between the genotypes ( p � 0.1) (Fig. 1a; supplementalResults, available at www.jneurosci.org as supplemental mate-rial). The average onset of nocturnal melatonin secretion, i.e., thetime at which melatonin concentration first exceeds 15 pg/ml,occurred at 20:54 in PER34/4 and 21:24 in PER3 5/5.
Changes detected during a normal sleep-wake cycleBehaviorSubjective sleepiness, as assessed by the KSS (Akerstedt and Gill-berg, 1990), and performance on the task did not differ ( p �0.42) between the genotypes in the morning (MS) and evening(ES) (Table 1; supplemental Results, supplemental Fig. S1, avail-able at www.jneurosci.org as supplemental material).
Brain responses to the executive taskAnalysis of the brain areas recruited by the task during a normalsleep-wake schedule, i.e., during MS and ES, confirmed that bothgenotypes recruited areas in frontal, temporal and parietal corti-ces, areas which are typically involved in working memory (Co-hen et al., 1997; Cabeza and Nyberg, 2000; Collette et al., 2005,2006) (supplemental Fig. S2, supplemental Table S4, available atwww.jneurosci.org as supplemental material).
7950 • J. Neurosci., June 24, 2009 • 29(25):7948 –7956 Vandewalle et al. • PER3 Genotype Predicts Cerebral Sleep-Loss Effect
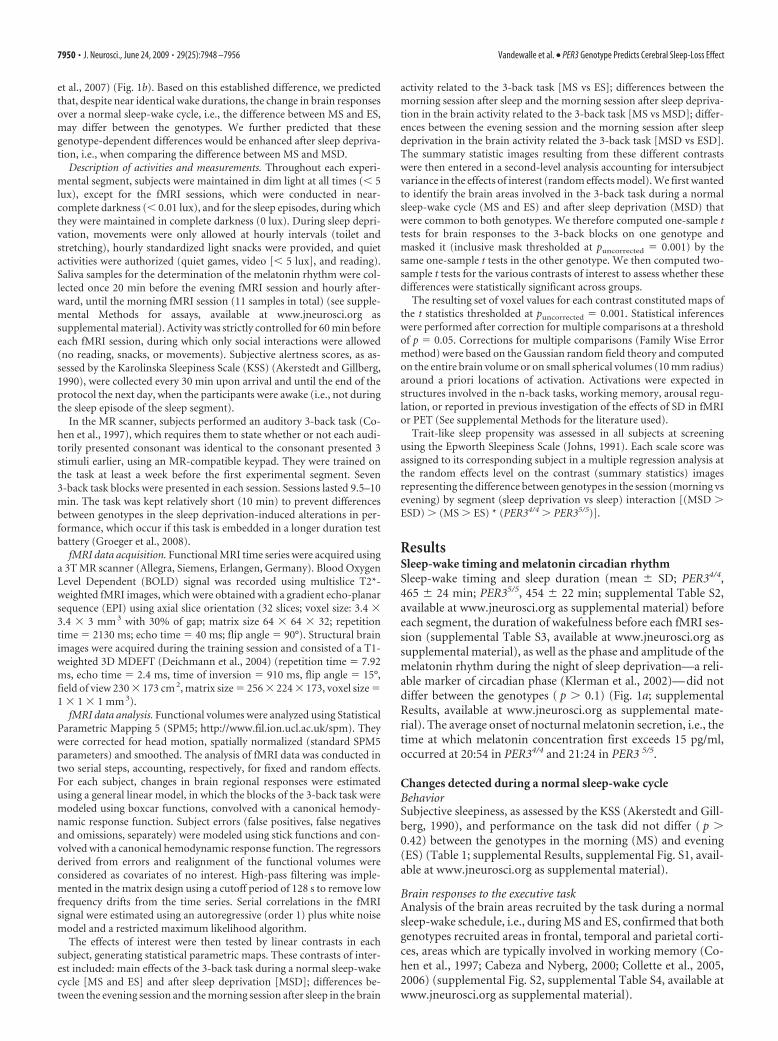
The dynamics of brain responses in the course of a normal daywere then assessed in both genotypes by comparing the eveningsession to the morning session after sleep. In PER34/4 partici-pants, no significant changes in brain responses were observedbetween ES and MS. In contrast, in PER35/5, response in theposterior portion of the right inferior frontal gyrus (40 32 22; Z �3.57; pcorrected � 0.013), was significantly lower in ES comparedwith MS (Fig. 2). Note that a significant interaction betweensession (ES � MS) and genotype (PER34/4 � PER35/5) was de-tected in the exact same brain frontal location.
Changes induced by sleep deprivationBehaviorSubjective sleepiness was significantly higher in the morning aftersleep loss than in the other sessions (F-value �186.28, df � 1, 25;p � 10�6). Both genotypes were, nevertheless, able to maintainperformance during the short working memory task, eventhough greater time-dependent (or within-session) deteriorationof performance was detected (F-value � 3.39; df � 6, 150;p-value � 0.004). No statistically significant differences ( p �0.18) between the genotypes were observed for either perfor-mance, or subjective sleepiness (Table 1; supplemental Results,supplemental Fig. S1, available at www.jneurosci.org as supple-mental material).
Comparison of brain responses to the executive task in themorning after sleep deprivation to the morning after sleepSimilar to the responses observed after a night of sleep, bothgenotypes recruited areas typically involved in working memoryin the morning session after sleep loss (Cohen et al., 1997; Cabezaand Nyberg, 2000; Collette et al., 2005, 2006) (supplemental Fig.S3, supplemental Table S5, available at www.jneurosci.org as sup-plemental material).
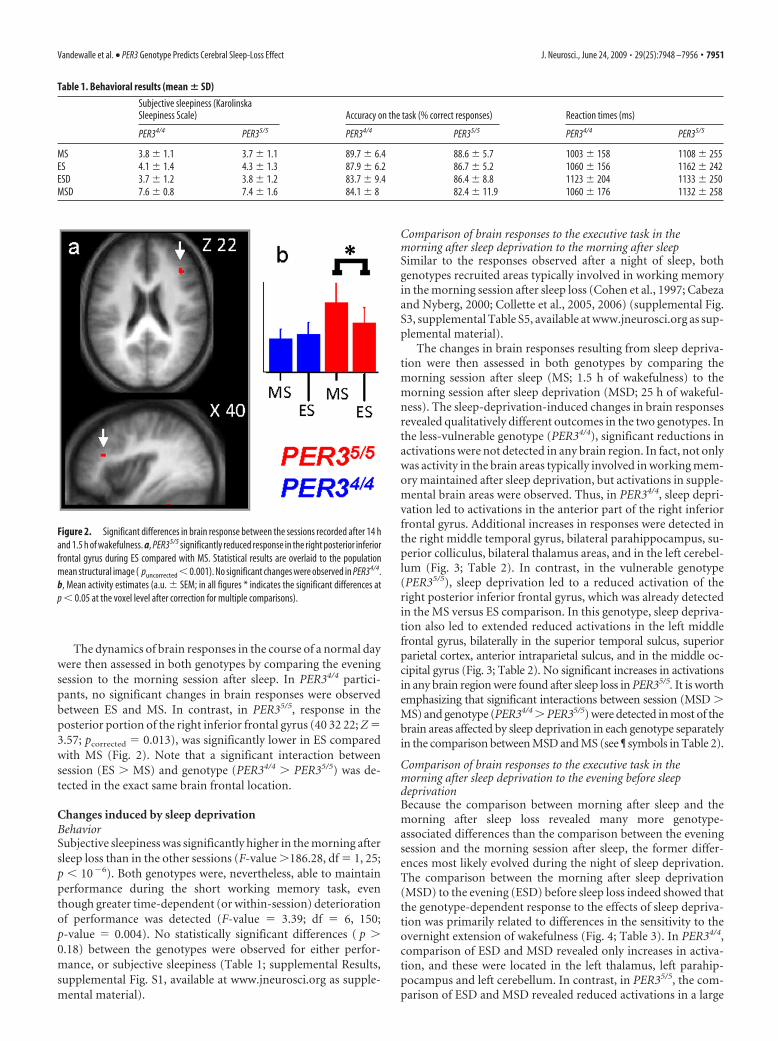
The changes in brain responses resulting from sleep depriva-tion were then assessed in both genotypes by comparing themorning session after sleep (MS; 1.5 h of wakefulness) to themorning session after sleep deprivation (MSD; 25 h of wakeful-ness). The sleep-deprivation-induced changes in brain responsesrevealed qualitatively different outcomes in the two genotypes. Inthe less-vulnerable genotype (PER34/4), significant reductions inactivations were not detected in any brain region. In fact, not onlywas activity in the brain areas typically involved in working mem-ory maintained after sleep deprivation, but activations in supple-mental brain areas were observed. Thus, in PER34/4, sleep depri-vation led to activations in the anterior part of the right inferiorfrontal gyrus. Additional increases in responses were detected inthe right middle temporal gyrus, bilateral parahippocampus, su-perior colliculus, bilateral thalamus areas, and in the left cerebel-lum (Fig. 3; Table 2). In contrast, in the vulnerable genotype(PER35/5), sleep deprivation led to a reduced activation of theright posterior inferior frontal gyrus, which was already detectedin the MS versus ES comparison. In this genotype, sleep depriva-tion also led to extended reduced activations in the left middlefrontal gyrus, bilaterally in the superior temporal sulcus, superiorparietal cortex, anterior intraparietal sulcus, and in the middle oc-cipital gyrus (Fig. 3; Table 2). No significant increases in activationsin any brain region were found after sleep loss in PER35/5. It is worthemphasizing that significant interactions between session (MSD �MS) and genotype (PER34/4 � PER35/5) were detected in most of thebrain areas affected by sleep deprivation in each genotype separatelyin the comparison between MSD and MS (see ¶ symbols in Table 2).
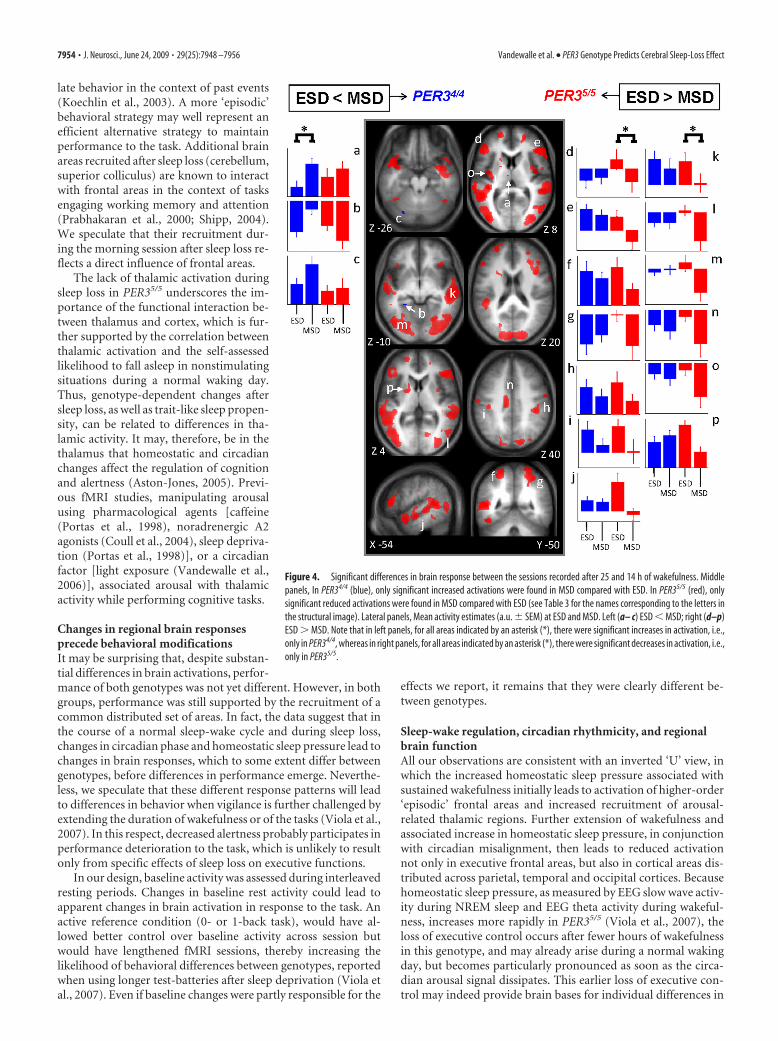
Comparison of brain responses to the executive task in themorning after sleep deprivation to the evening before sleepdeprivationBecause the comparison between morning after sleep and themorning after sleep loss revealed many more genotype-associated differences than the comparison between the eveningsession and the morning session after sleep, the former differ-ences most likely evolved during the night of sleep deprivation.The comparison between the morning after sleep deprivation(MSD) to the evening (ESD) before sleep loss indeed showed thatthe genotype-dependent response to the effects of sleep depriva-tion was primarily related to differences in the sensitivity to theovernight extension of wakefulness (Fig. 4; Table 3). In PER34/4,comparison of ESD and MSD revealed only increases in activa-tion, and these were located in the left thalamus, left parahip-pocampus and left cerebellum. In contrast, in PER35/5, the com-parison of ESD and MSD revealed reduced activations in a large
Table 1. Behavioral results (mean � SD)
Subjective sleepiness (KarolinskaSleepiness Scale) Accuracy on the task (% correct responses) Reaction times (ms)
PER34/4 PER35/5 PER34/4 PER35/5 PER34/4 PER35/5
MS 3.8 � 1.1 3.7 � 1.1 89.7 � 6.4 88.6 � 5.7 1003 � 158 1108 � 255ES 4.1 � 1.4 4.3 � 1.3 87.9 � 6.2 86.7 � 5.2 1060 � 156 1162 � 242ESD 3.7 � 1.2 3.8 � 1.2 83.7 � 9.4 86.4 � 8.8 1123 � 204 1133 � 250MSD 7.6 � 0.8 7.4 � 1.6 84.1 � 8 82.4 � 11.9 1060 � 176 1132 � 258
Figure 2. Significant differences in brain response between the sessions recorded after 14 hand 1.5 h of wakefulness. a, PER35/5 significantly reduced response in the right posterior inferiorfrontal gyrus during ES compared with MS. Statistical results are overlaid to the populationmean structural image ( puncorrected � 0.001). No significant changes were observed in PER34/4.b, Mean activity estimates (a.u. � SEM; in all figures * indicates the significant differences atp � 0.05 at the voxel level after correction for multiple comparisons).
Vandewalle et al. • PER3 Genotype Predicts Cerebral Sleep-Loss Effect J. Neurosci., June 24, 2009 • 29(25):7948 –7956 • 7951
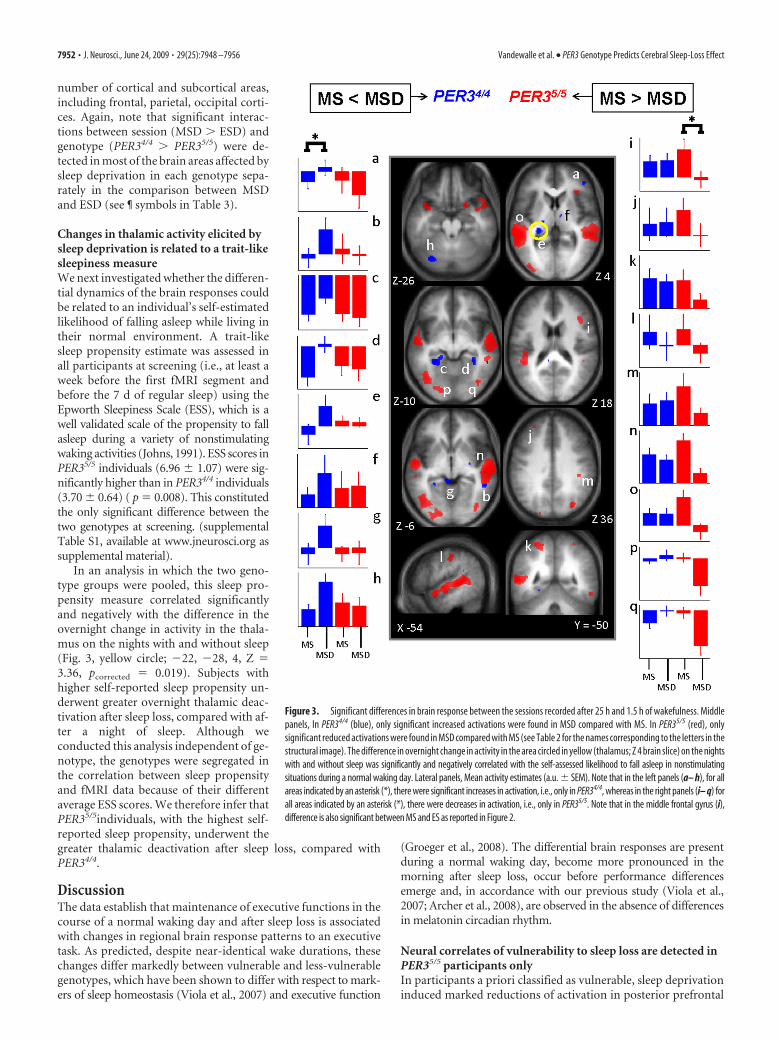
number of cortical and subcortical areas,including frontal, parietal, occipital corti-ces. Again, note that significant interac-tions between session (MSD � ESD) andgenotype (PER34/4 � PER35/5) were de-tected in most of the brain areas affected bysleep deprivation in each genotype sepa-rately in the comparison between MSDand ESD (see ¶ symbols in Table 3).
Changes in thalamic activity elicited bysleep deprivation is related to a trait-likesleepiness measureWe next investigated whether the differen-tial dynamics of the brain responses couldbe related to an individual’s self-estimatedlikelihood of falling asleep while living intheir normal environment. A trait-likesleep propensity estimate was assessed inall participants at screening (i.e., at least aweek before the first fMRI segment andbefore the 7 d of regular sleep) using theEpworth Sleepiness Scale (ESS), which is awell validated scale of the propensity to fallasleep during a variety of nonstimulatingwaking activities (Johns, 1991). ESS scores inPER35/5 individuals (6.96 � 1.07) were sig-nificantly higher than in PER34/4 individuals(3.70 � 0.64) ( p � 0.008). This constitutedthe only significant difference between thetwo genotypes at screening. (supplementalTable S1, available at www.jneurosci.org assupplemental material).
In an analysis in which the two geno-type groups were pooled, this sleep pro-pensity measure correlated significantlyand negatively with the difference in theovernight change in activity in the thala-mus on the nights with and without sleep(Fig. 3, yellow circle; �22, �28, 4, Z �3.36, pcorrected � 0.019). Subjects withhigher self-reported sleep propensity un-derwent greater overnight thalamic deac-tivation after sleep loss, compared with af-ter a night of sleep. Although weconducted this analysis independent of ge-notype, the genotypes were segregated inthe correlation between sleep propensityand fMRI data because of their differentaverage ESS scores. We therefore infer thatPER35/5individuals, with the highest self-reported sleep propensity, underwent thegreater thalamic deactivation after sleep loss, compared withPER34/4.
DiscussionThe data establish that maintenance of executive functions in thecourse of a normal waking day and after sleep loss is associatedwith changes in regional brain response patterns to an executivetask. As predicted, despite near-identical wake durations, thesechanges differ markedly between vulnerable and less-vulnerablegenotypes, which have been shown to differ with respect to mark-ers of sleep homeostasis (Viola et al., 2007) and executive function
(Groeger et al., 2008). The differential brain responses are presentduring a normal waking day, become more pronounced in themorning after sleep loss, occur before performance differencesemerge and, in accordance with our previous study (Viola et al.,2007; Archer et al., 2008), are observed in the absence of differencesin melatonin circadian rhythm.
Neural correlates of vulnerability to sleep loss are detected inPER35/5 participants onlyIn participants a priori classified as vulnerable, sleep deprivationinduced marked reductions of activation in posterior prefrontal
Figure 3. Significant differences in brain response between the sessions recorded after 25 h and 1.5 h of wakefulness. Middlepanels, In PER34/4 (blue), only significant increased activations were found in MSD compared with MS. In PER35/5 (red), onlysignificant reduced activations were found in MSD compared with MS (see Table 2 for the names corresponding to the letters in thestructural image). The difference in overnight change in activity in the area circled in yellow (thalamus; Z 4 brain slice) on the nightswith and without sleep was significantly and negatively correlated with the self-assessed likelihood to fall asleep in nonstimulatingsituations during a normal waking day. Lateral panels, Mean activity estimates (a.u. � SEM). Note that in the left panels (a– h), for allareas indicated by an asterisk (*), there were significant increases in activation, i.e., only in PER34/4, whereas in the right panels (i– q) forall areas indicated by an asterisk (*), there were decreases in activation, i.e., only in PER35/5. Note that in the middle frontal gyrus (i),difference is also significant between MS and ES as reported in Figure 2.
7952 • J. Neurosci., June 24, 2009 • 29(25):7948 –7956 Vandewalle et al. • PER3 Genotype Predicts Cerebral Sleep-Loss Effect

cortices after sleep loss, which was already detected in the eveningafter a normal waking day but became particularly pronouncedduring circadian phase misalignment, i.e., in the morning aftersleep loss. In these individuals, parietal and temporal corticesundergo marked reductions of activation after sleep loss. Becausewe used the auditory modality, this supports the assumption thatdeficits in short-term memory after sleep deprivation result, inpart, from impaired attention and sensory processing (Chee andChuah, 2007; Chee et al., 2008). Likewise, occipital areas, whichwere not activated by the task during a normal sleep-wake cycle,were deactivated after sleep loss. Given the absence of visual inputin our design, this is likely to reflect the diminution of top-downinfluences of associative (parietal and frontal) cortices onto oc-cipital regions. Surprisingly, the substantial decreases in brainresponses observed in PER35/5 individuals were not detected inPER34/4. In the latter genotype, responses in these brain regionsafter sleep loss were essentially unchanged. These conspicuousdifferences in response patterns between the genotypes are mostlikely related to the differential effects of sleep loss in interactionwith circadian misalignment, and not to simple differences in thecircadian modulation of brain responses. This is because in themorning after sleep, i.e., when sleep pressure is low in both geno-types, this genotype-dependent reduced activation pattern wasnot observed. In fact, in PER35/5, responses in most prefrontal
and posterior regions are largest in the morning shortly aftersleep and then decline in the course of a normal waking day, andin the morning after sleep loss these areas are barely activated(Figs. 3i,j, m–o, 4d–j).
Neural correlates of resilience to sleep loss are detected inPER34/4 participants onlySleep loss triggered increases in brain responses, but, again un-expectedly, only in the PER34/4 genotype. These individuals, apriori classified as less vulnerable on the basis of their genotype,seem to maintain cognition in response to increasing homeo-static sleep pressure through two separate mechanisms: 1) therecruitment of supplemental areas (including an anterior pre-frontal area), and 2) the maintenance of posterior and anteriorcortices activity.
A ventral anterior prefrontal area, which is not engaged by thetask under conditions of rested wakefulness, is recruited aftersleep deprivation, suggesting that novel cognitive strategies aredeveloped to maintain performance in the adverse cognitive con-ditions resulting from sleep loss. A recent model of hierarchicalorganization of prefrontal cortex suggests that premotor areasmap simple sensory-motor responses, intermediate dorsolateralprefrontal regions control responses related to the current con-text, and higher-order anterior ventral prefrontal regions modu-
Table 2. Significant differences between sessions recorded after 25 h (MSD) and 1.5 h (MS) of wakefulness in brain activity related to the 3-back task in PER34/4 and PER35/5
genotypes
Brain areas Side X, Y, Z Z score Brodmann’s area pcorrected value
Increase in brain activity in PER34/4 (MSD � MS)Inferior frontal gyrus (a) R 40, 42, 0 3.94 46 0.003¶,#
Middle temporal gyrus (b) R 54, �44, �6 3.26 21 0.023¶,#
Parahippocampus (c,d) L �30, �34, �14 3.91 0.003¶,#
R 30, �38, �8 3.18 0.028Thalamus (e,f) L �26, �30, 6 3.81 0.005#
L �14, �24, 10 3.39 0.016L �20, �18, 4 3.25 0.022R 8, �8, 4 3.27 0.024
Superior colliculus (g) L �4, �40, �4 4.00 0.002Cerebellum (h) L �32, �76, �26 3.80 0.005¶,#
Decrease in brain activity in PER34/4 (MSD � MS)No significant voxels (p uncorrected � 0.001)
Increase in brain activity in PER35/5 (MSD � MS)No significant voxels (p uncorrected � 0.001)
Decrease in brain activity in PER35/5 (MSD � MS)Middle frontal gyrus (i,j) R 44, 24, 22 3.58 44/45 0.009¶,#
L �30, 46, 34 3.15 9 0.030Superior parietal cortex (k) L �24, �52, 60 3.55 7 0.010¶,#
L �24, �62, 52 3.91 7 0.003R 30, �48, 66 3.14 7 0.031¶,#
Postcentral gyrus/anterior intraparietal sulcus (l,m) L �54, �22, 40 3.10 40 0.035R 42, �32, 36 3.31 40 0.020#
Superior temporal sulcus (n,o) L �64, �34, 4 4.64 22 0.05
L �56, �46, 8 4.29 21/22 0.011#
L �56, 6, �20 3.52 21 0.001R 60, �22, �4 4.64 22 0.05R 54, �38, �2 4.08 21 0.002¶,#
Middle occipital gyrus (p,q) L �44, �72, �8 3.87 37 0.013¶,#
L �22, �88, �6 3.46 18 0.004¶,#
L �44, �86, 4 3.37 37 0.017
L �34, �90, �6 3.23 18 0.025¶,#
R 40, �76, �8 3.47 37 0.013
Letters in parentheses (a–q): refer to Figure 3. L, Left; R, right.¶Significant interaction between session and genotype: (MSD � MS) * (PER34/4 � PER35/5).#Significant interaction between session, segment, and genotype: (MSD � ESD) � (MS � ES) * (PER34/4 � PER35/5) (see supplemental Table S6, available at www.jneurosci.org as supplemental material, for complete results of thisinteraction).
Vandewalle et al. • PER3 Genotype Predicts Cerebral Sleep-Loss Effect J. Neurosci., June 24, 2009 • 29(25):7948 –7956 • 7953
late behavior in the context of past events(Koechlin et al., 2003). A more ‘episodic’behavioral strategy may well represent anefficient alternative strategy to maintainperformance to the task. Additional brainareas recruited after sleep loss (cerebellum,superior colliculus) are known to interactwith frontal areas in the context of tasksengaging working memory and attention(Prabhakaran et al., 2000; Shipp, 2004).We speculate that their recruitment dur-ing the morning session after sleep loss re-flects a direct influence of frontal areas.
The lack of thalamic activation duringsleep loss in PER35/5 underscores the im-portance of the functional interaction be-tween thalamus and cortex, which is fur-ther supported by the correlation betweenthalamic activation and the self-assessedlikelihood to fall asleep in nonstimulatingsituations during a normal waking day.Thus, genotype-dependent changes aftersleep loss, as well as trait-like sleep propen-sity, can be related to differences in tha-lamic activity. It may, therefore, be in thethalamus that homeostatic and circadianchanges affect the regulation of cognitionand alertness (Aston-Jones, 2005). Previ-ous fMRI studies, manipulating arousalusing pharmacological agents [caffeine(Portas et al., 1998), noradrenergic A2agonists (Coull et al., 2004), sleep depriva-tion (Portas et al., 1998)], or a circadianfactor [light exposure (Vandewalle et al.,2006)], associated arousal with thalamicactivity while performing cognitive tasks.
Changes in regional brain responsesprecede behavioral modificationsIt may be surprising that, despite substan-tial differences in brain activations, perfor-mance of both genotypes was not yet different. However, in bothgroups, performance was still supported by the recruitment of acommon distributed set of areas. In fact, the data suggest that inthe course of a normal sleep-wake cycle and during sleep loss,changes in circadian phase and homeostatic sleep pressure lead tochanges in brain responses, which to some extent differ betweengenotypes, before differences in performance emerge. Neverthe-less, we speculate that these different response patterns will leadto differences in behavior when vigilance is further challenged byextending the duration of wakefulness or of the tasks (Viola et al.,2007). In this respect, decreased alertness probably participates inperformance deterioration to the task, which is unlikely to resultonly from specific effects of sleep loss on executive functions.
In our design, baseline activity was assessed during interleavedresting periods. Changes in baseline rest activity could lead toapparent changes in brain activation in response to the task. Anactive reference condition (0- or 1-back task), would have al-lowed better control over baseline activity across session butwould have lengthened fMRI sessions, thereby increasing thelikelihood of behavioral differences between genotypes, reportedwhen using longer test-batteries after sleep deprivation (Viola etal., 2007). Even if baseline changes were partly responsible for the
effects we report, it remains that they were clearly different be-tween genotypes.
Sleep-wake regulation, circadian rhythmicity, and regionalbrain functionAll our observations are consistent with an inverted ‘U’ view, inwhich the increased homeostatic sleep pressure associated withsustained wakefulness initially leads to activation of higher-order‘episodic’ frontal areas and increased recruitment of arousal-related thalamic regions. Further extension of wakefulness andassociated increase in homeostatic sleep pressure, in conjunctionwith circadian misalignment, then leads to reduced activationnot only in executive frontal areas, but also in cortical areas dis-tributed across parietal, temporal and occipital cortices. Becausehomeostatic sleep pressure, as measured by EEG slow wave activ-ity during NREM sleep and EEG theta activity during wakeful-ness, increases more rapidly in PER35/5 (Viola et al., 2007), theloss of executive control occurs after fewer hours of wakefulnessin this genotype, and may already arise during a normal wakingday, but becomes particularly pronounced as soon as the circa-dian arousal signal dissipates. This earlier loss of executive con-trol may indeed provide brain bases for individual differences in
Figure 4. Significant differences in brain response between the sessions recorded after 25 and 14 h of wakefulness. Middlepanels, In PER34/4 (blue), only significant increased activations were found in MSD compared with ESD. In PER35/5 (red), onlysignificant reduced activations were found in MSD compared with ESD (see Table 3 for the names corresponding to the letters inthe structural image). Lateral panels, Mean activity estimates (a.u. � SEM) at ESD and MSD. Left (a– c) ESD � MSD; right (d–p)ESD � MSD. Note that in left panels, for all areas indicated by an asterisk (*), there were significant increases in activation, i.e.,only in PER34/4, whereas in right panels, for all areas indicated by an asterisk (*), there were significant decreases in activation, i.e.,only in PER35/5.
7954 • J. Neurosci., June 24, 2009 • 29(25):7948 –7956 Vandewalle et al. • PER3 Genotype Predicts Cerebral Sleep-Loss Effect
vulnerability to sleep loss. This interpretation leads to severaltestable predictions. For example, we expect in PER34/4 to findextended reduced activation if sleep loss were prolonged furtherthan in the current protocol.
Previous studies have emphasized interindividual variabilityin brain responses after sleep loss. “Compensatory” responses tocognitive tasks have been reported (Chee and Choo, 2004; Drum-mond et al., 2004; Habeck et al., 2004), whereas maintenance ofperformance was associated with activations in prefrontal andparietal cortices, and deterioration of performance was associ-ated with loss of activation in these areas (Mu et al., 2005; Chee etal., 2006; Lim et al., 2007). Some of the variability previouslyobserved may be related to genotypic variations in PER3, amongother genes.
The PER3 gene is expressed in the suprachiasmatic nuclei—loci of the circadian pacemaker— but also in other hypothalamic,subcortical and cortical areas (Takumi et al., 1998), which couldall contribute to the effects we observed.
The current observation that differences between genotypesare primarily located between the evening session before and themorning session after sleep loss, and the general observation thatthe BOLD signal changed very little in the course of a normalwaking day, indicates that the BOLD signal does not simply re-flect variables that increase monotonically with the duration of
wakefulness, e.g., EEG low frequency oscillations (Dijk et al.,1987) or synaptic potentiation (Vyazovskiy et al., 2008). Instead,the time course of the BOLD signal appears more similar to thetime courses of variables that are determined by an interaction oftime awake and circadian phase, such as performance, whichremains near stable during a normal waking day and then de-clines rapidly during the biological night, and much more so inPER35/5 (Dijk et al., 1992; Viola et al., 2007; Groeger et al., 2008).Identifying the cellular mechanisms responsible for these BOLDdifferences may provide tools to uncover the nature of the inter-action of homeostatic and circadian signals, as well as individualdifferences in the vulnerability to sleep loss.
ReferencesAkerstedt T, Gillberg M (1990) Subjective and objective sleepiness in the
active individual. Int J Neurosci 52:29 –37.Archer SN, Robilliard DL, Skene DJ, Smits M, Williams A, Arendt J, von
Schantz M (2003) A length polymorphism in the circadian clock genePer3 is linked to delayed sleep phase syndrome and extreme diurnal pref-erence. Sleep 26:413– 415.
Archer SN, Viola AU, Kyriakopoulou V, von Schantz M, Dijk DJ (2008)Inter-individual differences in habitual sleep timing and entrained phaseof endogenous circadian rhythms of BMAL1, PER2 and PER3 mRNA inhuman leukocytes. Sleep 31:608 – 617.
Aston-Jones G (2005) Brain structures and receptors involved in alertness.Sleep Med 6 (Suppl 1):S3–S7.
Table 3. Significant differences between sessions recorded after 25 h (MSD) and 14 h (ESD) of wakefulness in brain activity related to the 3-back task in PER34/4 and PER35/5
genotypes
Brain areas Side X, Y, Z Brodmann’s area Z pcorrected value
Increase in brain activity in PER34/4 (MSD � ESD)Thalamus (a) L �6, �12, 8 3.10 0.039
Parahippocampus (b) L �24, �42, �10 3.13 0.036
Cerebellum (c) L �30, �76, �26 3.26 0.026
Decrease in brain activity in PER34/4 (MSD � ESD)No significant voxels (p uncorrected � 0.001)
Increase in brain activity in PER35/5 (MSD � ESD)No significant voxels (p uncorrected �0.001)
Decrease in brain activity in PER35/5 (MSD � ESD)Inferior frontal gyrus (d) L �54, 32, 12 46 4.75 0.038
Inferior frontal gyrus/middle frontal gyrus (e) R 46, 32, 4 46 4.67 0.05
R 44, 32, 14 46 3.93 0.003R 40, 18, 22 44/45 3.92 0.004
Superior frontal sulcus L �22, 54, 0 10 3.60 0.010Superior parietal cortex (f,g) L �24, �54, 62 7 3.87 0.004
L �26, �64, 56 7 3.80 0.005R 24, �52, 60 7 3.48 0.018R 14, �54, 66 7 3.33 0.022
Postcentral gyrus/anterior intraparietal sulcus (h,i) R 42, �32, 40 40 4.08 0.002L �38, �24, 42 40 3.39 0.018
Superior temporal sulcus (j,k) L �52, 12, �26 21 4.85 0.026
L �52, �48, 8 21/22 4.65 � 0.001
R 52, �36, �8 21 4.02 0.003
Middle occipital gyrus (l,m) R 30, �86, �4 19 4.42 0.002
R 32, �84, 10 19 3.63 0.009
L �38, �72, �2 19/37 4.36 0.001
L �24, �86, �4 18 4.12 0.001
L �22, �76, 18 19 3.47 0.015
Fusiform gyrus R 42, �58, �18 19/37 4.07 0.002
R 28, �66, �12 19 3.67 0.008Cingulate cortex (n) L �10, �18, 36 24/31 3.87 0.004
R 16, 46, 10 32 3.43 0.016Insula (o) L �38 �10 12 3.73 0.007Putamen (p) L �22, 2, 2 3.50 0.013
Globus pallidus R 20, 0, 0 3.35 0.020
Letters in parentheses (a–v): Reference to Figure 4. L, Left; R, right.¶Significant interaction between session and genotype: (MSD � ESD) * (PER34/4 � PER35/5).
Vandewalle et al. • PER3 Genotype Predicts Cerebral Sleep-Loss Effect J. Neurosci., June 24, 2009 • 29(25):7948 –7956 • 7955

Cabeza R, Nyberg L (2000) Imaging cognition II: An empirical review of 275PET and fMRI studies. J Cogn Neurosci 12:1– 47.
Cajochen C, Wyatt JK, Czeisler CA, Dijk DJ (2002) Separation of circadianand wake duration-dependent modulation of EEG activation duringwakefulness. Neuroscience 114:1047–1060.
Chee MW, Choo WC (2004) Functional imaging of working memory after24 hr of total sleep deprivation. J Neurosci 24:4560 – 4567.
Chee MW, Chuah LY (2008) Functional neuroimaging insights into howsleep and sleep deprivation affect memory and cognition. Curr OpinNeurol 24:417– 423.
Chee MW, Chuah YM (2007) Functional neuroimaging and behavioral cor-relates of capacity decline in visual short-term memory after sleep depri-vation. Proc Natl Acad Sci U S A 104:9487–9492.
Chee MW, Chuah LY, Venkatraman V, Chan WY, Philip P, Dinges DF(2006) Functional imaging of working memory following normal sleepand after 24 and 35 h of sleep deprivation: correlations of fronto-parietalactivation with performance. Neuroimage 31:419 – 428.
Chee MW, Tan JC, Zheng H, Parimal S, Weissman DH, Zagorodnov V,Dinges DF (2008) Lapsing during sleep deprivation is associated withdistributed changes in brain activation. J Neurosci 28:5519 –5528.
Choo WC, Lee WW, Venkatraman V, Sheu FS, Chee MW (2005) Dissocia-tion of cortical regions modulated by both working memory load andsleep deprivation and by sleep deprivation alone. Neuroimage25:579 –587.
Chuah YM, Venkatraman V, Dinges DF, Chee MW (2006) The neural basisof interindividual variability in inhibitory efficiency after sleep depriva-tion. J Neurosci 26:7156 –7162.
Cohen JD, Perlstein WM, Braver TS, Nystrom LE, Noll DC, Jonides J, SmithEE (1997) Temporal dynamics of brain activation during a workingmemory task. Nature 386:604 – 608.
Collette F, Van der Linden M, Laureys S, Delfiore G, Degueldre C, Luxen A,Salmon E (2005) Exploring the unity and diversity of the neural sub-strates of executive functioning. Hum Brain Mapp 25:409 – 423.
Collette F, Hogge M, Salmon E, Van der Linden M (2006) Exploration of theneural substrates of executive functioning by functional neuroimaging.Neuroscience 139:209 –221.
Coull JT, Jones ME, Egan TD, Frith CD, Maze M (2004) Attentional effectsof noradrenaline vary with arousal level: selective activation of thalamicpulvinar in humans. Neuroimage 22:315–322.
Czeisler CA, Dijk DJ (2001) Human circadian physiology and sleep-wakeregulation. In: Handbook of behavioral neurobiology: circadian clocks.(Takahashi JS, Turek FW, Moore RY, eds), pp 531–561. New York: Klu-wer Academic/Plenum.
Deichmann R, Schwarzbauer C, Turner R (2004) Optimisation of the 3DMDEFT sequence for anatomical brain imaging: technical implications at1.5 and 3 T. Neuroimage 21:757–767.
Dijk DJ, von Schantz M (2005) Timing and consolidation of human sleep,wakefulness, and performance by a symphony of oscillators. J BiolRhythms 20:279 –290.
Dijk DJ, Beersma DG, Daan S (1987) EEG power density during nap sleep:reflection of an hourglass measuring the duration of prior wakefulness.J Biol Rhythms 2:207–219.
Dijk DJ, Duffy JF, Czeisler CA (1992) Circadian and sleep/wake dependentaspects of subjective alertness and cognitive performance. J Sleep Res1:112–117.
Dijk DJ, Shanahan TL, Duffy JF, Ronda JM, Czeisler CA (1997) Variation ofelectroencephalographic activity during non-rapid eye movement and
rapid eye movement sleep with phase of circadian melatonin rhythm inhumans. J Physiol 505:851– 858.
Drummond SP, Brown GG, Salamat JS, Gillin JC (2004) Increasing taskdifficulty facilitates the cerebral compensatory response to total sleep de-privation. Sleep 27:445– 451.
Groeger JA, Viola AU, Lo JC, von Schantz M, Archer SN, Dijk DJ (2008)Early morning executive functioning during sleep deprivation is compro-mised by a PERIOD3 polymorphism. Sleep 31:1159 –1167.
Habeck C, Rakitin BC, Moeller J, Scarmeas N, Zarahn E, Brown T, Stern Y(2004) An event-related fMRI study of the neurobehavioral impact ofsleep deprivation on performance of a delayed-match-to-sample task.Brain Res Cogn Brain Res 18:306 –321.
Jenkins A, Archer SN, von Schantz M (2005) Expansion during primateradiation of a variable number tandem repeat in the coding region of thecircadian clock gene period3. J Biol Rhythms 20:470 – 472.
Johns MW (1991) A new method for measuring daytime sleepiness: theEpworth sleepiness scale. Sleep 14:540 –545.
Klerman EB, Gershengorn HB, Duffy JF, Kronauer RE (2002) Comparisonsof the variability of three markers of the human circadian pacemaker.J Biol Rhythms 17:181–193.
Koechlin E, Ody C, Kouneiher F (2003) The architecture of cognitive con-trol in the human prefrontal cortex. Science 302:1181–1185.
Lim J, Choo WC, Chee MW (2007) Reproducibility of changes in behaviourand fMRI activation associated with sleep deprivation in a working mem-ory task. Sleep 30:61–70.
Mu Q, Mishory A, Johnson KA, Nahas Z, Kozel FA, Yamanaka K, BohningDE, George MS (2005) Decreased brain activation during a workingmemory task at rested baseline is associated with vulnerability to sleepdeprivation. Sleep 28:433– 446.
Portas CM, Rees G, Howseman AM, Josephs O, Turner R, Frith CD (1998)A specific role for the thalamus in mediating the interaction of attentionand arousal in humans. J Neurosci 18:8979 – 8989.
Prabhakaran V, Narayanan K, Zhao Z, Gabrieli JD (2000) Integration ofdiverse information in working memory within the frontal lobe. Nat Neu-rosci 3:85–90.
Shipp S (2004) The brain circuitry of attention. Trends Cogn Sci 8:223–230.Takumi T, Taguchi K, Miyake S, Sakakida Y, Takashima N, Matsubara C,
Maebayashi Y, Okumura K, Takekida S, Yamamoto S, Yagita K, Yan L,Young MW, Okamura H (1998) A light-independent oscillatory genemPer3 in mouse SCN and OVLT. EMBO J 17:4753– 4759.
Thomas M, Sing H, Belenky G, Holcomb H, Mayberg H, Dannals R, WagnerH, Thorne D, Popp K, Rowland L, Welsh A, Balwinski S, Redmond D(2000) Neural basis of alertness and cognitive performance impairmentsduring sleepiness. I. Effects of 24 h of sleep deprivation on waking humanregional brain activity. J Sleep Res 9:335–352.
Vandewalle G, Balteau E, Phillips C, Degueldre C, Moreau V, Sterpenich V,Albouy G, Darsaud A, Desseilles M, Dang-Vu TT, Peigneux P, Luxen A,Dijk DJ, Maquet P (2006) Daytime light exposure dynamically enhancesbrain responses. Curr Biol 16:1616 –1621.
Van Dongen HP, Baynard MD, Maislin G, Dinges DF (2004) Systematicinterindividual differences in neurobehavioral impairment from sleeploss: evidence of trait-like differential vulnerability. Sleep 27:423– 433.
Viola AU, Archer SN, James LM, Groeger JA, Lo JC, Skene DJ, von Schantz M,Dijk DJ (2007) PER3 polymorphism predicts sleep structure and wakingperformance. Curr Biol 17:613– 618.
Vyazovskiy VV, Cirelli C, Pfister-Genskow M, Faraguna U, Tononi G (2008)Molecular and electrophysiological evidence for net synaptic potentiationin wake and depression in sleep. Nat Neurosci 11:200 –208.
7956 • J. Neurosci., June 24, 2009 • 29(25):7948 –7956 Vandewalle et al. • PER3 Genotype Predicts Cerebral Sleep-Loss Effect


![winprotocoldoc.blob.core.windows.net€¦ · Web view[MS-SDP] [MS-RTPME] Real-Time Transport Protocol (RTP/RTCP): Microsoft Extensions Block Collaboration and Communications Real-Time](https://img.dokumen.tips/doc/110x75/6147a1beafbe1968d37a2d02/web-view-ms-sdp-ms-rtpme-real-time-transport-protocol-rtprtcp-microsoft.jpg)


![[MS-H26XPF]: Real-Time Transport Protocol (RTP/RTCP): H](https://img.dokumen.tips/doc/110x75/62a375922546c83249601c49/ms-h26xpf-real-time-transport-protocol-rtprtcp-h-.jpg)
