Embed Size (px)
Citation preview
Behavioral/Systems/Cognitive
Synchronous, Focally Modulated �-Band OscillationsCharacterize Local Field Potential Activity in the Striatum ofAwake Behaving Monkeys
Richard Courtemanche,1* Naotaka Fujii,2* and Ann M. Graybiel2
1Department of Exercise Science, Concordia University, Montreal, Canada H4B 1R6, and 2Department of Brain and Cognitive Sciences, MassachusettsInstitute of Technology, and the McGovern Institute for Brain Research, Cambridge, Massachusetts 02139
Synchronous oscillatory activity has been observed in a range of neural networks from invertebrate nervous systems to the human frontalcortex. In humans and other primates, sensorimotor regions of the neocortex exhibit synchronous oscillations in the �-frequency band(�15–30 Hz), and these are also prominent in the cerebellum, a brainstem sensorimotor region. However, recordings in the basal gangliahave suggested that such �-band oscillations are not normally a primary feature of these structures. Instead, they become a dominantfeature of neural activity in the basal ganglia in Parkinson’s disease and in parkinsonian states induced by dopamine depletion inexperimental animals. Here we demonstrate that when multiple electrodes are used to record local field potentials, 10 –25 Hz oscillationscan be readily detected in the striatum of normal macaque monkeys. These normally occurring oscillations are highly synchronous acrosslarge regions of the striatum. Furthermore, they are subject to dynamic modulation when monkeys perform a simple motor task to earnrewards. In the striatal region representing oculomotor activity, we found that small focal zones could pop in and out of synchrony as themonkeys made saccadic eye movements, suggesting that the broadly synchronous oscillatory activity interfaces with modular spatio-temporal patterns of task-related activity. We suggest that the background �-band oscillations in the striatum could help to focusaction–selection network functions of cortico-basal ganglia circuits.
Key words: basal ganglia; synchrony; oculomotor; oscillation; ensemble recordings; network activity
IntroductionWidespread, primarily synchronous �-band voltage oscillationsoccur in the sensorimotor and frontal cortex of humans andnonhuman primates. These comprise �15–30 Hz fluctuationsdetected in electroencephalograms and local field potentials(LFPs) (Murthy and Fetz, 1992; Sanes and Donoghue, 1993;MacKay, 1997; Engel et al., 2001). These �-band oscillations havebeen related to attention, motor set, preparation or expectancy insensorimotor circuits, to tonic muscular contractions in holdtasks, and to an “idling” state of motor circuits. The oscillationsdecrease during movement, making it unlikely that they involvedetailed representation of movement parameters, but there isoften a tight correlation between the cortical oscillations and os-cillations in electromyographic activity (Murthy and Fetz, 1996a;Baker et al., 1997; Donoghue et al., 1998; Lebedev and Wise, 2000;
Marsden et al., 2000). LFPs are not simply a reflection of neuronalspiking, but synchronization of spike timing to these oscillationsoccurs for some neurons in the sensorimotor and frontal cortex(Lebedev and Nelson, 1995; Murthy and Fetz, 1996b; Baker et al.,1999). Similar �-band LFP oscillations occur in the cerebellum(Courtemanche et al., 2002).
Remarkably, basal ganglia circuits have been reported to berelatively free of such �-band oscillations in the normal state(Nini et al., 1995; Bergman et al., 1998; Raz et al., 2001). Yet thebasal ganglia do exhibit very strong �-band (and �-band) oscil-lations in the parkinsonian state (Brown et al., 2001; Raz et al.,2001; Williams et al., 2002). This contrast has raised the possibil-ity that some symptoms of Parkinson’s disease reflect abnormalsynchrony in basal ganglia network-level activity, preventingnormal circuit function. If so, one factor underlying the benefi-cial effect of deep brain stimulation therapy for Parkinson’s dis-ease could be the blockade of these abnormal synchronous pat-terns (Bergman et al., 1998).
However, there is not full agreement on these issues. Bothexperimental evidence (Plenz and Kitai, 1999) and model-basedsimulations (Terman et al., 2002) demonstrate that oscillatoryactivity can emerge in pallido-subthalamic circuits, but the pres-ence of oscillations in the basal ganglia of patients with Parkin-son’s disease has been questioned for patients lacking rhythmictremor (Levy et al., 2002) (but see Williams et al., 2002). On theother hand, favoring a low-oscillation normal state and a high-
Received April 30, 2003; revised Oct. 7, 2003; accepted Oct. 25, 2003.This work was supported by National Institutes of Health Grant NEI R01 EY12848 and National Institute of
Neurological Disorders and Stroke Grant RO1 NS25529. R.C. was the recipient of a Natural Sciences and EngineeringResearch Council (Canada) postdoctoral fellowship while at Massachusetts Institute of Technology. We thank L. J.Bouyer, M. Djurfeldt, and C. Kebabian for help with computer programming; P. M. Blazquez for help with monkeysand some recordings; and W. E. DeCoteau, P. Dizio, J. Feingold, T. Feledy, J. G. Partridge, A.G. Siapas, and M. Steriadefor valuable discussions. B. Baker and H. F. Hall provided essential technical expertise.
*R.C. and N.F. contributed equally to this work.Correspondence should be addressed to Dr. Ann M. Graybiel, Department of Brain and Cognitive Sciences, Mas-
sachusetts Institute of Technology, and McGovern Institute for Brain Research, 45 Carleton Street, E25-618, Cam-bridge, MA 02139. E-mail: [email protected] © 2003 Society for Neuroscience 0270-6474/03/2311741-12$15.00/0
The Journal of Neuroscience, December 17, 2003 • 23(37):11741–11752 • 11741

oscillation parkinsonian state is the fact that only small numbersof neurons with �-band oscillatory spike activity have been ob-served either in the pallidum or in the striatum in normal mon-keys (Aldridge and Gilman, 1991; Lebedev and Nelson, 1999; Razet al., 2000), whereas prominent �-band spiking appears in thepallidum and some striatal neurons in primate models of Parkin-son’s disease (Raz et al., 2000, 2001). The main oscillatory spikeactivity reported in the basal ganglia in the normal state is at avery slow time scale, with periods of many seconds (Ruskin et al.,1999; Wichmann et al., 2002).
To address this controversy, we recorded, with multiple elec-trodes, LFP activity and spike activity in the striatum of awake,behaving macaque monkeys. Contrary to expectation, we ob-served prominent and widespread 10 –25 Hz oscillations in theLFP activity that exhibited high synchrony across recording sitesin the caudate nucleus and putamen and task-related modulationat focal, matrisome-like sites. We suggest that these �-band os-cillations could be functionally important in shaping activity pat-terns in the striatum of normal primates.
Materials and MethodsSubjects and task. The experiments (33 on each monkey) were performedon two adult female monkeys (Macaca mulatta) (M7, 6 kg; M8, 5 kg)trained previously to perform oculomotor tasks (Courtemanche et al.,2001; Fujii and Graybiel, 2001; Blazquez et al., 2002). Each monkey hadan eye coil implanted in one eye to measure eye displacement (Fuchs andRobinson, 1966), a head bolt for head fixation, and a recording chamberthat could be fitted with a grid for microelectrode placement. The cham-ber of monkey M7 was aligned with the horizontal plane, centered atstereotypic anterior coordinate A20, and allowed bilateral recordings; thechamber of M8 was implanted on the left side at a 20° angle from thesagittal plane and was centered at A21. The monkeys either rested orperformed a visually guided single-saccade task in which the monkeyfaced a computer screen with a 9 � 9 array of gray dots. The monkey’stask was first to fixate the central dot for a period of 700 msec to 1 sec.Feedback to the monkey on her fixation performance was given by turn-ing the center dot from gray to red when eye position was within �1.25°of the target. After the fixation period, the fixation dot was extinguishedand a peripheral dot at a distance of 5° in any of four eccentric locations(0, 90, 180, or 270°) turned red. The monkey’s task was to saccade to thislocation within 400 msec to be rewarded with drops of water 400 – 800msec later. Monkeys usually performed 30 – 40 trials of the task in a blockdesign but sometimes performed longer trial blocks as well. Task param-eters were controlled by a computer and custom software. Sessions ofquiet rest, in which the monkey simply sat in the chair with head fixed butwith eye movements permitted, were also collected for periods of 1–5min. We noted the occurrence of dozing off periods during data acqui-sition of the rest condition and identified drowsiness segments off-line bythe slow drift in the eye-position recordings.
Recordings. Recordings were made in the caudate nucleus and puta-men of each monkey with tungsten microelectrodes (0.2–1.0 M�) insu-lated with Epoxylite (FHC, Bowdoinham, ME) implanted through hy-podermic tubing to facilitate penetrating the dura mater and overlyingtissue. Localization within the striatum was confirmed by magnetic res-onance imaging with electrodes in place (Blazquez et al., 2002) and byrecording tonically active neurons (TANs) as a striatal hallmark. Up toeight microelectrodes were implanted in the striatum at the same time,with three to five additional microelectrodes located in the frontal eyefield (FEF) and supplementary eye field (SEF) for collection of compar-ison data. Each electrode could be moved independently by a custommicrodrive (Blazquez et al., 2002; Fujii and Graybiel, 2003). For record-ings made during the oculomotor saccade task, we recorded at sites atwhich we could record saccade task-related responses (e.g., presaccadicor postsaccadic activity or activity related to fixation) (Hikosaka et al.,1989). A reference electrode was placed in saline solution (0.9%) abovethe dura mater. Control recordings for LFP signal reliability were alsoperformed with the reference placed in white matter or with the reference
being the amplifier electrical ground. In these tests, the LFP signal eitherremained similar or became noisier than that recorded with the standardsupradural reference.
Data acquisition. Digital and analog data were monitored on-line andcollected in a Cheetah data acquisition system (Neuralynx, Tucson, AZ)for off-line analysis. Eye position was monitored by using a search-coilsystem (David Northgate Instruments, Newark, DE). LFP data were fil-tered at input mostly between 1 and 200 Hz but in some instances be-tween 10 and 200 Hz or 10 and 50 Hz. The analog data were sampled at1000 or 3205 Hz and saved on hard disk. Multiunit and single-unit ac-tivity were filtered between 600 and 3000 Hz and sampled at 32 kHz. A 32point spike waveform was stored on disk at detection–threshold crossing.These were later processed for single-unit identification using the Data-wave Technologies (Longmont, CO) Autocut algorithm in manualmode.
LFP analysis. Analysis of analog data and spike data was performed inthe Matlab (MathWorks, Natick, MA) environment, with custom pro-gramming on the basis of standardized mathematical and signal analysisfunctions (signal processing toolbox). Fast Fourier transforms (FFTs),auto-correlations, and cross-correlations (cross-covariance functions)were performed on the LFP data to verify rhythmicity and synchroniza-tion. These were always performed on the input-filtered but otherwiseunprocessed signal, and an initial visual scanning permitted removal oftime periods with obvious artifacts. In some instances, the LFP signal hadstrong, predominant cardiovascular rhythmicity (�2 Hz): these datawere filtered to remove that component. The frequency power spectrumcomputed from the FFT was expressed as a percentage of total signal(sum of all FFT power, 100%). Because the oscillatory activity that weobserved occurred specifically within the 10 –25 Hz range, we adaptedour analysis to directly assess that activity, which we classify as �-bandgiven its close relationship to the 15–30 Hz borders of �-band activity asdefined conventionally (MacKay, 1997). The analysis of the rest condi-tion was performed two different ways. The first method was to estimatethe length of the episodes of LFP oscillation. These episodes were evalu-ated according to a method similar to the “temporal spectral evolution”method of Salmelin and Hari (1994). This consisted of the following: (1)bandpass filtering the signal in each time window for the frequencies ofinterest (10 –25 Hz), (2) squaring the filtered signal (Siapas and Wilson,1998), (3) finding the peaks in the time line of the squared signal bydetermining the periods in which the squared signal was greater than adefined amplitude threshold, and (4) determining whether the squaredsignal stayed higher than threshold for a minimal episode length of 200msec (four cycles). The threshold level was chosen empirically and cor-responded to the 75th percentile of the range of values of the squaredsignal. This method permitted the analysis of episodes of strong oscilla-tion without a prescribed window.
A second method of analysis, independent of episode definition, wasalso used in the rest condition by applying the FFT algorithm on succes-sive 640 msec windows overlapped by 50% on the 1–5 min periods ofrecording during rest. The 640 msec window size was on the basis of theduration of episodes of strong oscillation defined above. The frequencyspectrum was then integrated between 10 and 25 Hz to provide theproportion of the signal within this frequency range for each time win-dow of analysis. For a given window, if the LFP signal in the 10 –25 Hzrange showed power that was greater than or equal to the 75th percentileof the power distribution for all the windows recorded, then the timeinterval of the window was considered to be part of an oscillation episode.To evaluate the simultaneous presence of LFP oscillations across multiplerecording sites, this 10 –25 Hz integrated value was x (first site) and y(second site) plotted for all of the consecutive windows.
Modulation of the LFP signal during the saccade task was evaluated bycalculating the integrated proportion of the signal between 10 and 25 Hzfor successive 128 msec windows for the duration of each trial and thenaveraging the integrated value for each window across all trials. The 128msec window size was a compromise between accuracy of measurementfor the FFT (close to two cycles at 15 Hz) (see Fig. 2) and time resolutionof the rhythm across the trial duration. Cross-covariance also was calcu-lated during successive windows (125 msec) for analysis of synchronyacross recording sites.
11742 • J. Neurosci., December 17, 2003 • 23(37):11741–11752 Courtemanche et al. • Striatal LFP Oscillations and Synchrony
Analysis of single units. Standard interspike interval and autocorrela-tion histograms were used to analyze single-unit activity (Lamarre andRaynauld, 1965; Perkel et al., 1967). Rhythmicity of firing was evaluatedwith the method developed by Sugihara et al. (1995) and Lang et al.(1999), in which a rhythm index (RI) is defined. For each unit, an auto-correlogram with 5 msec bin widths was constructed for 1 sec aroundeach spike. A baseline value for the average of the correlogram was com-puted for the time window between 50 and 1000 msec before and afterthe spike occurrence, and the SD was determined for windows 300 –1000msec before and after the spike. Significant peaks and valleys were de-fined as those deviating from the average baseline by �1 SD. Finally, foreach significant peak and valley, the distance from the average baselinewas determined. These values were then added. The sum thus reflectedthe oscillatory component of the spike train, defined as the overall devi-ation from a nonoscillatory state. This sum was then divided by the totalnumber of spikes in the autocorrelogram to calculate the RI. If no signif-icant peaks or valleys were found based on the �1 SD criterion, an RI ofzero was assigned to that cell. RIs of �0.01 were accepted as evidence forrhythmicity in the spike train (Lang et al., 1999).
The relationship between single-unit activity and LFP activity wasestablished by constructing LFP-triggered histograms of the spike activ-ity (Destexhe et al., 1999). The LFP from the electrode with single-unitactivity was processed by: (1) bandpass filtering the LFP between 10 and25 Hz and (2) finding the time segments in which the voltage values of theLFP exceeded a threshold set at the 85th percentile of all of the voltagevalues recorded on the LFP channel, thus selecting only the segments ofthe LFP with high-amplitude, stable 10 –25 Hz oscillations. Each spikethat occurred within �250 msec of each peak was included in a histo-gram plotting spike timing relative to the peak of the cycle (10 msec bins).To estimate the significance of correlations between spike timing and theLFP oscillations, for each neuron, we generated control trains of artificialspikes that had random interspike delays but retained exactly the samenumber of spikes as the actual spike train. For each unit, we produced 50such different artificial spike trains and computed from them a mean andSD for all LFP-triggered artificial histograms for each 10 msec bin. Wethen compared the actual recorded spike data with the control spike traindata for each neuron. LFP-triggered spike histogram peaks that occurredwithin �100 msec of the oscillation peak and that had amplitudes thatexceeded those of the artificially triggered histogram by �2 SD wereconsidered significant. These estimates were accurate only to two cycles
to either side of the LFP peak in question be-cause of the averaging and LFP peak detectionmethod. To determine the phase relationshipbetween the spikes of each neuron and the si-multaneously recorded LFP, for each cell with asignificant LFP-triggered histogram peak, wealso computed the phase of each spike in thetrain of spikes relative to the 10 –25 Hz LFP os-cillation cycles. The method used was similar tothat of Perez-Orive et al. (2002), according tothe following equation: phase of peak (rad) �[time of peak (in milliseconds) � 2�]/cycletime (in milliseconds). With this analysis, weproduced a polar histogram of the spike–LFPphase relationship for each unit. The highestpeak in this polar histogram was chosen to de-scribe the timing relationship between thespikes of the neuron and the simultaneously re-corded LFP.
ResultsProminent 10 –25 Hz oscillationscharacterize LFP activity in the striatumof awake, behaving macaquesWe recorded single-unit activity and LFPsfrom two to eight electrodes implanted inthe caudate nucleus and putamen to com-pare activity across different striatal sites.We monitored activity under three behav-
ioral conditions: as the monkeys (M7 and M8), with heads fixed,sat awake but “out of task” in the recording room (Fig. 1A),performed a visually guided task that required them to make asingle saccade to a visual target (Fig. 1B), or dozed, out of task, inthe chair (Fig. 1C). Monkey M8 was better at the rest condition(at staying calm yet alert; n � 33 recording sessions), whereasmonkey M7 had better behavioral performance in the saccadetask (� 90% correct; n � 33 recording sessions). Results wereconsistent across both monkeys.
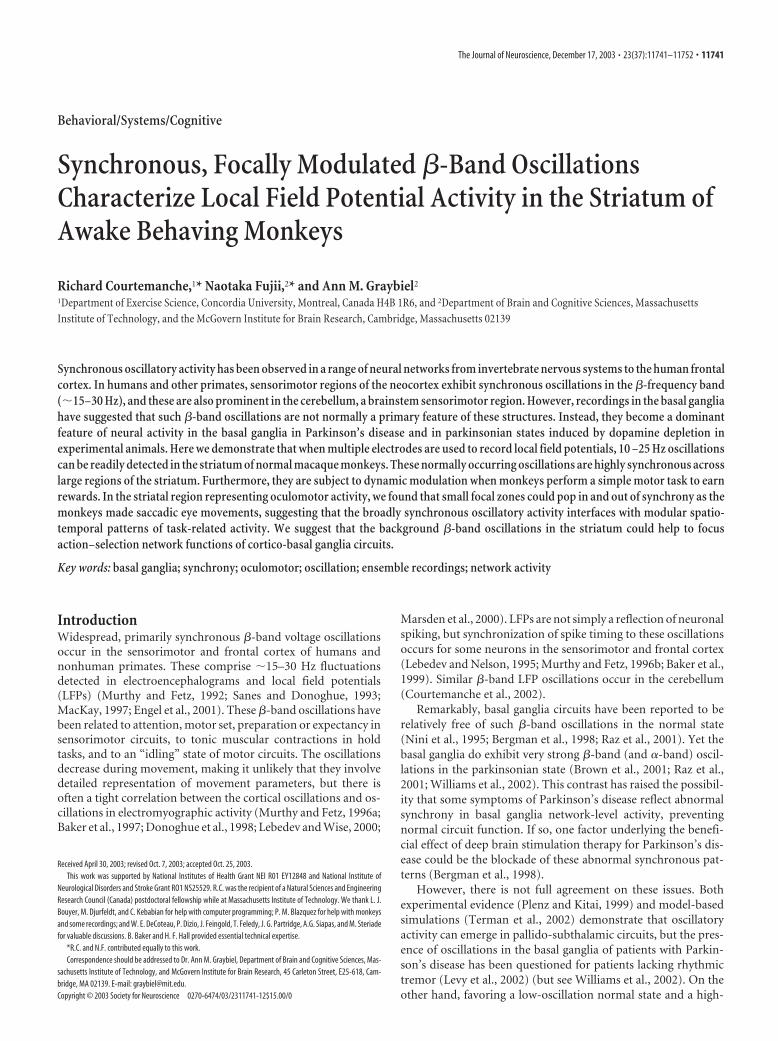
Prominent episodes of 10 –25 Hz oscillatory activity werepresent in the striatal LFPs in each of the waking conditions, witha major activity peak at �15–20 Hz (Fig. 1A,B). Low frequencies(�2 Hz) were also present in the signal but were not analyzedbecause of the possibility of artifact (e.g., cardiovascular poten-tials emanating from local vasculature). In the dozing monkey(Fig. 1C), the striatal LFPs had high-amplitude, low-frequencyirregular waves, as has been reported previously for the neocortexin similar conditions (Torsvall and Akerstedt, 1988). We concen-trated on the dominant �-band (10 –25 Hz) oscillatory activity,because it was characteristic of striatal LFPs when the monkeyswere alert and behaving in tasks.
LFP 10 –25 Hz oscillations exhibit similar properties acrossstriatal sites in the caudate nucleus and putamenWe mapped LFP, single-unit, and multiunit activity at a total of181 sites in the striatum of monkey M8 by recording from 152sites in the caudate nucleus and 29 sites in the putamen, rangingover anteroposterior levels of �14 mm at estimated coordinatesA14 –A28 (Fig. 2). Quantification of the power spectrum of theLFP signal between 10 and 25 Hz was performed for the sitesrecorded during rest (33 experiments; 62 of 181 sites). The rawLFP trace and filtered-squared trace in Figure 2A show the typicalepisodic waxing and waning of oscillatory activity in the 10 –25Hz range (average for the four outlined episodes, 14.1 Hz). Theepisodes of oscillation were not all-or-none events: they werecontinuously varying features of the LFP structure. Prominent
Figure 1. LFPs recorded from the same microelectrode from a macaque monkey (M8) during rest ( A), performance of a visuallyguided saccade task ( B), and drowsiness ( C). For each condition, graphs are shown for, from top to bottom, raw voltage plots ofthe LFPs, bandpass-filtered (10 –25 Hz) LFPs, horizontal and vertical eye position, and FFT analysis. FFT analyses were performedduring the period within the FFT-labeled zones in A–C. The 10 –25 Hz oscillations were spontaneously present during rest ( A) andoccurred during task trials ( B) but were minimal during drowsiness ( C).
Courtemanche et al. • Striatal LFP Oscillations and Synchrony J. Neurosci., December 17, 2003 • 23(37):11741–11752 • 11743
episodes lasted �600 msec on average; episodes lasting this longoccurred �20 times per minute on average. During quiet rest, theunderlying rhythm never completely disappeared. Interepisodedelays ranged from a few hundred msec to 1–3 sec.
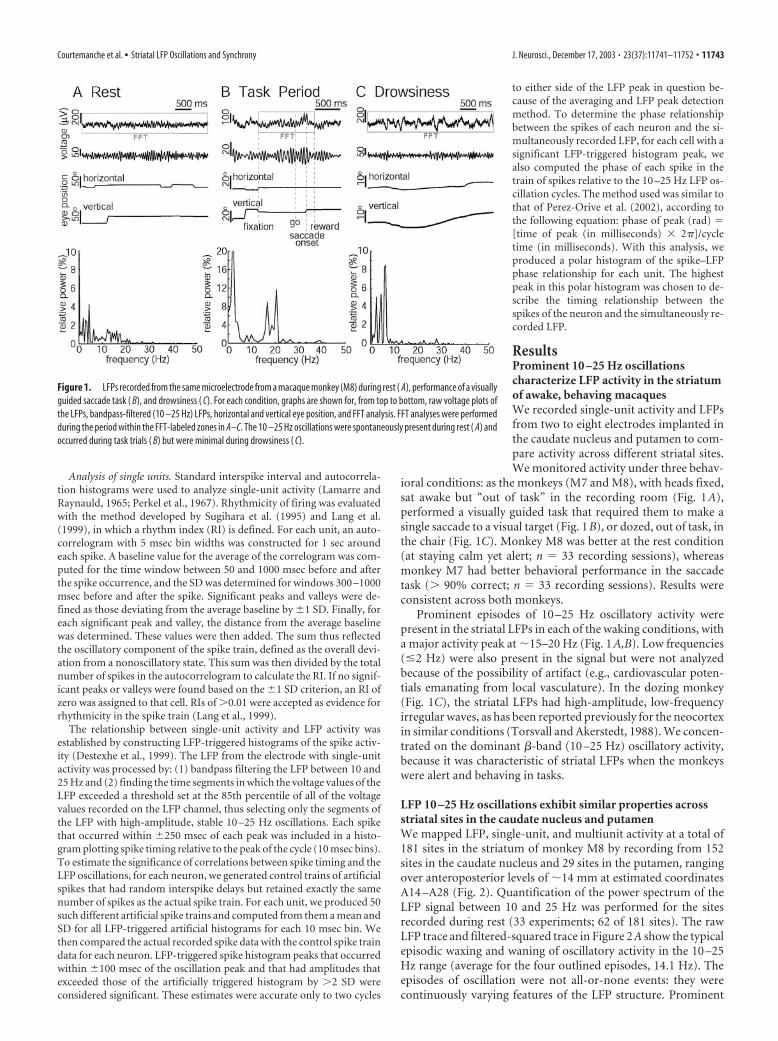
To analyze these oscillations during behavioral rest, we moveda 640 msec window with 50% overlap of successive samplesacross records of the LFPs from the rest condition (320 datasamples at 1000 Hz). As shown in Figure 2B, 10 –25 Hz oscilla-tions occupied up to 40% of the power spectrum for a givenrecording site during these 640 msec windows, with a mean of�20%. The peak frequencies and the percentage of the powerspectrum occupied by different frequency bands were stable overhours of recording (Table 1). As a criterion for additional analy-sis, we accepted as part of oscillatory episodes only those windowswith power in the top 25% of the power values for all windowssampled for each site of recording. In comparing across sites, wethus were able to examine the segments with the highest propor-tion of the signal within the 10 –25 Hz band. Sites with strongoscillation were recorded in both the caudate nucleus and theputamen and at varying depths (Fig. 2D). The LFP oscillationsrecorded in the caudate nucleus and putamen had nearly identi-cal frequencies and durations. Oscillations in the top quartilewere also similar in the two monkeys. The mean dominant fre-quency was 15.4 � 1.3 Hz in monkey M8 (Fig. 2C) and 14.8 � 1.4Hz in monkey M7 (data not shown).
LFP oscillations are highly synchronous across large regionsof the macaque striatumIn 29 of 33 recording sessions in which monkey M8 was in theresting condition, we recorded LFPs and spike activity simulta-neously from two to five electrodes situated in the caudate nu-cleus and the putamen. Even in the raw traces, it was clear that theLFPs exhibited a high degree of synchrony. This temporal pat-terning is illustrated in Figure 3, A and B, which shows traces (Fig.3A) recorded simultaneously from five sites in the striatum [fourin the caudate nucleus (CN1–CN4) and one in the putamen] andone in the FEF, along with the corresponding power spectrum foreach trace (Fig. 3B). Both the profiles of the traces and theirsimilarity in the FFTs provide a strong argument for the similarityof the LFPs at the different sites in the striatum, whereas theseclearly differed from the raw traces and power spectrum recordedsimultaneously at the FEF site.
To quantify the relationships among LFP oscillations detectedat different striatal sites, we performed two types of analysis ondata from the rest condition recorded during 29 sessions fromelectrodes at distributed striatal sites. First, we compared the con-tent of 10 –25 Hz oscillations within the LFP signals recorded atdifferent sites within the caudate nucleus and putamen by plot-ting the proportion of the LFP signal within the 10 –25 Hz bandfor pairs of simultaneously recorded sites in x–y scatterplots forthe consecutive 640 msec windows (Fig. 3C,E). Figure 3C showsthe results of this analysis for two sites in the caudate nucleus thatwere relatively close to one another (Fig. 3A, sites CN3 and CN4,�2 mm apart, shown in black) and two more spatially separated
Figure 2. Properties of striatal LFP oscillations in a macaque monkey (M8) during quiet rest.A, The top trace shows an example of a raw LFP voltage plot with segments identified asoscillatory highlighted by gray shading. The bottom trace shows the same LFP signal, bandpassfiltered (10 –25 Hz) and squared, illustrating the waxing and waning of the 10 –25 Hz oscilla-tions. The horizontal dashed line indicates the threshold used for detection of oscillatory epi-sodes (at or above the 70th to 75th percentile of the filtered and squared voltage). Successivepeaks of the filtered and squared LFP that remained higher than this threshold level wereconsidered part of an oscillatory episode. The minimal episode length was set at 200 msec (4cycles). B, Histogram depicting the percentage of the LFP signal between 10 and 25 Hz for thesuccessive 640 msec time windows (50% overlap) measured during one recording session. Thevertical dashed line indicates the 75th percentile level of 10 –25 Hz oscillation content. Win-dows in the upper quartile were used for analysis of frequency and synchrony. C, Number ofwindows with a particular frequency of LFP oscillations in the sample of 33 rest-conditionexperiments. D, Spatial analysis of the prevalence of 10 –25 Hz oscillatory activity across record-ing sites in the striatum. The recording chamber on M8 was installed at a 20° off-horizontal andwas centered on stereotaxic lateral coordinate L14. Representative recording sites are shown forsagittal 20° oblique planes within the caudate nucleus (CN) (front panel, L10) and putamen
4
(Put) (back panel, L19). For each location within the coordinate system, a graph shows theaverage FFT compiled from 206 to 633 windows recorded at that site. The shaded zone in eachgraph denotes the 10 –25 Hz frequency band. Axes for the FFT analyses are indicated for exem-plars in the caudate nucleus and in the putamen. The x-axis indicates the standard anteropos-terior (AP) coordinates; the y-axis indicates the depth relative to the top of the grid in therecording chamber. For simplification, not all recording sites mapped in the two planes shownare represented.
11744 • J. Neurosci., December 17, 2003 • 23(37):11741–11752 Courtemanche et al. • Striatal LFP Oscillations and Synchrony

sites in the caudate nucleus (Fig. 3A, sites CN1 and CN3, �6 mmapart, shown in red). For the closely spaced sites, there is a linearrelationship and a very high correlation between the 10 and 25 Hzcontent of the LFP signals (r � 0.95; p � 0.001). Even for the sitesseparated by 6 mm, the correlation is quite high (r � 0.65; p �0.001). Figure 3E shows a similar analysis for two sites in thecaudate nucleus separated by �4 mm (Fig. 3A, sites CN2 andCN4, shown in black), and for comparison, the results for siteCN2, one of these sites, and a site in the putamen �10 mm away(shown in red). The corresponding r value for the sites in thecaudate nucleus (r � 0.89; p � 0.001) again indicates a closerelationship in 10 –25 Hz oscillatory content across the sites. Thecorrelation between the 10 and 25 Hz content in the caudatenucleus and putamen recordings was clearly less robust but stillsignificant (r � 0.44; p � 0.001).
In the second analysis of these resting condition data, we com-puted cross-covariance correlograms for the LFPs in the intra-caudate nucleus and caudate nucleus–putamen pairs for the 29sessions (51–233 windows per session) on the basis of windows inthe top 25% of the 10 –25 Hz content for at least one channel (Fig.3D,F). Windows in which both two channels were in the top 25%yielded similar results. The results demonstrate strong synchro-nization across widespread sites in the caudate nucleus. The cor-relation coefficients are 0.98 at zero lag for the near sites (Fig. 3D,CN3 � CN4) and 0.78 at zero lag for the distant sites (Fig. 3D,CN1 � CN3). The correlation for the two caudate nucleus sites atintermediate (�4 mm) separations (Fig. 3F, CN2 � CN4) is inbetween these two values (0.93 at zero lag). The lowest correla-tion is for the caudate nucleus–putamen pair separated by �10mm (Fig. 3F, 0.63 with zero lag, CN2 � putamen). There wasthus a substantial tendency toward LFP synchronization at zerolag for striatal sites separated even by distances as large as 10 mm.As shown in Figure 4D, the lag was almost always zero. By com-parison, the amount of correlation between the oscillatory con-tent of a caudate nucleus site (CN3) and a cortical site in the FEFwas almost nil (r � 0.12, NS) (Fig. 3G). The cross-covariancecorrelogram in Figure 3H also shows at most moderate syn-chrony (coefficient of 0.36), with the FEF leading the caudatenucleus by 11 msec. These data do not speak directly to cortico-striatal interactions, because the recordings were not from iden-tified connected sites; however, they do serve as a control againstwhich to gauge the high synchrony found for pairs of striatal sites.As another control, we also calculated cross-covariance betweentraces from two striatal sites but artificially dislocated in time.This was done by comparing the current 640 msec window for thefirst site with the previous window (320 msec earlier) for thesecond site: these gave very low cross-covariance measures(mostly �0.1). This evidence suggests that the high synchrony ofsimultaneously recorded striatal LFPs was attributable to the sim-ilarity of the oscillatory signal across sites and was not the productof the random overlap of oscillations.
Figure 3. Synchrony of 10 –25 Hz oscillatory LFP activity across the striatum during rest inmonkey M8. A, Examples of simultaneously recorded LFP traces at five recording sites in thestriatum (CN1–CN4, caudate nucleus; Put, putamen), and one in the FEF of the same hemi-sphere. B, FFT analysis for the six traces shown in A in corresponding colors. The graphs in C andE illustrate the degree of correlation of the 10 –25 Hz content of LFP oscillations on pairs ofelectrodes at C sites in the caudate nucleus separated by 2 mm (CN3 � CN4) or 6 mm (CN1 �CN3) and E sites in the caudate nucleus separated by 4 mm (CN2� CN4) and sites in the caudatenucleus and putamen separated by 10 mm (CN2 � Put). The graphs in D and F illustrate thecross-covariance correlograms for the same pairs of sites. The closer sites showed a strongerlinear relationship between the oscillatory content at each site and also a greater cross-covariance between sites. G, Correlation of 10 –25 Hz content of the LFP oscillations between asite in the caudate nucleus (CN3) and a site in the FEF. H, Cross-covariance correlogram for thesame combination of sites as in G. There was no relationship between the oscillatory content atthe two sites, and there was low cross-covariance amplitude between the oscillatory FEF andcaudate nucleus LFPs.
Table 1. Analysis of the stability of the LFP oscillation characteristics (peak frequency and percentage of signal within 10 –25 Hz) at three time points of an experimentalsession rest condition
Time point 1 Time point 2 Time point 3
Peak frequency (Hz) % 10 –25 (Hz) Peak frequency (Hz) % 10 –25 (Hz) Peak frequency (Hz) % 10 –25 (Hz)
Striatal LFP channel1 12.74 23.64 14.71 31.82 14.65 28.62 12.18 19.78 14.96 27.87 15.71 21.733 12.72 21.43 16.28 24.7 15.86 19.2
Number of windows (time) 502 (2 min44sec) 417 (2 min13sec) 306 (1 min38sec)
Three striatal LFPs were recorded in and out of task over a period of �3 hr. Measurements were at three time points: 1, at the start of the session; 2, after 2 hr; and 3, after 3 hr. Bottom recording time was used for analysis at each time point(series of windows have 50% overlap).
Courtemanche et al. • Striatal LFP Oscillations and Synchrony J. Neurosci., December 17, 2003 • 23(37):11741–11752 • 11745
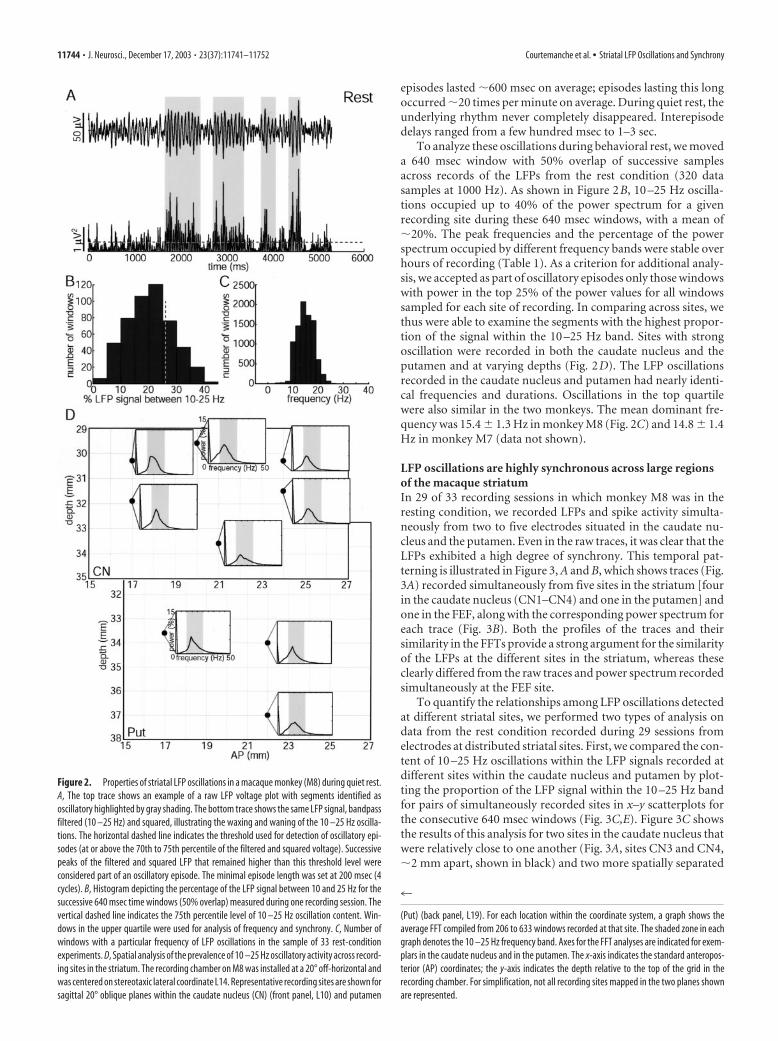
Figure 4A shows the overall pattern of cross-covariance forthe CN3 � CN4 pair for the oscillatory 109 of 438 windows thatwere within the top 25% of 10 –25 Hz content. The profile, withthe average values and �1 SD values shown in shading, demon-strates stability in the peak cross-covariance values at zero lag.The overlaid correlograms of Figure 4B show the stability of thecross-covariance across the 64 pairs of sites recorded in 29 exper-iments in monkey M8, again for the top quartile of all cross-covariance windows. The peak of the overlay plot is locked at zerolag during the rest condition. Figure 4C illustrates the distribu-tion of the peak cross-covariance values for these 64 simulta-neously recorded pairs. These exhibit a range of synchrony(cross-covariance) values mainly between 0.4 and 1, with a meancross-covariance of 0.71 � 0.18 (median, 0.72). The lag was al-most constant at nearly zero across the striatal sites (mean, 0.29 �1.42 msec; median, 0.00) (Fig. 4D).
We also looked for patterns of synchrony by plotting thecross-covariance between pairs of recording sites separated by
different distances within three planes of the striatum (Fig.4E–G) and according to the absolute distance between each pairof sites (Fig. 4H). The values range from zero (e.g., same antero-posterior level) to 10 mm (mediolateral distance) on planar dis-plays; the near-zero value on the absolute distance display comesfrom a single experiment in which the two microelectrodes wereglued together to produce a tip distance of �100 �m. The cross-covariance exhibited a linear decrease with distance for the an-teroposterior and mediolateral planes, with the mediolateral dis-tance showing the strongest relationship (cross-covariance vsmediolateral distance: r � �0.38, F(1,62) � 10.62, p � 0.005;anteroposterior: r � �0.25, F(1,62) � 4.08, p � 0.05; depth: r ��0.36, F(1,62) � 9.46, p � 0.01). The relationship between cross-covariance and depth difference within the striatum was muchweaker but was difficult to judge because we obtained only a fewvalues past 4 mm. Absolute distance, calculated trigonometricallyfrom the distance in the three planes, provided the best relation-ship: r � �0.47; F(1,62) � 17.54; p � 0.0001. These results suggestwidespread synchrony of the oscillatory LFP activity in the stria-tum, but with a gradual decline from values of 0.97 to valuesof 0.17.
The spike activity of some striatal neurons is phase-locked toLFP oscillationsTo examine the relationship between the spike activity of singleunits in the striatum and the LFP oscillations recorded at thesame sites, we analyzed the relative timing of spikes and LFPs for46 well isolated striatal neurons recorded in the caudate nucleus(n � 40) and putamen (n � 6) of monkey M8 (Fig. 5). Weclassified the units as either tonically active neurons (TANs) or asphasically active neurons (PANs) (Aosaki et al., 1995; Blazquez etal., 2002). Neurons identified as PANs exhibited periods of burstyactivity often separated by periods of near silence. They had nar-row interspike interval profiles (Fig. 5A). Neurons identified asTANs exhibited 2–10 Hz irregular tonic spike activity and hadrelatively broad interspike interval profiles (Fig. 5B). They didnot exhibit long silent periods and did not have detectablemovement-related activity. Of the 46 neurons analyzed, we clas-sified 24 as TANs and 13 as PANs but left 9 as unclassifiable or“borderline” for meeting the TAN–PAN classification criteria.
To establish the relationship between spikes and LFPs re-corded from the same microelectrode, we plotted histograms ofthe spikes triggered on the peak of the LFP oscillation cycle (Fig.5A,B, solid lines). These histograms were compared with artifi-cially generated histograms with similar firing rates but random-ized spike times (Fig. 5A,B, dashed black lines with �1 SDshaded). This analysis demonstrated that more than half of thestriatal neurons sampled (27 of 46), including 13 TANs and 8PANs, exhibited clear phase-locking to the LFPs. The profile ofthe phase-locked putative PAN illustrated in Figure 5A showsthat the neuron mainly fired in anti-phase to the LFP oscillations,with significant peaks at lags of �20 msec and 20 msec relativeto the LFP oscillation peaks. The putative TAN shown in Figure5B fired mainly in-phase with the peaks of the LFP oscillations, asshown by the significant peak in the histogram at zero lag. Table2 summarizes the firing characteristics of the 46 neurons sampledrelative to their phase-locking properties. Spike phase-lockingwas distributed evenly between the TANs and PANs recorded andalso between neurons recorded in the caudate nucleus and in theputamen.
To illustrate the phase relationship for the 27 cells with spikephase-locking with the simultaneously recorded LFP activity, thetiming of each spike, relative to the peak of the LFP, was con-
Figure 4. Cross-covariance analysis of 10 –25 Hz LFP oscillations recorded during rest inmacaque monkey M8. A, Cross-covariance for the CN3 � CN4 pair illustrated in Figure 3C. Thesolid line shows the average, and the shaded zone shows �1 SD for 109 of 438 windows (upperquartile of 10 –25 Hz content). B, Cross-covariance plots for all 64 pairs. Each correlogram linecorresponds to one pair-specific average (51–233 windows analyzed per pair). C, Distribution ofthe peak average cross-covariance values across the 64 pairs of sites. D, Lag measurementscorresponding to the cross-covariance pairs analyzed. E–H, Scatterplots of the cross-covariancevalues for pairs of striatal sites separated by different distances in the anteroposterior ( E),mediolateral ( F), and depth ( G) planes and by absolute distance separation ( H ). Depth wasmeasured relative to the top of the grid installed in the recording chamber. The straight linesrepresent the regression plots for the pairs of variables.
11746 • J. Neurosci., December 17, 2003 • 23(37):11741–11752 Courtemanche et al. • Striatal LFP Oscillations and Synchrony

verted to the angular domain. The phase relationship of the firingof the neuron in Figure 5B is shown in the polar plot in Figure 5C.This analysis shows a mild tendency for the spikes to fire morein-phase rather than out-of-phase (fewer spikes between 90 and270° than spikes between 270 and 90°), with the greatest numberof spikes firing with zero-phase. For the population of phase-locked striatal neurons analyzed, the phases of spike activity rel-ative to the peaks of the LFP oscillatory cycle covered a broadrange for the population of striatal neurons sampled (Fig. 5D).However, there was a tendency for the neurons sampled to fireduring the descending phase of the LFP (0 –90°) or just after thelowest point of the LFP (�210 –240°). These phases, occurringafter the LFP peak or valley, could reflect the effects of an afferentfield potential on the cells (Ketchum and Haberly, 1993), withsome delay allocated for the intracellular buildup leading to spikefiring.
Despite the tendency for many striatal neurons to fire spikes
with a particular phase relationship to theLFP oscillations, relatively few themselvesfired rhythmically. We evaluated rhythmicfiring by calculating a rhythm index on thebasis of the autocorrelogram of the cell.The spike trains of the units ranged from33 to 4867 spikes (mean, 864) for the re-cording periods, which varied from 1 to 5min. The largest number of peaks and val-leys detected in the autocorrelograms wasfour (two peaks and two valleys). The RIranged from 0 to 0.087, and an RI of �0.01was accepted as evidence for rhythmicity(see Materials and Methods). Seven of the46 neurons (15.2%) had such RI values (5of 24 TANs and 2 of 13 PANs). For theseseven neurons, the RI ranged from 0.02 to0.09 (average, 0.05), and the rhythm in theautocorrelogram ranged from 2.2 to 22.2Hz (average, 13.9 Hz). As an example, thePAN in Figure 5A had an RI of 0.08 with arhythm at 11.1 Hz. The RI evaluation ofthe autocorrelogram of the TAN in Figure5B did not show rhythmicity, althoughthis TAN was phase-locked with therhythm. Its autocorrelogram showed atendency toward 3 Hz rhythmicity but didnot meet the RI criterion. Thus, striatalneurons clearly could have their overallspike activity phase-locked to the underly-ing LFP rhythm, despite lacking rhythmicspike firing.
Task performance produces localized pockets of reducedsynchrony in striatal LFPsTo determine whether engagement in behavioral tasks modu-lated the striatal �-band oscillations, we implanted multiple elec-trodes in the caudate nucleus and recorded unit activity and LFPsas the monkeys performed a visually triggered single-saccadetask. LFP 10 –25 Hz oscillations were modulated with the task forboth monkeys and also showed task-related variations in syn-chrony (cross-covariance), as documented by Figures 6 and 7.Figure 6 illustrates the results of one experiment in monkey M7(104 trials) in which three electrodes were situated in and near theoculomotor zone of the caudate nucleus. The maximum distanceseparating the three electrodes was 2 mm. Multiunit activity onelectrode 3 (E3) exhibited a clear postsaccadic response (Fig. 6A).Units recorded on E2 showed less task-related activity (Fig. 6A),and activity on E1 (data not shown) was not detectably task re-lated. At the strongly task-related site (E3), activity increased asthe monkey acquired fixation, and firing rates were high as themonkey made saccades to the target presentations (Fig. 6B). TheLFP oscillations recorded on the three electrodes also exhibitedsignificant modulation during task performance (Fig. 6C). For allthree recording sites, there was a stable level of LFP oscillationsbefore saccade onset except for a slight rise and then drop afterfixation onset. The oscillatory activity decreased markedly duringa prolonged period after the saccade. The decline lasted up to thereward delivery, by which time there was an increase in oscilla-tory activity and then stabilization at the presaccade level.
The levels of synchrony among the 10 –25 Hz oscillations re-corded on the three electrodes were very high during the entirefirst part of the task: cross-covariance values were mostly �0.8. A
Figure 5. Phase relationship of neuronal spike activity of striatal neurons to the 10 –25 Hz LFP oscillations recorded at the samesites at which spike activity was recorded. A, LFP-triggered histogram of spike activity of a neuron classified as a phasically activeneuron. B, LFP-triggered histogram for a neuron classified as a tonically active neuron. For the analysis in A and B, cycles of the10 –25 Hz filtered LFP activity of each neuron were detected with an amplitude threshold to identify strongest oscillations(threshold level set at 85th percentile of all LFP voltage values). Each of these was marked as a digital event at the peak of theoscillation. Single-unit spike activity occurring within �250 msec of each peak of the LFP was then plotted (bin width, 10msec,200 msec period shown). The dashed line shows the average histogram for 50 artificial spike trains (described in Materials andMethods), and the shaded zone shows these values �1 SD. Peaks in the LFP-triggered histogram deviating from the artificialspike train average by �2 SD were considered significantly related to the LFP cycle. The neurons shown in A and B were bothsignificantly related to the LFP oscillations: A, anti-phase; B, in-phase. Below these LFP-triggered histograms are autocorrelo-grams of unit activity and interspike interval histograms for the corresponding neurons (bin width, 5 msec). C illustrates thephase-locking relationship for the same neuron illustrated in B with a polar plot of spike times relative to the simultaneouslyrecorded LFP peak converted to angular coordinates (see Materials and Methods) with 15° bins. This neuron had a tendency to firemore in-phase than out-of-phase with the LFP peak and had its largest spike bin at zero-phase. D, Phase relationship for the 27phase-locked neurons (Table 2) on the basis of the highest histogram peak for each cell calculated in C. This graph shows atendency for the cell firing to occur just after the peak and just after the valley of the simultaneously recorded LFP cycles.
Table 2. Characteristics of 46 striatal neurons with spike activity either phase-locked or not phase-locked to the 10 –25 Hz LFP oscillations recorded at thesame site
Phase-locked (n) Not phase-locked (n)
Total neurons 27 19TANs 13 11PANs 8 5Caudate nucleus 23 17Putamen 4 2Rhythmic 5 2Nonrhythmic 22 17
Rhythmic neurons were defined as having a rhythm index of �0.01.
Courtemanche et al. • Striatal LFP Oscillations and Synchrony J. Neurosci., December 17, 2003 • 23(37):11741–11752 • 11747

sudden and striking change occurred at the time of oculomotorsaccades. During this time period, the cross-covariance betweenthe LFPs recorded on E3 (with strong multiunit task-related ac-tivity) and E1 (with no task-related unit activity) fell from �0.8 to�0.5 (Fig. 6D, solid line). This sudden drop began just before thefirst saccades were made and began to reverse �150 msec afterthe saccades. Synchrony across the other two electrode pairs re-mained relatively high (�0.8), but there was a decline in syn-chrony of �0.1 between the LFPs recorded on E3 and those re-corded on E2 on which a weak task-related unit was recorded. Forthe sites with little (E2) or no (E1) task-related activity, the cross-covariance remained nearly unchanged throughout the entire
task. We analyzed the full frequency range from 1 to 200 Hz foreach experiment and found no evidence that the LFPs assumedoscillatory activity at other frequency ranges as they slipped out ofsynchronization in the 10 –25 Hz range (data not shown).
These results demonstrate that during the saccade task, LFP sig-nals at a localized site in the caudate nucleus can disengage from theotherwise highly synchronous pattern of LFP oscillations displayedby the other channels. As shown in Figure 6, the characteristic of thepop-out site at electrode 3 is that it had strong task-related activitytime-locked to the performance of saccades. Judging from the smallseparation between the electrodes, our data indicate that pop-outdesynchronizations can occur in highly localized striatal sites.
Figure 6. Dynamic modulation of 10 –25 Hz rhythmic LFP synchrony during performance of the single-saccade oculomotor task by monkey M7. A, Raster plots and peristimulus time histogramsof multiunit activity (bin width, 10 msec) at two recording sites in the caudate nucleus recorded during the visually guided single-saccade tasks shown from 500 msec before fixation (0 on time line)to 2500 msec after fixation. Postsaccadic activity was pronounced on E3, but saccade-related activity was slight on E2. A third site (electrode 1, data not shown) in A did not have saccade-relatedactivity. B, Horizontal eye position plots corresponding to time lines shown in C and D. C, Modulation of 10 –25 Hz LFP oscillatory activity during the oculomotor task (percentage of the LFP powerspectrum between 10 and 25 Hz for successive 128 msec windows) averaged across the entire set of 104 trials analyzed. D, Cross-covariance (synchrony) of the LFP signals between each pairing ofthe three recording sites. Note that compared with values just before saccade onset, there is a marked drop in synchrony between the site with saccade-related activity (E3) and the site with nosaccade-related activity (E1), as shown by E1 � E3.
11748 • J. Neurosci., December 17, 2003 • 23(37):11741–11752 Courtemanche et al. • Striatal LFP Oscillations and Synchrony

Figure 7, A and B, demonstrates that this localized pop-outphenomenon was consistent across two successive daily sessions,during which the recording electrodes were not moved. The ac-tivity at the three electrodes shown in Figure 6 is illustrated againin Figure 7, A and B, with the activity at each electrode shown bydotted lines for day 2 and the activity at the same sites recorded onthe day before (day 1) indicated by solid lines. The patterns ofactivity on the 2 d are very similar: the activity on E3 is clearlyenhanced during the saccade period, but there is only slightsaccade-related activity on E1. And again, there is a clear declineof synchrony of the task-related electrode (E3) relative to theother two. Figure 7, C and D, shows another instance of task-related modulation and synchrony for an experiment conducted�1 year later. In this case, all three striatal LFPs showed a similarmodulation of oscillations; however, the site with task-relatedactivity (Fig. 7C, Ec) was very correlated throughout the trial withanother site with a somewhat milder task relationship (Eb � Ec)but showed a perisaccade drop in synchrony with a site withoutany task relationship (Ea � Ec). We did not, in any experiment,search for pairs or groups of sites for which synchrony varied with
the task. However, we observed many variations in synchrony,most often postsaccadic. For the purposes of quantifying thisphenomenon, we defined as modulation of LFP synchrony casesfor which the cross-correlation coefficient for a pair of LFPs de-clined by �0.1. Of the 321 pairs of recordings made, 195 exhib-ited such modulation across the task. We defined as pop-out sitesthose sites at which clear task-related activity occurred and inaddition exhibited a drop of �0.1 in synchrony relative to at leastone other recording site. The pop-out phenomenon occurred for8% of the pairs recorded. Thus, our results suggest that the syn-chrony of the striatal LFP oscillation can be influenced by sharplocal patterns of unit firing during task performance (Fig. 7A–C)and also by more broadly distributed patterns of modulation(Fig. 7D). The pop-out phenomenon shown here could representa specific relationship in synchrony between task-and non-task-related sites.
DiscussionOur findings demonstrate that neural activity in the striatum ofawake, behaving macaques is characterized by the presence of
Figure 7. Focal task-related desynchronization of striatal LFP activity in the caudate nucleus. A, B, Activity at the three recording sites shown for two consecutive days of recording: the same dayas shown in Figure 6 (dotted line) and for the immediately preceding day (solid line). Firing rates normalized to the prestimulus firing rate are shown for the three sites and illustrate consistentsaccade-related activity recorded on E3. B, Cross-covariance (synchrony) levels for the pairwise comparisons among the sites for the first day (solid line) and the second day (dotted line). A similarlocal desynchronization pattern, most prominent for comparison of the task-related E3 site and the non-task-related E1 site, holds across both days (E1 � E3). Vertical lines for saccade and rewardindicate the average behavioral event timing for the sessions (dashed for day 1, dotted for day 2). C, D, Focal desynchronization of striatal LFPs during another session of visually guided saccades (29trials) for three simultaneously recorded LFP sites in the caudate nucleus of monkey M7 recorded 1 year after the recordings shown in Figure 6 and in A and B of this figure. C, Raster plot and histogramof firing rate of multiunit activity located at electrode site Ec. This site showed activity related to fixation and also a postsaccade peak. Site Eb also showed a milder yet similar modulation pattern,unlike site Ea. D, Top, Modulation of 10 –25 Hz LFP oscillatory activity during the oculomotor task (percentage of the LFP power spectrum between 10 and 25 Hz for successive 128 msec windows)averaged for the 29 trials. All three sites show a drop in oscillation content after an eye movement (to capture the fixation point or the target). D, Bottom, Cross-covariance (synchrony) of the LFPsignals between each pairing of the three recording sites. Note that as shown in Figure 6, here again, LFP activity can stay quite correlated (Eb � Ec) at similar sites, but synchrony can also droparound task execution for sites with differing multiunit activity (e.g., Ea � Ec).
Courtemanche et al. • Striatal LFP Oscillations and Synchrony J. Neurosci., December 17, 2003 • 23(37):11741–11752 • 11749

widespread synchronous oscillatory activity in the �-band(10 –25 Hz) frequency range. However, as the monkeys per-formed a visuomotor task, we found that focal sites could sud-denly disengage from the synchronized oscillations during thetime that neurons at the sites show increased spike activity relatedto the task. This pop-out phenomenon suggests that in the be-having monkey, the temporal structure of ensemble oscillatoryactivity in the striatum interfaces with a modular spatial organi-zation of task-related activity patterns. Subsets of both striatalprojection neurons and striatal interneurons exhibited phase-locking of their spike activity to the LFP oscillations, but theoscillations were by far more prominent in the field recordings.These periodic fluctuations in voltage could act as a powerfulbackground regulator of otherwise modular, dynamic spatiotem-poral patterns of striatal activity.
Synchronous �-band oscillations characterize striatal activityin awake behaving macaque monkeysTemporally coordinated 10 –25 Hz oscillations occurred both inthe caudate nucleus and in the putamen, at sites as far as 5–10 mmapart. Even with a gradual fall-off in coherence with distance, thisdistribution was broad enough to include striatal zones that formparts of different cortico-basal ganglia circuits and thereforeprobably participate in different cognitive and motor tasks. Ourfindings suggest that shared �-band frequency modulations cansynchronously affect multiple cortico-basal ganglia loops.
The remarkable breadth of the coherent striatal oscillationsresembles that of �-band oscillations in the parietal and frontalcortex (Murthy and Fetz, 1992). Oscillations in the � range areregularly recorded in the visual cortex and other posterior corti-cal sites (Singer, 1999). Because we recorded only from the ante-rior striatum, we could not determine whether striatal regionspreferentially related to the posterior neocortex exhibit similar�-range frequency oscillations.
Our findings for the striatum stand in contrast to those inwhich �-band oscillations (along with �6 Hz oscillatory activity)have been found only, or mainly, in dopamine-depleted parkin-sonian patients or animals (Bergman et al., 1998). This differencein results probably has a technical origin. We recorded simulta-neously from sets of electrodes at distributed striatal sites andrecorded LFPs as well as spike activity, conditions that shouldhave favored observation of the oscillatory activity (Singer, 1993;Fries et al., 2001). In the striatum of the anesthetized rat, sub-threshold fluctuations in membrane potential have been shownto display high synchrony among striatal neurons that neverthe-less fail to exhibit synchronous spike activity (Stern et al., 1998).Such subthreshold synchronies could contribute to the synchro-nous oscillations that we observed in behaving monkeys.
Our basal ganglia recordings in monkeys were concentrated inthe striatum, whereas basal ganglia studies implicating the par-kinsonian state as necessary for these rhythms have mainly fo-cused on the pallidum and the subthalamic nucleus (Raz et al.,2000; Brown et al., 2001; Levy et al., 2002). Under normal condi-tions, striatal influences on the pallidum could be masked bystrong excitatory input from the subthalamic nucleus, itselfdriven by strong excitatory inputs from the neocortex (Nambu etal., 2000). What we emphasize here is that 10 –25 Hz oscillationsdo occur in the primate striatum in the normal state, and theseare dynamically modulated during behavioral tasks.
The cellular origins of striatal oscillations could includestriatal interneurons and striatal afferentsIf the striatal LFP oscillations we recorded were entirely attribut-able to the activity of oscillatory spike activity in striatal neurons,we should have found evidence for these oscillations in the spik-ing patterns of most of the striatal neurons from which we re-corded. This was not so. Very few of the neurons had oscillatoryspike activity. However, more than half had spike activity that wassignificantly related to the 10 –25 Hz oscillations. Spike activityitself might not be producing the LFP oscillations, but the factthat the spikes of some putative interneurons as well as putativeprojection neurons exhibited a significant relationship to the LFPoscillations raises the possibility that intrastriatal network activitycontributes to the oscillatory activity (Graybiel et al., 1994;Aosaki et al., 1995; Raz et al., 1996).
An obvious possibility is that the �-band oscillations that werecorded in the striatum reflected the activity of cortical inputs tothe striatum. We did record simultaneously from the FEF and theoculomotor region of the striatum in the single-saccade task butdid not identify connected sites in the two structures; therefore,these findings were inconclusive. Other sources of the oscillationsinclude the intralaminar thalamus (Castro-Alamancos andConnors, 1997) and the pallidum and oscillating subthalamicnucleus–pallidum circuits (Plenz and Kitai, 1999; Bevan et al.,2002). Finally, the fact that the loss of dopamine so sharply in-creases oscillatory activity in both the striatum and the neocortexin parkinsonian models and modulates the multisecond rhythmsof the striatum suggests that dopamine systems contribute (Mon-taron et al., 1982; Ruskin et al., 1999; Goto and O’Donnell, 2001;Goldberg et al., 2002; Heimer et al., 2002; Wichmann et al., 2002).
Localized striatal sites with strong task-related activity pop inand out of synchronyOur results demonstrate that �-band oscillatory synchrony in thestriatum is subject to a form of modulation that is dynamic, re-lated to task performance, and spatially modular. We found thatsmall sites in the striatum could disengage from the synchronyand then return as the monkey made visually guided saccades toobtain reward. At such pop-out sites, there were clear perisac-cadic fluctuations in the raw field potentials and perisaccadespike activity. We did not delimit the size of the pop-out sites, butelectrodes separated by 2 mm could show departures in syn-chrony. This pattern suggests that the pop-out phenomenon re-flected the presence of local pockets of saccade-related activity.
One interesting possibility raised by our findings is that thefocal pockets in which we found pop-out correspond to modularanatomical arrangements of anatomical afferents in the oculo-motor zone of the primate striatum. Both the FEF and the SEFproject to the striatum in patchy distributions characterized byfocal, �1-mm-wide hotspots (Parthasarathy et al., 1992). Theseterminal zones overlap within the main FEF-recipient oculomo-tor zone, suggesting that there could be sufficient convergentinput at such sites to produce task-related spiking as well as sub-threshold activity in the recipient neurons (Parthasarathy et al.,1992). Such focal inputs (called input matrisomes) have beenshown to be capable of activating early-gene expression in corre-sponding clusters of striatal projection neurons (output matri-somes) in the sensorimotor striatum of monkeys (Parthasarathyand Graybiel, 1997), and matrisome-like microexcitable zoneshave also been demonstrated there (Alexander and DeLong,1985a,b; Updyke and Liles, 1987).
11750 • J. Neurosci., December 17, 2003 • 23(37):11741–11752 Courtemanche et al. • Striatal LFP Oscillations and Synchrony

�-band oscillatory activity in the striatum could act as adynamic filter to sharpen action–selection network activity inthe striatumHigh levels of synchrony in LFP �-band oscillations occurred inthe striatum both when the monkeys were out of task and whenthey were alert and holding fixation before target onset in thesaccade task. This suggests that in the attentive state without ac-tion, striatal output neurons can be subject to synchronizingwaves occurring every 50 – 60 msec. These may partly depolarizestriatal neurons or bring them to spike in a specific phase rela-tionship to the field oscillations across large parts of the striatum.As a working hypothesis, we suggest that this widespread �-bandsynchrony acts as a spatiotemporal filter that operates to sharpenaction–selection by cortico-basal ganglia networks.
Consider the result of activating corticostriatal inputs in thecontext of this synchronous background. Such corticostriatal in-puts tend to be distributed but to terminate in patchy foci (ma-trisomes). These focal inputs would have to overcome the gener-alized level of synchronous activation to achieve differentialactivation of striatal outputs. The LFP oscillations could act like athresholding mechanism: only if focal inputs exceed the level ofactivation imposed by the �-band oscillations would the corre-sponding projection neurons go into a bursty state capable ofaffecting their targets in the pallidum and substantia nigra. Stri-atal network neurons, including parvalbumin-containing neu-rons (Parthasarathy and Graybiel, 1997; Koos and Tepper, 1999)and TANs (Graybiel et al., 1994; Aosaki et al., 1995), could en-hance activation of these local pop-out states. It is because theinput– output organization of the striatum tends to be modularthat such a widespread field potential thresholding could be ef-fective. It would act to select the most intense foci of input fortransfer to output (projection neuron activation), because it is atsuch sites that the activation breaks through the synchrony. Ac-cording to this proposal, the pop-out sites we observed representsuch sites of breakthrough and would promote highly context-specific (probably cortically instructed) activity in striatal out-puts. The tendency for decrease in oscillatory content to occurduring the saccade task, by making synchrony less easy to attain,would facilitate breakthrough of localized task-related activity atsites engaged in the task. In our recordings, these patterns differ-entiated the resting state from the task state.
These breakthrough events in the striatum should, in turn,focally inhibit pallidal or nigral neurons, eventually disinhibitingthe selected action network of the thalamocortical (or nigrocol-licular) networks (Malach and Graybiel, 1986; Mink, 1996;Parthasarathy and Graybiel, 1997). Interestingly, during any sin-gle action–selection sequence, these events might be overshad-owed by the strongly excitatory “hyperdirect pathway” from theneocortex to the subthalamic nucleus (Nambu et al., 2002). How-ever, the breakthrough events could permit learning of particularaction–selection routines in cortico-basal ganglia circuits underconditions of repeated stimulation. Such learning has been pro-posed as a key function of cortico-basal ganglia circuits.
ReferencesAldridge JW, Gilman S (1991) The temporal structure of spike trains in the
primate basal ganglia: afferent regulation of bursting demonstrated withprecentral cerebral cortical ablation. Brain Res 543:123–138.
Alexander GE, DeLong MR (1985a) Microstimulation of the primate neos-triatum. I. Physiological properties of striatal microexcitable zones.J Neurophysiol 53:1401–1416.
Alexander GE, DeLong MR (1985b) Microstimulation of the primate neos-triatum. II. Somatotopic organization of striatal microexcitable zones and
their relation to neuronal response properties. J Neurophysiol53:1417–1430.
Aosaki T, Kimura M, Graybiel AM (1995) Temporal and spatial character-istics of tonically active neurons of the primate’s striatum. J Neurophysiol73:1234 –1252.
Baker SN, Olivier E, Lemon RN (1997) Coherent oscillations in monkeymotor cortex and hand muscle EMG show task-dependent modulation.J Physiol (Lond) 501:225–241.
Baker SN, Kilner JM, Pinches EM, Lemon RN (1999) The role of synchronyand oscillations in the motor output. Exp Brain Res 128:109 –117.
Bergman H, Feingold A, Nini A, Raz A, Slovin H, Abeles M, Vaadia E (1998)Physiological aspects of information processing in the basal ganglia ofnormal and parkinsonian primates. Trends Neurosci 21:32–38.
Bevan MD, Magill PJ, Hallworth NE, Bolam JP, Wilson CJ (2002) Regula-tion of the timing and pattern of action potential generation in rat sub-thalamic neurons in vitro by GABA-A IPSPs. J Neurophysiol87:1348 –1362.
Blazquez P, Fujii N, Kojima J, Graybiel AM (2002) A network representa-tion of response probability in the striatum. Neuron 33:973–982.
Brown P, Oliviero A, Mazzone P, Insola A, Tonali P, Di Lazzaro V (2001)Dopamine dependency of oscillations between subthalamic nucleus andpallidum in Parkinson’s disease. J Neurosci 21:1033–1038.
Castro-Alamancos MA, Connors BW (1997) Thalamocortical synapses.Prog Neurobiol 51:581– 606.
Courtemanche R, Fujii N, Graybiel AM (2001) Local field potential oscilla-tions in the awake macaque striatum. Soc Neurosci Abstr 31:67.63.
Courtemanche R, Pellerin JP, Lamarre Y (2002) Local field potential oscil-lations in primate cerebellar cortex: modulation during active and passiveexpectancy. J Neurophysiol 88:771–782.
Destexhe A, Contreras D, Steriade M (1999) Spatiotemporal analysis of lo-cal field potentials and unit discharges in cat cerebral cortex during nat-ural wake and sleep states. J Neurosci 19:4595– 4608.
Donoghue JP, Sanes JN, Hatsopoulos NG, Gaal G (1998) Neural dischargeand local field potential oscillations in primate motor cortex during vol-untary movements. J Neurophysiol 79:159 –173.
Engel AK, Fries P, Singer W (2001) Dynamic predictions: oscillations andsynchrony in top-down processing. Nat Rev Neurosci 2:704 –716.
Fries P, Reynolds JH, Rorie AE, Desimone R (2001) Modulation of oscilla-tory neuronal synchronization by selective visual attention. Science291:1560 –1563.
Fuchs AF, Robinson DA (1966) A method for measuring horizontal andvertical eye movement chronically in the monkey. J Appl Physiol21:1068 –1070.
Fujii N, Graybiel AM (2001) Contrasting neuronal activity during sequen-tial oculomotor behavior between lateral prefrontal cortex and frontal eyefield. Soc Neurosci Abstr 27:67.3.
Fujii N, Graybiel AM (2003) Representation of action sequence boundariesby macaque prefrontal cortical neurons. Science 301:1246 –1249.
Goldberg JA, Boraud T, Maraton S, Haber SN, Vaadia E, Bergman H (2002)Enhanced synchrony among primary motor cortex neurons in the1-methyl-4-phenyl-1,2,3,6-tetrahydropyridine primate model of Parkin-son’s disease. J Neurosci 22:4639 – 4653.
Goto Y, O’Donnell P (2001) Network synchrony in the nucleus accumbensin vivo. J Neurosci 21:4498 – 4504.
Graybiel AM, Aosaki T, Flaherty AW, Kimura M (1994) The basal gangliaand adaptive motor control. Science 265:1826 –1831.
Heimer G, Bar-Gad I, Goldberg JA, Bergman H (2002) Dopamine replace-ment therapy reverses abnormal synchronization of pallidal neurons inthe 1-methyl-4-phenyl-1,2,3,6-tetrahydropyridine primate model of par-kinsonism. J Neurosci 22:7850 –7855.
Hikosaka O, Sakamoto M, Usui S (1989) Functional properties of monkeycaudate neurons I. Activities related to saccadic eye movements. J Neuro-physiol 61:780 –798.
Ketchum KL, Haberly LB (1993) Membrane currents evoked by afferentfiber stimulation in rat piriform cortex. I. Current source-density analy-sis. J Neurophysiol 69:248 –260.
Koos T, Tepper JM (1999) Inhibitory control of neostriatal projection neu-rons by GABAergic interneurons. Nat Neurosci 2:467– 472.
Lamarre Y, Raynauld JP (1965) Rhythmic firing in the spontaneous activityof centrally located neurons: a method of analysis. ElectroencephalogrClin Neurophysiol 18:87–90.
Lang EJ, Sugihara I, Welsh JP, Llinas R (1999) Patterns of spontaneous pur-
Courtemanche et al. • Striatal LFP Oscillations and Synchrony J. Neurosci., December 17, 2003 • 23(37):11741–11752 • 11751

kinje cell complex spike activity in the awake rat. J Neurosci19:2728 –2739.
Lebedev MA, Nelson RJ (1995) Rhythmically firing (20 –50 Hz) neurons inmonkey primary somatosensory cortex: activity patterns during initiationof vibratory-cued hand movements. J Comput Neurosci 2:313–334.
Lebedev MA, Nelson RJ (1999) Rhythmically firing neostriatal neurons inmonkey: activity patterns during reaction-time hand movements. J Neu-rophysiol 82:1832–1842.
Lebedev MA, Wise SP (2000) Oscillations in the premotor cortex: single-unit activity from awake, behaving monkeys. Exp Brain Res 130:195–215.
Levy R, Hutchison WD, Lozano AM, Dostrovsky JO (2002) Synchronizedneuronal discharge in the basal ganglia of parkinsonian patients is limitedto oscillatory activity. J Neurosci 22:2855–2861.
MacKay WA (1997) Synchronized neuronal oscillations and their role inmotor processes. Trends Cogn Sci 1:176 –183.
Malach R, Graybiel AM (1986) Mosaic architecture of the somatic sensory-recipient sector of the cat’s striatum. J Neurosci 6:3436 –3458.
Marsden JF, Werhahn KJ, Ashby P, Rothwell J, Noachtar S, Brown P (2000)Organization of cortical activities related to movement in humans. J Neu-rosci 20:2307–2314.
Mink JW (1996) The basal ganglia: focused selection and inhibition of com-peting motor programs. Prog Neurobiol 50:381– 425.
Montaron MF, Bouyer JJ, Rougeul A, Buser P (1982) Ventral mesencephalictegmentum (VMT) controls electrocortical beta rhythms and associatedattentive behaviour in the cat. Behav Brain Res 6:129 –145.
Murthy VN, Fetz EE (1992) Coherent 25- to 35-Hz oscillations in the sen-sorimotor cortex of awake behaving monkeys. Proc Natl Acad Sci USA89:5670 –5674.
Murthy VN, Fetz EE (1996a) Oscillatory activity in sensorimotor cortex ofawake monkeys: synchronization of local field potentials and relation tobehavior. J Neurophysiol 76:3949 –3967.
Murthy VN, Fetz EE (1996b) Synchronization of neurons during local fieldpotential oscillations in sensorimotor cortex of awake monkeys. J Neuro-physiol 76:3968 –3982.
Nambu A, Tokuno H, Hamada I, Kita H, Imanishi M, Akazawa T, Ikeuchi Y,Hasegawa N (2000) Excitatory cortical inputs to pallidal neurons via thesubthalamic nucleus in the monkey. J Neurophysiol 84:289 –300.
Nambu A, Tokuno H, Takada M (2002) Functional significance of thecortico-subthalamo-pallidal “hyperdirect” pathway. Neurosci Res43:111–117.
Nini A, Feingold A, Slovin H, Bergman H (1995) Neurons in the globuspallidus do not show correlated activity in the normal monkey, but phase-locked oscillations appear in the MPTP model of parkinsonism. J Neuro-physiol 74:1800 –1805.
Parthasarathy HB, Graybiel AM (1997) Cortically driven immediate-earlygene expression reflects modular influence of sensorimotor cortex onidentified striatal neurons in the squirrel monkey. J Neurosci17:2477–2491.
Parthasarathy HB, Schall JD, Graybiel AM (1992) Distributed but conver-gent ordering of corticostriatal projections: analysis of the frontal eye fieldand the supplementary eye field in the macaque monkey. J Neurosci12:4468 – 4488.
Perez-Orive J, Mazor O, Turner GC, Cassenaer S, Wilson RI, Laurent G
(2002) Oscillations and sparsening of odor representations in the mush-room body. Science 297:359 –365.
Perkel DH, Gerstein GL, Moore GP (1967) Neuronal spike trains and sto-chastic point processes. I. The single spike train. Biophys J 7:391– 418.
Plenz D, Kitai ST (1999) A basal ganglia pacemaker formed by the subtha-lamic nucleus and external globus pallidus. Nature 400:677– 682.
Raz A, Feingold A, Zelanskaya V, Vaadia E, Bergman H (1996) Neuronalsynchronization of tonically active neurons in the striatum of normal andparkinsonian primates. J Neurophysiol 76:2083–2088.
Raz A, Vaadia E, Bergman H (2000) Firing patterns and correlations ofspontaneous discharge of pallidal neurons in the normal and the tremu-lous 1-methyl-4-phenyl-1,2,3,6-tetrahydropyridine vervet model of par-kinsonism. J Neurosci 20:8559 – 8571.
Raz A, Frechter-Mazar V, Feingold A, Abeles M, Vaadia E, Bergman H(2001) Activity of pallidal and striatal tonically active neurons is corre-lated in MPTP-treated monkeys but not in normal monkeys. J Neurosci21:RC128(1–5).
Ruskin DN, Bergstrom DA, Kaneoke Y, Patel BN, Twery MJ, Walters JR(1999) Multisecond oscillations in firing rate in the basal ganglia: robustmodulation by dopamine receptor activation and anesthesia. J Neuro-physiol 81:2046 –2055.
Salmelin R, Hari R (1994) Spatiotemporal characteristics of sensorimotorneuromagnetic rhythms related to thumb movement. Neuroscience60:537–550.
Sanes JN, Donoghue JP (1993) Oscillations in local field potentials of theprimate motor cortex during voluntary movement. Proc Natl Acad SciUSA 90:4470 – 4474.
Siapas AG, Wilson MA (1998) Coordinated interactions between hip-pocampal ripples and cortical spindles during slow-wave sleep. Neuron21:1123–1128.
Singer W (1993) Synchronization of cortical activity and its putative role ininformation processing and learning. Annu Rev Physiol 55:349 –374.
Singer W (1999) Neuronal synchrony: a versatile code for the definition ofrelations? Neuron 24:49 – 65.
Stern EA, Jaeger D, Wilson CJ (1998) Membrane potential synchrony ofsimultaneously recorded striatal spiny neurons in vivo. Nature394:475– 478.
Sugihara I, Lang EJ, Llinas R (1995) Serotonin modulation of inferior oli-vary oscillations and synchronicity: a multiple-electrode study in the ratcerebellum. Eur J Neurosci 7:521–534.
Terman D, Rubin JE, Yew AC, Wilson CJ (2002) Activity patterns in amodel for the subthalamopallidal network of the basal ganglia. J Neurosci22:2963–2976.
Torsvall L, Akerstedt T (1988) Extreme sleepiness: quantification of EOGand spectral EEG parameters. Int J Neurosci 38:435– 441.
Updyke BV, Liles SL (1987) The corticostriatal projection in cat: relationbetween axon terminals and evoked potentials. Brain Res 402:365–369.
Wichmann T, Kliem MA, Soares J (2002) Slow oscillatory discharge in theprimate basal ganglia. J Neurophysiol 87:1145–1148.
Williams D, Tijssen M, Van Bruggen G, Bosch A, Insola A, Di Lazzaro V,Mazzone P, Oliviero A, Quartarone A, Speelman H, Brown P (2002)Dopamine-dependent changes in the functional connectivity betweenbasal ganglia and cerebral cortex in humans. Brain 125:1558 –1569.
11752 • J. Neurosci., December 17, 2003 • 23(37):11741–11752 Courtemanche et al. • Striatal LFP Oscillations and Synchrony


![Bouyer Louis Palabra Iglesia y Sacramentos[1]](https://img.dokumen.tips/doc/110x75/577cd4501a28ab9e78982e44/bouyer-louis-palabra-iglesia-y-sacramentos1.jpg)