Embed Size (px)
Citation preview

Behavioral Predictors of University Administration Staff on the Observance of Code of Conduct Regulations: Centered on
TPB Model
Jhong Kyu Leeh*
Kongju National University
Abstract This paper aims to predict the compliance of national university
administrative staff in implementing code of conduct regulations by using the ‘theory of planned behavior’ (TPB). A survey was conducted using a questionnaire containing twenty three items. Samples were collected from public servants in national universities. A series of model tests were undertaken to identify model appropriateness by using reliability, tests of multi-collinearity, and other methods. To verify the established hypotheses, multi-regression analysis was used to measure intention as the dependent variable, and attitude, subjective norm and perceived behavioral control as independent variables. Testing revealed a positive direction for most variables in compliance with the code of conduct regulations and attitude as a discernible variable with significant impact on behavioral change in the model. Among beliefs of attitude items, pride and diffusion in compliance with the code of conduct were evident. The research findings suggest the importance of training and experience to encourage public servants' observance of code of conduct regulations. Also recommend is to link code of conduct regulations with CPI measurements under considerations of TPB by drawing on the findings of this study.

2 THE SNU JOURNAL OF EDUCATION RESEARCH
Keywords: theory of planned behavior, intention, attitude, subjective norm, perceived behavioral control
I. Introduction This paper aims to predict the behavior of university
administration staff regarding adherence to code of conduct regulations. The significance of this study lies in the first attempt to measure the behavioral traits of university administration staff when following code of conduct regulations. The code of conduct regulations for most Korean national universities is based on six chapters and includes twenty four clauses of public official regulations. The chapter subjects are 1) a general overview, 2) performing justifiable duty, 3) prohibitions regarding giving and taking false revenue, 4) building a wholesome public service climate, 5) taking measures when staff members violate regulations, and 6) supplementary rules (Ministry of Education, 2013, pp. 1-11). This study investigates the execution of observance of code of conduct regulations in relation to ‘the expenditure for congratulations and condolences’ (hereinafter ECC), in which it is easier to get a reliable response from the respondent than questioning officials about other aspects of the code of conduct because it is a common cultural practice in Korean society and not exclusively seen as a bribe by most average citizens. The regulations concerning the ECC are in the Chapter 4 of code of conduct. ECC-related code of conduct regulations in the national university is regulated in two ways as notice of ECC and the giving and taking of ECC. It could be changed in accordance with the degree of social development; however, ECC has been regulated to be no more than the sum of KRW50, 000 since the last decade in Korean national universities (Article 17 Clause 2, Pusan National University1, 2006. P.6). The selection of ECC as a research object is to get a more accurate response in the survey because ECC is considerably small
1 Most of National and Public universities have similar regulations on codes of conduct in accordance with the standing rule of the Ministry of Education, Republic of Korea.

Behavioral Predictors of University Administration Staff ~ 3
money and even if respondents violate the limit, such violations do not have as great an influence as the respondent’s feelings of guilt, as ECC is different from an outright bribe. Considering the premise that ECC in the code of conduct is generally observed, then other regulations might be as well; therefore, this study is trying to estimate ECC observance behavior.
The study adopted ‘theory of planned behavior (hereinafter TPB)’ in this study. TPB was developed from theory of reasoned action (hereinafter TRA) model. TRA was introduced by by Ajzen and Fishbein (1975). Derived from social psychology, the TRA as proposed by Ajzen and Fishbein (1975, 1980) details three components of TRA that are general constructs: behavioral intention (BI), attitude (A), and the subjective norm (SN). TRA suggests that a person's behavioral intention depends on that person's attitude about their behavior in relation to subjective norms (BI = A + SN). If a person intends to do a behavior then it is likely that the person will do it. The TPB was proposed by Ajzen (1985). The theory was developed from the TRA while including perceived behavioral control. TPB is used to predict a person’s behavior and to study formative behavioral change. This study also intends to understand a person’s formative behavioral changes in the context of this research and data.
A. Background The Corruption Perceptions Index (CPI) announced by
Transparency International (TI) indicates that a country’s GDP or degree of advancement has a strong correlation with a nation’s transparent operations. In 2011, Korea’s CPI ranked 43 among 103 countries with scores of 5.4 on a scale of 10 (with 10 being completely transparent). Since 2008 when Korea scored a high of 5.6, it has shown continual decline or has remained the same (Anti-Corruption and Civil Rights Commission, 2011, p. 4). The dilemma Korea faces is that its economic size is ranked 10th internationally but its CPI has remained below the top 40. Korea, one of the G20 countries, is now faced with cutting cost, increased transaction costs, and issues of government trustfulness to ensure international competitiveness in a knowledge-

4 THE SNU JOURNAL OF EDUCATION RESEARCH
based international economy. If bribes exist, and distort market transaction structure, the cost
induced in such an environment might be transferred to nations as final consumers and then thus it eventually reduces government efficiency and trustworthiness (ibid, p. 2). Today, public servants’ corruption is measured by their observation of code of conduct regulations. Code of conduct regulations are defined as standard codes for organization values, core contents and procedures. The necessity of code of conduct regulations was because they address the possibility of corruption, ensure ethics and promotion of government reliability, reduce transaction costs, and build cost-saving and efficient systems in central government, local government, schools, enterprises and other organizations. Lee (2014) views corruption as difficult to control only through a ‘hard law’ system but can be easily regulated by ‘soft law,’ which is based on the volunteerism of individuals (p. 51). The term ‘soft law’ is often used to describe various kinds of quasi-legal instruments of the European Union or the United Nations, to include ‘codes of conduct,’ ‘guidelines,’ ‘communications,’ and others. Soft law is not as binding as ‘hard law,’ but still act as rules of conduct through indirect influence. Enforcing ‘hard law’ has limitation for securing transparency as the first resort to addressing anti-corruption.
According to Lee (2012), the size of national territory, amount of natural resources, and economic size are not the only standards for determining how advanced are national economies. When a country’s ethical standards are high, other countries wish to look to it as a benchmarking model and people are eager to visit such a just and transparent country and prefer to buy products the country manufactures. From the background discussion above, this research aims to predict observance of behavior concerning code of conduct regulations and offer suggestions to improve compliance.
The Corruption Perceptions Index (CPI) of Korean national and public institutions was introduced in 2002. National and public institutions include the central government and local authorities, including local education authorities as well as public service-related organizations. The CPI evaluation of 35 national and public universities was implemented as a part of a Ministry of Education initiative, but

Behavioral Predictors of University Administration Staff ~ 5
universities have been evaluated separately since 2012 in accordance with the national policy of the Korean Anti-Corruption and Civil Rights Commission. (Table 1) shows that the CPI of national and public universities had a lower tendency compared to national and public organizations in its initial stage of its implementation; however, the CPI was rose by 0.52 points from 2012 to 2013 but then drops by 1.60 points in 2014 (Anti-Corruption and Civil Rights Commission. 2012a, 2013a, 2014a). The reason for this dramatic decline was due to the use of a school supporting association fund to provide allowances and welfare to professors and administration staff that were previously regarded as invalidated by authority.
Table 1. CPI of National and Public Institutions, National and Public Universities
Source: Anti-Corruption and Civil Rights Commission (2012a, 2012b, 2013a, 2013b,
2014a, 2014b, 2015).
The CPI of national and public universities is comparatively
lower than other national and public organizations, and more volatile. With this critical difference in mind, the rationale of this study is to find the significant behavioral elements affecting the CPI and draw upon positive behavioral change from them. If we look at the details of the CPI of national and public universities in (Table 2), CPI is divided into two parts: contracts and research and administration.
Institutions Number of institutions
Comprehensive CPI 2012 2013 2014 2015
National and public institutions 640 7.86 7.86 7.78 7.89
National and public universities 35 6.84 7.36 5.67 NA

6 THE SNU JOURNAL OF EDUCATION RESEARCH
Table 2. Structure of CPI, National and Public Universities
Institutions Number of institutions
Comprehensive CPI 2012 2013 2014 2015
Comprehensive CPI 35 6.84 7.36 5.67 NA CPI of Contracts 35 7.22 9.03 8.88 NA CPI of Research and Administration
35 5.38 6.98 6.51 NA
Source: Anti-Corruption and Civil Rights Commission (2012a, 2013a, 2014a).
Contracts concern the general affairs of administrators, and research and administration address the affairs of professors and teaching and research assistants. The CPI volatile pattern is similar in both parts. This study was undertaken by first focusing on general administrators as the first phase of study on the national and public universities.
B. Literature Review on Change and Research Model Regarding changing human behavior, Rogers (1962) analyzed 500
articles and suggested a ‘social interactive model’ which explains an individual’s accepting and deciding on behavioral change. Leeh (2002) summarizes that the ‘social interactive model’ emphasizes the concepts of diffusion necessary to link communication between persons (p. 47). At this stage, the study of initial resistance and a thematic study on promotional factors for change were expanded. The adoption or rejection of new ideas was perceived to be ideographic in nature and strategies evolved which sought to change the potential adopter’s attitudes to increase the individual's receptivity towards innovation and change and to minimize resistive factors. In the same period, Hall and Loucks (1981) studied the change agent, a facilitator regarded as an expert who could be called in to consult and give advice to practitioners. After 1974, research refocused on the study of implementation. In a review of the literature, Loucks and Lieberman (1983, Leeh, 2002, p. 48) report that implementation - the putting into practice of an idea, curriculum or set of activities new to the individual or organization

Behavioral Predictors of University Administration Staff ~ 7
using it - has been a major concern of the last ten years. However, Loucks and Lieberman (1983) noted that findings were inconclusive and contradictory. Carter (1986, pp. 33-34), Fullan (1981), and Heck and Goldstein (1980), make reference to two contemporary approaches which have been discerned with respect to the study of implementation. One is labeled as relatively structured, while the other is labeled as relatively unstructured.
A knowledge utilization model suggested by Chin (1967, pp. 323-333) and MacGuire (1970, p. 11) developed into the research, development and diffusion model (Clarke & Guba, 1965), the Social Interaction Model (Rogers & Shoemaker, 1971), problem solving model (Bennis, Benne & Chin, 1969) and linkage model (Havelock, 1973). A number of studies on the facilitators for, and barriers to, change have been undertaken over the years. Berman and McLaughlin (1980, pp. 57-71), Glaser (1973, p. 439), Zaltman, Florio and Sikorski (1977, p. 26) describe facilitators and barriers to change in society at large in terms of four dimensions: cultural, social, organizational, and psychological. Several models have been proposed for measuring the degree of implementation for innovation and have been reviewed by Revicki and Rubin (1981) and Zaltman, Florio and Sikorski (1977). These are the complete implementation model (Alkin 1961); the direct observation model (Stallings, 1975); the a victory model (National Institute of Mental Health, 1971); the concerns based adoption model (Hall, Loucks, Rutherford & Newlove, 1975); structural equation models (Churchman, 1979); multiple matrix sampling and repeated measurements (Newfield, 1980) and the theory of reasoned action(Ajzen & Fishbein, 1980). The above models have attempted to explain the behavioral changes of individuals and organizations. Among them, the Theory of Reasoned Action model is considered superior in its rationality because of its theoretical combination of variables and acute predictive power. Bilic (2005) argues that TPB is considered to be one of the most effective and most influential theories for the prediction of different types of behavior (p. 243, Armitage & Conner, 2001; Hagger, Chatzisarantis & Biddle, 2002; Perugini & Bagozzi, 2001; Rivis & Sheeran, 2003). Bilic (2005) also assert that Meta analyses of relevant studies show that TPB can successfully

8 THE SNU JOURNAL OF EDUCATION RESEARCH
accout for a variety of behaviors (pp. 244-245). More precisely, the three major determinants (attitude, subjective norm and perceived control) can predict 39-42% of the varance in intention formation (Armitage & Conner, 2001; Gordin & Kok, 1996; Sheeran & Taylor, 1999). In addition, Elliott, Armitage, and Baughan (2003, p. 964) as well as Sheeran, Conner and Norman (2001) claimed that the TPB is a complete theory in the sense that the effects of those variables that are external to the model are actually mediated by its components (pp. 12-13).
1. Theory of reasoned action (TRA)
Ajzen and Fishbein’s (1975, 1980) theory of reasoned action (TRA), which is illustrated in【Figure 1】asserts that a person’s intention influences overt behavior.
Where the person’s overt action (B), generally measured by self-reporting, is a function of the intention (I) or willingness to perform the behavior. Formally, it can be described as presented in equation (1): B ≈ I................................................................................................... (1)
Source: Albarracín, Johnson, Fishbein & Muellerleile (2001, p. 143)
Figure 1. Theory of Reasoned action model
Σnbj x mj: sum of normative beliefs x motivation to comply (indirect norm) Σbi x ei: sum of beliefs x evaluation (indirect beliefs)

Behavioral Predictors of University Administration Staff ~ 9
TRA explains that a person’s behavioral intention relies on the person’s attitude about the behavior and subjective norms. Attitude is the degree to which one has a positive versus a negative evaluation of the behavior and is typically measured by a set of bipolar semantic differential scales (e.g. unpleasant-pleasant unwise-wise, bad-good). The subjective norm is the perception that what others think is important and influences whether one should or should not perform the behaviors in question. The subjective norm is typically measured by items using such language as, “People who are important to me think I should adhere to the code of conduct.”
Formally, it can be described as presented in equation (2):
I ≈ ABwi + SNBw2 ............................................................................... (2) Where I is the intention to perform behavior B, ABwi is the attitude concerning behavior B, SNB is the subjective norm concerning behavior B, and W1 and W2 are weights for AB and SNB, respectively.
Eagly and Chaiken (1993) explain that intention is driven by the attitude toward the behavior, and attitude is assumed to be a function of one’s beliefs that performing the behavior in question will lead to various outcomes to include the evaluative aspects of those beliefs (p. 168). An estimate of attitude is obtained by weighting each salient belief that the outcome will occur (bi,i=1,..., p) by the evaluative implication of that outcome (ei,i =1,...p). Formally, equation (3) presents the components of attitude:
............................................................................(3)
Where AB is the attitude toward performing behavior B, biis the strength of the belief that performing behavior B will lead to outcome i, eiis the evaluation of outcome i, and p is the number of salient outcomes. The Σbiei term is denoted as an indirect attitude.
The subjective norm is derived by a set of salient beliefs about the normative prescriptions of specific referents, weighted by the

10 THE SNU JOURNAL OF EDUCATION RESEARCH
motivation to comply with each of those referents. Thus, equation (4) presents the components of the subjective norm:
..................................................................................(4)
Where SNB is the subjective norm toward behavior B, nbj is the normative belief that referent j thinks the respondent should or should not perform the behavior, mj is the motivation to comply with referent j, and q is the number of referents.
2. Theory of planned behavior (TPB).
Although the TRA typically provides an explanationof volitional behaviors, Ajzen (1985) added the variables of perceived behavior control to predict intentions and behaviors that are not completely under volitional control as depicted in Figure (2) (Albarracín et al., 2001, p. 143).
Perceived behavior control is one’s perception of control over the behavior. It is assumed to reflect the obstacles that one encountered in past behavioral performances. With the inclusion of this new variable, Ajzen’s TPB came to propose more comprehensive variables with perceived behavioral control. This is presented in equation (5):
B ≈ I + PBC................................................................................... (5) Where B is the behavior, I is intention, and PBC is the perceived behavioral control.
In order to predict targeted behaviors, the perceived behavioral control is assumed to influence a person’s intention to follow code of conduct regulations as depicted in equation (6). The equation means that people with higher perceived behavioral control are more likely to form intentions to perform a particular action than those who perceive that they have little or no control. Formally, it can be described as equation (6):
I≈ AB + SNB + PBC.................................................................... (6)

Behavioral Predictors of University Administration Staff ~ 11
Where I is intention, AB is attitude toward behavior, SNB is subjective norm toward behavior, and PBC is perceived behavioral control.
Source: Albarracín et al. (2001, p. 143).
Figure 2.Theory of Planned Behavior (TPB)
∑ nbj x mj = sum of normative beliefs multiplied by the motivation to comply (indirect norm) ∑ bi x ei = sum of beliefs multiplied by evaluations (indirect attitudes)
The reason for the acceptance of TPB in this study is that TPB is a very logical and plausible model in measuring substantial change toward specific behaviors theoretically and practically, and it has already been successfully applied to a wide range of diverse behavior studies based on the verified evidence of numerous other studies. For example, there are many studies using TPB, such as condom use studies (Albarracín et al., 2001), self-efficacy (Ajzen, 2002a), exercise promotion (Godin, 1994), IT usage (Taylor & Todd, 1995) and others.
Reinecke et al. (1996) explain that as in the theory of reasoned action, a key factor in the theory of planned behavior is the individual’s intention to perform a given behavior. They provide a further description in relation to the intention as follows:
“Intentions are assumed to capture the motivational factors that influence a behavior; they are indications of how hard people are willing to try, of how much of an effort they are planning to exert, in order to perform the behavior. The theory postulates three conceptually independent determinants of

12 THE SNU JOURNAL OF EDUCATION RESEARCH
intention. The first is the attitude toward the behavior and refers to the degree to which the person has a favorable or unfavorable evaluation of the behavior in question. The second predictor is a social factor termed subjective norm; it refers to the perceived social pressure to perform or not to perform the behavior. The third and novel antecedent of intention, which was not part of the theory of reasoned action, is the degree of perceived behavioral control. This factor refers to the perceived ease or difficulty of performing the behavior, and obstacles. As a general rule, the more favorable the attitude and subjective norm with respect to a behavior, and the greater the perceived behavioral control, the stronger should be an individual’s intention to perform the behavior under consideration. Intention, in turn, is viewed as one immediate antecedent of actual behavior. That is, the stronger people’s intentions to engage in a behavior or to achieve their behavioral goals, the more successful they are predicted to be. However, the degree of success will depend not only on one’s desire or intention, but also on such partly nonmotivational factors as availability of requisite opportunities and resources (e.g., time, money, skills, cooperation of others, and so forth; …). Collectively, these factors represent people’s actual control over the behavior. To the extent that a person has the required opportunities and resources, and intends to perform the behavior, he or she should succeed in doing so” (pp. 751-752).
Reinecke et al. (1996, p. 753) also go on the validation of the
planned behavior model by taking studies on the theory of planned behavior on its accountability for intentions and behaviors in various domains.
“Note that the predictors in the theory of planned behavior are assumed to be sufficient to account for intentions and actions, but that they are not all necessary in any given application. The relative importance of attitude, subjective norm, and perceived

Behavioral Predictors of University Administration Staff ~ 13
control in the prediction of intention, and the relative importance of intention and perceived behavioral control in the prediction of behavior are expected to vary across behaviors and populations. Thus, in some applications, it may be found that only attitudes have a significant impact on intentions; in still others, that all three predictors make attitudes and perceived behavioral control are sufficient to account for intentions; and in still others, that all three predictors make independent contributions. Similarly, to predict behavior, it may sometimes be sufficient to consider only intentions while in other instances intentions, as well as perceptions of behavioral control may be needed. Studies testing the theory of planned behavior have provided support for its ability to account for intentions and behaviors in various domains. Moreover, in virtually every case, inclusion of perceived behavioral control is found to significantly improve prediction of intentions, and, in many instances, also predict of behavior (e.g. Ajzen & Driver, 1992; Ajzen & Madden, 1986; Beale & Manstead, 1991; Doll & Ajzen, 1992; Godin, Valois, LePage, & Desharnais, 1992; Madden, Ellen, & Ajzen, 1992; Netemeyer, Burton, & Johnston, 1991; Schifter & Ajen, 1985; Van Ryn & Vinokur, 1992)”(p.753).
II. Method
A. Definition of Behavior to be measured Fishbein (1967) argues that employing a correct definition
beforehand toward a specific behavior is essential in the research. The measurement object as a substantial behavior in this study is whether the standard sum of money (KRW50,000: approximately US$50) prescribed in the code of conduct regulations is adhered to or not when congratulations or condolences ceremonies occur and the ECC (the expenditure for congratulations and condolences) is given and taken between colleagues. To estimate specific behavior using the TPB

14 THE SNU JOURNAL OF EDUCATION RESEARCH
framework, the target behavior should be defined carefully. Such a definition should consider ‘what’ (which kind of behavior), ‘who’ (target person), ‘where’ (context), and ‘when’ (time). Francis, Johnston, Eccles, Grimshaw, and Kaner (2004b) named these elemental definitions with the useful acronym of TACT (target, action, context, and time). This study defined specific behaviors by employing the principle of TACT (p. 44).
An attitude toward a specific behavior is measured by corresponding positive or negative judgments about each feature of the behavior: ‘If I do this behavior what would happen?’ The strength of an attitude is measured by the evaluation of the beliefs about the consequences of the behavior: ‘is the result of this behavior desirable or not?’ Subjective norms are a person’s own estimate of the social pressure to perform or not perform the target behavior, and these norms are assumed to have two components which work in interaction: beliefs about how other people, who may in some way be important to the person, would like that person to behave (Francis et al., 2004b, p. 9).The perceived behavioral control is the extent to which a person feels able to engage in the behavior. It is measured by asking two questions: 1) how much control over the behavior does a person have, and 2) how confident does that person feels about being able to perform or not perform the behavior? In the measure of intention as an independent variable, intention related to three generalized questions was asked directly. The reason for using three questions in the survey was to check the internal consistency among the items.
B. Hypotheses
In this study, the hypotheses are follows: First, the behavior direction when one delivers the ‘expenditure for
congratulations and condolences’ (ECC) can be presented thus: H0: Hintention = Hattitude = Hsubjective norm = Hperceived control< 0 This hypothesis is an attempt to determine whether the direction of behavior is positive or negative.
Second, what are the influential predictors in delivering ECC for colleagues?

Behavioral Predictors of University Administration Staff ~ 15
Yintention = α + β1Xattitude + β2Xsubjective norm + β3Xperceived control + ε, H0: β1 = β2 = β3 = 0 This hypothesis is employed to identify which variables are the strongest predictors of the impact of behavioral change, as the TPB model is commonly used to explain behavioral changes by utilizing the most relevant situational variables.
The third hypothesis is a kind of working hypothesis according to the results of second hypothesis, seeking salient items from the influence predictors. It investigates the salient beliefs from the testified predictors with measurably significant influence. Yintention = α+β1X variable item1+β2X variable item2+β3X variable item3+β4X variable item4
+ ···+εt
H0: β1 = β2 = β3 = β4 = 0 This hypothesis is used to try to uncover which representative traits have the greatest impact by disaggregating significant variables related to behavioral changes.
C. Participants
Participants in the study are public servants who are administrative staff working at national universities in South Korea. Two hundred packages of survey questionnaires were sent to three universities and the target return ratio was 50%. According to Francis, Eccles, Johnston, Walker, Grimshaw, Foy, Kaner, Smith, & Bonetti (2004a), Everett (1996) argues that size of samples to get any significant results must be designed with the goals of achieving sufficiency and appropriateness, and, Cohen (1988) asserts that at least 80 participants are ideal for TPB studies (p. 29). To avoid non response bias, the questionnaire was stabilized by undertaking several pretests; a response time of three months was allotted so as not rush respondents; letters of reminder were sent out twice to respondents who were informed of the confidentiality of their responses. In spite these steps, the response rate was less than 50 percent; therefore, there may be some criticism of the findings due to a failure to secure a larger number of responses.

16 THE SNU JOURNAL OF EDUCATION RESEARCH
D. Instrument (Survey) and Measurement Method To apply the TPB to actual cases, we need to know the degree of
the values of intention, attitude, subjective norm, and perceived behavioral control, and also we need to measure the strength of each variable and the overall calculation of the evaluation values consecutively. To calculate these values we used survey questionnaires. There are three methods for this calculation: direct measurement, indirect measurement, and scenario survey technique. Francis et al. (2004a) describe ways of direct measurement and indirect measurement as follows (pp. 13-16).
1. Direct measurement. Direct measurement involves the use of bipolar adjectives (i.e.
pairs of opposites) that are evaluative (e.g. good – bad). Referring a patient with acute lower back pain for x-ray is (Francis et al. 2004a, p.13) harmful 1 2 3 4 5 6 7 beneficial; positive endpoint good 1 2 3 4 5 6 7 bad; negative endpoint
The mixture of positive and negative endpoints is a way of confirming to minimize the risk of invalid answers in the ‘response set,’ or a tendency to answer questionnaire items in the same way regardless of their content. The mixing of negative and positive endpoint data should be input in a consistent way when the scores are calculated. The method of scale score calculation is decided by summing up selected scales by item. Only the intention, the most proxy estimator of behavior, was measured through the direct measurement approach. Attitude, subjective norm, and perceived behavioral control variables were measured by using an indirect approach, which is a way of calculating the interaction values (multiples) by measuring salient beliefs of each variable and evaluating the degree of those beliefs.
2. Indirect measurement. The indirect measurement approach is a way of evaluating the

Behavioral Predictors of University Administration Staff ~ 17
degree of the positive or negative strength toward a certain belief or attitude. We can take an example in the case of attitude measurement. Indirect measurement is composed of a pair of questions; one asking the strength of belief toward a certain event and the other asking the outcome of an evaluation about the event, and then calculating the scores by multiplying the strength of the belief and evaluation outcome.
1. If I check the blood pressure of the patient, I think that I do a positive thing for the patient.
Strongly disagree 1 2 3 4 5 ⑥ 7 strongly agree 2. If I check the blood pressure of the patient, I can see the patient one more time.
Strongly disagree 1 2 3 4 5 ⑥ 7 strongly agree
3. Doing something positive for the patient is:
Extremely undesirable -3 -2 -1 0 +1 +2 +③ Extremely desirable 4. Having to see some patients more often is:
Extremely undesirable -3 -②-1 0 +1 +2 +3 Extremely desirable
The total attitude score is calculated as A =(item1 x item3)+(item2 x item4)= (6x +3) + (6x -2) = (+18) +(-12) = +6 Because there are two items, the possible range of total attitude scores is (7 x ±3) x 2 = +42 to –42, Thus, the attitude score of the participants shows a positive direction.
Sources: Francis et al., (2004a. P. 16).
A pilot test of these items was conducted by asking three
respondents to answer the questions and ask whether they had any difficulty answering them. If necessary, the initial questionnaire’s wording of the questions was modified. The direction of some items was changed for both extremes of the bipolar 7-point scales to test the consistency of the respondents’ answers. The questionnaire is depicted in (Table 3) in consideration of the above revisions.
Scales were arranged by the definition of the model with three independent variables (beliefs of attitude, subjective norm, and

18 THE SNU JOURNAL OF EDUCATION RESEARCH
perceived behavioral control) which were measured on seven point unipolar scales, and the degree of compliance and influence evaluation were measured on seven-point bipolar scales (-3~+3).
Table 3. Structure of Questionnaire
Items no. (27 items)
Measurement methods
Contents Scales (7 scores)
Scales placement order dir
ect indirect others
1~3 (6) ○ background question - -
4~6 (3) ○ measurement of intention unipolar
scale normal placement
7~10 (4) ○ attitude (belief) unipolar
scale normal placement
11~14 (4) ○ attitude (evaluation
outcome) bipolar scale
normal placement
15~17 (3) ○ subjective
norm (belief) bipolar scale
normal placement
18~20 (3) ○ subjective
norm
(evaluation of the degree of compliance)
unipolar scale
normal placement
21~23 (3) ○ Perceived
control (belief) unipolar scale
reverse placement (one item)
24~26 (3) ○ Perceived
control (influence evaluation)
bipolar scale
normal placement
27 (1) ○ barriers of behavior free
description
In the case of bipolar scales in the questionnaire, it is not presented
as a bipolar scale but only presented as unipolar. The reason is to prevent any minor change in respondents’ answers in the face of different scales emerging and encouraging respondents to answer based on his/her candid feeling, and also to keep out the tendency to choose neutral answers in the items with bipolar scales. The subject and verb uses were consistently maintained among the sentences adopted in the three kinds of categories in the components of the questionnaire as much as possible. The model of the survey is formative and also evaluative because it assumes the predictability of behavioral changes and also uses indirect measurement techniques to evaluate the degree of the respondent’s positive or negative inclination towards a certain

Behavioral Predictors of University Administration Staff ~ 19
belief or attitude. The strength of this model is in its ability to elicit answers about real behavioral change in the course of measurement, as well as behavioral estimation. In application of the model through survey, direct measurement can be used to estimate a direction of behavior by calculating respondents’ answers or can be used as input for a multi-regression model to analyze the answers, but in the case of indirect measurement, the interplay between items should be considered. Items number 7 and 10 are beliefs based on attitudes, and Items number 11 and 14 correspond with numbers7 and 10; therefore, to evaluate the interaction of the degree of strength in attitude and the outcome evaluation of attitude, each corresponding item’s score must be multiplied. Average scores of attitude equal: (scores of Item7 x scores of Item11) + (scores of Item8 x scores of Item12) + (............)] ÷4.
In this way of calculating scores, Francis et al. (2004b) argue that this process is rather a weighting process on the beliefs that form attitudes rather than an interaction process (p. 56). The weighted scores can be summed up respectively, or by using correlation analysis between variables to predict behavior, or by using a multi-regression model and analysis to identify the contribution of weighted scores of each belief on attitude, subjective norm, and perceived behavior control.
III. Result
The survey was preceded from July 2012 to Sep. 2012 and
respondent rate was 41.5% among 200 questionnaire packs distributed. The scales of the item arranged reversely was recorded and input consistently with normal items. SPSS12.0 was used to analyze the data. Frequency data from the analysis is as follows.
A. Frequency There were 55 men (67.1%) and 27 women (32.9%) who
responded for the bio-sexual analysis, 19 married (23.2%) and 63 unmarried (76.8%). There was 1 high school graduate (4%), 60

20 THE SNU JOURNAL OF EDUCATION RESEARCH
undergraduates (73.2%), and 18 who had attended or completed graduate school (22%). In the analysis of the length of career, 36 had worked between 1 and 10 years (43.9%), 22 had worked between10 to 20 (26.8%), 21 had worked between 20 to 30 years (25.6%), and 3 had worked for more than 30 years (3.7%). In the analysis of the average number of times staff made ECC, two times a month was the most frequent response and then once a month was next. The average sum of ECC per event was KRW30, 000 (approximately USD30) for thirty six respondents (43.9%), and KRW50, 000 was given as an answer by forty five (54.9%). Whether respondents knew the ECC in the code of conduct cannot exceed KRW50, 000 or not was asked and 75 (91.5%) respondents were familiar with the regulation and those who did not know numbered 7 (8.5%). Finally, the unstructured question of, ‘Do you feel difficulty to deliver ECC as KRW50, 000 because of adherence to the code of conduct?’ was asked to describe the reasons? The results denote that in accordance with familiarity between the giver and recipient, the sum of ECC increased sometimes and even violated the limit of KRW50, 000on certain occasions.
B. Reliability
To test the internal consistency of the questionnaire a Cronbach α-test was undertaken. The reliability test used the Cronbach α coefficient which was produced from the correlation analysis between survey items as depicted in (7). Cronbach α was produced as follows:
.......................................................................(7)
k: number of items, σ2y: total variance, σ2
i: each item variance A statistics of reliability test on 82 respondent questionnaires produced a Cronbach α of 0.955 as presented in (Table 4), which shows a comparatively high degree of reliability beyond 0.6 (Francis et al., 2004) as an evaluation criteria (p. 30).

Behavioral Predictors of University Administration Staff ~ 21
Table 4. Statistics of Reliability Test
Cronbach α Numbers of items Evaluation criteria Other
N=82 .955 23 Cronbach α>0.6
C. Direction of Behavior (Test of Hypothesis 1) The average value of intention, attitude, subjective norm and
perceived behavioral control is slightly positive centered on the middle point of our scales. In other words, the respondent’s answers represent a positive direction of intention, attitude, subjective norm and perceived behavioral control values. The number 4 point is the central point on our 7-point scales and outcomes all show a positive direction with more than 4.0 as detailed in (Table 5). Particularly, attitude values produced the highest values.
Table 5. Behavior Direction (Average Values of Variables)
Direct measure Indirect measure
Case intention attitude subjective
norm perceived behavioral control
Average 5.0 9.7 5.6 5.2 N=82
These kinds of outcomes from the indirect measurement of attitude, subjective norm and perceived behavioral control values do not tell us the behavior direction directly because outcomes from indirect measurement are the results of interaction, which means a calculation of multiplying the strength of the belief of each variable and an evaluation of the outcome.
For example, the average value of attitude was calculated from the following process: average value of attitude=[(respondent score onItem7 x respondent score onItem11)+(respondent score onItem8 x respondent score onItem12)+(............)]÷4.
If we look at (Table 6), the value of indirect measurement is the scores of multiplying the variable values(intention, attitude, subjective norm, and perceived behavioral control) with scales of one to seven,

22 THE SNU JOURNAL OF EDUCATION RESEARCH
and the corresponding evaluative bipolar scale (-3~+3) with the above variables. If the value of interaction is zero, then it is a neutral point, but at least the positive value is 5.0, as we can see in (Table 6).
Values from attitude, subjective norm, and perceived behavioral control variables are presenting a positive direction by showing over 5.0.
Table 6. Interaction Value from Indirect Measurement
Variable scale (a) 1 2 3 4 5 6 7 Evaluative scale (b) -3 -2 -1 0 1 2 3 Interaction value (a x b)
5 (the least positive value beyond neutral point) x 1(the least average value beyond 0)
D. Influential Factors for Behavior (Test of Hypothesis 2) Behavior was predicted by using regression analysis taking the
intention value from direct measurement, and attitude, subjective norm, and perceived behavioral control values from indirect measurement. To calculate the indirect measurement value in the case of attitude, the strength of belief multiplied by the outcome of evaluation, after adding all of the attitude items and after producing average scores, then this value was confirmed as a variable for analysis.
Outcome of model test: AJt=3.440 +0.548β1+0.096β2+0.162β3 R2=0.564, ** P<0.001
This analysis presents an outcome that only attitude is an
influential factor for behavioral change as depicted in (Table7). The t-value on the 0.548 β coefficient of attitude is 4.207 with a significant level of P<0.000, which lets us know that only attitude is an influential factor for explaining intention.
Behavioral Predictors of University Administration Staff ~ 23
Table 7. Statistics of Regression
Model
Unstandardized coefficient Standardized
coefficient t-test Significance Β Standard
error (Constant) 3.440 .228 15.063 .000 Attitude .132 .031 .548 4.207 .000** Subjective norm .021 .026 .096 .777 .439
Perceived behavioral control
.040 .027 .162 1.485 .142
N=82, ** P<0.001
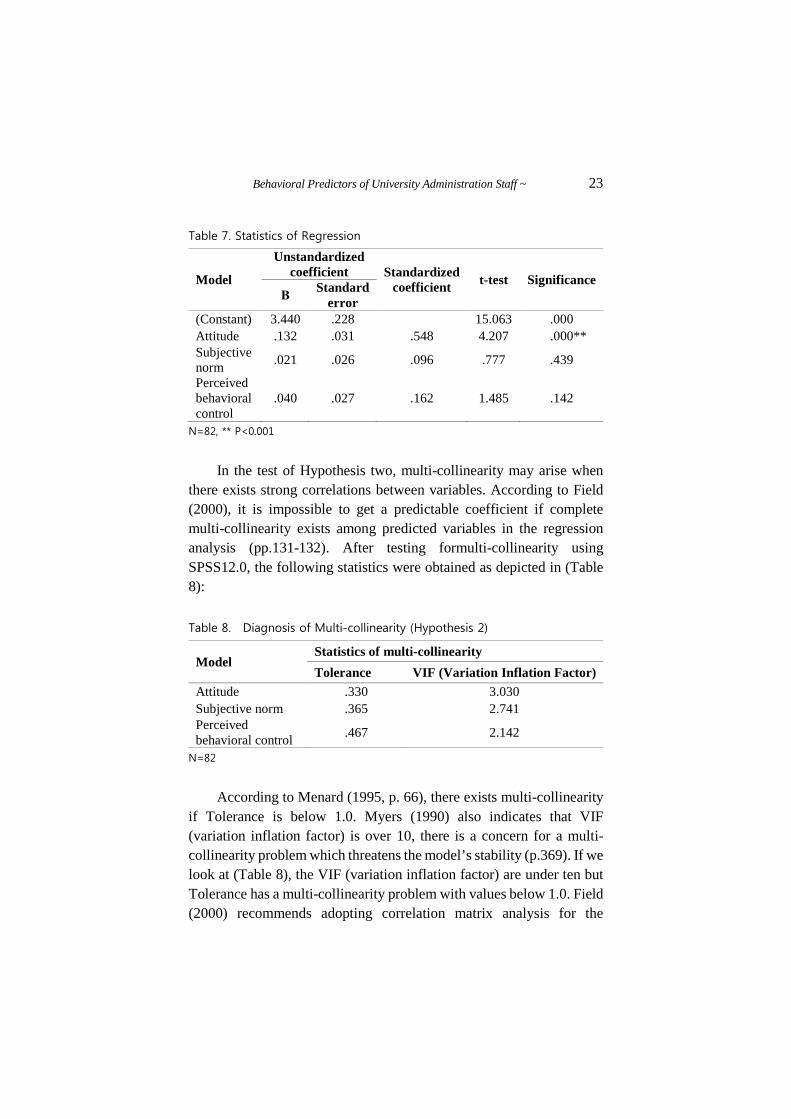
In the test of Hypothesis two, multi-collinearity may arise when
there exists strong correlations between variables. According to Field (2000), it is impossible to get a predictable coefficient if complete multi-collinearity exists among predicted variables in the regression analysis (pp.131-132). After testing formulti-collinearity using SPSS12.0, the following statistics were obtained as depicted in (Table 8):
Table 8. Diagnosis of Multi-collinearity (Hypothesis 2)
Model Statistics of multi-collinearity Tolerance VIF (Variation Inflation Factor)
Attitude .330 3.030 Subjective norm .365 2.741 Perceived behavioral control .467 2.142
N=82
According to Menard (1995, p. 66), there exists multi-collinearity
if Tolerance is below 1.0. Myers (1990) also indicates that VIF (variation inflation factor) is over 10, there is a concern for a multi-collinearity problem which threatens the model’s stability (p.369). If we look at (Table 8), the VIF (variation inflation factor) are under ten but Tolerance has a multi-collinearity problem with values below 1.0. Field (2000) recommends adopting correlation matrix analysis for the

24 THE SNU JOURNAL OF EDUCATION RESEARCH
accurate judgments involving such ambiguous situations as presented in (Table 8). Field (2000) argues that, if the correlation coefficient is as high as 0.8-0.9 or more from the correlation matrix analysis, then multi-collinearity exists. To identify multi-collinearity, Peason's correlation coefficient analysis was undertaken. The coefficient from the analysis shows the coefficient ranges from .268 to .540as depicted in (Table 9), it does not show as high as .80~ .90. In conclusion, the model does not have a problem of multi-collinearity.
Table 9. Peason’s Correlation Coefficient Analysis (Hypothesis 2)
Attitude Subjective norm Perceived behavioral control
Attitude 1.0 .365** .268* Subjective norm .365** 1.0 .540** Perceived behavioral control
.268* 0.540** 1.0
** P<0.01, * P<0.05, N=82
The assumption of the TPB model is that the variables formulating
intention are attitude, subjective norm, and perceived behavioral control. The model testing shows that attitude is the only influential variable formulating intention, and the others are identified as not being influential variables. These results may deny the validity of the TPB model; however, it is hard to say about the invalidity of the model because the data and analysis may also tell us something about the distinctive aspects of Korean society’s characteristics.
Let us review what is meant by the subjective norm: the subjective norm is a kind of social pressure regulating behaviors. In this model, the question is posed, “Why would public servants not like to follow the code of conduct due to social pressure?” To know the reason, let us consider subjective norms. First, the result denoted that the subjective norm has no influence on the formulation of intention, which means that external pressure on the individual’s expenditure on ECC has no substantial pressure, but symbolic pressure, although there is a code of conduct regulating this. In reality, this can be grasped by considering the record of cases involving punishment of violations of ECC

Behavioral Predictors of University Administration Staff ~ 25
guidelines, which are very rare based on administrative audits and investigations. Second, in relation to the ECC, university public servants do not mind what their colleagues think. This can be found in the respondent’s answer from the semi-structured background question in the questionnaire. 75 respondents (91.5%) replied that they know the ECC, and that they know the limit on contributions is KRW50,000. This tells us that respondents did not mind social pressure when deciding whether or not to follow the standard. In other words, it just became commonsense. This is because in the semi-structured background question, 98.8% of those sampled responded that they spent lower than KRW50,000 on their ECC. Next, the perceived behavioral control addresses the power to control behavioral problems (barriers) in the formation of intention that is incurring behavior. The perceived behavioral control was also identified as having no influence for intention formulation. However, if we look at the last unstructured question in the survey, respondents were asked why they felt that it was difficult to keep the ECC guideline. This is the case where people felt they had to spend more than KRW50, 000. Approximately 20% (16 respondents) answered that their expenditure on ECC often went beyond KRW50, 000 due to their familiarity, or close relationship, with the recipient. Based on this survey, it is only estimated that what we called affection (정, 情) indwelling in Korean culture is a big barriers for behavioral control and even rendered moot perceived behavioral controls.
E. Discernible Belief in the Attitude Variable (Hypothesis 3) Intention and each of the four items measuring the values of
attitude were analyzed through regression analysis to discern certain beliefs in attitude. Results of model test are as follows: AKt=3.163+0.372β1+0.046β2-.048β3+0.465β4, R2= 0.603, ** P<0.001, Items number 1 and 4 showed meaningful outcomes at the significance level of P<0.001 as depicted in (Table 10). The contents of the two

26 THE SNU JOURNAL OF EDUCATION RESEARCH
items (belief) are as follows: Attitude 1: If I give wedding or funeral money to my colleagues in
keeping within the limit as prescribed in the code of conduct of my institution, I will feel that I am behaving positively.
Attitude 4: If I give wedding or funeral money to my colleagues within the limit as prescribed in the code of conduct of my institution, I am encouraged to follow other areas of the code of conduct as well.
Table 10. Statistics from Regression Analysis
Model
Unstandardized coefficient Standardized
coefficient t-test Significance Β standard
error (Constant) 3.163 .221 14.323 .000 Attitude1 .083 .025 .372 3.350 .001** Attitude2 .009 .020 .046 .429 .669 Attitude3 -.010 .028 -.048 -.367 .715 Attitude4 .106 .031 .465 3.412 .001**
** P<0.001, N=82
Attitude 1 measures whether staff members felt positively about behavior if they spent the right amount on ECC by adhering to the code of conduct. Attitude 4 measured whether staff kept the ECC standard strictly, then we might infer that staff members would be inclined to better adhere to other code of conduct regulations.
Results of the multi-collinearity test on Hypothesis three are similar to the results observed when testing Hypothesis two as described in (Table 11).

Behavioral Predictors of University Administration Staff ~ 27
Table 11. Diagnosis of multi-collinearity (Hypothesis 3)
Model Statistics of multi-collinearity
Tolerance VIF (Variation Inflation Factor) Attitude1 .418 3.391 Attitude 2 .451 2.218 Attitude 3 .307 3.253 Attitude 4 .278 3.603
N=82
No results were above a .8-.9 correlation coefficient, though
attitude 3 and 4 come closest, as depicted in (Table 12). The correlation coefficient of attitude 3 and attitude 4 is .798, which is near to .8. In conclusion, multi-collinearity is not a measurable problem; however, it suggests that items 3 and 4 might be in need of further examination.
Table 12. Pearson’s Correlation Coefficient Analysis (Hypothesis three)
Attitude1 Attitude 2 Attitude 3 Attitude 4 Attitude1 1.0 .609** .686** .742** Attitude 2 .609** 1.0 .705** .690** Attitude 3 .686** .705** 1.0 .798** Attitude 4 .742** .690** .798** 1.0
Significance level: ** P<0.01, N=82
IV. Discussion Below is a detailed discussion of the findings resulting from the
testing of hypotheses. A. Direction values of variables The mean value from eighty two samples of those statistics
presents a positive direction in four values respectively. These statistics alone do not tell us the relationship among the variables and underlying assumptions of this model. However, these statistics match outcomes of the background semi-structured question that 91.5% of the
28 THE SNU JOURNAL OF EDUCATION RESEARCH
respondents sampled said that they were well aware that the standard ECC is KRW50, 000. The degree of strength in the direction is a little bit positive in consideration that the means are only just beyond 5.0, except in regards to attitude. This is still not determinate but does seem to suggest the institutionalization of regulatory norms. From the calculation of the mean values of each variable from the survey we can only acknowledge a positive direction. It is estimated that the degree of the positive is weaker than for other national agencies under the consideration of a relatively low CPI tendency, though the responses of university administrators are showing positive. Also, the tendency of the mean value of each variable, except attitude, is located around 5.0. This then can be viewed as a cue to explaining the volatility of the CPI for those three consecutive years (2012~2014).
B. Influential Factors for Intention as an Approximate Value
of Behavior
Attitude was identified as the most influential factor for explaining intention as an approximate value of behavior. According to Ogden (2003), TPB is a useful and pragmatic model to investigate and predict behavior, but it is not a good model because it is biased by seeking too much analytical knowledge other than comprehensive knowledge, and also it cannot account for any change of cognition and behavior. Centering on these points, the discussion of several pertinent issues that follows is derived from this study.
First, model effectiveness is the result of the unique prediction
power of ‘attitude’ among dependent variables. In this study only the attitude variable was shown to have
predictive power. This result raises the author’s concerns about the model’s defects similar to those voiced by Ogden (2003). Ogden (2003) argues that the reasons for the weak power of predictability of the model was due to the variables not being operationalized properly or sample characteristics not adequately referenced, hence the model should be rejected as the majority of research did not strongly support the model’s expected relations between variables. Against the Ogden’s criticism,

Behavioral Predictors of University Administration Staff ~ 29
Ajzen and Fishbein (2004) argued that “there is nothing in the theory to suggest that the independent variables will each make a significant contribution to the prediction of intention. The relative importance of these three factors is likely to vary from one behavior to another and from one population to another. In some cases, one or another of the three factors will be found to have no significant effect on intention. Assuming that the factors were measured with equal reliability, lack of predictive power indicates that the factors in question are not important considerations in the formation of intention (Ajzen, 2002b)” (p.432). Second, defects of conceptual operationalization and types of
knowledge. The second issue is the possibility of a high correlation between
items because of the similarity in contents and their meanings in the operationalization of the variables of intention and others items designated for this study, and thus, data may be biased. More than two-thirds of the articles employing the model also showed correlations between these same cognitions and measures of behavior (Ogden, 2003). At times the operationalization of these different cognitions appeared very similar. A glance at the variables in this current study reveals that the contents of twenty three items from intention and perceived behavioral control look very similar. This can cause high correlation with these same cognitions with our measures of behavior. Such cognitions are defined as different and yet operationalized in similar ways. Ogden (2003) also pointed out that although one article assessed the reliability of their self-reported behavior, only a quarter of articles used an objective measure of behavior that was not reliant on self-reporting.
Regarding Ogden’s argument on the operationalization of the cognitive variables in these models, variables such as perceived behavioral control and intention are so similar as to virtually ensure a strong correlation among them. Ajzen and Fishbein (2004) explain that “operationalization of these components have been validated in some

30 THE SNU JOURNAL OF EDUCATION RESEARCH
of the structural equation analyses…as well as in other investigations that have tested for convergent and discriminant validity among the different measurement measures” (p. 432). A glance at the variables in the current study reveals that the contents of twenty three items from intention and perceived behavioral control look very similar. This can cause high correlation with these same cognitions with a measure of behavior. Similar phenomena in other questionnaire manuals can also be found with similar cognitive patterns among items; however, if we rewrite the cognitive items there is a danger of reduction in the reliability of the coefficient; therefore, rewording was not made in the study
Ajzen and Fishbein (2004) discuss some of the problems with attempting to measure health-related behaviors using self-reporting surveys, though self-reporting frequently is the option chosen due to the costs in time and resources to use other methods. The authors point out that certain behaviors, such as condom usage, have been shown to be relatively reliably measured using self-reporting, while other less socially-acceptable behaviors tend to be underreported:
“Biases of this kind can inflate observed correlations between cognitions and behavior; however, they do not invalidate the theoretical model. In fact, even when the behavior is observed rather than reported, prediction of behavior is highly significant and the model accounts for considerable variance” (p. 432). Third, issues regarding behavioral change. It was presented in the study to measure the intention of a person’s
behavioral change, but how the author could ensure that was the question. On this matter, Ogden (2003) raised doubts about marking items not related to behavioral change or cognitive creation but just showing pre-existing states of mind. Against this, Ajzen and Fishbein (2004) argue that this concern is common to all questionnaire studies and surveys, and it is always possible that the instrument affects the phenomenon we are trying to study (p. 433). However, whether completing a questionnaire did or did not influence cognitions and

Behavioral Predictors of University Administration Staff ~ 31
behavior in a given investigation is an empirical question. There was no evidence whatsoever that responding to the questionnaire affected later behavior or that performance of the behavior changed later cognitions (p.433). It is only through tests of this kind that we can determine the influence of responding to a questionnaire (p. 433). Ajzen and Fishbein (2004) indicate that responding to a questionnaire can influence behavior, but existing evidence suggests that implementation of intentions have no appreciable effects on cognitions, or at least not on the cognitive constructs contained in the TPB (p.433). They go on explanation that readily accessible behavioral, normative, and control beliefs that serve to explain behavior in research with the TPB are supposed to be elicited in a free-response format (p.433). Ajzen and Fishbein (2004) cite Gollwitzer (1999) that implementation of intentions exert their effect by transferring control over initiation of a behavior to stimulus cues, not by changing behavior-relevant cognitions (p.433). Clearly, if this procedure is followed, it minimizes the possibility that the assessment itself will create or change the cognitions of interest. This has allowed the author to awaken from the misconception of behavioral change using the questionnaire in the study.
Fourth, linkage of findings with the codes of conduct and CPI The finding indicates the possibility that officials have only a non-
critical observance, which is pervasive in Asia, and officials will not behave in accordance with the social values that ordinary people think they should follow without question. In addition, the insignificance of perceived control indicates the possibility that university administration staff members have many obstacles in implementing their control power against overcoming the barriers in observing the code of conduct regulations. Furthermore, a defect of current institutional system of securing integrity in general is that there is no direct linkage between code of conduct regulation and CPI outcomes. In practice, current codes of conduct do not demonstrate an effective link with the CPI evaluation. The issue addressed is the link between code of conduct regulations and the CPI measurement. What is required is to include a useful strategy in the code of conduct regulations in the CPI. In other words,
32 THE SNU JOURNAL OF EDUCATION RESEARCH
regulations must include institutional mechanisms, such as public officials at universities sharing a social value-promotion strategy to activate and strengthen perceived self-control powers regarding diverse barriers underlying an individual’s observance of code of conduct regulations, which can be seen in the analysis. This is a way of practical approach in the perspective of knowledge utilization strategy or transferring approach from theories identified in the study into practice.
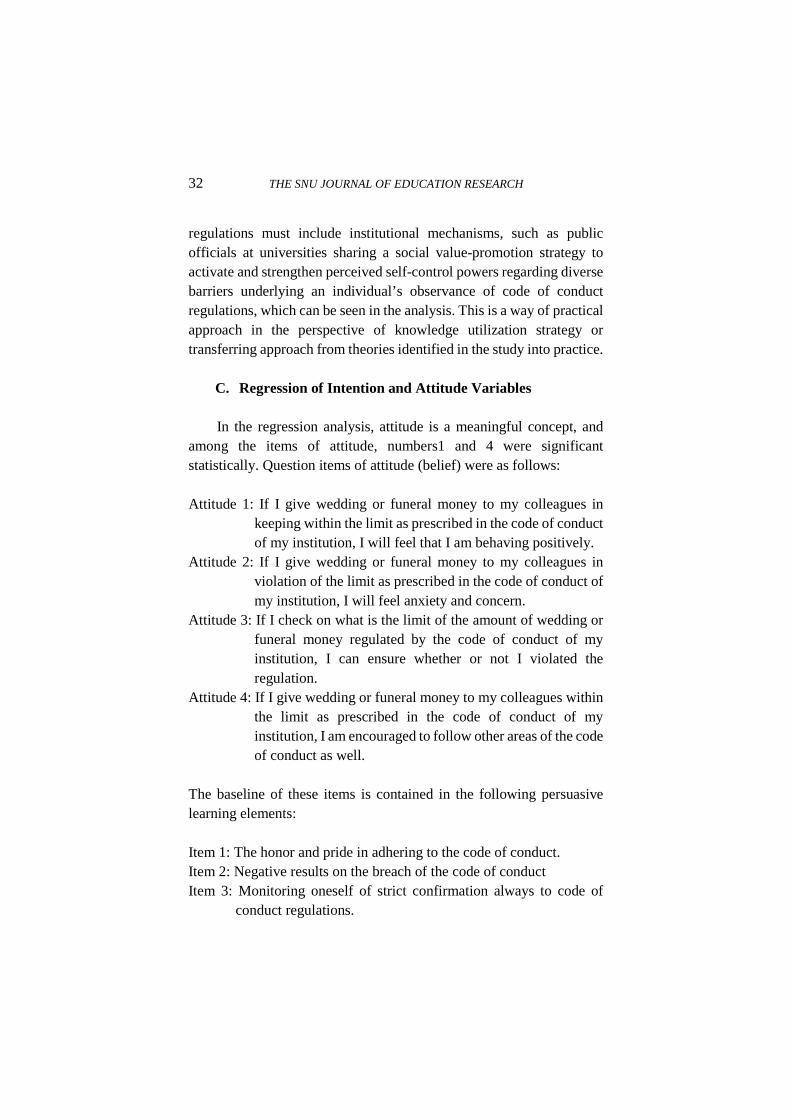
C. Regression of Intention and Attitude Variables In the regression analysis, attitude is a meaningful concept, and
among the items of attitude, numbers1 and 4 were significant statistically. Question items of attitude (belief) were as follows:
Attitude 1: If I give wedding or funeral money to my colleagues in
keeping within the limit as prescribed in the code of conduct of my institution, I will feel that I am behaving positively.
Attitude 2: If I give wedding or funeral money to my colleagues in violation of the limit as prescribed in the code of conduct of my institution, I will feel anxiety and concern.
Attitude 3: If I check on what is the limit of the amount of wedding or funeral money regulated by the code of conduct of my institution, I can ensure whether or not I violated the regulation.
Attitude 4: If I give wedding or funeral money to my colleagues within the limit as prescribed in the code of conduct of my institution, I am encouraged to follow other areas of the code of conduct as well.
The baseline of these items is contained in the following persuasive learning elements: Item 1: The honor and pride in adhering to the code of conduct. Item 2: Negative results on the breach of the code of conduct Item 3: Monitoring oneself of strict confirmation always to code of
conduct regulations.

Behavioral Predictors of University Administration Staff ~ 33
Item 4: Diffusion of observance on the code of conduct. From the test of Hypothesis 3, we can only expect or presume
honor, pride and diffusive tendency if it is applicable. This is not comprehensive but it could be found to a certain degree as an active behavioral tendency, including diffusive distinctions among university public servants in their attitudes. Attitude is an expression of favor or disfavor toward a person, place, thing, or event. Allport (1935, pp. 789–844) once described attitudes as ‘the most distinctive and indispensable concept in contemporary social psychology.’ According to Jung (1921, pp. 4-10), a defined attitude is a readiness of the psyche to act or react in a certain way. Attitudes very often come in pairs, one conscious and the other unconscious. Within this broad definition, Jung defines several attitudes. The most frequent is one conscious and the other unconscious. Jung labeled various "attitude-types,” such as extraversion and introversion, rational and irrational attitudes, individual and social attitudes, many of ‘isms’ used in psychology. McGuire (1969) included the three classical attitudes include cognitive, emotional and behavioral components.
Doob (1947) notes a significant assertion that learning is the most accountable for shaping attitude. Attitudes are expected to change as a function of experience. If attitudes are changed by learning and experience, persuasion can be used to change attitudes. An important domain of research on attitude change focuses on responses to communication. As emotion is a common component in persuasion, some attitude research emphasized the importance of affective or emotion components.
The function of the questionnaire for analysis of the TPB model is to understand what causes the formation of intended behavior and also predicts the change resulting from it. As discussed in the previous pages, although the degree of change is an empirical issue originated from measurement, eventually the survey itself leads and persuades causing the change. Nowadays, effective ways of causing behavioral change involving using experience and persuasive methods as direct instruction, and cyber learning as an indirect instruction. Campaigns to draw consensus throughout administrative communities would be one idea to

34 THE SNU JOURNAL OF EDUCATION RESEARCH
foster the power of persuasion to make ideal changes to improve the behavior of administrators in adhering to code of conduct regulations.
D. Limitations The three limitations of this study can be summarized as follows:
First, in the application of the TPB model, construct validity, reliability and multi-collinearity tests indicate possible bias in the data collected from the survey. However, only the attitude variable among the three independent variables was seen as an influential predictor of behavioral change. Although there are reasons for treating this limitation as not substantial, the model should be improved to better match our assumptions with empirical outcomes. The second limitation of the study that it intends to explain behavioral change using a formative questionnaire without examining the pre-test and post-test measures of the targeted behavior and only accounts for the cognitive constructs of participants to allow for opportunities for test subjects to induce behavioral change. Finally, the response rate was less than 50 percent; therefore, some bias may be present due to a less than robust response rate in this study. The third limitation of the study is that the samples used in this study are only university administrators. Academic groups such as professors and teaching & research assistances are not included at this instance. This is limiting in asserting the findings as a whole profiles of Korea national and public universities. In this regards, it is necessitated that a second phase of study should be implemented to see the whole picture of the Korea national and public universities by adopting academic groups such as professors and teaching & research assistances.
E. Conclusion This study aims to reveal what are the influential factors in
deciding whether to observe code of conduct regulations in Korea’s national universities through the analysis of administrative staff survey on their behavioral trait. It was identified that attitude is a meaningful

Behavioral Predictors of University Administration Staff ~ 35
variable to predict behavior from the regression analysis between intention and three variables (attitude, subjective norm and perceived behavioral control). Discernable attitudes among the four attitude items were found and interpreted as pride and diffusion. With these results, recommendations were made to lead to effective management of behavior in observing code of conduct regulations through learning, experience and persuasion for university administrative staff. Also, encouraging and respecting the voluntary and active participation of university administrative staff would be a possible strategy for improving behavior regarding adherence to code of conduct regulations by linking strategy of codes of conduct, research and the CPI results.. The results of this study suggests that training programs, perhaps employing role-playing techniques or other behavior-based solutions, may well help to guide Korean university administrators towards stronger adherence to code of conduct regulations with the results of this study from the perspective of transforming knowledge into practice. The development and analysis of such training programs also may yield interesting research questions related to bureaucratic norms regarding ‘soft’ corruption, especially as those norms pertain to general attitudes among the Korean public as a whole.

36 THE SNU JOURNAL OF EDUCATION RESEARCH
References Ajzen, I., & Fishbein, M. (2004). Editorial comment: Questions raised
by a reasoned action approach: Comment on Ogden (2003). Health Psychology, 23(4), 431–434.
Ajzen, I., & Fishbein, M. (1975). Belief, attitude, intention, and behavior: An introduction to theory and research. Reading, Mass: Don Mills.
Ajzen, I., & Fishbein, M. (1980). Understanding attitudes and predicting social behaviour. NJ: Prentice-Hall.
Ajzen, I. (2002a). Perceived behavioral control, self-efficacy, locus control, and the theory of planned behavior. Journal of Applied Social Psychology, 32, 1-20.
Ajzen, I. (2002b). Theory of planned behavior: Frequently asked questions. Retrieved from: http://www.people.umass.edu/aizen/faq.html.
Ajzen, I. (1985). From intentions to actions of planned behavior. In J. Kuhl & J. Bechman (Eds.), Action control: From cognition to behavior (pp. 11-39). New York: Spring-Verlag.
Ajzen, I., & Driver, B. L. (1992). Application of the theory of planned behavior to leisure choice. Journal of Leisure Research, 24, 207-224.
Ajzen, I., & Madden, T. J. (1986). Prediction of goal-directed behavior: Attitudes, intentions, and perceived behavioral control. Journal of Experimental Social Psychology, 22, 453-474.
Albarracín, D., Johnson, B. T., Fishbein, M., & Muellerleile, P. A. (2001). Theories of reasoned action and planned behavior as models of condom use: A meta-analysis. (2001). CHIP Documents. Paper 8. Retrieved from http://digitalcommons.uconn.edu/chip_docs/8.
Alkin, M. (1961). Evaluation theory development. Evaluation Comment, 2(1), 2-7.
Allport, G. (1935). Attitudes. In C. Murchison (Ed.), a Handbook of Social Psychology (pp.798-844). Worcester, MA: Clark University Press.
Anti-Corruption and Civil Rights Commission. (2011). Anti-

Behavioral Predictors of University Administration Staff ~ 37
corruption guideline for the Just society 2011. SEOUL: ACRC.
Anti-Corruption and Civil Rights Commission. (2012a). CPI of 2012 national & public universities, Press release. Anti-Corruption and Civil Rights Commission.
Anti-Corruption and Civil Rights Commission. (2012b). CPI of 2012national & public institutions, Press release. Anti-Corruption and Civil Rights Commission.
Anti-Corruption and Civil Rights Commission. (2013a). CPI of 2013 national & public universities, Press release. Anti-Corruption and Civil Rights Commission.
Anti-Corruption and Civil Rights Commission. (2013b). CPI of 2013national & public institutions, Press release. Anti-Corruption and Civil Rights Commission.
Anti-Corruption and Civil Rights Commission. (2014a). CPI of 2014 national & public universities, Press release. Anti-Corruption and Civil Rights Commission.
Anti-Corruption and Civil Rights Commission. (2014b). CPI of 2014national & public institutions, Press release. Anti-Corruption and Civil Rights Commission.
Anti-Corruption and Civil Rights Commission. (2015). CPI of 2015 national & public institutions, Press release. Anti-Corruption and Civil Rights Commission.
Armitage, C. J., & Conner, M. (2001). Distinguishing perceptions of control from self-efficacy: predicting consumption of a low-fat diet using the theory of planned behavior. Journal of Applied Social Psychology, 20, 72-90.
Beale, D. A., & Manstead, A. S. R. (1991). Predicting mothers’ intentions to limit frequency of infants’ sugar intake: Testing the theory of planned behavior. Journal of Applied Social Psychology, 21, 409-431.
Bennis, W., Benne, K. D., & Chin, R. (1969). The planning of change (2nd Ed.). New York: Holt, Rinehart & Winston.
Berman, P., & McLaughlin, M. W. (1980). Factors affecting the process of change. In M. M. Milstein (Ed.), Schools, conflict and change (pp.57-71). Columbia University, New York:

38 THE SNU JOURNAL OF EDUCATION RESEARCH
Teachers' College Press. Bilic, B. (2005). The theory of planned behaviour and health
behaviours: Cirical analysis of methodological and theoretical issues. Hellenic Journal of Pshchology, 2, 243-259.
Carter, D. S. G. (1986). A Study of teaching process and curriculum implementation in social studies classroom. Unpublished Doctoral thesis. University of Western Australia, Australia.
Chin, R. (1967). Basic strategies and procedures for effecting change. In E. L. Morphet & C. O. Ryan (Eds.), Designing education for the future No.3 (pp.1-328). New York: Citation Press.
Churchman, D. (1979). A new approach to evaluating the implementation of innovative educational programs. Educational Technology, 19(5), 25-29.
Clarke, D. L., & Guba, E. G. (1965). An examination of potential change roles in education. Paper presented at the symposium of innovation and planning school curricula, Airlie House, Virginia.
Cohen. J. (1988). Statistical power analysis. Hillsdale, NJ: Erlbaum. Doll, J., & Ajzen, I. (1992). Accessibility and stability of predictors in
the theory of planned behavior. Journal of Personality and Social Psychology, 63, 754-765.
Doob, L. W. (1947). The behavior of attitudes. Psychological Review, 54, 135-156.
Eagly, A. H., & Chaiken, S. (1993). The psychology of attitudes. Orlando, FL: Harcourt Brace.
Elliott, M. A., Armitage, C. J., & Baughan, C. J. (2003). Drivers’ compliance with speed limits. An application of the theory of planned behaviour. Journal of Applied Psychology, 88, 964-972.
Everitt, B. (1996). The Cambridge dictionary of statistics in the medical sciences. Cambridge, England: Cambridge University.
Field, A. (2000). Discovering statistics using SPSS for windows. London: Sage.
Fishbein, M. (1967). Attitude and the prediction of behavior. In M. Fishbein (Ed.), Readings in attitude theory and measurement (pp. 477-491). New York: Wiley.

Behavioral Predictors of University Administration Staff ~ 39
Francis, J. J., Eccles, M. P., Johnston, M., Walker, A., Grimshaw, J., Foy, R., Kaner, E. F. S., Smith, L., & Bonetti, D. (2004a). Constructing questionnaire based on the theory of planned behaviour: a manual for health services researchers. UK: Centre for Health service research, University of Newcastle.
Francis, J. J., Johnston, M., Eccles, M. P., Grimshaw, J., & Kaner E. F. S. (2004b). Measurement issues in the theory of planned behaviour. UK: Centre for Health service research. University of Newcastle.
Fullan, M. (1981). The relationship between evaluation and implementation. In A. Lewy & D. Nevo (Eds.), Evaluation Roles in Education (pp.309-340). New York: Gordon & Breach.
Glaser, E. M. (1973). Knowledge transfer and institutional change. Professional Psychology, 4(4), 434-444.
Godin, G. (1994). Theories reasoned action and planned behavior; usefulness of exercise promotion. Medicine and Science in Sports and Exercise.
Gordin, G., & KOK, G. (1996). The theory of planned behavior: A revision of its applications to health-related behaviours. American Journal of Health Promotion, 111, 87-98.
Godin, G., Valois, P., LePage, L., & Desharnais, R. (1992). Predictors of smoking behavior: An application of Ajzen’s theory of planned behavior. British Journal of Addiction, 87, 1335-1343.
Gollwitzer, P. M. (1999). Implementation intentions: Strong effects of simple plans. American Psychologist, 54, 493–503.
Hagger, M. S., Chatzisarantis, N. D. L., & Biddle, S. J. H. (2002). A meta-analytic review of the theories of reasoned action and planned behaviour in physical activity: predictive validity and the contribution of additional variables, Journal of Sports & Exercise psychology, 24, 40-53.
Hall, G. E. & Loucks, S. F. (1981). The concept of innovation configurations: An approach to addressing program adaptation. Paper presented at the annual meeting of the American Educational Research Association, Los Angeles.
Hall, G. E., Loucks, S. F., Rutherford, W. L., & Newlove, B.W. (1975).
40 THE SNU JOURNAL OF EDUCATION RESEARCH
Levels of use of the innovation: A framework for analysing innovation adoption. Journal of Teacher Education, 26(1), 52-56.
Havelock, R. G. (1973). Planning for innovation-through dissemination and utilization of knowledge. Institute for Social Research (4thEd.). University of Michigan.
Heck, S., & Goldstein, M. (1980). Structured and unstructured approaches to implementation: Whom does the shoe fit? Paper presented at the annual meeting of the American Educational Research Association, Boston.
Jung, C. G. (1921). Psychological types, collected works. Volume 6. Princeton. N. J. Princeton University Press.
Lee, Y. S. (2012). Parents’ personality Coaching. Retrieved fromhttp://edu.chosun.com/site/data/html_dir/2012/03/16/2012031601844.html?newsplus.
Lee, H. S. (2014). Seeking ways to achieve transparency for anti-corruption by soft law: focused on the EU lobbying control system. European Constitution, 15, 47-87.
Leeh, J. K. (2002). A study of educational change in the use of ICT: secondary teacher’s self-perception in the 1990s. PhD Thesis, University of Exeter, Exeter: UK.
Loucks, S., & Lieberman, A. (1983). Curriculum implementation. In F. English (Ed.), Fundamental curriculum decisions. Virginia: Association for Supervision and Curriculum Development.
MacGuire, L. M. (1970). Observation and analysis of the literature on change. Philadelphia Pennsylvania: Research for Better Schools.
Madden, T. J., Ellen, P. S., & Ajzen, I. (1992). A comparison of the theory of planned behavior and the theory of reasoned action. Personality and Social Psychology Bulletin, 18, 3-9.
McGuire, W. J. (1969). The nature of attitudes and attitude change. In G. Lindzey & E. Aronson (Eds.), The handbook of social psychology 3 (pp.136-314). MA: Addison-Wesley.
Menard, S. (1995). Applied logistic regression analysis. Sage university paper series on quantitative application in the social science. Thousand Oak, CA: Sage.

Behavioral Predictors of University Administration Staff ~ 41
Ministry of Education. (2013). Code of Conduct for Public Officer. Minister of Education Order No.137. Republic of Korea.
Myers, R. (1990). Classical and modern regression with application (2nd Ed.). Boston, MA: Duxbury.
National Institute of Mental Health. (NIMH, 1971). Planning for creative change in mental health services: A manual on research utilization. Maryland: NIMH.
Netemeyer, R. G., Burton, S., & Johnston, M. (1991). A comparison of two models for the prediction of volitional and goal-directed behaviors: A confirmatory analysis approach. Social Psychology Quarterly, 54(2), 87-100.
Newfield, J. (1980). Self-report and matrix sampling: A method of measuring fidelity of implementation. Studies in Educational Evaluation, 6, 149-155.
Ogden, J. (2003). Some problems with social cognition models: A pragmatic and conceptual analysis. Health Psychology, 22, 424-428.
Pusan National University. (2006). Code of Conduct Regulation. Pusan National University.
Perugini, M., & Bagozzi, R. P. (2001). The distinction between desires and intentions, European Journal of social psychology, 34, 60-84.
Reinecke, J., Schmidt, P., & Ajzen, I. (1996). Application of the Theory of Planned Behavior to Adolescents' Condom Use: A Panel Study. Journal of Applied Social Psychology, 26(9), 749-772.
Revicki, D., & Rubin, R. (1981). Models for measuring implementation: A review and a critique. Journal of Curriculum Studies, 13(1), 65-67.
Rivis. A., & Sheeran, P. (2003). Descriptive norms as an additional predictor in the theory of planned behavior: A meta-analysis. Current psychology, Developmental, Learning, Personality, Social, 22, 219-233.
Rogers, E. M., & Shoemaker, F. F. (1971). Communication of innovations: A cross cultural approach. New York: The Free Press of Glencoe Inc.
42 THE SNU JOURNAL OF EDUCATION RESEARCH
Rogers, E. M. (1962). Diffusion of innovation. NY: The Free Press of Glencoe.
Schifter, D. B., & Ajzen, I. (1985). Intention, perceived control, and weight loss: An application of the theory of planned behavior. Journal of Personality and Social Psychology, 49, 843-851.
Sheeran, P., & Taylor, S. (1999). Predicting intentions to use condoms: meta- analysis and comparison of the reasoned action and planned behavour. Journal of applied social psychology, 29, 1624-16.
Sheeran, P., Conner, M., & Norman. P. (2001). Can the theory of planned behaviour explain patterns of health behaviour change? Health psychology, 20, 12-19.
Stallings, J. A. (1975). A study of implementation in seven follow through educational models. Paper presented at the conference on research on teacher effects: An examination by policy-makers and researchers, Austin, Texas.
Taylor, S., & Todd, P. (1995). Assessing IT usage: The role of prior experience. MIS Quarterly, 19(4), 561-570.
Van Ryn, M., & Vinokur, A. D. (1992). How did it work? An examination of the mechanisms through which a community intervention influenced job-search behavior among an unemployed sample. American Journal of Community Psychology, 5, 557-597.
Zaltman, G., Florio, D., & Sikorski, L. (1977). Dynamic educational change, models, strategies, tactics, and management. London: Collier Macmillan Publisher.
Received: 24th September, 2015 Reviewed: 22nd December, 2015
Revised version accepted: 28th December, 2015


![Predictors of Behavioral and Psychological ... - jkan.or.kr · 의 경우 인지기능 저하가 있는 것으로 해석한다[20]. 도구의 신뢰도 Cronbach’s α는 개발당시](https://img.dokumen.tips/doc/110x75/5e64bd7180227f6a502a7228/predictors-of-behavioral-and-psychological-jkanorkr-e-ee.jpg)