Embed Size (px)
Citation preview

BEHAVIOR OF FRP-STRENGTHENED REINFORCED CONCRETE BEAMS UNDER FIRE CONDITIONS
By
Aqeel Ahmed
A DISSERTATION
Submitted to Michigan State University
in partial fulfillment of the requirements for the degree of
DOCTOR OF PHILOSOPHY
Civil Engineering
2010

ABSTRACT
BEHAVIOR OF FRP-STRENGTHENED REINFORCED CONCRETE BEAMS UNDER FIRE CONDITIONS
by
Aqeel Ahmed
Fiber reinforced polymers (FRP) have emerged as an attractive proposition for
retrofitting and strengthening of deteriorating concrete structures due to advantageous properties
such as light weight, corrosion resistance and high strength. When FRP is used in strengthening
of structural members in buildings, resulting strengthened member has to satisfy relevant fire
resistance requirements specified in building codes and standards. Similar to other construction
materials, FRP loses its strength and stiffness properties with temperature. However, the
degradation in FRP properties is faster as compared to concrete or steel reinforcement due to
deterioration of FRP matrix and loss of bond even at modest temperature. To address some of the
current knowledge gaps, experimental and numerical studies was carried out with the aim of
developing a fundamental understanding on the performance of FPR-strengthened RC beams
under realistic fire, loading, and restraint scenarios.
A numerical model was developed for tracing the response of FRP-strengthened RC
beams under realistic fire, loading and restraint conditions. The model is based on a macroscopic
finite element approach and utilizes time-dependent moment-curvature relationships to trace the
response of the beam from pre-fire stage to failure under fire conditions. All of the critical
factors, namely; high temperature material properties, fire induced bond degradation and axial
restraint force, and different strain components that have significant influence on the fire
response of FRP-strengthened RC beams were incorporated in the model.

For validation of the model, four FRP-strengthened RC beams were tested by exposing
the beams to fire. The test parameters included different fire scenarios (standard and design fire),
type of insulation, effect of anchorage zones and axial restraint conditions. Data generated from
fire tests was used to validate the computer model by comparing various response parameters
which included cross sectional temperatures, debonding of FRP, mid-span deflection, and fire
resistance. The validated model was then applied to conduct a set of parametric studies to
quantify the influence of various factors, such as fire scenario, load level, axial restraint, bond
degradation, thermal properties and different insulation schemes, on the fire response of FRP-
strengthened RC beams. Results from parametric studies shows that fire resistance of FRP-
strengthened RC beam is enhanced under most design fire exposures. Provision of optimum
insulation schemes, can enhance the fire resistance of FRP-strengthened RC beams. The fire
resistance is not improved much by increasing the insulation thickness beyond an optimum
thickness level. Higher load levels, lower restraint forces and increased bond degradation at
FRP/concrete interface leads to a lower fire resistance in FRP-strengthened RC beams.
Results from parametric studies and fire experiments were utilized to develop guidelines
for achieving optimum fire resistance in FRP-strengthened RC beams. These design guidelines,
can facilitate wider use of FRP in strengthening of RC beams in buildings where fire safety is
one of the key design consideration.

iv
DEDICATION
This research is dedicated to my beloved parents and my wife. Their emotional support
and prayers consistently provided me motivation and inspiration to achieve this goal.

v
ACKNOWLEDGMENT
I wish to express my greatest gratitude to my advisor Dr. Venkatesh Kodur, Professor of
Civil Engineering, Michigan State University, for his support, encouragement and guidance
received throughout the course of this study. I would like to convey my sincere thanks for his
ideas and perseverance which made my graduate studies very educational.
I would also like to thank distinguished faculty members, Prof. Ronald Harichandran,
Prof. Parviz Soroushian and Prof. Lawrence T. Drzal, who served on my committee and
provided me with their valuable advice and useful guidance and discussions during my stay at
Michigan State University.
My appreciations and prayers extended to my friends Monther Dwaikat, and Mahmoud
Dwaikat. Also, I would like to thank the lab manager, Mr. Siavosh Ravanbakhsh for his support
and help during the experimental program in this research. Obviously, I would like to extend my
thanks to Laura Taylor, Mary Mroz, and Margaret Conner for all the help they offered to go
smoothly through my study period.
I would like to thank Rustin Fike, Wasim Khaliq, Nikhil Raut, Syed Haider, Syed
Hassan, Purushutham Pakala, Nicholas Hatinger and Mahmoud Haq, for their support,
particularly in the experimental part of this study.
I would also like to appreciate the support and efforts of my wife who have been taking
care of our three lovely children’s Zunera Maryam, Abdullah Ahmed and Aisha Sadiqah.

vi
TABLE OF CONTENTS
LIST OF TABLES.…………………………………………………………………………….....x
LIST OF FIGURES...………………………………………………………………………….....xi
NOTATIONS.………………………………………………………………………………….xvii
CHAPTER 1 - INTRODUCTION 1.1 General ....................................................................................................................................1 1.2 Performance of FRP under Fire ..............................................................................................3 1.3 Fire Behavior of FRP-strengthened RC Beams ......................................................................6 1.4 Research Objectives ..............................................................................................................10 1.5 Scope and Outline .................................................................................................................11
CHAPTER 2 – STATE-OF-THE-ART 2.1 General ..................................................................................................................................13 2.2 Flexural Strengthening of Reinforced Concrete Members ...................................................14
2.2.1 FRP Products ...............................................................................................................19 2.2.1.1 Fibers................................................................................................................19 2.2.1.2 Matrix ...............................................................................................................20 2.2.1.3 FRP Composite ................................................................................................23
2.3 FRP Composites for Civil Engineering Applications ...........................................................25 2.3.1 Externally Bonded FRP-strengthening of RC Beams ..................................................27
2.4 High Temperature Properties ................................................................................................28 2.4.1 Reinforcing Steel .........................................................................................................28
2.4.1.1 Thermal Properties ...........................................................................................28 2.4.1.2 Mechanical Properties ......................................................................................30 2.4.1.3 Deformation Properties ....................................................................................31
2.4.2 Concrete .......................................................................................................................32 2.4.2.1 General .............................................................................................................32 2.4.2.2 Thermal Properties ...........................................................................................33 2.4.2.3 Deformation Properties ....................................................................................38 2.4.2.4 Fire induced Spalling .......................................................................................40
2.4.3 Fiber Reinforced Polymers (FRP) ...............................................................................42 2.4.3.1 General .............................................................................................................42 2.4.3.2 Fibers................................................................................................................43 2.4.3.3 Matrix ...............................................................................................................44 2.4.3.4 FRP Composite – Thermal Properties .............................................................45 2.4.3.5 FRP Composites – Mechanical Properties .......................................................47 2.4.3.6 FRP Composites – Deformation Properties .....................................................48 2.4.3.7 FRP Composite - Bond Properties ...................................................................48

vii
2.4.3.8 Physical Properties – Smoke Generation, Flame Spread and Toxicity ...........50 2.4.4 Insulation......................................................................................................................52
2.5 Previous Studies on FRP-strengthened RC Beams ...............................................................56 2.5.1 Experimental Studies ...................................................................................................56 2.5.2 Numerical Studies ........................................................................................................62
2.6 Codes and Standards .............................................................................................................64 2.7 Summary ...............................................................................................................................65
CHAPTER 3 – EXPERIMENTAL STUDIES 3.1 General ..................................................................................................................................67 3.2 Experimental Program ..........................................................................................................67
3.2.1 RC Beam Specimens ....................................................................................................68 3.2.2 FRP Strengthening .......................................................................................................73
3.2.2.1 Design and Material .........................................................................................73 3.2.2.2 Installation........................................................................................................73
3.2.3 Insulation of Beams .....................................................................................................75 3.2.3.1 Insulation type ..................................................................................................75 3.2.3.2 Installation........................................................................................................76
3.2.4 Instrumentation ............................................................................................................78 3.2.5 Test Apparatus .............................................................................................................79 3.2.6 Test Conditions and Procedure ....................................................................................80 3.2.7 Loading ........................................................................................................................81 3.2.8 Material Testing ...........................................................................................................82
3.2.8.1 Compressive strength of concrete ....................................................................82 3.2.8.2 Steel..................................................................................................................83 3.2.8.3 Insulation..........................................................................................................84 3.2.8.4 Glass transition temperature of FRP composite...............................................85
3.3 Results and Discussion .........................................................................................................87 3.3.1 Test Observations.........................................................................................................87 3.3.2 Thermal Response ........................................................................................................91
3.3.2.1 General .............................................................................................................91 3.3.2.2 Furnace Temperatures ......................................................................................92 3.3.2.3 EI-R/Insulation Interface Temperatures ..........................................................92 3.3.2.4 FRP/Insulation Interface Temperatures ...........................................................93 3.3.2.5 FRP/Concrete Interface Temperatures .............................................................94 3.3.2.6 Concrete Temperatures ....................................................................................96 3.3.2.7 Rebar Temperatures .........................................................................................98
3.3.3 Structural Response .....................................................................................................99 3.3.3.1 Deflection of Beams ........................................................................................99 3.3.3.2 Axial Restraint Force .....................................................................................104
3.4 Failure Pattern and Fire Resistance .....................................................................................105 3.5 Summary .............................................................................................................................106

viii
CHAPTER 4 – NUMERICAL MODEL 4.1 General ................................................................................................................................108 4.2 Macroscopic Finite Element Model - Methodology ...........................................................109 4.3 FE Model for FRP-strengthened RC Beams .......................................................................115
4.3.1 Fire Temperatures ......................................................................................................115 4.3.2 Thermal Analysis .......................................................................................................115 4.3.3 Strength Analysis .......................................................................................................119
4.3.3.1 General Analysis Procedure .......................................................................... 119 4.3.3.2 Evaluating Strain ( )slip due to Bond Slip .................................................. 125
4.3.3.3 Fire Induced Axial Restraint Force ............................................................... 130
4.3.4 Generation of Moment-curvature ( )M Relationships ..........................................132
4.3.5 Beam Analysis ...........................................................................................................133 4.3.5.1 Stiffness Approach ........................................................................................ 133 4.3.5.2 Failure Limit States ....................................................................................... 135
4.4 Computer Implementation ..................................................................................................137 4.4.1 Computer Program .....................................................................................................137 4.4.2 Beam Idealization ......................................................................................................137 4.4.3 Material Properties .....................................................................................................138
4.4.3.1 Concrete ........................................................................................................ 138 4.4.3.2 Steel Reinforcement ...................................................................................... 139 4.4.3.3 FRP and Insulation Material ......................................................................... 139 4.4.3.4 Input Data...................................................................................................... 140 4.4.3.5 Output Results ............................................................................................... 140
4.5 Summary .............................................................................................................................140
CHAPTER 5 – MODEL VALIDATION 5.1 General ................................................................................................................................141 5.2 Response of Typical FRP-strengthened Beam ...................................................................141
5.2.1 Details of Beam ..........................................................................................................141 5.2.2 Thermal Response ......................................................................................................142 5.2.3 Structural Response ...................................................................................................146 5.2.4 Summary ....................................................................................................................154
5.3 Validation against Test Data ...............................................................................................154 5.3.1 Blontrock et al. Test Beams .......................................................................................154 5.3.2 William et al. Tested T-Beam ....................................................................................159 5.3.3 MSU Test Beams .......................................................................................................160
5.4 Summary .............................................................................................................................169

ix
CHAPTER 6 – PARAMETRIC STUDY AND DESIGN GUIDELINES 6.1 General ................................................................................................................................171 6.2 Analysis Details ..................................................................................................................171
6.2.1 Significant Factors .....................................................................................................171 6.2.2 Selection of Beam ......................................................................................................172 6.2.3 Material Properties .....................................................................................................172 6.2.4 Mesh Size ...................................................................................................................173 6.2.5 Failure Criteria ...........................................................................................................173
6.3 Results from Parametric Studies .........................................................................................179 6.3.1 Effect of FRP Strengthening ......................................................................................179 6.3.2 Effect of Fire Scenario ...............................................................................................182 6.3.3 Effect of Load Level ..................................................................................................185 6.3.4 Effect of Axial Restraint ............................................................................................187 6.3.5 Effect of Location of Axial Restraint .........................................................................190 6.3.6 Effect of Concrete Strength .......................................................................................192 6.3.7 Effect of Concrete Aggregate ....................................................................................193 6.3.8 Effect of Insulation Thickness ...................................................................................194 6.3.9 Effect of Insulation Configuration .............................................................................198 6.3.10 Effect of Insulation Thermal Conductivity .............................................................200 6.3.11 Effect of Bond Degradation ....................................................................................202 6.3.12 Effect of Adhesive Thickness on Bond Degradation ..............................................203
6.4 Critical Factors Influencing Fire Performance ...................................................................205 6.5 Design Guidelines ...............................................................................................................208
6.5.1 Insulation Scheme ......................................................................................................208 6.5.2 Anchorage zone .........................................................................................................212 6.5.3 Performance-based Design ........................................................................................213 6.5.4 Rational Fire Resistance Assessment .........................................................................216
6.6 Summary .............................................................................................................................217
CHAPTER 7 – CONCLUSIONS AND RECOMMENDATIONS 7.1 General ................................................................................................................................218 7.2 Key Findings .......................................................................................................................219 7.3 Recommendations for Future Research ..............................................................................221 7.4 Research Impact ..................................................................................................................222 Appendices APPENDIX A ..........................................................................................................................224 APPENDIX B ..........................................................................................................................239 APPENDIX C ..........................................................................................................................248 REFRENCES .............................................................................................................................250

x
LIST OF TABLES Table 2.1: Comparison of widely available resins ........................................................................ 22
Table 2.2: Qualitative comparison between carbon, aramid and E-glass fibers ........................... 25
Table 2.3: Thermal conductivities of various unidirectional FRP and building material ............. 46
Table 2.4:CTE’s of unidirectional FRP composites and building materials ................................ 48
Table 3.1: Concrete mix design proportions for beams ................................................................ 70
Table 3.2: Summary of test parameters and results ...................................................................... 71
Table 3.3: Properties of fibers used for strengthening of test beams ............................................ 73
Table 3.4: Properties of composite laminate ................................................................................. 73
Table 3.5: Properties of epoxy used in FRP strengthening ........................................................... 74
Table 3.6: Compressive strength of concrete ................................................................................ 82
Table 3.7: Visual Observations for Beams B1 and B2 during Fire Resistance Test .................... 88
Table 3.8: Visual Observations for Beams B3 and B4 during Fire Resistance Test .................... 89
Table 5.1: Summary of properties for beams used in the fire resistance analysis ..................... 145
Table 5.2: Material properties for Blontrock beams .................................................................. 155
Table 5.3: Material properties for T-beam ................................................................................. 159
Table 6.1: Summary of properties for FRP-strengthened RC beams used in the parametric study
..................................................................................................................................................... 176
Table 6.2: Summary of parameters studied in analysis .............................................................. 177
Table 6.3: Summary of the fire resistance values for the analyzed beams ................................. 178
Table 6.4: Properties used for design fires .................................................................................. 182
Table 6.5: Effect of insulation thickness on fire resistance of FRP-strengthened RC beams .... 197

xi
LIST OF FIGURES
Figure 1.1: Variation of strength in different materials with temperature .......................................5
Figure 2.1: Application of FRP in the field .................................................................................. 16
Figure 2.2: RC beams bonded with (a) FRP at beam soffit (b) FRP and U-strip end anchorages (c) Pre-stressed FRP .................................................................................................. 17
Figure 2.3: Failure modes of FRP-strengthened RC beams (a) FRP rupture (b) crushing of compressive concrete (c) shear failure (d) concrete cover separation (e) plate-end interfacial debonding (f) intermediate flexural crack-induced interfacial debonding (g) intermediate flexural shear crack-induced interfacial debonding ........................ 18
Figure 2.4: Tensile strength of typical fibers and metals .............................................................. 20
Figure 2.5: Various FRP composite products for strengthening applications .............................. 23
Figure 2.6: Stress-strain curves for FRP and mild steel ................................................................ 24
Figure 2.7: Typical response (load-deflection curve) of FRP-strengthened and un-strengthened (control) RC beam ..................................................................................................... 28
Figure 2.8: Variation of (a) Thermal conductivity (b) Thermal capacity with temperature for reinforcing steel ......................................................................................................... 29
Figure 2.9: Stress-strain curves for steel (300 MPa yield strength) as function of temperature ... 31
Figure 2.10: Variation of (a) Modulus (b) Yield and ultimate strength with temperature for reinforcing steel ......................................................................................................... 31
Figure 2.11: Variation of thermal expansion as function of temperature ..................................... 32
Figure 2.12: Variations of measured and predicted of thermal conductivity as a function of temperature for normal strength concrete (NSC) ...................................................... 34
Figure 2.13: Variations of measured and predicted of thermal capacity as a function of temperature for normal strength concrete (NSC) mechanical properties .................. 34
Figure 2.14: Variation of elastic modulus of concrete as a function of temperature .................... 35
Figure 2.15: Variation of compressive strength as a function of temperature for NSC ............... 37
Figure 2.16: Variation of compressive strength as a function of temperature for HSC ............... 37
Figure 2.17: Variation of residual compressive strength as a function of temperature ................ 38

xii
Figure 2.18: Variations of measured and predicted of thermal expansion for concrete as a function of temperature ............................................................................................. 39
Figure 2.19: Illustration of spalling of concrete due to pore pressure .......................................... 41
Figure 2.20: Illustration of thermal dilation mechanism .............................................................. 42
Figure 2.21: Variation in tensile strength of fibers with temperature ........................................... 44
Figure 2.22: Variation in thermal properties with temperature for carbon/epoxy FRP ................ 47
Figure 2.23: Variation of bond strength with temperature ........................................................... 50
Figure 2.24: Results of smoke generation tests on various ........................................................... 52
Figure 2.25: Normalized thermal conductivity and thermal capacity of VG insulation ............... 55
Figure 3.1: Elevation and cross-sectional details of FRP-strengthened RC beams ...................... 69
Figure 3.2: Fabrication details of tested beams ............................................................................ 72
Figure 3.3: Concrete surface preparation by sand blasting ........................................................... 74
Figure 3.4: Flexural strengthening and spray-application of insulation on RC beams ................. 77
Figure 3.5: RC beams strengthened with CFRP and insulated ..................................................... 78
Figure 3.6: Thermocouples and strain gage placement in the beam ............................................. 79
Figure 3.7: Structural fire test furnace and loading setup at MSU Civil and Infrastructure laboratory ................................................................................................................... 80
Figure 3.8: Fire time-temperature curves used in fire experiments .............................................. 81
Figure 3.9: Testing compressive strength of concrete after 28 days and on the day of fire test ... 83
Figure 3.10: Testing of reinforcing steel and stress-strain curves ................................................ 83
Figure 3.11: Test setup and high temperature thermal properties of Tyfo® WR AFP system ..... 84
Figure 3.12: Variation of gT as a function of heating rate ............................................................ 86
Figure 3.13: Crack development in insulation of FRP-strengthened beam .................................. 90
Figure 3.14: Formation and widening of cracks in insulation ...................................................... 90

xiii
Figure 3.15: A portion of beam B3 exposed to fire after delamination of FRP and insulation .... 91
Figure 3.16: Time-temperature curve and average furnace temperatures for beam tests ............. 92
Figure 3.17: Exterior layer temperatures in FRP-strengthened RC beams ................................... 93
Figure 3.18: Measured temperatures at FRP/insulation and FRP/concrete interface ................... 95
Figure 3.19: Formation of temperature plateau at 100oC ............................................................. 95
Figure 3.20: Physical and chemical process during combustion of polymer ............................... 96
Figure 3.21: Measured concrete temperatures (TC 9, TC 10 and TC 13) for Beams B2, B4 and control beam B01 ...................................................................................................... 98
Figure 3.22: Comparison of reinforcing steel temperatures ........................................................ 99
Figure 3.23: Comparison of mid-span deflections ...................................................................... 102
Figure 3.24: Unbonded continuous carbon fibers at the beam soffit .......................................... 103
Figure 3.25: Cool anchorage zone of FRP-strengthened RC beam ............................................ 103
Figure 3.26: Axially restrained FRP-strengthened RC beam (B4) ............................................. 103
Figure 3.27: Comparison of axial restraint force as function of fire exposure time for beam B4 and beam B02 .......................................................................................................... 105
Figure 4.1: Layout of typical FRP-strengthened RC beam, its idealization and discretization for analysis .................................................................................................................... 110
Figure 4.2: Flowchart illustrating the steps associated with fire resistance analysis of FRP-strengthened RC beam ............................................................................................. 112
Figure 4.3: Discretization of beam for analysis and M relationship for idealized segment . 128
Figure 4.4: Development of shear stresses and bond-slip in a beam segment ............................ 129
Figure 4.5: Schematic interfacial shear stress distribution ......................................................... 129
Figure 4.6: Illustration of axial restraint force calculations ........................................................ 132
Figure 4.7: Flow chart illustrating the steps associated of iterative procedure ........................... 136
Figure 5.1: Beam elevation and cross section details ................................................................. 144
Figure 5.2: Temperatures at various locations in the beam as a function of fire exposure time 144

xiv
Figure 5.3: Moment-curvature curves at various times for Beam-I under fire exposure .......... 147
Figure 5.4: Moment capacity and deflection of FRP-RC beam as a function of fire exposure time ................................................................................................................................. 148
Figure 5.5: Deflection of FRP-strengthened and RC beam as function of fire exposure time .. 149
Figure 5.6: Ultimate tensile strength ( )Tf of CFRP as a function of temperature .................... 150
Figure 5.7: Temperature variation at the interface of FRP-concrete interface as a function of fire exposure time ........................................................................................................... 151
Figure 5.8: Moment capacity of FRP-strengthened and RC beam ............................................ 152
Figure 5.9: Variation of interfacial shear stress as a function of fire exposure time ................. 153
Figure 5.10: Slip distribution for mid span of the beam as a function of fire exposure time .... 153
Figure 5.11: Elevation and cross section of beams tested by Blontrock et al. ............................ 156
Figure 5.12: Measured and predicted rebar temperatures and mid-span deflection in Beam II 157
Figure 5.13: Measured and predicted temperatures at the interface of FRP/concrete and corner rebar for Beam III .................................................................................................... 158
Figure 5.14: Measured and predicted deflection as a function of fire exposure time for Beam III ................................................................................................................................. 158
Figure 5.15: Measured and predicted temperatures at various depths in Beam IV .................... 160
Figure 5.16: Comparison of measured and predicted temperatures in compression and flexural reinforcement and mid-depth of cross section for beams Beam V through Beam VIII ................................................................................................................................. 163
Figure 5.17: Comparison of measured and predicted temperatures at FRP/insulation, FRP/concrete interfaces for beams Beam V through Beam VIII ............................ 165
Figure 5.18: Elevation and cross sectional details of MSU tested FRP-strengthened RC beam 167
Figure 5.19: Measured and predicted deflection of FRP-strengthened RC beams (Beam V through VIII) ........................................................................................................... 168
Figure 5.20: Measured and predicted axial restraint force as a function of time for Beam VIII ................................................................................................................................. 169
Figure 6.1: Longitudinal and cross sectional discretization for fire resistance analysis ............. 175

xv
Figure 6.2: Time-temperature curves for different fire scenarios ............................................... 175
Figure 6.3: Effect of FRP strengthening on fire response of RC beams..................................... 181
Figure 6.4: Variation of rebar temperature as a function of fire exposure time in FRP-strengthened RC beam ............................................................................................. 183
Figure 6.5: Variation of temperature at FRP-concrete interface as a function of fire exposure time .......................................................................................................................... 184
Figure 6.6: Effect of fire scenarios on mid-span deflections of FRP-strengthened RC beam ... 185
Figure 6.7: Effect of load ratio on mid-span deflection of FRP-strengthened RC beam exposed to fire ....................................................................................................................... 187
Figure 6.8: Fire induced axial restraint force as a function of time in an FRP-strengthened RC beam ........................................................................................................................ 189
Figure 6.9: Effect of axial restraint on mid-span deflection of FRP-strengthened RC exposed to fire............................................................................................................................ 189
Figure 6.10: Effect of location of axial restraint force on mid-span deflection of FRP-strengthened RC beam exposed to fire .................................................................... 191
Figure 6.11: Effect of axial restraint force location on axial force development ...................... 192
Figure 6.12: Effect of compressive strength of concrete on mid-span deflection of FRP-strengthened RC beam exposed to fire .................................................................... 193
Figure 6.13: Effect of aggregate type on mid-span deflection of FRP-strengthened RC beam exposed to fire ......................................................................................................... 194
Figure 6.14: Effect of insulation thickness on time to reach gT ................................................ 197
Figure 6.15: Corner rebar temperature and yield strength ratio as a function of insulation thickness for 3-hour of fire exposure time ............................................................. 198
Figure 6.16: Effect of insulation depth on beam sides on fire response of FRP-strengthened RC beam exposed to fire .............................................................................................. 200
Figure 6.17: Effect of insulation thermal conductivity on fire resistance of FRP-strengthened RC beam ............................................................................................................... 201
Figure 6.18: Fire induced mid-span deflection in RC beam under different bond configurations ................................................................................................................................. 203
Figure 6.19: Bond-slip at FRP concrete interface as a function of fire exposure time ............. 203

xvi
Figure 6.20: Effect of adhesive thickness on slip at FRP-concrete interface as function of fire exposure time ......................................................................................................... 204
Figure 6.21: Proposed geometric configuration schemes for fire insulation in FRP-strengthened RC beams ............................................................................................................... 210
Figure 6.22: Proposed geometric configuration for insulation in FRP-strengthened RC T-beams ................................................................................................................................. 210
Figure 6.23: Proposed optimum thickness for fire insulation in FRP-strengthened RC beams 212
Figure 6.24: Proposed fire insulation layout for FRP-strengthened RC beams .......................... 213
Figure 6.25: Effect of standard and design (realistic) fire on temperature profile of an insulated FRP-strengthened RC beam ................................................................................... 214

xvii
NOTATIONS
A = area of boundary exposed to fire
Am = area of each element
Afrp = area of FRP
As = area of steel reinforcement
b = beam width
bfrp = width of FRP reinforcement applied at beam soffit
cc = clear concrete cover
Ct = total compressive force in the beam cross section
d = effective depth of the beam
Ec = modulus of elasticity of concrete
Efrp = modulus of elasticity of FRP
Ecom,T = elastic modulus of FRP composite, T
F = equivalent nodal heat flux
fc,20 = concrete strength at room temperature
fc,T = concrete strength at temperature, T
fcom,T = strength of FRP composite, T
ft = tensile strength of concrete at room temperature

xviii
ftT = tensile strength of concrete for temperature, T
ffu = ultimate tensile strength of FRP
ffe = effective stress in FRP
Fv = ventilation factor
fy = yield strength of steel
Fn and Fn+1 = equivalent nodal heat flux at the beginning and the end of time step, respectively
h = time step
H = total depth of concrete section
hf and hc = heat transfer coefficient of the fire side and the cold side, respectively
hrad and hcon = radiative and convective heat transfer coefficient
k = thermal conductivity
kT = thermal conductivity of concrete
kVG,T = thermal conductivity of insulation (Vermiculite gypsum)
ki = thermal conductivity of insulation (Promatect calcium silicate boards)
kw,T = thermal conductivity of FRP composite
K = global stiffness matrix
Kg = global stiffness matrix for strength analysis
Kgeo = geometric stiffness matrix

xix
kr = axial restraint stiffness
L = length of the beam
li = projected length of deformed segment i
Li = length of segment i in the undeformed beam
LR = load ratio
Ls = length of the beam segment
M = molar mass of water (or global mass matrix)
N = vector of the shape functions
ny and nz = components of the vector normal to the boundary in the plane of the cross section
Pf = equivalent nodal load vector due to applied loading
Pi, 0i and i = the axial force, central total strain, and curvature in segment i
Ps = equivalent nodal load vector due to P- effect
q = heat flux
qrad and qcon = radiative and convective heat fluxes.
Q = heat source
R = gas constant (or fire resistance)
s = distance along the boundary
si = length of deformed segment i
t = time

xx
t* = fictitious time in Eurocode parametric fire
T = temperature
To = initial temperature
TE = temperature of the environment surrounding the boundary
th = time (hours)
Tf = fire temperature
ts = time at which the area under the heat flux curve is being evaluated
tt = total duration of fire
Tt = total tensile force in the beam cross section
T = fire or ambient temperature depending on the boundary
Tmax = maximum fire temperature
u = variable in finite element analysis for temperature
u = the derivative of u with respect to time
un and un+1 = values of u at the beginning and the end of time step, respectively
w = applied distributed load
11w ni and 1
2w ni = deflections at the beginning and the end of the beam segment which were
computed in the (n-1)th
time step

xxi
1w ni and 2w n
i = deflections at the beginning and the end of the beam segment in the nth
time
step
x = depth of neutral axis under service loads
y = the distance from the geometrical centroid of the beam
ytop = distance from the top most fibers of the concrete section
Y = location of axial restraint force from the top most fibers of the concrete section
Z = Zener-Hollomon parameter for creep strain
and = calibration constants for permeability to be determined from experiment
δ = nodal displacements
= total expansion in the beam length
th = change in thermal strain
tr = change in transient strain
= emissivity
0 = total strain at the geometrical centroid of the beam cross section
c = strain at the top most fibers of concrete
bi = initial strain at beam soffit at the time strengthening
cr, me, t, th and tr = creep strain, mechanical strain, total strain, thermal strain, and
transient strain
crs, mes, ths and ts = creep strain, mechanical strain, thermal strain and total strain in steel.

xxii
t0 = creep strain parameter
= structural modification factor in evaluating the fire resistance of reinforced concrete
beams
= boundary of the beam (or time modification factor)
= curvature
= temperature-compensated time (or an iterative procedure parameter between 0 and 1)
s = steel ratio = area of tension steel/effective area of cross section
frp = FRP ratio = area of FRP/effective area of cross section
c = heat capacity
c,T = density of concrete as function of temperature
VG = density of Vermiculite Gypsum (VG)
cT = density of concrete as function of temperature
wT = density of FRP composite
i = density of Promatect calcium-silicate boards
= current stress in concrete or steel (or Stevan-Boltzman constant)
m = stress at the center of each element in the cross sectional beam
1
CHAPTER 1 INTRODUCTION 1.1 General
Reinforced concrete (RC) structures in North America are deteriorating at a rapid pace due
to poor maintenance, and corrosion of steel reinforcement, as well as aging related problems.
This is because most of the infrastructures were built after the Second World War. Thus, there is
an urgent need for the rehabilitation of deteriorating RC structures. In addition, the need for
strengthening existing structures due to natural and manmade disasters (earthquake, hurricanes
and terrorism) is ever growing. These factors necessitate repairing and strengthening structural
members to enhance their performance levels. According to a recent “state-of-infrastructure”
report by American Society of Civil Engineers (ASCE), America’s infrastructure is deteriorating
at a faster rate and needs immediate fixing (ASCE 2009). Total repair and retrofitting costs for
fixing seismic deficient structures, substandard transportation infrastructures (bridges), corroded
steel and concrete structures, structurally deficient and functionally obsolete structures run into
billions of dollars per year. The total cost of repair, rehabilitation, strengthening, and protection
of concrete structures is estimated to be $18 to $21 billion a year for US alone. In light of these
statistics, there is a need for high performance materials that can offer substantial cost savings
(less volume of material), reduced maintenance and longer lifetimes.

2
Fiber reinforced polymers (FRP) have emerged as an attractive proposition for retrofitting
and strengthening concrete structures due to advantages they offer over traditional construction
materials such as concrete and steel. Based on their high strength- and stiffness-to-weight ratios,
corrosion resistance, environmental durability, and inherent tailorability, FRP composites are
increasingly being considered for use in the rehabilitation of existing infrastructure, and for the
construction of new structures. Applications of these materials range from strengthening and
retrofitting of reinforced and unreinforced masonry walls; seismic retrofitting of bridges and
building columns; repair and strengthening of beams, girders, and slabs; and the rehabilitation of
structures.
The repaired/strengthened structural systems are designed to satisfy serviceability and safety
requirements specified in building codes and standards. One of the major safety requirements in
the buildings is the provision for fire safety, since fire represents a major hazard for built
environments. The fire safety provisions for structural members are specified in terms of fire
resistance ratings. The fire resistance rating requirements depend on the type of structural
member, occupancy and other factors. Fire resistance of a structural member is influenced by a
number of factors including type of construction material, applied loading, fire characteristics
and geometric properties (Kodur 1999). When an RC member is strengthened with FRP, the
resulting fire resistance will depend on properties of the original concrete member, as well as the
properties of the added FRP. Unlike concrete and steel, FRP is highly susceptible to fire.
Therefore, FRP is mainly used in bridges and parking garages where fire hazard is not a major
design consideration. However, when used in buildings, FRP-strengthened structural members
have to meet stringent fire resistance requirements specified in the building codes and standards.

3
1.2 Performance of FRP under Fire
Currently, limited knowledge exists about the fire performance of FRP-strengthened
concrete structures. This knowledge gap has limited the widespread application of FRP in
building applications.
The fire safety of structural members can be achieved by satisfying flame spread, smoke
generation and fire resistance ratings. In FRP-strengthened RC members, the overall fire
performance of the member depends on high temperature performance of original concrete
member, as well as the behavior of FRP. The conventional construction materials such as
reinforcing steel and concrete do not combust, and hence do not contribute as fuel or generate
smoke. For flexural strengthening of RC structural members, FRP is externally bonded to the
tension face of the member. Therefore, performance of FRP is a major concern under fire
conditions since FRP is highly vulnerable to elevated temperatures.
FRP materials are highly combustible and burn when subjected to heat flux. These emit
combustible gases, ignite, release heat and propagate flame spread when exposed to elevated
temperatures (fire). Upon burning, FRP’s give off smoke that affects visibility and hinders
ability of the occupants to escape and pose difficulties for fire fighters to conduct evacuation
operations and suppress the fire. Flammability, which is one of the indicators of fire hazard
generally, refers to the tendency of a substance to ignite easily and burn rapidly with a flame.
The flame spread and generation of toxic smoke, which are the two major concerns with FRP
material, largely depend on the type of FRP formulation (composition). When used in buildings,
structural members have to satisfy flame spread, smoke generation and fire resistance ratings
prescribed in the building codes. American Society for Testing and Materials (ASTM
international) and National Fire Protection Association (NFPA) primarily develop and maintain

4
fire and flammability test standards. For evaluating flame spread and smoke generation, ASTM
recommends three different standard tests. ASTM E84 and NFPA 255 tests specify procedures
for relative burning behavior of a building material by measuring flame spread index (FSI) and
smoke density index (SDI). ASTM E662 specifies optical density test to measure characteristics
of smoke concentration, while ASTM E162 describes test procedures for measuring and
comparing surface flammability of different building materials when exposed to radiant heat
energy. Testing laboratories such as Under Writer Laboratories have the facilities to conduct
flame spread and smoke generation tests on materials. Generally, FRP manufacturers list their
products for smoke generation and flame spread classifications in directories after getting
specified tests from these specialized testing facilities (laboratories). Thus, for this research, it is
assumed that FRP’s have met the relevant flame spread and smoke generation rating specified in
building codes and standards.
The third requirement of fire safety for a structural system is the fire resistance rating
specified in the building codes. A fire resistance rating is the minimum duration that is required
for a member to exhibit resistance to fire, and is often rounded off to a nearest hour or half-hour.
Fire resistance is the actual duration during which a structural member exhibits resistance with
respect to strength, integrity and stability. Fire resistance depends on many factors including
structural geometry, constructional material and fire characteristics. Concrete performs
reasonably well under fire because of its low thermal conductivity, high thermal capacity and
slower loss of strength and stiffness properties. Therefore, concrete structures often satisfy fire
resistance ratings without the need for external fire protection. However, when concrete
members are strengthened with external FRP system, the response of the whole system can be
different under the fire conditions as compared to original concrete member. Thus, fire resistance

5
of FRP-strengthened RC members is highly influenced by many factors including strength,
stiffness and bond properties of FRP in addition to properties of concrete and reinforcing steel.
Similar to other construction materials, FRP loses its strength and stiffness properties with
temperature. However, the degradation in FRP properties is faster as compared to concrete or
steel since properties of FRP matrix start to deteriorate even at a modest temperature. Figure 1.1
shows degradation of strength with temperature for traditional construction materials including
two common types of FRP; namely, carbon based FRP (CFRP) and glass based FRP (GFRP). It
can be seen that FRP properties degrade at a faster rate as compared to steel and concrete (Kodur
and Baingo 1998). Further, the temperatures in FRP, unlike concrete and steel, rise at a very fast
rate since FRP starts to burn when it comes in contact with fire (flame). The loss of FRP strength
with temperature is negligible up to 100oC, and thereafter, strength degradation is faster,
resulting in 50% strength loss around 250oC.
Figure 1.1: Variation of strength in different materials with temperature (For interpretation of references to color in this and all other figures, the reader is referred to the electronic version of this dissertation)
0
20
40
60
80
100
120
0 200 400 600 800 1000 1200
Str
engt
h (%
of
init
ial)
Temperature ( oC)
ConcreteSteelWoodCFRPGFRP

6
For flexural strengthening of structural members, FRP is externally bonded to the RC
member using an adhesive. Apart from concerns about mechanical properties degradation with
temperature, another issue that needs consideration is the loss of bond between FRP and concrete
when exposed to elevated temperatures. The performance of FRP depends on the strength of the
polymer adhesive used to bond the FRP sheet/laminate to the concrete surface. FRP is
susceptible to rapid loss of bond strength and stiffness above glass transition temperature ( )gT
(Blontrock et al. 1999). Glass transition temperature refers to the temperature at which an
adhesive changes from a relatively stiff material to viscous material leading to a significant drop
in strength and stiffness properties. Typically, the glass transition temperature for commonly
used polymers (adhesive) varies between 60 to 82oC (ACI 2008).
In FRP-strengthened members, the main load carrying mechanism is through transfer of
stresses from concrete substrate to FRP reinforcement. This transfer of forces to FRP
reinforcement occurs through development of shear stresses at the interface of FRP and concrete
(Denton 2001). However, when the temperature at the interface reaches gT , the bond properties
of the adhesive (shear modulus and bond strength) deteriorate considerably and introduces a slip
at the interface (Leone et al. 2009). This slip significantly reduces force transfer from concrete to
FRP composite, and subsequently leads to debonding of FRP. Research has indicated that
reaching gT of adhesives is a critical factor governing the fire response of externally bonded
FRP-strengthened RC structural members (Camata et al. 2007).
1.3 Fire Behavior of FRP-strengthened RC Beams
Flexural strengthening of RC beams is usually achieved by applying thin layers of FRP
sheets on tension face (beam soffit), while shear strengthening is achieved through application of

7
FRP on the side faces of beam. This technique has wider acceptance as compared to using steel
plates or external post-tensioning (surface mounting) techniques due to ease of application.
Application of FRP sheets on beam soffit can considerably improve flexural capacity of a
retrofitted beam.
When exposed to fire, FRP-strengthened RC beams behave differently from that at ambient
temperature since strength and stiffness of the beam (including FRP) degrade with temperature
rise. This degradation in strength and stiffness properties leads to decrease in load carrying
capacity of a beam. Strength failure occurs in the beam when moments due to applied load
exceeds decreasing flexural capacity of the beam. The time to reach this limit state is referred to
as fire resistance of the beam. The fire resistance of an FRP-strengthened RC beam depends on a
number of factors including type of fire exposure, loading, support conditions, type of insulation
and high temperature properties of constitutive materials.
Generally, FRP-strengthened RC beams experience higher stresses as compared to an un-
strengthened RC beam since the load level on a strengthened beam is relatively higher. The
higher stress level in the beam can lead to early strength failure in the absence of any fire
protection since FRP starts to burn in the first 10-15 minutes. Therefore, provision of external
insulation is critical to achieving reasonable fire resistance in FRP-strengthened beams (Williams
et al. 2006). There is very little information on the required level of insulation under realistic fire,
loading, and restraint levels.
Flexural strengthening of beams is bond-critical application in which FRP is bonded to the
tension face of the beam using polymer adhesive. At elevated temperatures, bond between FRP
and concrete is a critical factor that influences the behavior of FRP-strengthened RC beams. In
most previous studies, a perfect bond was assumed at the interface of FRP and concrete up to the

8
glass transition temperature of the adhesive and thereafter, the bond was assumed to be
completely lost. The bond degradation is gradual in early stages of fire exposure (lower
temperature increase at interface) and its properties drop significantly in the region of polymers
gT . However, unidirectional FRP continue to be structurally effective (contribute to strength
capacity) at temperatures above gT . Therefore, for a realistic assessment of fire performance of
strengthened members, bond degradation with temperature has to be accounted for. Capturing
temperature induced bond degradation in full scale fire tests is not easy due to lack of
instrumentation (strain gauges) that can survive rapid rising high temperatures. However,
numerical models can be effectively used to predict bond degradation, provided bond properties
at high temperature are known.
FRP-strengthened RC beams can experience significant thermal expansion under elevated
temperatures. When support conditions prevent such free expansion, axial restraint force gets
induced in the strengthened beam. This axial restraint force depends on many factors such as
type of fire scenario, support conditions, high temperature properties of constitutive materials
and loading. During early stages of fire exposure, the fire induced restraining force generates an
arch action that helps to counter moments due to applied loading. However, at later stages, when
the beam undergoes large deflections due to deterioration of strength and stiffness properties of
the beam, the restraining force creates secondary bending moments ( )P that result in an
increase in bending moments. Thus, axial restraining force can influence the fire response of a
strengthened beam.
Numerous studies have been conducted to trace the response of FRP-RC members at
ambient conditions. These studies addressed overall structural response of FRP-strengthened

9
members (Dortzbach 1999; Grace 2001; Kodur et al. 2006; Mayo et al. 1999; Shahrooz and Boy
2004; Shahrooz et al. 2002; Takeda et al. 1996; Williams et al. 2008), creep and fatigue effects
(Scott et al. 1995; Yang and Nanni 2002), and factors contributing to durability enhancement
(Green et al. 2000; Green et al. 2003; Neale 2001; Toutanji and Gomez 1997; Waldron et al.
2001). Based on these studies, guidelines have been developed for room temperature design of
FRP-strengthened RC members. Such guidelines are available in ACI Committee 440: Guide for
the Design and Construction of Externally Bonded FRP Systems for Strengthening Concrete
Structures (2008), ISIS Design Manual No. 4: Strengthening Reinforced Concrete Structures
with Externally Bonded Fiber Reinforced Polymers (2001), and Bulletin 14: Externally bonded
FRP Reinforcement for RC Structures (2001). All these codes and guidelines comment on the
susceptibility of FRP materials to elevated temperatures. Even-to-date, no specific fire design
guidelines are available for fire design. As an example, ACI 440.2R (2008) assumes no
contribution from FRP in the event of fire. Under fire conditions, there have been limited
experimental and numerical studies to evaluate fire response of FRP-strengthened RC members.
In case of experiments, only standard fire tests have been conducted which aimed at developing
proprietary fire resistance ratings. No consideration was given to evaluate response of FRP-
strengthened members under realistic fire, loading, restraint and bond conditions. Also, in the
case of numerical models, thermal response has been studied under standard fire exposure
without giving any due consideration to overall structural response, effect of fire induced bond
degradation and axial restraint force. Thus, absence of reliable numerical models, as well as
relatively high cost of the tests are the two main reasons for lack of fire design provisions in
codes and standards.
10
To overcome some of the above knowledge gaps, it is proposed to undertake detailed studies
on response of FRP-strengthened RC beams exposed to fire. Fire response depends on a number
of factors including fire exposure, member type and dimensions, high temperature material
properties (concrete, steel, FRP and insulation), load level, geometric properties, restraint and
bond etc. The extent of influence of many of these parameters on fire response of FRP-
strengthened RC beams is not well established. As part of this research, it is proposed to
undertake both fire experiments and numerical studies to develop an understanding of the
response of FRP- strengthened RC beams under realistic fire and loading conditions.
1.4 Research Objectives
From the above discussion, it is evident that one of the main impediments for using FRP
in buildings is the lack of knowledge about the structural response of FRP-strengthened systems
under fire. This experimental and numerical study examines the implications of high temperature
thermal susceptibility on currently used FRP materials in civil engineering applications and on
structural behavior of FRP-strengthened RC beams. To achieve this objective, extensive
literature review followed by development of numerical model, full-scale fire tests and
parametric studies on FRP-strengthened RC beams have been conducted. Specific objectives of
this research are:
Conduct detailed state-of-the-art review on fire performance of FRP-strengthened RC
beams.
Develop a macroscopic finite element model (FEM) to trace the response of FRP-
strengthened RC beams under realistic loading and fire scenarios. The model will account
for non-linear high temperature properties of constitutive materials, fire induced bond
degradation and axial restraint effects.

11
Conduct fire resistance tests on FRP-strengthened RC beams under standard and design
fires for different load levels and insulation schemes.
Use data generated from fire tests to validate the numerical model.
Carry out parametric studies to quantify the influence of various critical factors on fire
performance of FRP-strengthened RC beams.
Use data generated from parametric studies and fire tests to develop guidelines for fire
design of FRP-strengthened beams.
1.5 Scope and Outline
The work presented in this thesis involves both experimental studies and development and
application of a numerical model. As part of experimental program, four full-scale FRP-
strengthened RC beams and one control RC beam were fabricated and tested under applied loads
to evaluate fire response. The numerical work involved development of macroscopic finite
element model to trace the fire response of FRP-strengthened RC beams. The model was
validated by using the test data generated from current fire tests and data available in the
literature. The validated model was then applied to undertake parametric studies to quantify
influence of various factors on fire response of FRP-strengthened RC beams. Results from the
fire tests and the parametric studies were utilized to develop guidelines for fire design of FRP-
strengthened RC beams.
The thesis is organized into seven chapters. Chapter 2 presents extensive review of the
literature related to FRP as material and as a component of a structural member. Detailed
discussion on high temperature properties of concrete, steel, FRP and insulation is presented. The
chapter also includes summary of experimental and numerical modeling work that has been
conducted previously on FRP-strengthened RC beams.

12
Chapter 3 provides details on the fire resistance tests. Full details on the fabrication of test
beams, instrumentation, testing procedure and test results are presented. The discussion focuses
on both thermal and structural response of the FRP-strengthened RC beams.
The development of the fire resistance model to trace the response of FRP-strengthened RC
beams under fire exposure is presented in Chapter 4. Detailed procedure involved in tracing the
fire response of FRP-strengthened RC beams is explained. Chapter 5 deals with model
validation, where predictions from the model are compared with the test data from literature, as
well as with data obtained from tests conducted as part of this research. Chapter 6 discusses
results of parametric studies undertaken to quantify influence of various factors on fire
performance of FRP-strengthened RC beams, followed by fire design guidelines. Chapter 7
provides conclusions and recommendations for future research.
A set of appendices is included that provide detailed information not presented in the main
body of the text. Appendix A provides high temperature constitutive relationships for material
properties which include concrete, reinforcing steel, FRP and insulation. Appendix B
summarizes the design and load calculations for FRP-strengthened RC beam according to design
codes.

13
CHAPTER 2 STATE-OF-THE-ART REVIEW 2.1 General
FRP materials were originally developed in early 1960’s and 70’s by aerospace and defense
industries for specific applications such as aircrafts, ships and military hardware’s (ACI 2002).
Therefore, significant information is available on FRP properties at room temperature (Davies et
al. 2004). In the last two decades, FRP’s have been extended to civil infrastructure applications
and are increasingly used for strengthening and retrofitting of RC structures due to ease of
application, cost effectiveness and efficient performance. These strengthening and retrofitting
techniques widely utilize externally bonded FRP composites due to unique properties such as
strength, light weight, corrosion and chemical resistance (Bakis et al. 2002). The early
application of FRP started as flexural strengthening in RC bridge girders and as confinement to
RC columns. Today, wide varieties of structural elements are being strengthened using FRP
including beams, slabs, columns, shear walls, domes and trusses.
Prior to arrival of FRP, the most popular technique for strengthening RC structures was
using steel plates. This technique had many shortcomings like heavy plates (steel), corrosion of
steel that deteriorates bond between steel plate and the concrete, and requirement for specialized
equipment at site for placement of steel plates. Therefore, FRP sheets have replaced steel plates

14
in strengthening applications (Teng et al. 2002). These sheets can be tailored to meet specific
structural requirements.
Until recently, most strengthening applications of FRP was in bridges and other structures
where fire safety is not a major issue (Kodur et al. 2006). For use in buildings, FRP-strengthened
RC members have to satisfy fire resistance requirements specified in building codes and
standards. Thus, there is a legitimate concern on the performance of such strengthened/reinforced
structures under fire conditions.
This chapter presents a state-of-the art review on the fire performance of FRP as material
and as a component of structural system. This includes, review of high temperature material
properties (concrete, reinforcing steel, FRP and insulation), behavior of FRP strengthened
members at elevated temperatures, as well as main findings from previous fire tests and
numerical studies on FRP-strengthened beams. Finally, design provisions in different codes and
standards for FRP strengthened structural members are reviewed.
2.2 Flexural Strengthening of Reinforced Concrete Members
Flexural strengthening of RC beams through FRP plates was first explored at the Swiss
Federal Laboratory for Materials Testing Research (EMPA) in 1994 (Deuring 1994). As part of
this research, CFRP plates were applied to the beam soffit for flexural strengthening of RC
beams. The key justification for using the FRP technology to strengthen RC beams was the high
strength to weight ratio, corrosion resistance, reduce labor cost, ease of handling and durability
of FRP (Teng et al. 2002).
Flexural strengthening of RC members is undertaken by applying FRP composite (high
strength fibers and matrix) along principle load direction. In beams, the orientation of fibers
coincides with the longitudinal axis of the beam. There are several techniques that have been

15
explored to bond FRP to concrete substrate. Amongst these techniques, externally bonding FRP
to tension face of the beam using adhesive (polymer resin) is most conventional technique in
civil engineering applications. The FRP sheet is either available as prefabricated (also known as
prepeg or pultruded) or constructed on site with a wet lay-up process. In both types, FRP is
bonded to the concrete surface using the adhesive. The application of FRP requires special
surface preparations to improve bond between FRP and concrete. These surface preparations
involve removal of weak smooth surface texture of concrete to expose aggregate which provide a
strong bonding surface. Several special techniques are available to externally bond FRP to RC
structures, such as (Bakis et al. 2002):
Prestressed strips
Automated wrapping and curing
Fusion-bonded pin-loaded straps
Placement inside slits
Prefabricated shapes
Mechanically fastened FRP strips
There are a number of procedures to strengthen RC beams using FRP composites. The most
common method is bonding of FRP to the beam soffit without pre-stressing (unstressed) FRP, as
shown in Figure 2.1(a). This application procedure involves adhesive bonding of prefabricated
FRP, wet lay-up or resin infusion method (refer to Figure 2.2). To prevent most likely failure
mechanism in FRP-strengthened RC beams i.e., debonding of FRP at the terminating ends,
installation of mechanical or U shaped anchorage is another technique of strengthening beams.
Application of pre-stressed FRP at the beam soffit is another technique adopted at locations
where FRP is required to carry some portion of the loading before additional load is applied or

16
where reduction of existing cracks in concrete is important (Teng et al. 2002). In all these
applications, the main concern remains structural performance of the member after adding FRP.
A number of failure modes for RC beams bonded with FRP at tension face of the beam have
been observed in numerous experimental studies (Arduini and Nanni 1997; Gao et al. 2005;
Garden and Hollaway 1998; Pei and Pilakoutas 2003; Ritchie et al. 1991; Saadatmanesh and
Ehsani 1991). Figure 2.3 schematically shows the possible failure modes in FRP-strengthened
RC beams which include: (a) steel yielding followed by FRP rupture; (b) steel yielding followed
by concrete compressive crushing of concrete; (c) shear failure in beam; (d) concrete cover
delamination; (e) FRP peel-off initiating at end due to inclined shear cracks in concrete; (f) Peel-
off at termination due to high tensile stresses in the adhesive; (g) FRP peel-off at
termination/cutoff point due to shear crack in concrete.
Wet lay-up procedure Bonding of pre-fabricated FRP laminate
Figure 2.1: Application of FRP in the field

17
(a)
(b)
(c)
Figure 2.2: RC beams bonded with (a) FRP at beam soffit (b) FRP and U-strip end
anchorages (c) Pre-stressed FRP

18
(a)
(b)
(c)
(d)
(e)
(f)
(g)
Figure 2.3: Failure modes of FRP-strengthened RC beams (a) FRP rupture (b) crushing of compressive concrete (c) shear failure (d) concrete cover separation (e) plate-end interfacial debonding (f) intermediate flexural crack-induced interfacial debonding (g) intermediate flexural shear crack-induced interfacial debonding
FRP Rupture

19
2.2.1 FRP Products
FRP posses superior properties and is widely usable in numerous forms. With increased use
in civil engineering projects, the cost is coming down as the retrofitting market is flourishing
over the past decade. The cost of application in civil engineering projects is going down as the
industry is flourishing in past decade. FRP composites are formed of continuous fibers embedded
in a polymer matrix. Common fibers used are carbon, glass and aramid fibers and accordingly
are designated as CFRP, GFRP and AFRP, respectively. Common types of matrix include
polyester, vinyl-ester and epoxy. The composite product formed by combining fibers and matrix
has superior properties than its original constituent. The volume fraction of fibers in composite
varies from 40 to 65%.
2.2.1.1 Fibers
Fibers are main load carrying component in an FRP composite. These are aligned along
loading direction of the structural member to utilize high strength and stiffness properties. The
performance of FRP composite depends on the type, volume fraction and orientation of fibers.
Common types of fibers used are glass, carbon and aramid. Glass fibers are sensitive to moisture
and highly susceptible to creep rupture and hence they lose strength and stiffness quickly under
sustained loading (Bank et al. 1995). Glass fiber is the most inexpensive amongst the category of
high-performing fibers. In structural engineering applications, carbon fibers are widely used for
strengthening because of high longitudinal modulus and strength. Moreover, carbon fibers
perform satisfactorily in moist environment and under fatigue loading. These fibers are
dimensionally very stable with negative or very low coefficient of thermal expansion in
longitudinal direction. Carbon fibers provide low impact resistance and insulating capacity.
Thus, carbon fibers are preferred choice for use in fire applications. Aramid fibers are the least

20
commonly used amongst the three high performing fibers due to high cost inspite of superior
properties like higher stiffness and excellent impact resistance.
A comparison of tensile strength of common fiber reinforcement, titanium, steel, and
aluminum (used in engineering applications) is shown in Figure 2.4. It can be seen that the
tensile strength of the carbon, aramid (Kevlar) and glass fibers exceed strength of steel by about
two times and from that of aluminum by as much as 400%. The specified strength of all of the
fibers surpasses that of the metals by about ten times.
Figure 2.4: Tensile strength of typical fibers and metals (Source: Composite Tek, 2003)
2.2.1.2 Matrix
Matrix refers to polymer ingredient of FRP composite that binds the fibers together. Other
terms used for its description are resin, polymer and binder. Polymers can be in liquid or solid
state, and cured polymer is referred to as matrix. Matrixes themselves do not contribute any
significant strength to FRP composite since most of the load is shared by the fibers. The matrix
provides a medium to transfer stresses between adjoining fibers (load path), a shield against
0
100
200
300
400
500
600
700
Ult
ra H
igh
Mod
ulu… Hig
h M
odul
u…In
tmd
Mod
ulu…
Sta
ndar
d M
odul
u…
Kev
lar
29
Kev
lar
49
S-G
lass
Tit
aniu
m
Car
bon
Ste
el
Alu
min
um
Str
engt
h (k
si),
Spe
cifi
c S
tren
gth
(104
in.)
Strength
Specific Strength

21
external environmental effects and protection against mechanical abrasion. In general, the three
most common forms of matrices (resins) currently used are polyester, vinyl ester, and epoxy. A
brief description of each resin is presented in Table 2.1.
The matrix has poor mechanical and thermal characteristics. There are two broad categories
of polymer materials; thermoplastic and thermosetting. Thermosetting polymers are cross-linked
by strong covalent bonded atoms. These cannot be heated, softened and reformed into different
shapes. While in thermoplastic polymers, the molecular chains are not cross linked, but are held
together by weak van der Waals forces. Thermosets are most suitable for structural application
due to cross linking property (Blontrock et al. 1999). These are thermally stable at service
temperature, have low creep effect and higher chemical resistance as compared to
thermoplastics. The advantages of thermoset resins over thermoplastic resins are:
Better creep resistance
Improved stress relaxation
Thermal stability
Chemical resistance
Low- gT polymers such as polypropylene (PP) have lower-weight molecules
and strength
Glass transition temperature ( )gT is a thermal property of polymer (matrix) that is of interest
to structural engineers. At gT mechanical (stiffness) and physical properties of polymer undergo
significant changes. When the temperature reaches close to gT , the polymer changes from glassy
(rigid) to rubbery (viscous) state, thus, elastic modulus decreases significantly.
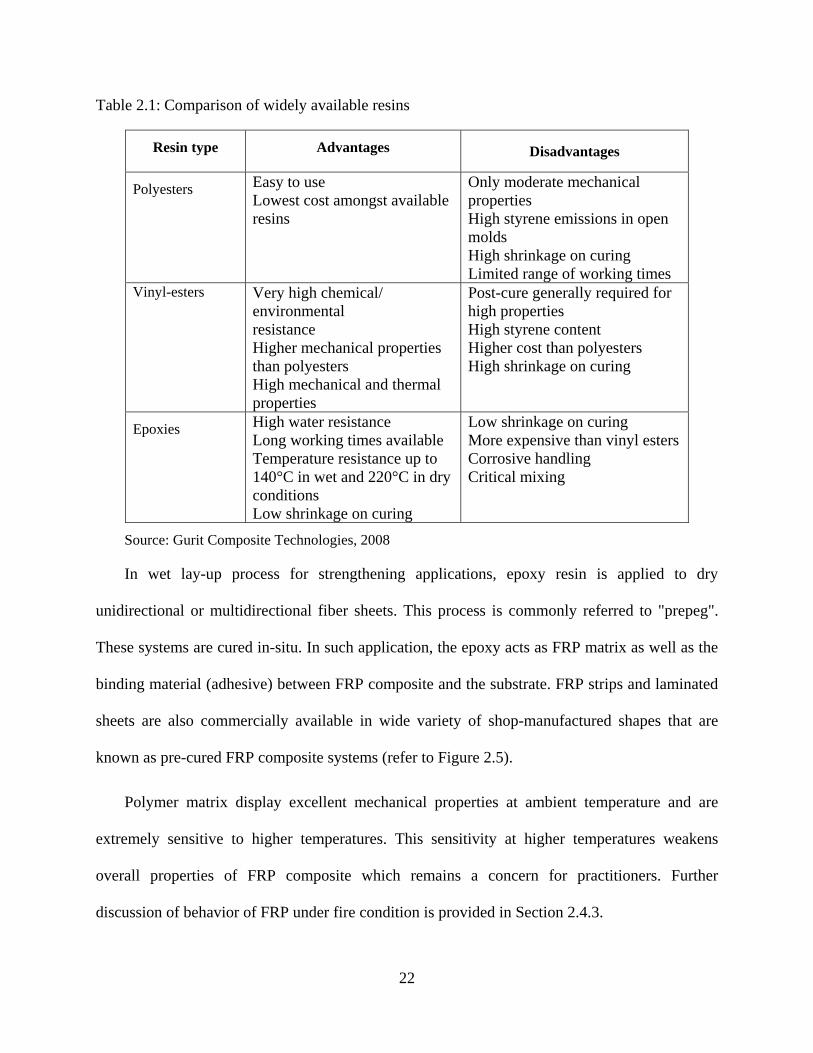
22
Table 2.1: Comparison of widely available resins
Resin type Advantages Disadvantages
Polyesters Easy to use Lowest cost amongst available resins
Only moderate mechanical properties High styrene emissions in open molds High shrinkage on curing Limited range of working times
Vinyl-esters
Very high chemical/ environmental resistance Higher mechanical properties than polyesters High mechanical and thermal properties
Post-cure generally required for high properties High styrene content Higher cost than polyesters High shrinkage on curing
Epoxies High water resistance Long working times available Temperature resistance up to 140°C in wet and 220°C in dry conditions Low shrinkage on curing
Low shrinkage on curing More expensive than vinyl esters Corrosive handling Critical mixing
Source: Gurit Composite Technologies, 2008
In wet lay-up process for strengthening applications, epoxy resin is applied to dry
unidirectional or multidirectional fiber sheets. This process is commonly referred to "prepeg".
These systems are cured in-situ. In such application, the epoxy acts as FRP matrix as well as the
binding material (adhesive) between FRP composite and the substrate. FRP strips and laminated
sheets are also commercially available in wide variety of shop-manufactured shapes that are
known as pre-cured FRP composite systems (refer to Figure 2.5).
Polymer matrix display excellent mechanical properties at ambient temperature and are
extremely sensitive to higher temperatures. This sensitivity at higher temperatures weakens
overall properties of FRP composite which remains a concern for practitioners. Further
discussion of behavior of FRP under fire condition is provided in Section 2.4.3.

23
(a) Woven glass fiber (b) Woven carbon fiber (c) CFRP pultruded sheets
Figure 2.5: Various FRP composite products for strengthening applications
2.2.1.3 FRP Composite
A wide variety of FRP composites (different formulations) are available for RC structures.
CFRP and GFRP are most commonly used composites in civil engineering applications. Use of
AFRP is rare because of comparatively high cost (Intelligent Sensing for Innovative Structures
(ISIS) 2001), sensitivity to creep, durability concerns (moisture absorption) and poor
performance at elevated temperatures (Uomoto et al. 2002). The material properties of FRP
composite depend on the mechanical properties of matrix, fiber-volume fraction, fiber cross-
sectional area, fiber orientation in the matrix, and method of manufacturing (Bisby 2003). The
strength and stiffness properties of FRP composite are governed by the fibers. The focus of
current work (presented in his section) is on properties of unidirectional FRP composites.
The stress-strain behavior of FRP composite is linear elastic up to brittle failure (in tension).
Figure 2.6 give diagrammatic representation of stress-strain curves for CFRP, GFRP and AFRP
compared to structural steel. It can be seen that FRP composite exhibit higher tensile strength
than steel. Moreover, this material is highly brittle with very less ductility as compared to steel.
FRP’s do not display yield behavior similar to observed for steel. Therefore, when used for

24
flexural strengthening RC members, the ductility of member is reduced. However, strength and
ductility of structural members (concrete) is enhanced considerably when FRP composite is used
for confinement of concrete such as for RC columns. Table 2.2 provides qualitative comparison
of available FRP materials with respect to strength, durability and cost criteria.
Figure 2.6: Stress-strain curves for FRP and mild steel
0
500
1000
1500
2000
2500
3000
0 0.5 1 1.5 2 2.5
Stre
ss (M
Pa)
Strain (% age)

25
Table 2.2: Qualitative comparison between carbon, aramid and E-glass fibers (Meier 1995)
Criteria Carbon Aramid E-glass
Tensile Strength Very good Very good Very good
Compressive strength
Very good Inadequate Adequate
Modulus of Elasticity
Very good Good Adequate
Long term behavior Very good Good Adequate
Fatigue behavior Excellent Good Adequate
Bulk density Good Excellent Adequate
Alkaline resistance Very good Good Inadequate
Price Adequate Adequate Very good
2.3 FRP Composites for Civil Engineering Applications
FRP composite materials are becoming increasingly attractive for retrofitting and
strengthening of civil engineering structures. This is because FRP’s have strong, durable, light
weight and ease of application characteristics and provides cost effective alternative solution for
conventional construction materials. For civil engineering application, the required
characteristics for a material are high-volume with low cost, extended service and minimum
maintenance in its life span. The successful application of FRP composite for strengthening and
retrofitting of RC structures is attributed to many advantages such as:
High strength and stiffness properties
Enhanced fatigue tolerance
Resistance to corrosion
High strength-to-weight ratios

26
Controllable mechanical and thermal properties
Non-magnetic characteristics
Easy and fast installation in the field resulting in more economical procedures
Lower life cycle cost
Reparability
Design flexibility
Notwithstanding above mentioned advantages, some major disadvantages that are associated
with FRP material are:
High initial material cost
Lack of ductile behavior
Long term durability
Variation in finished product properties
Environmental effects
Lack of design guidance
Uncertain properties at elevated temperatures
In the recent years, considerable research work has been conducted on FRP materials and on
FRP reinforced concrete members. This includes overall structural response of FRP-strengthened
members (Dortzbach 1999a; Grace 2001; Kodur et al. 2006; Mayo et al. 1999; Shahrooz and
Boy 2004; Shahrooz et al. 2002; Takeda et al. 1996; Williams et al. 2008), creep and fatigue
effects (Scott et al. 1995; Yang and Nanni 2002), and factors contributing to durability
enhancement (Green et al. 2000; Green et al. 2003; Neale 2001; Toutanji and Gomez 1997;
Waldron et al. 2001). increasing flexural strength of RC members (Ashour et al. 2004; Dortzbach

27
1999b; El-Hacha et al. 2001; Grace 2001; Grace et al. 1999), shear capacity enhancement
(Chaallal et al. 1998; Chen and Teng 2003; Kachlakev and McCurry 2000; Khalifa et al. 1998;
Pellegrino and Modena 2002; Teng et al. 2004; Wang and Hsu 2009; Zhang et al. 2004), repair
and rehabilitation of RC columns (Ballinger et al. ; Darwish 2000; Lan et al. 1998; Triantafillou
1998) , retrofitting of columns in earthquake prone areas (Ghobarah 2001). This research has
lead to wider spread in use of FRP for strengthening and retrofitting of RC columns, beams and
slabs.
2.3.1 Externally Bonded FRP-strengthening of RC Beams
Unidirectional FRP sheets are commonly used to enhance the flexural capacity of RC
beams. An increase of up to 160% in beam capacity has been reported in the literature (Meier
and Kaiser 1991; Ritchie et al. 1991), however, ductility and serviceability constraints limits the
percentage of increase to about 40% (Balaguru et al. 2008). Typical response (load–midspan
deflection) of an FRP-strengthened RC beam is compared to that of a control RC beam (un-
strengthened) in Figure 2.7. It can be seen that provision of FRP layers increases both the
moment capacity and the stiffness of the beam with reduction in deflection at time of failure. In
control RC beam, the majority of the load is carried by bottom steel reinforcement. The steel
yields at some point and thereafter, the behavior of the beam is ductile till failure. However, in
FRP-strengthened RC beam, additional tensile force is carried by the FRP applied at tension face
of the beam that results in an increase in load carrying capacity. Thus, strengthening of RC
beams with externally bonded FRP is feasible way to increase the load carrying capacity and
stiffness characteristics of existing member. However, strengthening significantly reduces the
deformability (ductile behavior) of the strengthened member as well as brittle and sudden failure
occurs.
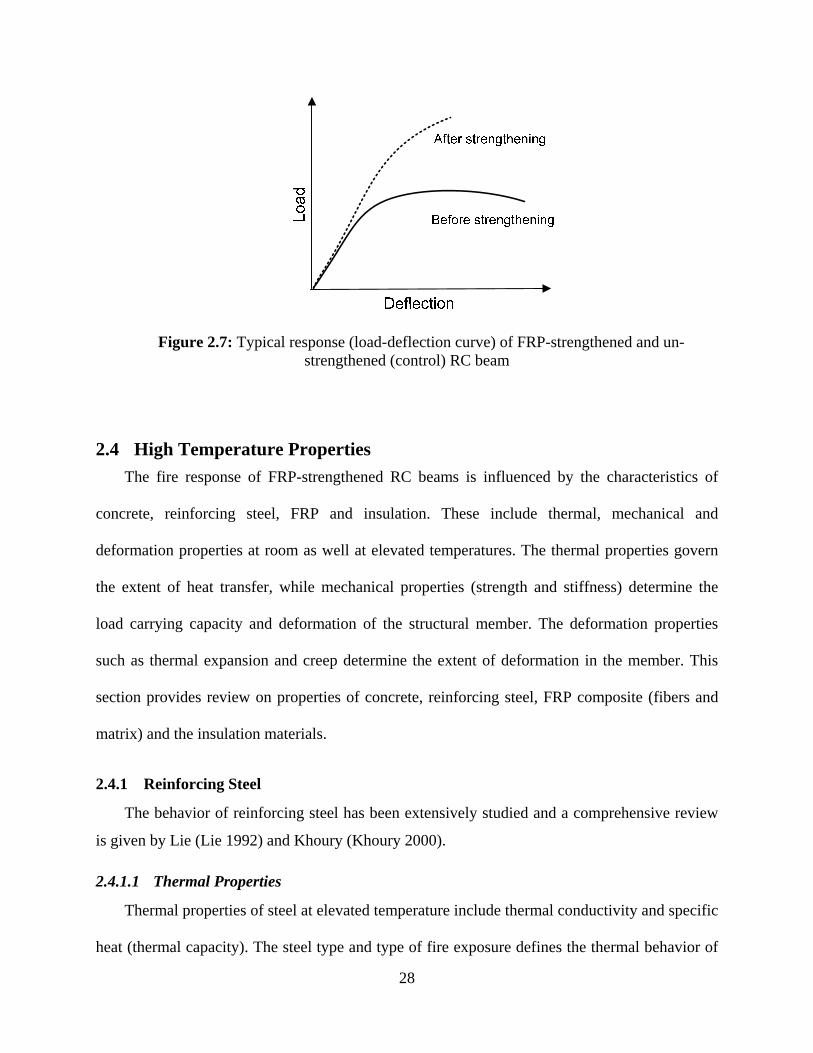
28
Figure 2.7: Typical response (load-deflection curve) of FRP-strengthened and un-strengthened (control) RC beam
2.4 High Temperature Properties
The fire response of FRP-strengthened RC beams is influenced by the characteristics of
concrete, reinforcing steel, FRP and insulation. These include thermal, mechanical and
deformation properties at room as well at elevated temperatures. The thermal properties govern
the extent of heat transfer, while mechanical properties (strength and stiffness) determine the
load carrying capacity and deformation of the structural member. The deformation properties
such as thermal expansion and creep determine the extent of deformation in the member. This
section provides review on properties of concrete, reinforcing steel, FRP composite (fibers and
matrix) and the insulation materials.
2.4.1 Reinforcing Steel
The behavior of reinforcing steel has been extensively studied and a comprehensive review
is given by Lie (Lie 1992) and Khoury (Khoury 2000).
2.4.1.1 Thermal Properties
Thermal properties of steel at elevated temperature include thermal conductivity and specific
heat (thermal capacity). The steel type and type of fire exposure defines the thermal behavior of

29
steel reinforcement. The heat transfer through steel is very rapid as compared to concrete due to
high conductive characteristics of steel reinforcement. At room temperature, thermal
conductivity may vary slightly depending on the chemical composition of steel (Bisby 2003).
However, at elevated temperature, thermal properties are more dependent on temperature and are
less influenced by the steel composition (Williams 2004a).
Thermal conductivity decreases linearly with increasing temperature up to about 900oC and
thereafter remain constant at elevated temperatures (Lie 1992). Figure 2.8(a) shows the variation
of thermal conductivity of reinforcing steel with temperature. Specific heat, defined as amount of
heat required to raise the temperature of unit mass by unit degree, varies with temperature (see
Figure 2.8(b)). The peak in specific heat around 700oC can be attributed to phase transformation.
The steel reinforcement area is very small in comparison to overall concrete section and also
reinforcing steel is located within the concrete section; therefore, steel has almost no influence
on temperature distribution within concrete cross section.
(a) (b)
Figure 2.8: Variation of (a) Thermal conductivity (b) Thermal capacity with temperature for reinforcing steel (reproduced after Lie 1992)
0
10
20
30
40
50
60
0 500 1000 1500
The
rmal
Con
duct
ivit
y (W
/m-o C
)
Temperature (oC)
0
2
4
6
8
10
12
0 500 1000 1500
The
rmal
cap
acit
y (×
10-6
J/m
3-
o C)
Temperature (oC)

30
2.4.1.2 Mechanical Properties
The mechanical properties that influence fire response are yield strength, ultimate strength,
elastic modulus and stress-strain relationship. Literature review suggests that there is
considerable variation in yield and ultimate strength of steel since these properties depend on
steel composition and the definition of yield strength. (Buchanan 2002). Stress-strain curves for
mild steel at various temperatures are shown in Figure 2.9. It can be seen that the yield strength
decreases with temperature and well defined yield plateau disappears at higher temperatures.
Figure 2.10 shows that elastic modulus, yield and ultimate strength of reinforcing steel decreases
with temperature. The reinforcing steel recovers nearly all of its original yield strength upon
cooling as long as heating temperatures do not exceed 500°C (Neves et al. 1996). Eurocode
assumes that reinforcing steel maintain its room temperature strength up to 400oC. Type of fire
exposure is an important factor to be considered in evaluating fire resistance of RC members.
Concrete and reinforcing steel recover some of its strength and stiffness during decay (cooling)
phase of design fires (non standard fire). The amount of recovery depends on the highest
temperature recorded in reinforcing steel. Reinforcing steel heated above 500oC experience a
gradual decrease in residual strength. Therefore, the behavior of reinforcing steel in the cooling
phase is critical for modeling the response of FRP-strengthened RC structural members exposed
to real (design) fire scenarios. The details about high-temperature constitutive models for
mechanical properties of reinforcing steel are presented in the Appendix A.

31
Figure 2.9: Stress-strain curves for steel (300 MPa yield strength) as function of temperature (reproduced after Lie, 1992)
(a) (b)
Figure 2.10: Variation of (a) Modulus (b) Yield and ultimate strength with temperature for reinforcing steel (reproduced after Lie 1992)
2.4.1.3 Deformation Properties
Thermal elongation and creep strain are the deformation properties of steel. The thermal
elongation of steel is quantified through coefficient of thermal expansion (CTE) that indicates
thermal strain induced per degree rise of temperature. In general, CTE of reinforcing steel
0
100
200
300
400
500
600
0 0.02 0.04 0.06 0.08 0.1 0.12
Stre
ss (M
Pa)
Strain
20 C200 C400 C600 C
0
50
100
150
200
250
0 200 400 600 800
Mod
ulus
(×
103
MP
a)
Temperature (oC)
0
20
40
60
80
100
120
0 200 400 600 800
Per
cent
age
of O
rigi
nal
Str
engt
h
Temperature (oC)
Yield strength
Ultimate strength
Cold drawn wire
Structural steel

32
increases with temperature except between 650 to 815oC where it decreases due to molecular
transformation in steel. Thereafter, it increases again as shown in Figure 2.11.
Figure 2.11: Variation of thermal expansion as function of temperature (reproduced after Lie 1992)
Creep is time dependant increase in plastic strain under constant stress. This is an important
property of reinforcing steel that has significant influence on behavior of RC members under fire
conditions (above 450oC). Thus, creep should be included in numerical modeling to evaluate fire
performance of structural member (beam). Limited information is available in the literature
about creep strain variation with temperature for steel reinforcement. The available creep
models, such as the one proposed by Harmathy (Harmathy 1967), are based on Dorn’s theory,
which relates the creep strain to the temperature, stress, and time. More information on
Harmathy’s creep model is provided in Chapter 4.
2.4.2 Concrete
2.4.2.1 General
Concrete is a non-combustible construction material that do not contribute readily to heat
transfer (good insulating material) (Khoury 2000). Concrete undergoes physiochemical changes
0.00
0.20
0.40
0.60
0.80
1.00
1.20
0 200 400 600 800 1000
The
rmal
Exp
ansi
on (%
age
of
orig
inal
)
Temperature (oC)
Transformation to Austenite

33
when heated and the influence of temperature is different for sealed and unsealed concrete.
Strength loss in concrete depends on type of aggregate and cement blend used in the mix and is
negligible up to 300oC. However, this temperature range of deterioration of mechanical
properties can be enhanced to 500oC by judicious design of concrete mix (Khoury 2000). Creep
strains in concrete gets significant at about 550-600oC, thus, deformations in concrete can be
significant above 600oC.
2.4.2.2 Thermal Properties
Thermal conductivity and specific heat (heat capacity) are the two properties that influence
thermal response of FRP-strengthened RC beams. In literature, there is available test data on
characterizing thermal properties of concrete at elevated temperatures (Kodur and Sultan 2003;
Lie and Kodur 1995; Lie and Kodur 1996; Saad et al. 1996; Shin et al. 2002; Van Geem et al.
1997). These properties significantly depend on type of aggregate (siliceous, carbonate or light
weight) used in the concrete. Figures 2.12 and 2.13 shows the variation of thermal conductivity
and specific heat of normal strength concrete (NSC) as a function of temperature as given in
ASCE Manual (1992) and Eurocode 2 (2004) and upper and lower range of values from
published test data (shown in solid lines). It can be seen that there is considerable variation in test
data which can be attributed to differences in test procedure and measuring techniques. Type of
aggregate has considerable influence on thermal properties of concrete. Peaks observed in heat
capacity of carbonate aggregate, in the temperature range of 600-800oC is caused by the
endothermic reaction as a result of decomposition of dolomite. This reaction consumes large
amount of heat energy and this helps to enhance fire resistance. The high temperature
constitutive models for thermal properties are presented in Appendix A.

34
Figure 2.12: Variations of measured and predicted of thermal conductivity as a function of temperature for normal strength concrete (NSC)
Figure 2.13: Variations of measured and predicted of thermal capacity as a function of temperature for normal strength concrete (NSC) mechanical properties
Mechanical properties include compressive strength, elastic modulus and stress-strain
relationship and these vary as a function of temperature. These properties are generally obtained
through two test procedures; either measuring the response during specimen is exposed to
0
0.5
1
1.5
2
2.5
3
0 200 400 600 800 1000
The
rmal
con
duct
ivit
y (W
/m.o C
)
Temperature (oC)
Eurocode (lower)Eurocode (upper)ASCE (carbonate)
Test -upperbound
Test -lower bound
0
5
10
15
20
0 200 400 600 800 1000 1200 1400
The
rmal
cap
acit
y (×
10-6
J/m
3-
o C)
Temperature (oC)
Siliceous
Light weight
Carbonate
Eurocode
Upper bound - Test
Lower bound - Test

35
elevated temperature or making the measurements when the specimen is cooled to ambient
temperature after heated to desired temperature level.
The variation of elastic modulus with temperature for different concrete types is shown in
Figure 2.14. In general, the modulus of elasticity if concrete decreases significantly with increase
in temperature. Studies have shown that type of aggregate in concrete slightly effect the rate of
decrease of elastic modulus. In the tests conducted by Schneider (Schneider 1988), the author
reports that factors such as original strength and water-cement ratio do not significantly affect the
elastic modulus at elevated temperatures.
Figure 2.14: Variation of elastic modulus of concrete as a function of temperature
Figures 2.15 and 2.16 show the variation of compressive strength with temperature for
normal and high strength concretes, respectively. For normal strength concrete (NSC), there is
not much variation in compiled test data. The data for high strength concrete (HSC) shows a
large variation especially in the range of 200-500oC. This variation can be attributed to various
factors such as occurrence of concrete spalling during testing, variation in testing procedure
0
20
40
60
80
100
120
0 200 400 600 800 1000
ET
/ ET
=20
o C
Temperature (oC)
LightweightSiliceousCarbonate

36
(different heating and loading rate), test conditions, limitations of testing apparatus, and
measuring techniques. This test data formed the basis of constitutive relationships for high
temperature mechanical properties of concrete. These relationships are presented in ASCE
Manual, Eurocode 2 and Kodur et al. (Kodur et al. 2004) and included in Appendix A. The
compressive strength of concrete computed with these relationships is plotted in Figures 2.15 and
2.16. From the plot, it can be noticed that ASCE model results are close to upper bound test data
while Eurocode 2 model follows close to lower bound test results. Kodur et al. showed that using
ASCE constitutive model produces better fire resistance predictions as compared to Eurocode
constitutive model.
The residual strength of concrete is an important property for modeling structural members
exposed to design fire. During cooling phase under design fire, the process of hydration of
unhydrated cement components is an ongoing process. These hydrated products have larger
volume that introduces cracking in concrete, thus, concrete continues to lose strength and
stiffness (Dwaikat 2009). Thus, the residual strength of concrete is less than heated concrete.
Data published in literature shows that there is a large variation in residual strength of concrete,
as shown in Figure 2.17. This large variation can be attributed to using different heating (or
cooling) or loading rate, specimen and test conditions, and the use of admixtures. Codes and
standards, such as Eurocode 2 and ASCE manual, do not specify relationships for the residual
strength of concrete after fire exposure. However, best fit of the published test data is generally
used for evaluating the residual strength of concrete, as shown in Figure 2.17 (Kumar 2003).

37
Figure 2.15: Variation of compressive strength as a function of temperature for NSC
Figure 2.16: Variation of compressive strength as a function of temperature for HSC
0.0
0.4
0.8
1.2
0 200 400 600 800 1000 1200
Com
pres
sive
str
engt
h (N
orm
aliz
ed )
Temperature (°C)
ASCE model
Eurocode (siliceous)
Eurocode (carbonate)
Test-upper bound
Test-lower bound
0
0.2
0.4
0.6
0.8
1
1.2
0 200 400 600 800 1000 1200
Com
pres
sive
Str
engt
h (N
orm
aliz
ed)
Temperature (oC)
Kodur et al. model
EC2 HSC (class 2)
EC2 HSC (class 3)
Test-upper bound
Test-lower bound
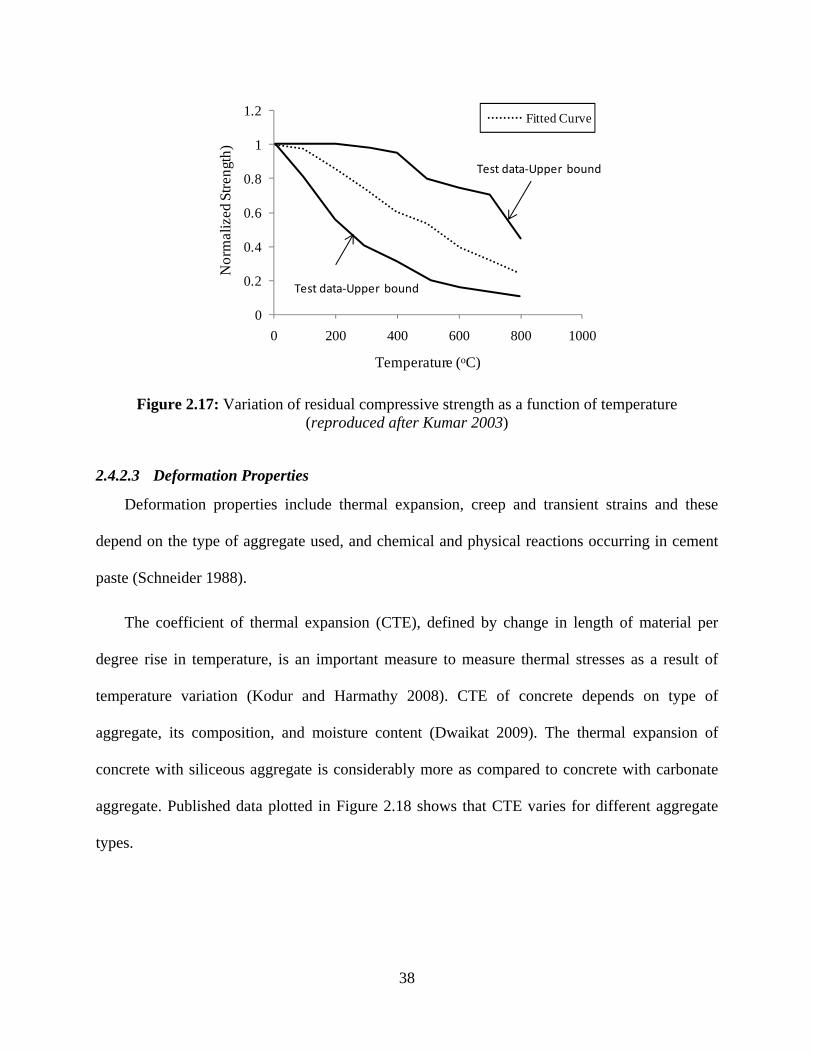
38
Figure 2.17: Variation of residual compressive strength as a function of temperature (reproduced after Kumar 2003)
2.4.2.3 Deformation Properties
Deformation properties include thermal expansion, creep and transient strains and these
depend on the type of aggregate used, and chemical and physical reactions occurring in cement
paste (Schneider 1988).
The coefficient of thermal expansion (CTE), defined by change in length of material per
degree rise in temperature, is an important measure to measure thermal stresses as a result of
temperature variation (Kodur and Harmathy 2008). CTE of concrete depends on type of
aggregate, its composition, and moisture content (Dwaikat 2009). The thermal expansion of
concrete with siliceous aggregate is considerably more as compared to concrete with carbonate
aggregate. Published data plotted in Figure 2.18 shows that CTE varies for different aggregate
types.
0
0.2
0.4
0.6
0.8
1
1.2
0 200 400 600 800 1000
Nor
mal
ized
Str
engt
h)
Temperature (oC)
Fitted Curve
Test data‐Upper bound
Test data‐Upper bound

39
Figure 2.18: Variations of measured and predicted of thermal expansion for concrete as a
function of temperature
Creep strain is time-dependent plastic strain under constant stress level. It is associated with
the moisture movement inside concrete, therefore, is influenced by the temperature. At elevated
temperatures, creep strains are significant since moisture movement occurs more rapidly. Creep
strains depends on many factors including temperature, stress levels, time, loading and mix
design of concrete (Dwaikat 2009). A review of literature shows that creep strains are significant
in low-modulus aggregates. Creep is more pronounced at higher load level and elevated
temperatures.
In concrete, transient strain also develops in addition to creep during the first heating under
load and is independent of time (Khoury 2000). It is caused by thermal incompatibilities
(differential thermal expansion) between aggregate and cement paste (Purkiss 2007). The
mismatch in thermal expansion between aggregate and cement paste leads to development of
internal stresses and micro-cracking and this results in transient strains to occur in concrete
(Schneider 1988). Currently, limited information is available in the literature on high temperature
0
0.4
0.8
1.2
1.6
0 500 1000
The
rmal
exp
ansi
on (
%)
Temperature (°C)
ASCE modelEurocode CarbonateEurocode Siliceous
Test-upper bound(siliceous)
Test- lower bound(siliceous)
Test-upper bound(carbonate)
Test-lower bound(carbonate)
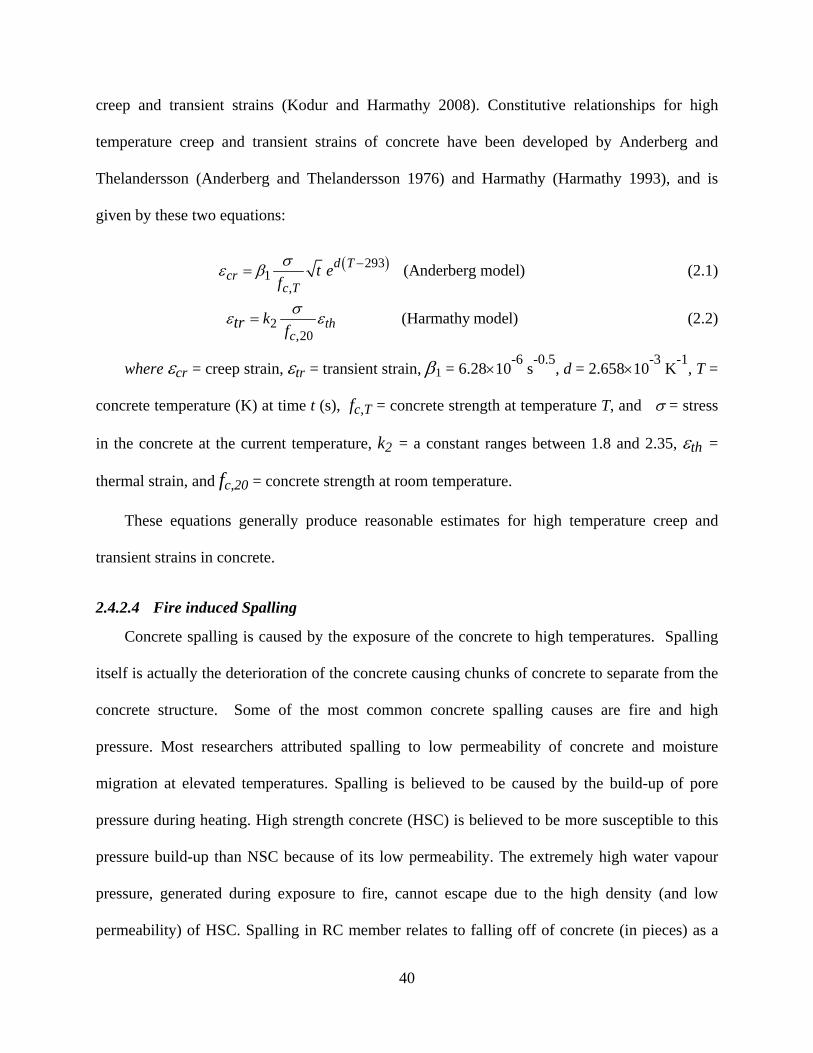
40
creep and transient strains (Kodur and Harmathy 2008). Constitutive relationships for high
temperature creep and transient strains of concrete have been developed by Anderberg and
Thelandersson (Anderberg and Thelandersson 1976) and Harmathy (Harmathy 1993), and is
given by these two equations:
2931
, (Anderberg model)d T
crc T
t ef
(2.1)
2,20
(Harmathy model)thc
ktr f
(2.2)
where cr = creep strain, tr = transient strain, 1 = 6.2810-6
s-0.5
, d = 2.65810-3
K-1
, T =
concrete temperature (K) at time t (s), fc,T = concrete strength at temperature T, and = stress
in the concrete at the current temperature, k2 = a constant ranges between 1.8 and 2.35, th =
thermal strain, and fc,20 = concrete strength at room temperature.
These equations generally produce reasonable estimates for high temperature creep and
transient strains in concrete.
2.4.2.4 Fire induced Spalling
Concrete spalling is caused by the exposure of the concrete to high temperatures. Spalling
itself is actually the deterioration of the concrete causing chunks of concrete to separate from the
concrete structure. Some of the most common concrete spalling causes are fire and high
pressure. Most researchers attributed spalling to low permeability of concrete and moisture
migration at elevated temperatures. Spalling is believed to be caused by the build-up of pore
pressure during heating. High strength concrete (HSC) is believed to be more susceptible to this
pressure build-up than NSC because of its low permeability. The extremely high water vapour
pressure, generated during exposure to fire, cannot escape due to the high density (and low
permeability) of HSC. Spalling in RC member relates to falling off of concrete (in pieces) as a

41
result of effective pore pressure, which is defines as product of porosity and pore pressure,
exceeds tensile strength of concrete (refer to Figure 2.19). This falling off can often be explosive
depending on the fire and concrete characteristics. Another possible cause of spalling is related
to the restrained thermal dilation close to heated surface. These stresses are compressive in
nature and develop parallel to the heated surface as shown in Figure 2.20. These compressive
stresses are released by brittle fracture of concrete or in other words concrete spalling. Studies
have shown that this phenomenon is more pronounced in HSC as compared to NSC. Moreover,
the chances of spalling in RC members with adequate fire protection (insulation) are rear since
insulation plays an effective role in limiting the fast rise of temperature in concrete. The limited
published data on fire tests conducted on FRP-strengthened RC beams have not reported
occurrence of spalling for the entire duration of the tests.
Figure 2.19: Illustration of spalling of concrete due to pore pressure
( )oTemperature C
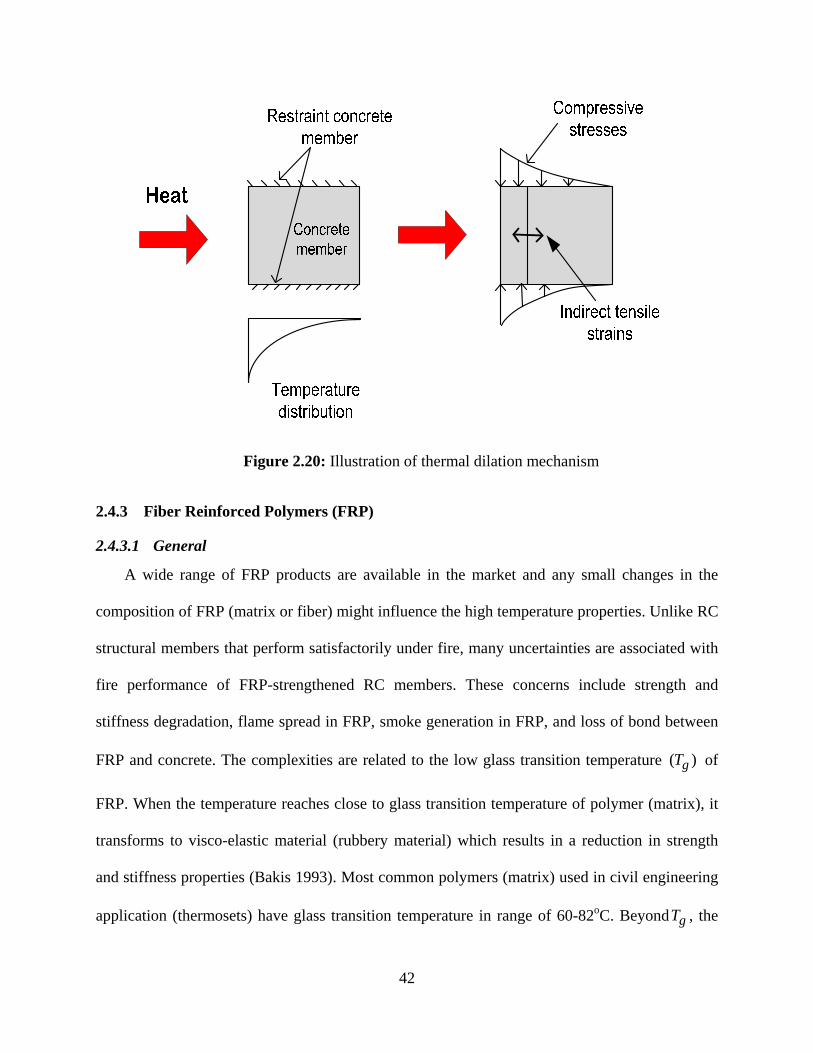
42
Figure 2.20: Illustration of thermal dilation mechanism
2.4.3 Fiber Reinforced Polymers (FRP)
2.4.3.1 General
A wide range of FRP products are available in the market and any small changes in the
composition of FRP (matrix or fiber) might influence the high temperature properties. Unlike RC
structural members that perform satisfactorily under fire, many uncertainties are associated with
fire performance of FRP-strengthened RC members. These concerns include strength and
stiffness degradation, flame spread in FRP, smoke generation in FRP, and loss of bond between
FRP and concrete. The complexities are related to the low glass transition temperature ( )gT of
FRP. When the temperature reaches close to glass transition temperature of polymer (matrix), it
transforms to visco-elastic material (rubbery material) which results in a reduction in strength
and stiffness properties (Bakis 1993). Most common polymers (matrix) used in civil engineering
application (thermosets) have glass transition temperature in range of 60-82oC. Beyond gT , the

43
matrix might ignite, supporting flame spread and toxic smoke generation (Apicella and
Imbrogno 1999b). This may result in debonding of FRP due to significant degradation of
mechanical properties of the matrix.
In the event of fire, overall behavior of FRP composite is dependent on transverse matrix
properties that deteriorate significantly with temperature. Research has indicated that reaching
gT of adhesives is a critical factor governing the fire response of externally bonded FRP-
strengthened RC structural members (Camata et al. 2007). Earlier in section 2.2.1, the properties
of FRP composite (both fibers and the matrix) at ambient temperature were discussed. Following
sections present variations in properties of fibers, matrix and FRP composite at elevated
temperatures.
2.4.3.2 Fibers
Fibers are more thermally stable than polymer matrix. Glass, carbon and aramid are three
types of high performing fibers that are commonly considered for different applications.
Amongst these, aramid fibers are non-flammable and form char when exposed to flame. These
fibers oxidize around 150oC, thereby limiting their use at higher temperature exposures (Bakis
1993). Glass fibers are relatively more stable with softening point in the range of 650-970oC and
tolerance against melting up to 1225-1370oC (Bourbigot and Flambard 2002). Carbon fibers
offer the highest modulus of all reinforcing fibers. Among the advantages of carbon fibers are
their exceptionally high tensile-strength-to-weight ratios as well as high tensile-modulus-to-
weight ratios. In addition, carbon fibers have high fatigue strengths and a very low coefficient of
linear thermal expansion and, in some cases, even negative thermal expansion. Carbon fibers
have high resistant to higher temperatures with melting temperatures as high as 4000oC and are
also considered flame resistance since they burn at very high temperatures (Bourbigot and

44
Flambard 2002). Carbon fibers are chemically inert and are not susceptible to corrosion or
oxidation at temperatures below 400°C. Therefore, these fibers are material of choice for
applications at extremely high temperatures.
A survey of strength-temperature data for fibers has been conducted by Bisby (2003) and
represented in Figure 2.21. It can be seen that there is significant reduction in tensile strength of
aramid fibers above 100oC while carbon fiber showed negligible reduction in strength at higher
temperatures. The strength of glass fibers decreases gradually with temperature.
Figure 2.21: Variation in tensile strength of fibers with temperature (reproduced after Bisby, 2003)
2.4.3.3 Matrix
The matrix properties degrade with increase in temperature. As the temperature reaches
close to glass transition temperature ( )gT , defined as the point where matrix softens, most of its
elastic as well as the strength properties are lost. This degradation is gradual until the
temperature reaches near gT , and thereafter the stiffness plunges dramatically compared to that at
room temperature. The glass transition temperature of polymers (matrix) used in civil
0
20
40
60
80
100
120
0 100 200 300 400 500 600 700
% o
f R
oom
Str
engt
h
Temperature (oC)
Carbon FiberGlass FiberAramid Fiber

45
engineering applications is quite low, typically ranges between 60-82°C (ACI 2008). When
exposed to higher temperatures (beyond )gT , the polymers decomposes forming a char layer that
acts as a thermal barrier and has no flexural stiffness or strength. The decomposition temperature
range is a function of cross linking density of the polymer, composition, curing process and type
of fiber reinforcement (Mouritz 2002). The polyester resins have shown to decompose around
300-400oC while epoxy resins between 400-600oC based on thermo-gravimetric analysis (Dodds
et al. 2000). Also, the time to ignition varies for different type of FRP composites. This depends
on the type of reinforcing fibers apart from matrix characteristics. For example, when the matrix
resin is same, ignition time for composite with woven glass fibers is longer than composites with
chopped glass fibers (Mouritz 2002).
2.4.3.4 FRP Composite – Thermal Properties
Thermal conductivity and specific heat in unidirectional composites are discussed here since
these are commonly used in civil engineering applications. In general, polymers (matrix) have
low thermal conductivity(Mallik 1988), which is one of the reasons that polymers are used as
insulating materials for cables. In case of fibers alone, thermal conductivity depends on the type
of fiber used, its orientation and volume fraction. In unidirectional FRP composites, the fibers
control the longitudinal thermal conductivity while the matrix controls thermal conductivity in
the transverse.. Some of the typical values of thermal conductivities for various FRP materials at
ambient temperature are given in Table 2.3. Thermal conductivities of FRP composite are quite
low with the exception of CFRP since carbon fibers are highly conductive.

46
Table 2.3: Thermal conductivities of various unidirectional FRP and building material (after Mallick, 1988)
Material Thermal Conductivity (W/m-oC)
Longitudinal Transverse
Glass/Epoxy 3.46 0.35
Aramid/Epoxy 1.73 0.73
High Modulus
Carbon/Epoxy 48.44-60.55 0.87
Ultra High Modulus
Carbon/Epoxy 121.1-129.8 0.04
Aluminum 138.4-216.3
Steel 15.57-46.71
Epoxy 0.346
Limited research work has been conducted on thermal properties of FRP composite at
elevated temperature. Graffis et al. (1981) conducted tests on graphite epoxy laminate using
Laser Irradiation test up to 3000oC. The test results show a significant drop in thermal
conductivity with temperature, as shown in Figure 2.22.
Specific heat is the measure of heat transfer through FRP composite and is extremely
difficult to determine the variability due to complex nature of chemical reactions taking place in
FRP at high temperatures. Griffis et al. (1981) suggested specific heat for carbon/epoxy FRP as
shown in Figure 2.22. This variation of specific heat is based on test data where temperature
plateau observed between 350-510oC shows consumption of additional heat as a result from
thermal degradation of resin (matrix).

47
Figure 2.22: Variation in thermal properties with temperature for carbon/epoxy FRP (reproduced from Griffis et al., 1981)
2.4.3.5 FRP Composites – Mechanical Properties
Mechanical properties of FRP composite deteriorate with increasing temperature. When the
temperature reaches close to glass transition temperature, a considerable decrease in strength and
stiffness of FRP occurs. As discussed in previous sections, fibers perform well at elevated
temperatures, while polymers (matrix) are highly susceptible at high temperatures. Therefore,
FRP composites experience significant degradation in mechanical properties as the temperature
approaches gT (Blontrock et al. 1999).
Variation in longitudinal, transverse and shear modulus of carbon/thermoplastic and
carbon/bismaleimide thermoset FRP’s has been investigated by Gates (Gates 1991) up to 200oC
(glass transition temperature of resin is quoted as 220oC) . No significant variation in
longitudinal modulus was observed up to 200oC, however, transverse and shear moduli showed
degradation. Also, stress-strain behavior showed a strength loss of 40-50% at 125oC and of about
0
1
2
3
4
5
6
7
0 200 400 600 800 1000
Temperature (oC)
Specific Heat (kJ/kg.K)
Thermal Conductivity(W/m.K)
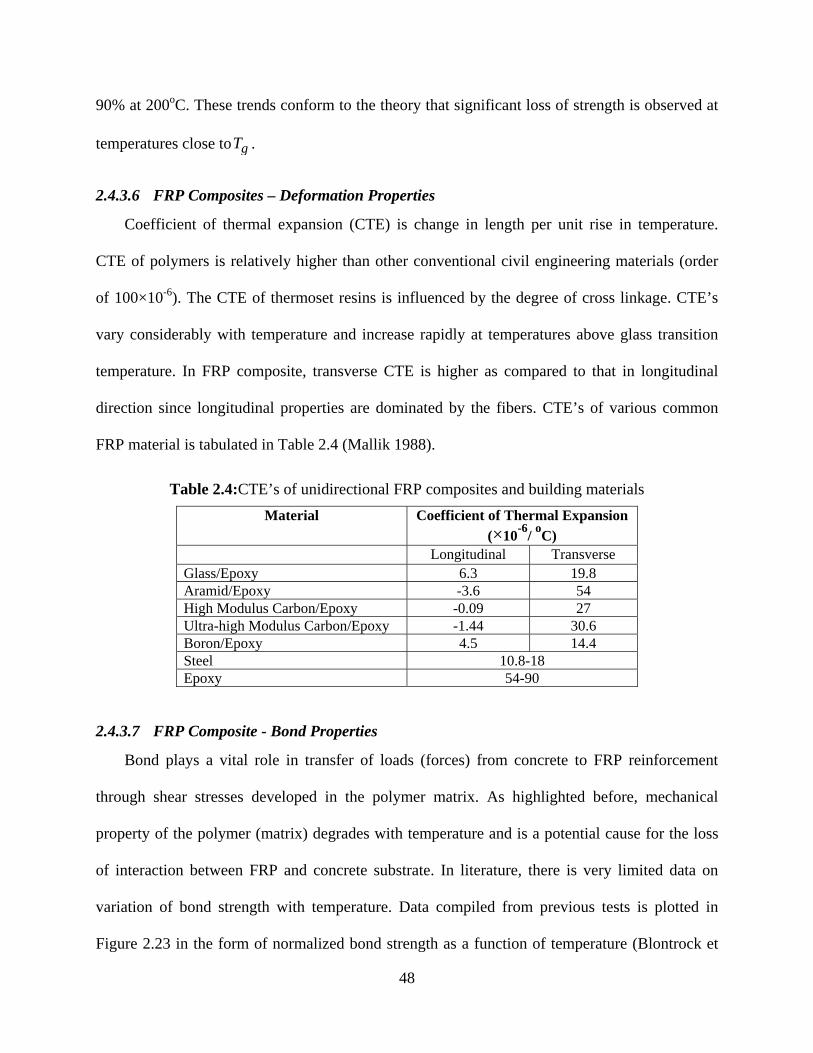
48
90% at 200oC. These trends conform to the theory that significant loss of strength is observed at
temperatures close to gT .
2.4.3.6 FRP Composites – Deformation Properties
Coefficient of thermal expansion (CTE) is change in length per unit rise in temperature.
CTE of polymers is relatively higher than other conventional civil engineering materials (order
of 100×10-6). The CTE of thermoset resins is influenced by the degree of cross linkage. CTE’s
vary considerably with temperature and increase rapidly at temperatures above glass transition
temperature. In FRP composite, transverse CTE is higher as compared to that in longitudinal
direction since longitudinal properties are dominated by the fibers. CTE’s of various common
FRP material is tabulated in Table 2.4 (Mallik 1988).
Table 2.4:CTE’s of unidirectional FRP composites and building materials
Material Coefficient of Thermal Expansion
(×10-6
/ oC)
Longitudinal Transverse Glass/Epoxy 6.3 19.8 Aramid/Epoxy -3.6 54 High Modulus Carbon/Epoxy -0.09 27 Ultra-high Modulus Carbon/Epoxy -1.44 30.6 Boron/Epoxy 4.5 14.4 Steel 10.8-18 Epoxy 54-90
2.4.3.7 FRP Composite - Bond Properties
Bond plays a vital role in transfer of loads (forces) from concrete to FRP reinforcement
through shear stresses developed in the polymer matrix. As highlighted before, mechanical
property of the polymer (matrix) degrades with temperature and is a potential cause for the loss
of interaction between FRP and concrete substrate. In literature, there is very limited data on
variation of bond strength with temperature. Data compiled from previous tests is plotted in
Figure 2.23 in the form of normalized bond strength as a function of temperature (Blontrock et
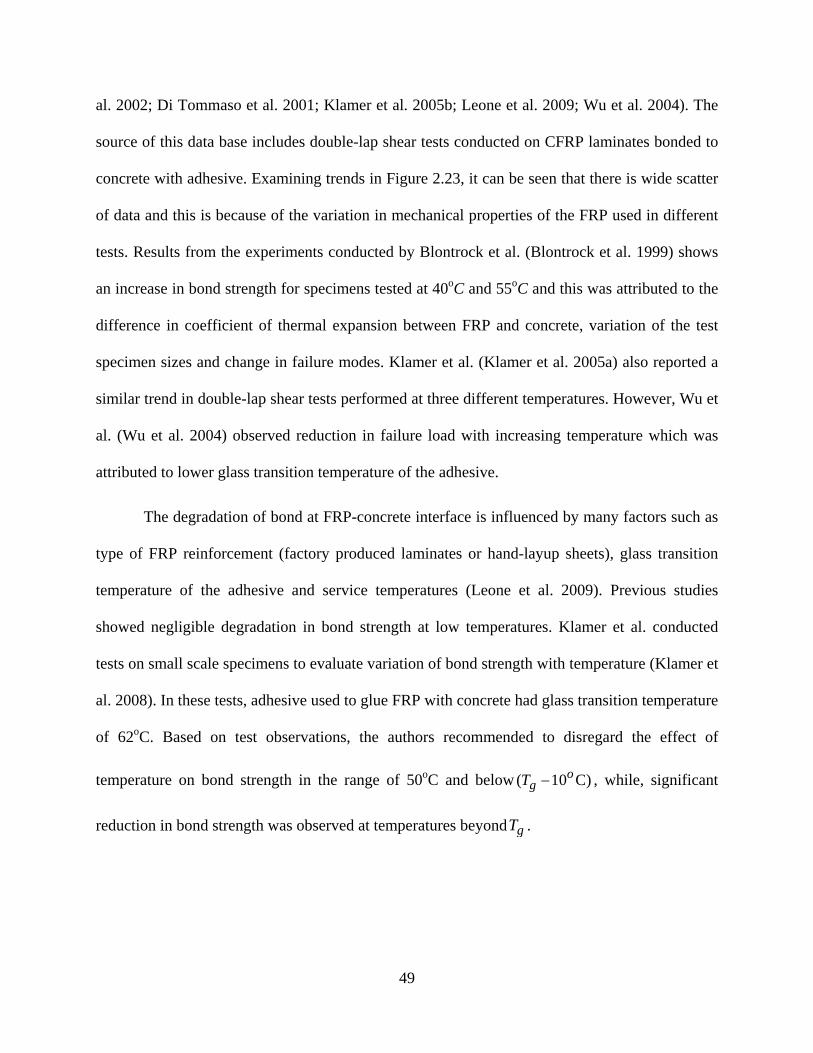
49
al. 2002; Di Tommaso et al. 2001; Klamer et al. 2005b; Leone et al. 2009; Wu et al. 2004). The
source of this data base includes double-lap shear tests conducted on CFRP laminates bonded to
concrete with adhesive. Examining trends in Figure 2.23, it can be seen that there is wide scatter
of data and this is because of the variation in mechanical properties of the FRP used in different
tests. Results from the experiments conducted by Blontrock et al. (Blontrock et al. 1999) shows
an increase in bond strength for specimens tested at 40oC and 55oC and this was attributed to the
difference in coefficient of thermal expansion between FRP and concrete, variation of the test
specimen sizes and change in failure modes. Klamer et al. (Klamer et al. 2005a) also reported a
similar trend in double-lap shear tests performed at three different temperatures. However, Wu et
al. (Wu et al. 2004) observed reduction in failure load with increasing temperature which was
attributed to lower glass transition temperature of the adhesive.
The degradation of bond at FRP-concrete interface is influenced by many factors such as
type of FRP reinforcement (factory produced laminates or hand-layup sheets), glass transition
temperature of the adhesive and service temperatures (Leone et al. 2009). Previous studies
showed negligible degradation in bond strength at low temperatures. Klamer et al. conducted
tests on small scale specimens to evaluate variation of bond strength with temperature (Klamer et
al. 2008). In these tests, adhesive used to glue FRP with concrete had glass transition temperature
of 62oC. Based on test observations, the authors recommended to disregard the effect of
temperature on bond strength in the range of 50oC and below ( 10 C)ogT , while, significant
reduction in bond strength was observed at temperatures beyond gT .
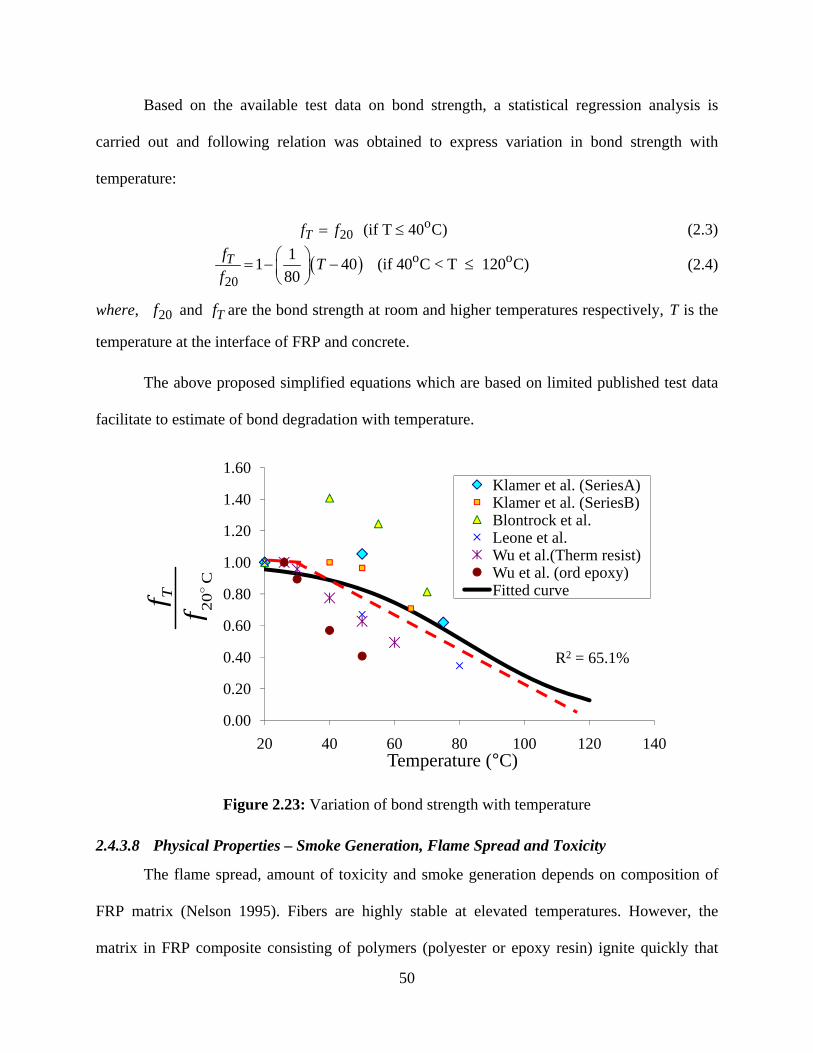
50
Based on the available test data on bond strength, a statistical regression analysis is
carried out and following relation was obtained to express variation in bond strength with
temperature:
o20 (if T 40 C)Tf f (2.3)
o o
20
11 40 (if 40 C < T 120 C)
80Tf T
f
(2.4)
where, 20f and Tf are the bond strength at room and higher temperatures respectively, T is the
temperature at the interface of FRP and concrete.
The above proposed simplified equations which are based on limited published test data
facilitate to estimate of bond degradation with temperature.
Figure 2.23: Variation of bond strength with temperature
2.4.3.8 Physical Properties – Smoke Generation, Flame Spread and Toxicity
The flame spread, amount of toxicity and smoke generation depends on composition of
FRP matrix (Nelson 1995). Fibers are highly stable at elevated temperatures. However, the
matrix in FRP composite consisting of polymers (polyester or epoxy resin) ignite quickly that
0.00
0.20
0.40
0.60
0.80
1.00
1.20
1.40
1.60
20 40 60 80 100 120 140Temperature (°C)
Klamer et al. (SeriesA)Klamer et al. (SeriesB)Blontrock et al.Leone et al.Wu et al.(Therm resist)Wu et al. (ord epoxy)Fitted curve
R2 = 65.1%
20
C
Tf f

51
result in flame spread as well as smoke generation. Mouritz (Mouritz 2002) studied ignition time
characteristics of various FRP composites. He reported less than one minute ignition time for
glass/epoxy and glass/polyester composites as compared to glass/phenolic that took about 7
minutes. Smoke generation and toxicity characteristics of FRP material used for off shore and
marine applications were studied by Sorathia et al (1992). The results shown in Figure 2.24
demonstrate that thermoset resins typically generate unacceptable quantities of smoke and also
have relatively poor flame spread characteristics. The limits quoted by the authors for smoke
density are 100 within first 300 seconds and 200 at any point during the test. When burnt,
thermoset resins generate varying quantities of toxic gases such as carbon monoxide (CO),
carbon dioxide (CO2), hydrogen chloride (HCL), hydrogen sulfide (H2S), and Hydrogen cyanide
(HCN).
For evaluating flame spread and smoke generation, ASTM recommends three different
standard tests. ASTM E84 test specifies procedures for relative burning behavior of a building
material by measuring flame spread index (FSI) and smoke density index (SDI). ASTM E662
specifies optical density test to measure characteristics of smoke concentration, while ASTM
E162 describes test procedure for measuring and comparing surface flammability of different
building materials when exposed to radiant heat energy. ASTM E662 allows a maximum
allowable smoke index of 100 at 300 seconds. For most of FRP systems, the optical density is
less than 100 and ranges from 2 to 96 for glass/epoxy and 1 to 75 for carbon/epoxy composites.
Provision of resin additives is available to reduce flammability of FRP matrix. Flame
retardants like phosphorous and alumina tryhydrate can be introduced as additives in FRP
matrix; however, such chemicals could potentially cause reduction in mechanical properties and
degrade into toxic gases during combustion which may be a concern for life safety. Due to the

52
fact that wide variety of available additives can influence various properties of FRP composites,
therefore, any further discussion is not included here.
Figure 2.24: Results of smoke generation tests on various FRPs (reproduced after Sorathia et al. 1992)
2.4.4 Insulation
Insulation is a material or combination of materials, which retard the rate of heat flow
through low thermal conductivity and high heat capacity properties (Al-Homoud and
Mohammad 2005). Of various civil engineering materials, concrete has excellent inherent fire
resistance properties. On contrary with increasing temperature, most of the FRP composites are
susceptible to combustion that results in flame spread and smoke generation. The glass transition
temperature threshold of polymers (matrix) ranges as low as 65-82oC. Therefore, in the absence
of any fire protection system, FRP’s are highly sensitive to modest increase in temperature. At
temperatures close to gT , FRP loses their mechanical and bond properties and indirectly support
0 100 200 300 400 500 600 700 800
PEEK/CA
PH/CA
PH/AR
PH/GL
BMI/CA
EP/GL
VE/GL
ASTM E662 Smoke Density
FR
P Ty
pe (
Mat
rix/
Fib
er)
Max. Value
At 300 Seconds
VE=Vinyl-esterEP=EpoxyPH=PhenolicPEEK=Poly etherether keytoneGL=GlassCA=CarbonAR=AramidBMI=Bismaleimide
Max.valuelimit
300valuelimit

53
flame spread and smoke generation as a result of ignition/ combustion. In literature, a number of
studies have been conducted that suggest use of supplemental fire protection system to achieve
desired fire resistance in FRP-strengthened structural members. This aspect is more critical in
externally bonded FRP reinforcement.
The insulating material is characterized by two main categories (Papadopoulos 2005):
Inorganic material
o Foam glass
o Fibrous
Glass- wool
Stone-wool
Organic
o Foamy
Expanded polystyrene
Extruded Polystyrene
Polyurethan foam
o Foamy expanded
Cork
Melamine foam
Phenole foam
o Fibrous
Sheep-wool
Cotton-wool
Coconut fibers

54
Cellulose
o Combined material
Siliconated calcium
Gypsum foam
Wood-wool
Insulation boards consisting of calcium silicate, gypsum, and vermiculite are widely used as
fire protection systems. These provide protection through low thermal conductivity as well as
through evaporation of free and chemically bound water within board. The range of thermal
conductivity of calcium and gypsum board is 01.2 to 0.16 W/m-oK (Williams 2004a). Fire
proofing systems such as vermiculite mixed with Portland cement or gypsum binder, available in
powder form are spray-applied after mixing water to the dry material. These spray applied
protection prevent heat transfer through low thermal conductivity (0.043-0.078 W/m-K) and
evaporation of entrapped water (during mixing). Tyfo Vermiculite-gypsum (VG) insulation is
non-combustible and non-flammable proprietary advance fire protection (AFP) system. This
insulation is spray-applied on externally bonded FRP reinforcement to attain up to 4 hours of fire
rating of the structural assembly (UL listed, Design No. N790). Bisby (Bisby 2003) performed
thermogravimetric analysis and proposed relationships for thermal properties, and relationship
are given in Appendix A.
Figure 2.25 show normalized thermal conductivity and thermal capacity for insulation
(vermiculite-gypsum) as a function of temperature. It can be seen that thermal conductivity
decreases up to 200oC, then remains constant till 500oC, after which it increases with
temperature. The peak for thermal capacity at about 100oC and is due to evaporation of trapped
water that consumes most of the heat energy.

55
Figure 2.25: Normalized thermal conductivity and thermal capacity of VG insulation
Intumescent coating is another insulating product that is applied in thin layers (0.1-13 mm).
An intumescent is a substance which swells as a result of heat exposure, thus increasing in
volume, and decreasing in density. Intumescents are typically used for steel structural members.
In FRP-strengthened RC members these intumescent coatings are applied as a final coating on
spray-applied insulation to provide additional stability against crack formation. Apicella and
Imbrogno (Apicella and Imbrogno 1999a) studied performance of intumescent and other
coatings applied to CFRP/epoxy laminates for smoke generation and flame spread in accordance
with ASTM E84 standards. The unprotected CFRP ignited in 44 seconds, experienced charring
and achieved flame spread index of 155 and smoke index of 405. This produced a Class III rating
for CFRP which is the lowest according to building code (UBC). The application of intumescent
coating increased the ignition time to 58 seconds with flame and smoke index reduces to zero
and 20, respectively. Thus, the fire performance was improved to Class I. Sorathia et al.
(Sorathia et al. 1992) studied various fire barrier treatments including ceramic coating,
intumescent coating, ceramic fabric, silicon foam, and phenolic resin to improve structural
0.0
0.2
0.4
0.6
0.8
1.0
1.2
0.0
0.5
1.0
1.5
2.0
2.5
3.0
3.5
4.0
0 200 400 600 800 1000
Nor
mal
ized
The
rmal
Con
duct
ivit
y
Nor
mal
ized
The
rmal
Cap
acit
y
Temperature (oC)
Thermal conductivity
Thermal capacity

56
behavior of FRP composites. The ignition time of glass/vinyl ester composite was improved
from 22 seconds to 450 seconds using 0.762 mm water based intumescent coating. A layer of
phenolic coating increased ignition time of glass/epoxy from 100 to 1000 seconds. Thus,
intumescent coating is an effective measure of fire protection.
The insulation products described in this section cover small percentage of what is available
in the market. New products are in the process of development and needs further study to keep
abreast with fast growing market.
2.5 Previous Studies on FRP-strengthened RC Beams
2.5.1 Experimental Studies
In the last decade, there have been limited studies to investigate the fire behavior of FRP-
strengthened concrete members. However, these fire resistance tests were limited in scope and
did not consider many of the factors governing fire resistance of FRP. In addition, there have
been limited studies to characterize effect of temperature induced bond degradation on fire
performance of FRP-strengthened members. Most of these bond tests were performed on small-
scale specimens (under double-lap shear test configuration) to understand bond degradation
between FRP sheets and concrete. These studies have been reviewed in detail.
Fire Tests
Four experimental programs that focused on studying the behavior of FRP-strengthened
beams under fire have been published in the literature. Deuring (1994) conducted standard fire
tests on six RC beams strengthened with external carbon fiber reinforced polymer (CFRP) strips
and steel plates under ISO 834 standard fire exposure to assess the post-fire residual strength.
Four of these beams were strengthened with CFRP sheet; one was strengthened with adhesive

57
bonded steel plate and the remaining one was an un-strengthened beam. Four of the FRP-
strengthened beams were provided with supplemental fire insulation to enhance fire resistance.
In the fire tests, a loss of interaction (bond) between concrete and FRP was observed within 20
minutes of fire exposure in the unprotected FRP-strengthened RC beam (without insulation). In
protected beams, insulation helped to keep the temperatures low at the interface of FRP and
concrete, thus protecting the bond between concrete and FRP. The authors concluded that FRP-
strengthened RC beams can achieve required fire resistance ratings provided proper external
insulation is applied.
Blontrock et al. (2000) tested two RC beams and six CFRP strengthened RC beams under
ISO-834 fire exposure to study the effect of temperature on bond degradation between FRP and
concrete. The beams were applied with external fire insulation, Promatect-H and Promatect-100,
having a density of 3870 kg m and 3875kg m respectively. Data from tests indicated that some
level of thermal protection is necessary to minimize strength loss in FRP and maintain low
deflections in the beam during fire exposure. The authors concluded that external fire insulation
is needed to limit the temperatures in adhesive below gT (about 80-90oC) in order to maintain
effective bond between FRP and concrete.
Barnes and Fidell (2006) tested 24 CFRP strengthened RC beams under standard fire
conditions (1987) to study the effectiveness of insulation and mechanical bolting of CFRP plate.
RC beams of (100×150 mm) size were strengthened with CFRP plate of 100 mm width and 1
mm thickness, and insulated by applying one 15- 20 mm thick layer of cementitous
(cement/gypsum material based) fire insulation. Beams were exposed to fire for 1 hour without
any applied loading and later subjected to four point bending loads till failure occurred in the
beams. Test results indicated that no transfer of stresses occurred from concrete to CFRP plate

58
once the bond between FRP and concrete was lost at temperatures exceeding gT . It was
concluded that applied fire protection (15-20 mm) was not sufficient to keep the temperatures
low (below gT ) at the FRP/concrete interface beyond 30-45 minutes. These tests also revealed
that the matrix in CFRP plate withstood temperatures up to 310oC, while carbon fibers lasted up
to 950oC.
Williams et al. (2006; Williams et al. 2008) conducted four full-scale fire resistance tests on
FRP-strengthened RC T-beams protected with varying insulation thicknesses (25 and 38 mm).
The beams were tested under service load while exposing to ASTM E119 standard fire (2007). In
all the fire tests, gT of FRP was reached in early stages of fire (about 60 to 90 minutes), but this
did not lead to failure of the beams based on strength or critical temperature (rebar temperature)
limit state. The beams achieved 4 hours fire resistance rating based on ASTM E119 failure
criteria. Williams et al. also developed and validated a thermal model to predict the temperatures
in the beam cross-section.
The above review clearly illustrates that there have been only limited tests conducted to
evaluate fire performance of FRP-strengthened RC beams. Further, most of these tests have been
conducted under standard fire conditions. There have been no tests on fire response of FRP-
strengthened RC beams under realistic fire, loading, and restraint scenarios.
Bond Degradation Tests
Bond between FRP and concrete is critical for transferring forces which takes place through
development of shear stresses in adhesive. The mechanical properties of bonding material
(adhesive) are highly influenced by temperature, and even modest temperature rise leads to loss
of interaction between FRP and concrete. A noticeable number of studies, both experimental and

59
theoretical, have been conducted to understand the behavior of bond between FRP-concrete at
ambient temperature. Some of these studies proposed models based on empirical relationships
while others utlized fracture mechanics principles to predict bond strength variation (Blaschko et
al. 1998; Hiroyuki and Wu 1997; Maeda et al. 1997; Sato et al. 1997; Tanaka 1996; Yuan and
Wu 1999; Yuan et al. 2001). However, only limited studies have been reported in the literature
on the effect of temperature on bond degradation at FRP-concrete interface.
Tadeu and Branco (Tadeu and Branco 2000) studied the influence of temperature on bond
between externally bonded steel plates and concrete by testing concrete specimens of
(150×100×100 mm) with a gluing area of 100 mm long and 80 mm wide. The specimens were
tested in double-lap shear at five selected temperatures (20, 30, 60, 90 and 120oC). Based on the
tests, authors reported a reduction in bond strength with temperature (a 90% reduction at 120oC).
Blontrock et al. (2002) conducted double-lap shear test on CFRP strengthened concrete
prisms 150×150×800 mm separated by a thin metal plate. The CFRP sheets were anchored at
one end to ensure debonding to occur on opposite side where seven strain gauges recorded strain
distribution. The specimens were subjected to direct tensile load at four temperature levels of 20,
40, 55 and 70oC. The tests conducted at 40oC and 50oC showed an increase of failure load by
41% and 24% respectively, however, the failure load decreased by about 19% (compared to
maximum load at 20oC) at 70oC (close to gT ).
Klamer et al. (Klamer et al. 2005b) investigated the influence of temperature on debonding
behavior of externally bonded CFRP through two different test setups namely: double-lap shear
test and small scale three point bending test. For double-lap shear tests (150×250×800 mm), two
CFRP laminates (50×1.2×650 mm) were bonded to two faces of concrete prisms, while for three
point bending test one CFRP laminate (25×1.2×650 mm) was applied at the soffit of specimen.

60
Five strain gauges were used on the specimen to measure strains during tests which were
performed at five temperatures (-10, 20, 50, 60 and 75oC). Results indicated an increase in
failure load by about 10% for specimens tested at 50oC. A further increase in temperature to
75oC resulted in 27% decrease in failure load. This trend of slight increase in failure load before
considerable decrease confirmed previously reported test results by Blontrock et al. (2002).
However, similar trend was not observed in three point bending test. To investigate influence of
temperature on FRP debonding mechanism, Klamer et al. (2008) also tested four full scale FRP-
strengthened RC beams at 20, 50 and 70oC. Test results indicated that type of failure and the
failure load at room temperature and at 50oC were similar, however, at 70oC failure loads
reduced considerably. Therefore, the authors concluded that the contribution of FRP to strength
capacity can be ignored when temperature at the FRP-concrete interface reaches gT .
Leone et al. (2009) conducted double-lap shear tests to study the effect of service
temperature (50, 65 and 80oC) on bond strength. The test specimens (150×150×800 mm)
consisted of two concrete prisms each of 400 mm in length separated by thin metal plate.
Unidirectional CFRP and GFRP hand layup sheets and CFRP laminates (±45) were used to
strengthen the specimens. For the test setup, the slip between FRP and concrete was computed
from strain measurements on two sides of the prism through strain gauges. The experimental
investigation showed a decrease in maximum bond stress for temperatures above gT of the
adhesive. At 80oC, the bond strength in CFRP, GFRP sheet and CFRP laminate was dropped by
54, 72 and 25% respectively. Data from these tests also indicated that magnitude of strain and
required bond length increases with increasing temperatures.
Wu et al. (2004) studied the effect of temperature on bond behavior between FRP sheet and
concrete. The specimens (100×100×450 mm) were tested at temperatures ranging from 26 to

61
60oC using ordinary and thermo-resisting epoxies. Based on tests results, the study concluded
that close to gT , debonding fracture energy ( )fG decreases, while requirement of length ( )eL
increases to achieve effective bond. It was also observed that the failure load and elastic modulus
decreases with temperature.
Gamage et al. (2006) investigated bond characteristics of CFRP plated concrete blocks
(130×130×300 mm) at elevated temperatures. The authors conducted two series of shear tests;
first series of eleven specimens without any insulation and second series of two specimens with
50 mm thick insulation. The test data showed that the bond strength is independent of bonded
length of FRP when exposed to elevated temperatures. The un-insulated test specimens
experienced loss of bond after 5-6 minutes into the fire exposure. This indicated that fire
protection (insulation) is necessary to maintain effective bond between FRP and concrete at
higher temperatures.
Camata et al. (2007) experimentally studied the bond behavior for temperatures ranging
from 40 to 80oC using four different types of adhesives that had gT higher than 85oC. Pultruded
laminate and unidirectional woven fabrics were two types of CFRP used in the test. Results from
test data and numerical analysis showed no degradation in the bond properties between CFRP
and concrete interface up to gT of adhesive.
Di Tomasso et al. (2001) conducted tests to ascertain the behavior of adhesively bonded
CFRP-concrete joints at low and high temperatures. The prismatic concrete specimens
(100×100×700 mm) were strengthened with 20 mm wide and 590 mm long CFRP. The adhesive
thickness was varied between 1.4 mm and 1.24 mm with corresponding elastic modulus of 300
and 175 GPa, respectively. All specimens were tested to failure at four temperatures (-100, -30,

62
20, 40oC). The results indicated lower failure loads for specimens tested at 40oC due to softening
of the adhesive.
Denton (2001) presented a closed form solution to determine interfacial shear stresses and
normal stresses for a prismatic section due to thermal expansion while assuming elastic behavior.
The author assumed stresses are purely due to thermal effect and no external loads are applied on
the FRP-strengthened beam. The results indicated peak shear stress values near to the end of the
FRP plate reducing non-linearly towards the mid-span of the beam. Numerical results also
showed that for FRP plates, use of tapered end configuration significantly reduces the peak
interfacial shear stress.
The above review clearly illustrates the effect of temperature on bond degradation in FRP-
strengthened concrete specimens. Most of these studies were conducted on small scale test
specimens. Test data on full scale FRP-strengthened members is limited. The state-of-the-art
review also indicates that bond between FRP and concrete is a weakest link at higher
temperatures, since concrete and steel properties do not degrade much up to 400oC. Therefore,
accounting for deteriorating bond-slip at FRP-concrete interface is critical, to obtain reliable
assessment of fire resistance of FRP-strengthened RC beams.
2.5.2 Numerical Studies
Numerical models are attractive tools for evaluating fire response of structural systems,
since fire tests are quite expensive and often do not provide reliable data due to severe and
unpredictable conditions encountered in fire. Finite element based models have been applied to
predict the behavior of FRP-strengthened RC members. Such models are a good source to
conduct parametric studies to study influence of various parameters on over all behavior of
strengthened members.

63
Two notable numerical studies specific to FRP-RC members have been reported in the
literature on thermal and structural response of FRP-strengthened RC beams. Williams (2004b)
developed a 2-D heat transfer model that employs an explicit finite difference formulation and
thermal equilibrium equations to determine temperature at each time step. The model is capable
of predicting temperature distribution in FRP-strengthened rectangular and T-beam cross
sections exposed to standard fire scenarios. The model was validated by comparing predictions
with full-scale fire tests on FRP-strengthened T-beams conducted at the National Research
Council, Canada. The model predictions for temperature distribution across the beam cross
section (concrete and rebars) were reasonably good in comparison to the test data. However, the
model under predicts temperature at the interface of FRP and insulation for entire duration of the
test.
Hawileh et al (2009) used commercial software, ANSYS, to study the heat transfer and
structural response of FRP-strengthened T-beam exposed to standard fire. The model was
validated against data from fire tests conducted on the FRP-strengthened T-beams at National
Research Council, Canada (Williams 2004b). The model predictions agree reasonably well with
the measured temperatures and deflections. However, the model does not take into account
several factors such as different high temperature strain components, fire induced bond-slip at
FRP-concrete interface, and effect of axial restraint force in the analysis.
The above review illustrates that limited analytical studies were conducted to evaluate fire
behavior of FRP-strengthened RC beams. These studies had number of limitations and
drawbacks. Specifically, previous numerical studies did not account for important factors such as
different fire scenario, different failure criterion, fire induced bond degradation at FRP-concrete
interface and effect of axial restraint force.

64
2.6 Codes and Standards
The codes and standards have been developed since 1980’s for FRP materials used in civil
structures to control risk in matters of public safety. Without codes and standards, it is unlikely
that FRP materials can be used beyond limited research and demonstration projects. These help
to minimize the uncertainties in the performance and specifications of FRP materials. For fire
design, codes and standards use a prescriptive approach; however, recently there is a shift
towards performance-based design. The prescriptive codes are based on the tests conducted on
structural assemblies under standard fire conditions with a well defined pass/fail criterion (Purser
2000). Current codes provide little or no opportunity to the designer to adopt a rational approach
for provision of fire safety (Buchanan 2002). In performance-based codes, instead of limiting
size, height and design, the required level of fire safety is achieved through a creative design.
Various design codes and guidelines currently exist for design of FRP reinforced concrete
structures at ambient temperatures (ACI 2006; ACI 2008; CSA 2002; FIB 2001; ISIS 2001).
The Canadian standard, CSA S806 (2002), is the first design code that addresses externally
bonded FRP reinforcement for concrete. It specifies all possible failure modes (including in FRP)
in addition to crushing of concrete. ISIS Design Manual 4 (2001) provides guidelines (including
number of design examples) for externally bonded FRP. These guidelines mostly refer to the
recommendations of ACI 440.2R-08. In Europe, Bulletin 14 (2001) provides state-of-the-art
review and design guidelines for use of FRP in structures. The bulletin specifies the effects when
composite action between FRP and concrete (debonding) is lost through a simplified bi-linear
bond model. In United Kingdom, the Institute of Structural Engineers has guide on the design of
RC structures with FRP reinforcement (ISE 1999). Prestressing and externally bonded

65
reinforcements are not addressed in this guide. The approaches adopted in this guide closely
follow guidelines from Canada, Japan and United States (Bakis et al. 2002).
The above standards do not specify any fire guidelines and assume FRP to be ineffective
(lost) in the event of fire. The design documents tend to limit the use of FRP systems for
strengthening of concrete members since the information on the fire performance of FRP-
reinforced or strengthened concrete is scarce. ACI 440.2R-08 requires that FRP-strengthened
members should meet all building and fire code guidelines spelled out for RC structures. Further,
ACI 440.2R-08 requires that the FRP-strengthened RC member must be capable of withstanding
service loads (1.2 times the dead load and 0.85 times the live load) to prevent collapse that might
arise from failure of FRP under fire exposure. In other words, the un-strengthened concrete
member should be capable of resisting service dead and live loads under fire conditions.
An overview of current design guidelines in codes of practice indicate that no specific fire
design provisions exist for externally bonded FRP structures due to lack of information on fire
response of FRP-strengthened members. For structural members that require FRP strengthening,
all documents adopt a common approach for fire safety by specifying adequate strength
requirements to be met in order to resist loads under fire exposure. The reason for this approach
is that in the event of fire, FRP is assumed to be completely ineffective. Therefore, there is a
need to develop rational fire design guidelines for use of FRP strengthened RC members in
buildings and structures.
2.7 Summary
Based on the information presented in this chapter, it is evident that limited data is available
on performance of FRP under fire conditions. FRP loses its strength, stiffness and bond
properties with temperature and this degrades the fire resistance of FRP-strengthened RC

66
members. Limited fire tests conducted did not address critical issues such as realistic loading,
fire scenarios, effect of fire induced bond degradation and axial restraint force. Currently
available numerical models, do not take into account the effect of fire induced bond degradation
and axial restraint force on performance of FRP-RC structural members. There are no specific
guidelines in codes and standards for fire design of FRP-strengthened RC beams. Therefore, for
widespread application of FRP in civil engineering, there is an urgent need for analytical and
experimental studies aimed at developing fire design guidelines.
67
CHAPTER 3
EXPERIMENTAL STUDIES
3.1 General
The state-of-the-art review indicates that there are very few fire experiments conducted
on FRP-strengthened RC beams. Most of these experiments were carried out under standard fire
conditions without any consideration for critical factors such as realistic fire exposure, load level,
debonding of FRP, fire induced axial restraint force, and effect of anchorages, that influence the
fire resistance of FRP-strengthened RC beams. To generate fire test data, FRP-strengthened RC
beams were tested under realistic fire, loading and axial restraint conditions. One tested beam
was a control RC beam while four other RC beams were strengthened with CFRP. The main
purpose of these tests was to study thermal and structural response of FRP-strengthened RC
beams under different parameters and to generate test data for validation of numerical models.
Full details of the fire experiments, including specimen preparation, instrumentation, test
procedures and measured response parameters, together with results are presented in this chapter.
3.2 Experimental Program
The test program consisted of design and fabrication of five RC beams and testing them
under different fire scenarios, insulation system, anchorage configuration and support conditions.
Four of the RC beams were strengthened with externally bonded CFRP that was applied at

68
tension face of the beams, while one beam was tested as control specimen (un-strengthened). The
beams were strengthened in flexural without enhancing their shear capacity.
3.2.1 RC Beam Specimens
The specimens for fire resistance tests consisted of five rectangular RC beams (one RC
beam, four CFRP strengthened). The beams were designed to be as close to typical building
geometries as possible, in order to maximize the usefulness of the test results. The beams were of
254 mm width and 406 mm depth and had 3.96 m span length. The RC beams were designed as
per ACI 318 (2008) specifications and were fabricated at the Civil Infrastructure Laboratory
(MSU). The RC beams had three 19 mm dia. rebars as flexural reinforcement and two 13 mm
rebars as compressive reinforcement. The stirrups used as shear reinforcement were of 6 mm dia.
and were spaced at 150 mm over the length of the beam and bent at 135 into the concrete core.
The steel used for the main reinforcing bars and stirrups had specified yield strengths of 420
MPa and 280 MPa, respectively. The elevation and cross sectional details of the beams are
shown in Figure 3.1.
The reinforcement cages were assembled and placed in plywood form which was properly
designed and fabricated to have the same internal dimensions as those of the tested beams, as
shown in Figures 3.2 (a) and (b). The pre-mixed concrete, ordered from a local contractor to
achieve good quality control, was poured from hopper chute (see Figure 3.2(c)). During pouring,
concrete was vibrated and finished using concrete trowel to obtain smooth finishing surfaces, as
shown in Figure 3.2(d). The concrete mix design (Normal Strength Concrete - NSC) was
identical for all the beams with specified 28 days compressive strength of 42 MPa. Mix design
details are as given in Table 3.1.

69
(a): Elevation
Section A Section B Section C
(b): Cross-sectional details and location of thermocouples and strain gauges
(c): Mid-span cross section showing location of thermocouples
Figure 3.1: Elevation and cross-sectional details of FRP-strengthened RC beams
3.962
0.408
0.151
A CB
1.219 0.61 0.61
Displacement transducer
All dimensions in meters
P P

70
Type I Portland cement and carbonate based coarse aggregate was used in concrete. The
measured compressive strength of concrete at 28 days was 52 MPa, while on the day of test (at 2
years or later), it was 55 MPa.
The casted beams were sealed within the forms for the first 7 days, as shown in Figure
3.2(e). Thereafter, the beams were lifted out from the forms and stored in the laboratory, at about
25oC (40% relative humidity), for about 18 months before retrofitted with CFRP (refer to Figure
3.2(f)). The details of specimen and testing parameters are provided in Table 3.2.
Table 3.1: Concrete mix design proportions for beams
Ingredients Quantity
Beams fabricated B01, B1, B2, B3 and B4
Total cement (kg/m3) 389.9
Water (kg/m3) 156.4
Coarse aggregate (kg/m3) 1036.9
Fine aggregate (kg/m3) 830.1
Water reducing agent (kg/m3) 1.9
Slump (mm) 100
Water/cement ratio 0.4
Air content % 1.7
Unit weight (kg/m3) 2415
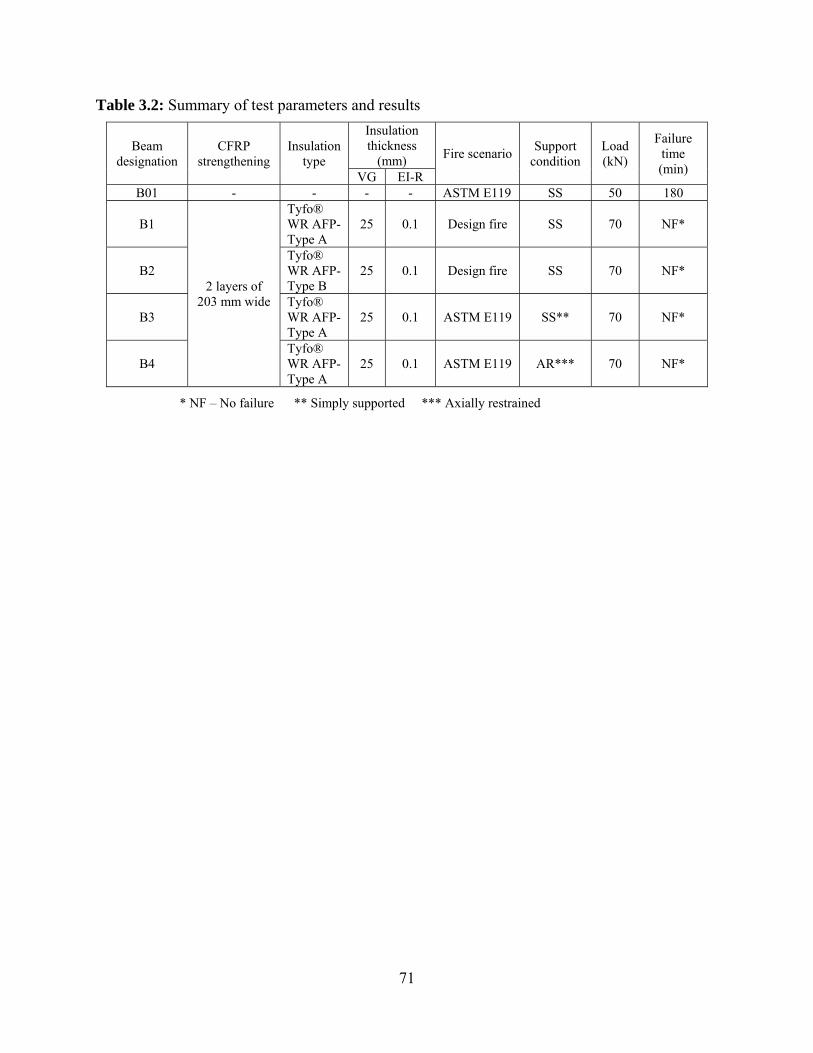
71
Table 3.2: Summary of test parameters and results
Beam designation
CFRP strengthening
Insulation type
Insulation thickness
(mm) Fire scenario Support
condition Load (kN)
Failure time (min)
VG EI-R B01 - - - - ASTM E119 SS 50 180
B1
2 layers of 203 mm wide
Tyfo® WR AFP-Type A
25 0.1 Design fire SS 70 NF*
B2 Tyfo® WR AFP-Type B
25 0.1 Design fire SS 70 NF*
B3 Tyfo® WR AFP-Type A
25 0.1 ASTM E119 SS** 70 NF*
B4 Tyfo® WR AFP-Type A
25 0.1 ASTM E119 AR*** 70 NF*
* NF – No failure ** Simply supported *** Axially restrained
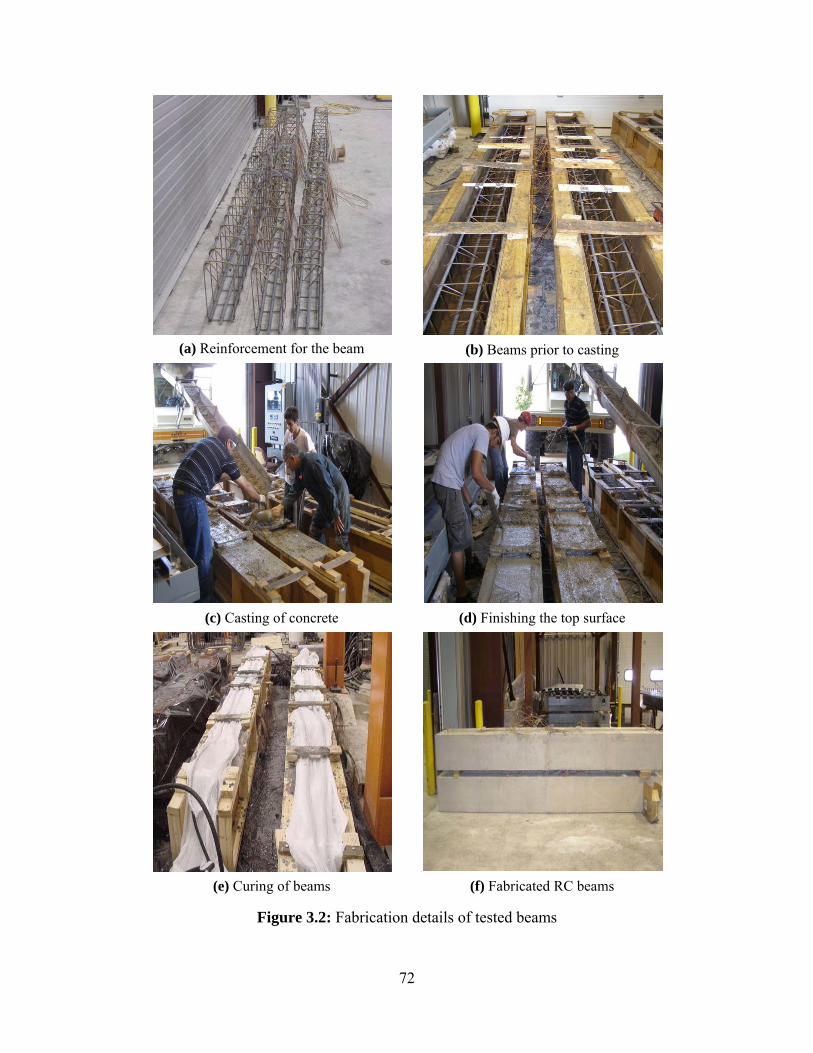
72
(a) Reinforcement for the beam (b) Beams prior to casting
(c) Casting of concrete (d) Finishing the top surface
(e) Curing of beams (f) Fabricated RC beams
Figure 3.2: Fabrication details of tested beams

73
3.2.2 FRP Strengthening
3.2.2.1 Design and Material
The flexural capacity of un-strengthened RC beams, which was 130 kN-m was enhanced by
about 50% by flexural strengthening. The resulting moment capacity of FRP-strengthened RC
beams was increased to 200 kN-m. To achieve this desired capacity of the beam, two layers of
Tyfo®
SCH-41 composite (203 mm wide) were installed at the beam soffit as per specifications
prescribed in ACI 440-2R08 and also by the manufacturer. Tyfo®
SCH-41 comprises of
unidirectional carbon fabric with glass cross fibers to provide additional strength and fabric
stability during installation. The carbon fibers are oriented in longitudinal (zero degree)
direction. The properties of fibers and the laminate are tabulated in Table 3.3 and 3.4.
Table 3.3: Properties of fibers used for strengthening of test beams
Tensile Strength 3.79 GPa Tensile Modulus 230 GPa Ultimate Elongation 1.7% Density 1740 kg/m
3
Table 3.4: Properties of composite laminate
Property ASTM Method
Typical Test Value
Design Value
Ultimate tensile strength in primary fiber direction
D-3039 986 MPa 834 MPa
Elongation at break D-3039 1.0% 0.85% Tensile modulus D-3039 95.8 GPa 82 GPa Nominal laminate thickness D-1777 1.0 mm 1.0 mm
3.2.2.2 Installation
The concrete surface of the casted beams was fairly smooth due to even surfaced form work.
Hence, the concrete surface was roughened by sand blasting to partially expose the aggregate at
beam soffit as shown in Figure 3.3. The roughened concrete surface was cleaned using
compressed air and brush prior to application of FRP.

74
Figure 3.3: Concrete surface preparation by sand blasting
First, a thin coat of Tyfo®
S Epoxy was applied with a roller on the prepared concrete
surface as shown in Figure 3.4(a). The resin used to bond fibers was two-component epoxy
material with a glass transition temperature ( )gT of 82oC. The mix ratio of the two components
is 100 parts of component A to 42 parts of component B, by volume or 100 parts of component
A, to 34.5 of component B by weight. Properties of epoxy are tabulated in Table 3.5.
Table 3.5: Properties of epoxy used in FRP strengthening
Property ASTM Method
Typical Test Value
gT D-4065 82o C
Tensile Strength D-638 Type 1
72.4 MPa
Tensile Modulus D-638 Type 1
3.18 GPa
Elongation Percent D-638 Type 1
5.0%
Flexural Strength D-790 123.4 MPa Flexural Modulus D-790 3.12 GPa
Thereafter, a coat of cabosil was applied (in practice applied for overhead installation) to
provide stronger adhesion to FRP fabric during installation. Then, two CFRP sheets of 2 mm
thick and 203 mm width, saturated in Tyfo®
S Epoxy were roller-applied at the beam soffit as

75
flexural strengthening. After placement, the sheets were rolled to remove air bubbles and also to
ensure accurate placement, as shown in Figure 3.4(b). The same procedure was followed for
applying second CFRP sheet. For beams B1 and B2, CFRP was applied on the entire
unsupported length of the beam (3.66 m) terminating at a distance d from the supports. This
configuration was adopted to study the influence of anchorages on fire response of FRP-
strengthened RC beams. While for beams B3 and B4, central portion of the beam (2.44 m) which
is exposed to fire (in the furnace) was retrofitted with CFRP to evaluate the effect of debonding
on the response of FRP-RC beams. Unlike in previous tests, no shear strengthening was provided
to study failure patterns of the beams under flexural strengthening alone.
3.2.3 Insulation of Beams
3.2.3.1 Insulation type
The fire protection system consisted of a layer of Tyfo® WR AFP system with a top coating
of Tyfo®
EI-R. This Tyfo®
WR AFP system, which is an improved version as compared to
previously developed Tyfo® AFP system, was spray-applied after the beams were cured for 72
hours. The Tyfo®
WR AFP system comprises of vermiculite based insulation (VG insulation)
and EI-R coating. It is available in two forms, Tyfo®
WR AFP-Type A and Tyfo®
WR AFP-
Type B. The insulation is non-combustible and non-flammable lightweight material available in
a powdered form. Beams B1, B3 and B4 were spray-applied with Tyfo®
WR AFP-Type A,
while Tyfo®
WR AFP-Type B was used for beam B2. On top of insulation, spray-on EI-R
coating was applied of equal thickness. This EI-R coating is a crack resistant surface coating

76
with excellent adhesion and fire resistance properties and provides additional stability to
insulation.
3.2.3.2 Installation
This insulation application comprised of spraying a thin coat of VG primer on a cleaned
surface, followed by a dash coat, on the FRP-strengthened beam soffit to enhance FRP/insulation
bond (refer to Figure 3.4(c)). Thereafter, insulation material, which is available in powdered
form, was mixed with appropriate amount of clear water and spray-applied on the beams using a
hopper gun, as shown in Figure 3.4(d). The insulation is spray-applied within 5-6 hours of the
dash coat. This was applied in lifts of approximately 8-10 mm thickness to accelerate the drying
procedure before next lift is sprayed. Special attention was taken to maintain uniform thickness
throughout the beam length. Insulation thickness was measured at several places along the beam
length to ensure thickness within a tolerance ( 6 )mm . The insulation layout comprised of 25
mm at the bottom surface of the beam extending 100 mm on the two sides (refer to Figure 3.1
(c)). The extension of insulation on two sides of the beam was to ensure low temperatures in
flexural reinforcement. Insulation material applied is sufficiently low density material that adds
negligible dead weight to the beam. This sprayed insulation was cured for 24 hours before final
coat of EI-R was spray-applied (refer to Figures 3.4(e) and (f)). The complete insulated beams
are shown in Figure 3.5.

77
(a) Application of epoxy and cabosil (b) Application of CFRP layer
(c) Spray applying the dash coat (d) Spray applying insulation in lifts
(e) Insulated beams (f) Spray applying EIR coating
Figure 3.4: Flexural strengthening and spray-application of insulation on RC beams

78
Figure 3.5: RC beams strengthened with CFRP and insulated
3.2.4 Instrumentation
The beams were instrumented to measure the temperature progression across the beam cross
section, strains in rebars and deflections. To measure the temperatures, Type-K thermocouples
were installed at various depths in concrete, reinforcement, and concrete-FRP and FRP-
insulation interfaces at three different sections of the beam, as shown in Figure 3.1(a). A total of
26 thermocouples were installed for each beam. In addition, normal and high temperature strain
gauges were placed to record strains in compression and tension rebars respectively, as shown in
Figure 3.6. These strain gages were bonded to flat finished surface of the reinforcing steel rebar
and insulated to minimize temperature effects during data recording as well as waterproofing
during casting of concrete. The locations and numbering of thermocouples and strain gauges are
shown in Figure 3.1. In addition, three “Linear Variable Differential Transducers (LVDT’s)”
were installed at unexposed surface (top) along centerline of beam cross section, one at mid-span
and two under point loads to measure deflections.

79
(a) (b)
Figure 3.6: Thermocouples and strain gage placement in the beam
3.2.5 Test Apparatus
The fire resistance tests on FRP-strengthened RC beams were conducted at MSU’s
structural fire testing furnace. The test furnace is specially designed to produce conditions, such
as temperature, structural loads and heat transfer, to which a member might be exposed during a
fire. The furnace, shown in Figure 3.7, consists of a steel framework supported by four steel
columns, with a fire chamber that is 2.44 m wide, 3.05 m long, and 1.68 m high. Six propane
burners located within the furnace provide thermal energy, while six thermocouples, distributed
throughout the test chamber, monitor the furnace temperature during a fire test. The furnace
temperature can be maintained along a desired time-temperature curve as in a standard or design
fire. Two small view ports on either side of the furnace wall facilitate visual monitoring of the
fire-exposed test specimens during fire tests. The furnace accommodates two beams at a time
and different load levels and restrained conditions can be simulated for each beam. One of the
two beams can be tested under axial restraint support conditions, while the other beam has to be
tested under simply supported end conditions. The axial restraint stiffness of the loading frame
and the axial restraint system (axially restraining the beam) is found to be about 13 kN/mm. To
minimize damage to the loading frame, the stiffness of the axial restraint system is set to adjust

80
(automatically) to zero (using relief valve) when the axial restraint force exceeds a value of about
120 kN. Loading is applied using hydraulic system which is driven by pneumatically driven
hydraulic pump.
The hydraulic system has the capability to apply loading independently on each tested beam.
The data from the test that includes temperatures, displacements, axial force and strains is
collected using “Darwin Data DA100/DP120-13” data acquisition system. This data acquisition
system can accommodate 70 thermocouple channels, 10 channels for displacement measuring
devices (LVDT’s) and 10 channels for measurement of strain-gage channels. All these channels
are connected to the data acquisition systems that stores the data in ‘.CSV’ file using “DAQ32”
computer program.
Figure 3.7: Structural fire test furnace and loading setup at MSU Civil and Infrastructure laboratory
3.2.6 Test Conditions and Procedure
During each fire experiment, two FRP-strengthened RC beams were tested simultaneously
under loading and fire conditions. The beams were simply supported at the ends with an
unsupported length of 3.66 m, of which 2.44 m was exposed to fire in the furnace. To investigate
the effect of fire scenario on the fire response of RC beams, the beams were tested under

81
standard and design fire scenarios. Beams B1 and B2 were tested under design fire while beams
B3 and B4 were exposed to ASTM E119 standard fire, as shown in Figure 3.8. The design fire
comprised of a rising temperature (growth) phase followed by a cooling phase. In growth phase,
the time-temperature curve as that of ASTM E119 standard fire was simulated for the first 180
minutes. Thereafter, a decay phase was introduced at a cooling rate of 10oC/minute. Beam B4
was tested under axially restrained support condition. The axial restraint does not translate into
moment fixity at the supports. It has been shown in previous studies that fire endurance of RC
beams with axial restraint is higher as compared to similar unrestrained simply supported beams.
Figure 3.8: Fire time-temperature curves used in fire experiments
3.2.7 Loading
The beams were subjected to two point loads, each of 70 kN, which represents 50% of the
strengthened beam nominal capacity at room temperature. The flexural capacity of the
strengthened beam was determined according to ACI 440.2R-08 that requires stress in tension
steel at service load levels must be less than 80% of yf to avoid inelastic deformations.
Therefore, the moment resistance was computed with this limiting strain to obtain the
0
200
400
600
800
1000
1200
0 60 120 180 240 300
Tem
pera
ture
(o C
)
Time (minutes)
Design Fire
ASTM E119
Decay phase (10oC/minute)

82
superimposed loading. Details of calculations are provided in Appendix B. The point loads were
applied at a distance of 1.4 m from the end supports as shown in Figure 3.1(a). The loading was
applied approximately 30 minutes before the start of the test until steady condition (no increase
in deflection with time) was reached. This was selected as the initial condition for the deflection
of the beam.
During the tests, temperatures at various locations of the beam cross section, strains and
deflections were recorded at 5-second intervals. Also, visual observations were made through
view ports in the furnace to record progression of cracks in the insulation, localized burning of
FRP, and delamination of insulation and FRP.
3.2.8 Material Testing
3.2.8.1 Compressive strength of concrete
The concrete cylinders from the batch mix were tested at 7, 28 days and on the day of fire
testing of the beams using Forney Compression Testing Machine (refer to Figure 3.9). Split
tensile test were also conducted on the cylinders to obtain tensile strength of concrete at 28 days.
Average compressive and tensile strength of concrete as determined from cylinder tests, is
tabulated in Table 3.6. The design mix compressive strength of the mix was 42 MPa.
Table 3.6: Compressive strength of concrete
Concrete batch
Design compressive
strength (MPa)
28-day compressive
strength (MPa)
28-day tensile strength (MPa)
Test day compressive
strength (MPa)
1 42 52.2 ± 0.6 3.7 ± 0.5 54.8 ± 3.0

83
Testing machine (a) 28 days (b) Test day
Figure 3.9: Testing compressive strength of concrete after 28 days and on the day of fire test
3.2.8.2 Steel
Tensile tests on reinforcing bars (diameter of 19 mm) used as flexural reinforcement,
were performed using 810 Material Testing System (MTS) universal testing machine (refer to
Figure 3.10(a)). This MTS machine is provided with hydraulic grips and has the loading capacity
(both in tension and compression) up to 245 kN. Yield strength, ultimate strength and failure
strain obtained from the test were 450 MPa, 705 MPa and 17%, respectively. The stress-strain
curve obtained for the rebars is shown in Figure 3.10(b).
(a) Test setup (b) Stress-strain curve
Figure 3.10: Testing of reinforcing steel and stress-strain curves
0
200
400
600
800
0 0.05 0.1 0.15 0.2
Str
ess
( M
pa)
Strain (mm/mm)
Rebar 1
Rebar 2

84
3.2.8.3 Insulation
In current experiments, a newly developed insulation Tyfo® WR AFP system was used as
fire protection system. Data on high temperature (HT) thermal properties was not available from
the manufacturer. Therefore, HT thermal properties up to 800oC were ascertained and later
incorporated in the numerical model (discussed in Chapter 4). The thermal properties were
measured using commercially available “Hot Disk TPS 2500S” thermal constant analyzer.
Thermal conductivity and specific heat of insulation were measured at thirteen temperature
points namely 20, 100, 200, 300, 400, 450, 500, 550, 600, 650, 700, 750, and 800°C. The
insulation specimens are exposed to high temperature in a furnace connected to Hot Disk
apparatus (see Figure 3.11(a)). The target temperature, sensor resistance and time of
measurement are controlled by programmed test set up. In each test the furnace temperature is
raised to the target exposure temperature and maintained at that level till the entire test specimen
reaches equilibrium conditions (target temperature). At this stage the thermal conductivity and
specific heat are recorded by the data acquisition system. Then the temperature in the furnace is
increased to next target temperature and this procedure is continued till 800°C. The HT thermal
properties (normalized thermal conductivity and thermal capacity) are plotted in Figure 3.11.
(a) Test setup (b) Thermal capacity and thermal conductivity of insulation
Figure 3.11: Test setup and high temperature thermal properties of Tyfo®
WR AFP system
0
1
2
3
4
0.0
0.4
0.8
1.2
0 500
Nor
mal
ized
The
rmal
C
apac
ity
Nor
mal
ized
The
rmal
C
ondu
ctiv
ity
Temperature (oC)
Thermal conductivityThermal capacity

85
3.2.8.4 Glass transition temperature of FRP composite
A test was conducted using Thermomechanical Analysis (TMA) apparatus to reconfirm the
glass transition temperature ( )gT of Tyfo®
SCH-41 (unidirectional carbon/epoxy composite)
specimen used for strengthening of RC beams. The supplier of FRP has reported a gT value of
82oC based on ASTM D-4065 standard test (DMA).
The glass transition temperature of the specimen was obtained in accordance with the
standard test method ASTM E1545-05 (1993)(standard test method for assignment of the glass
transition temperature by thermomechanical analysis). With the TMA technique, a number of
different probe configurations are offered in order to optimize the test conditions for a specific
sample and/or application. These probes include expansion, penetration, compression, flexure,
extension and dilatometry. For this experiment, penetration probe was used to ascertain the
softening temperature of the material commonly referred to as Ts rather than gT . The test
procedure was repeated for different heating rates (2oC/minute and 10oC/minute) to see the effect
on test results. The test results are shown in Figure 3.12.
The increase in deflection at gT is proportional to the applied force on the probe and the
heating rate significantly affected the detection of gT of the sample. The reduced heating rate
increases the measured deflection at gT , decreases the signal to noise ratio and the transition
temperature is shifted downward. This is illustrated in Figure 3.12 where a faster heating rate
(10oC/minute) gives a higher value of gT and the average penetration of the probe drops.

86
Discussion
The results show a decrease of gT by about 25% ( 64 )ogT C compared to the reported
value by the manufacturer ( 82 )ogT C which is based on the test performed using DMA. The
glass transition temperature determined by DMA is not only heat rate dependant but also depend
on the frequency. The manufacturer has not provided any reference for the reported gT that
whether it is based on the damping ratio ( tan ), or the maximum of ' 'E or on the onset of 'E
curve. The gT based on damping ratio is always higher compared to the TMA results. Secondly,
the varying exposure of the material (epoxy) to the atmospheric conditions (air) decreases the
glass transition temperature. This is attributed to the moisture present in the air since water
content is known to affect gT (Ferrillo and Achorn 1997). The reduction in gT of the samples
tested can be attributed to the storage of the sample under uncontrolled environments. These
effects are not reversible; therefore, the original gT cannot be restored as reported by the
manufacturer.
Figure 3.12: Variation of gT as a function of heating rate
-8-6-4-202468
1012
20 30 40 50 60 70 80 90 100
Dim
ensi
on C
hang
e (μ
m)
Temperature (oC)
CFRP (2C/min)
CFRP (10C/min)

87
3.3 Results and Discussion
Data generated from above fire tests was used to study thermal and structural response of
FRP-strengthened RC beams exposed to fire. The test conditions represented a typical
compartment fire in a building. For beams B1 and B2, terminating ends of CFRP near supports
(outside fire zones) acted as anchorages. For the other two beams (B3 and B4), central portion of
the beam soffit exposed inside furnace was only retrofitted to study the effect of debonding on
overall fire performance of FRP-strengthened RC beams. The results from these experiments
have also been compared with test results of RC beam (control beam B01) which was tested
under ASTM E119 standard fire with applied load ratio of 50% (50 kN).
3.3.1 Test Observations
During the fire tests, visual observations of the specimens were recorded from two viewing
ports provided in each opposite side of the furnace wall. These observations were taken for entire
duration of the test and backed up by photographs and video recordings at critical moments.
Table 3.7 and 3.8 outline the timelines, observation and photograph of each tested beam. Major
observation in the test relates to cracking of insulation, burning of epoxy, and delamination of
FRP. The performance of EI-R coating was satisfactory during the test with no signs of burning.
The VG insulation (Type-A and B) performed very well under fire exposure, and remained intact
until test ended except for beam B3, where a part of insulation fell when FRP delaminated. In
both types of insulation, cracks appeared in the insulation and widened as the test progressed. It
was noticed that cracks formation in Type B insulation was in earlier time as compared to Type
A. The crack pattern was parallel to the longitudinal axis of the beam at beam soffit, while cracks
extended vertical in insulation applied on the two sides of beam (refer to Figures 3.13 and 3.14).
These formation of cracks resulted in localized burning of epoxy in the start and later complete
beam soffit got engulfed in fire.

88
Table 3.7: Visual Observations for Beams B1 and B2 during Fire Resistance Test
Time (minutes)
Observation State of the specimen
0 Test started at 2:00 pm
25-30 Cracks appeared in Tyfo®
WR AFP-Type B insulation (beam B2)
32 Localized burning of epoxy in beam B2 spray-
applied with Tyfo®
WR AFP-Type B
40-45 Cracks wide opened in Tyfo®
WR AFP-Type B insulation with flaming.
Cracks started to appear in Tyfo®
WR AFP-Type A insulation (beam B1)
60 Burning of epoxy in Tyfo®
WR AFP-Type A insulation (B1)
90 Complete beam soffit of beam B2 engulfed in flames
200 Burning at beam soffit starting to reduced as result of decay phase in time-temperature curve.

89
Table 3.8: Visual Observations for Beams B3 and B4 during Fire Resistance Test
Time (minutes)
Observation State of the specimen
0 Test started at 3:00pm
25-30 Visible cracks in insulation (Tyfo®
WR AFP-Type A) for beam B4.
38 Localized burning of epoxy in beam B4
Flames appeared from one edge of the beam (B3) possibly due to epoxy burning as a result of wide open edge crack in insulation.
45-48 For beam B4, cracks appeared wide open with visible flame due to burning of epoxy.
60 Insulation from a portion of beam B3 fell off
90-120 Wide open cracks in insulation (both the beams) with complete beam soffit engulfed in flames

90
In all the beams tests, it was observed that fire performance of Tyfo®
WR AFP-Type A
insulation was better than Tyfo®
WR AFP-Type B insulation. This observation is based on the
appearance and progression of cracks for the duration of the test. In Type-B insulation (spray-
applied on beam B2), cracks gradually appeared around 25-30 minutes. Thereafter, widening of
cracks progressed rapidly that resulted in burning of complete beam soffit around 60 minutes, as
shown in Figure 3.13. The cracks did not appear until 40-45 minutes of fire exposure time in
Type-A insulation, therefore, the process involving burning of FRP matrix (epoxy) was delayed
considerably. During fire test on beam B3, a portion of insulation fell when FRP delaminated
from on edge of the beam at about 30-35 minutes, as shown in Figure 3.15. However, at this
stage no cracks could be observed in part of the insulation that remained intact till test
terminated. Thus, debonding of FRP may expose part or complete beam soffit to heat flux.
Figure 3.13: Crack development in insulation of FRP-strengthened beam
Figure 3.14: Formation and widening of cracks in insulation
Time = 30 min Time = 45 min Time = 60 min

91
Figure 3.15: A portion of beam B3 exposed to fire after delamination of FRP and insulation
3.3.2 Thermal Response
3.3.2.1 General
Temperatures were monitored through data acquisition system at various locations in beam
cross section including at interface of FRP/concrete and FRP/insulation for the duration of fire
tests. This section presents and discusses in detail the recorded temperatures at section B and
trends that can influence the overall behavior of FRP-strengthened RC beams. Analysis of the
data showed similar temperature trends for Section A and C.
Figure 3.17 to 3.22 summarizes temperatures measured in beam B1 through B4 at various
locations in the beam cross section. The figures shows average recorded temperatures in
insulation and FRP (Figure 3.18), at various concrete depths (Figure 3.21), and in steel
reinforcement (Figure 3.22). It can be noticed that temperatures at various levels of beams cross
section including in rebar and concrete increases throughout the test duration for beams exposed
to standard fire (beams B3 and B4). However, for beams B1 and B2 which were exposed to
design fire, the measured temperatures increases to a maximum value and then starts to decrease.
This decrease in temperatures can be attributed to the decay (cooling) phase in time-temperature
curve of the design fire.
Delaminated FRP

92
3.3.2.2 Furnace Temperatures
Figure 3.16 compares the measured average furnace temperatures with that of standard
ASTM E119 fire curve (2007). Beams B1 and B2 were tested under design fire exposure. In
design fire, for first 180 minutes the time-temperature fire curve followed standard fire and
thereafter, a decay phase at a rate of 10oC/minute was introduced that depicted an absence of fuel
load in the compartment. Beams B3 and B4 were exposed to standard fire for 180 minutes. It can
be seen that furnace temperatures were well controlled by the burner control system (operated
manually) and this enabled to accurately reproduce furnace temperatures compared to the
standard fire time-temperature curve (refer to Figure 3.16).
Figure 3.16: Time-temperature curve and average furnace temperatures for beam tests
3.3.2.3 EI-R/Insulation Interface Temperatures
EI-R coating was sprayed-applied as a final surface coat (0.12-0.14 mm thickness) on the
insulation. It provides a crack resistant surface and additional stability to insulation when
exposed to fire. The temperature measured at interface of EI-R/insulation is shown in Figure
3.17. It can be seen that the trend of measured temperatures at the interface closely follow the
average furnace temperatures with a maximum difference of 195oC and less. In fact, the
0
200
400
600
800
1000
1200
0 60 120 180 240 300 360
Tem
pera
ture
(o C
)
Time (minutes)
Specified
Measured (B1 & B2)
Measured (B3 & B4)
Decay phase (10oC/minute)

93
measured temperatures at this interface should closely follow the average furnace temperature
since these thermocouples are located almost at the exposed surface of insulation (EI-R coating
is 0.13mm). The possible reasons for lower temperatures recorded in these thermocouples might
be due either accumulation of spray applied insulation around these pre-installed thermocouples
or due to unintentional embedment of the thermocouples by few millimeters inside the
insulation. Never the less, overall measured trends follow the average furnace temperatures.
Figure 3.17: Exterior layer temperatures in FRP-strengthened RC beams
3.3.2.4 FRP/Insulation Interface Temperatures
For the duration of the test, VG-EI-R insulation remained intact and provided effective
insulation to FRP and concrete substrate. Examining Figure 3.18, it can be seen that the
temperature increase recorded in the first 20 minutes is gradual, and this is followed by a
temperature plateau around 100oC. This temperature plateau is due to evaporation of free and
chemically bonded water in the insulation that consumes significant amount of energy. The
insulation, which is spray-applied in the form of slurry, contains free moisture. Most of the free
0
200
400
600
800
1000
1200
0 60 120 180 240 300
Tem
pera
ture
(o C
)
Time (minutes)
B1
B2
B3
B4
Furnace temp.

94
water in the insulation close to exposed surface, dries-out at room temperature, however,
remaining free and chemically bonded water consumed significant energy from fire to evaporate.
Data analysis of the four tested beams showed that all thermocouples located at
insulation/FRP interface did not experience temperature plateau for same length of time. Figure
3.19 shows that the time to reach 100oC was almost similar for all the beams. However,
temperature plateau lasted for about 20-30 minutes for beams B1 and B4, while the duration of
the plateau for beams B2 and B3 was short. This aspect is directly related to crack formation in
the insulation. In beam B2, insulated with Type-B insulation, cracks appeared earlier and
widening of cracks progressed rapidly that lead to quick evaporation of water with short plateau
length. It also depends on the crack size and pattern, and thermocouple location that can result in
such variation. The lower thermal conductivity of insulation and higher energy required for
evaporation of free as well as chemically bonded water are main contributing factors in
maintaining low temperatures in FRP. After crossing temperature plateau, rapid increase in
measured temperatures is due to localized burning of matrix (epoxy).
3.3.2.5 FRP/Concrete Interface Temperatures
The temperatures attained at FRP/concrete interface, is an important indicator to assess the
fire performance of FRP in situ. Figure 3.18 shows that temperature increase at FRP/concrete
interface is similar for all the beams except for beam B3, where FRP debonded from one edge
which caused rapid increase in temperatures due to direct exposure of thermocouple to heat flux.
As discussed in Section 3.3.2.3, localized burning of epoxy (matrix) resulted in rapid increase in
temperature at FRP/insulation interface. A small drop in temperature was expected across a thin
layer (2 mm thickness) of CFRP laminate. However, measured test data shows a temperature lag
(refer to Figure 3.18). This temperature lag can be attributed to the formation protective char

95
layer as a result of pyrolysis process in FRP (refer Figure 3.20). This char layer acts as a thermal
barrier and insulates the interior interface between FRP and concrete. Thus, the measured
temperatures are lower than recorded at FRP/insulation interface.
Figure 3.18: Measured temperatures at FRP/insulation and FRP/concrete interface
Figure 3.19: Formation of temperature plateau at 100oC
0
100
200
300
400
500
600
700
800
0 60 120 180 240 300 360
Tem
pera
ture
(o C
)
Time (minutes)
B1
B2
B3
B4
FRP/insulation inerface
FRP/concrete interface
0
20
40
60
80
100
120
140
160
180
200
0 10 20 30 40 50 60
Tem
pera
ture
(o C
)
Time (minutes)
B1
B2
B3
B4
FRP/VG Interface
Tg

96
Figure 3.20: Physical and chemical process during combustion of polymer
3.3.2.6 Concrete Temperatures
Figure 3.21 shows temperatures within concrete at depths of 203 mm (TC9 at mid-depth of
the beam cross section), 300 mm (TC10), and 406 mm (TC13) for FRP-RC beams B2 and B4,
and RC beam B01 (control RC beam with no fire proofing). Beam B2 was insulated with Tyfo®
AFP-Type B insulation while beam B2 was spray-applied with Tyfo® AFP-Type A insulation.
As expected, Figure 3.21 (a) shows that the temperatures in concrete close to beam soffit remain
very low for beams B2 and B4 due to effective protection provided by the insulation as
compared to control beam. The measured temperature close to beam soffit (thermocouple TC13)
for control beam shows that the temperature increases very rapidly and closely follows average
furnace temperatures for entire duration of the test. This is mainly due to absence of any fire
protection system.
A close examination of Figure 3.21(a) shows that for the same depth inside concrete (TC10
embedded 106 mm from beam soffit), the difference in measured temperatures is about 120oC
after 180 minutes for FRP-strengthened RC beams (B2 and B4) and control beam. This can be

97
attributed to the beneficial effect of the insulation that helps to limit increase in temperature.
After 120 minutes, thermocouple TC13 in beam B2 embedded inside concrete very close to
bottom surface, experiences slightly higher temperatures as compared to beam B4. This can be
explained based on the visual observations taken during the test where crack formation and
widening in the insulation (Tyfo® AFP-Type B) started early (at about 25 minutes) followed by
the burning of epoxy. Figure 3.21(b) shows there is not much variation in measured temperatures
at mid-depth of concrete (TC9) for the three beams. This can be attributed to low thermal
conductivity and high thermal capacity of concrete that limit heat flow rate inside concrete.
Analysis of the temperature data indicates that average concrete temperatures in insulated
FRP-strengthened RC beams remained below 500oC for the duration of test. Therefore, strength
and stiffness of concrete remained unaffected. Temperatures close to exposed surface (TC13)
increased to a maximum value and then decreased under design fire exposure. This can be
attributed to cooling phase in time-temperature curve. However, this effect is not pronounced for
thermocouple TC10 which is located at a farther distance from exposed surface due to time lag in
cooling of inner concrete.
(a)
0
200
400
600
800
1000
1200
0 60 120 180 240 300
Tem
pera
ture
(o C
)
Time (minutes)
Furnace Avg.
TC 10 (B2)
TC 10 (B4)
TC 10 (B01)
TC 13 (B2)
TC 13 (B4)
TC 13 (B01)

98
(b)
Figure 3.21: Measured concrete temperatures (TC 9, TC 10 and TC 13) for beams B2, B4 and control beam B01
3.3.2.7 Rebar Temperatures
Fire resistance of FRP-strengthened flexural members is mainly influenced by strength and
stiffness properties of FRP and steel reinforcement and these properties degrade with
temperature. The rate of degradation of strength and stiffness properties of FRP is faster than
concrete and reinforcing steel due to low tolerance of the polymer matrix to high temperature.
Therefore, FRP contributions to flexural capacity of the beam decreases and rebar temperature
becomes an important indicator on the capacity of FRP-RC beams, after early stages of fire
exposure. Figure 3.22 shows time-temperature curve for corner rebars (in both compression and
flexural reinforcement). Temperature increase in compression reinforcement is higher than that
of bottom corner rebar due to presence of insulation in the bottom soffit region. The measured
temperatures in compression reinforcement (TC5) for beams (B1, B2 and B4) match closely
through entire duration of the fire test. For bottom corner rebar (TC6), temperatures for beams
B2 and B4 closely match with slight variation after 120 minutes of fire exposure time. The
0
200
400
600
800
1000
1200
0 60 120 180 240 300
Tem
pera
ture
(o C
)
Time (minutes)
Furnace Avg
TC 9 (B2)
TC 9 (B4)
TC 9 (B01)
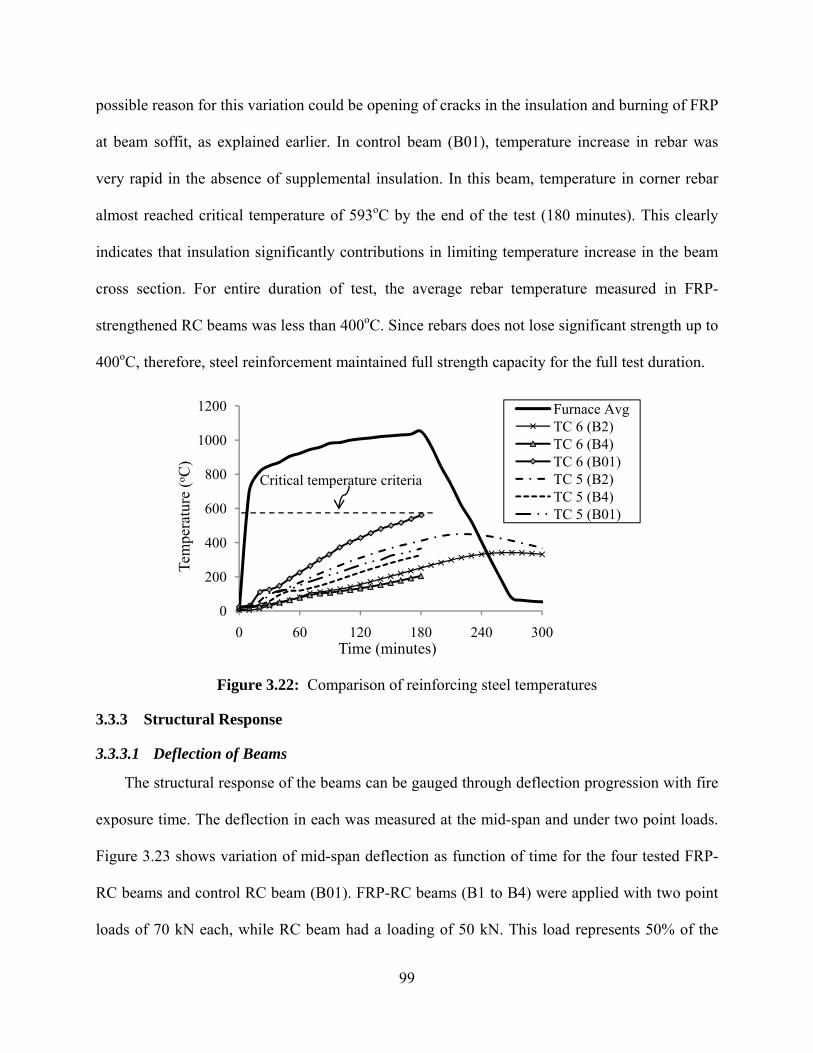
99
possible reason for this variation could be opening of cracks in the insulation and burning of FRP
at beam soffit, as explained earlier. In control beam (B01), temperature increase in rebar was
very rapid in the absence of supplemental insulation. In this beam, temperature in corner rebar
almost reached critical temperature of 593oC by the end of the test (180 minutes). This clearly
indicates that insulation significantly contributions in limiting temperature increase in the beam
cross section. For entire duration of test, the average rebar temperature measured in FRP-
strengthened RC beams was less than 400oC. Since rebars does not lose significant strength up to
400oC, therefore, steel reinforcement maintained full strength capacity for the full test duration.
Figure 3.22: Comparison of reinforcing steel temperatures
3.3.3 Structural Response
3.3.3.1 Deflection of Beams
The structural response of the beams can be gauged through deflection progression with fire
exposure time. The deflection in each was measured at the mid-span and under two point loads.
Figure 3.23 shows variation of mid-span deflection as function of time for the four tested FRP-
RC beams and control RC beam (B01). FRP-RC beams (B1 to B4) were applied with two point
loads of 70 kN each, while RC beam had a loading of 50 kN. This load represents 50% of the
0
200
400
600
800
1000
1200
0 60 120 180 240 300
Tem
pera
ture
(o C
)
Time (minutes)
Furnace AvgTC 6 (B2)TC 6 (B4)TC 6 (B01)TC 5 (B2)TC 5 (B4)TC 5 (B01)
Critical temperature criteria

100
ultimate capacity of each beam calculated as per ACI 318 (RC beam) and ACI 440.2R-08
provisions (FRP-RC beam). In this section, the structural response (deflection) of FRP-
strengthened beams will be discussed first and then deflection response of FRP-RC beams will
be compared with that of control RC beam.
A review of the test data indicates that the deflection in all the beams increased steadily until
around 20 minutes, at which point beams (B1 to B4) experienced a sudden drop in deflection.
This drop is mainly due to the loss of composite action between FRP and concrete substrate
(bond). The bond strength properties are highly dependent on the temperature at FRP/concrete
interface. At room temperature (start of the test), a perfect bond exists between FRP and
concrete. In first 10 minutes of the test, the deflection in the beams is quite small since
temperature at FRP/concrete interface does not change much due to insulation. Thereafter, as the
temperature at the interface starts to rise, the beam experiences gradual increase in deflections.
This gradual increase in deflections (between 10 and 20 minutes) can be attributed to decrease in
shear modulus of adhesive (epoxy) with increasing temperature that introduces bond-slip at
FRP/concrete interface. Due to this bond-slip, adhesive loses its ability to effectively transfer
forces between concrete and FRP and this result in FRP developing only partial tensile stresses
as compared to a perfect bond case where full stresses in FRP can effectively be utilized. With
increasing slip, the bond deteriorates considerably and ultimately leads to debonding of FRP.
After debonding, the structural response of beams B1, B2 and B4 is different as compared to
beam B3.
After FRP debonded, the rate of increase in deflection for beam B3 is rapid as compared
to measured deflections for beams B1, B2 and B4. This increase in deflections can be explained
by first looking into structural response of beam B3 itself and then through a comparison with

101
other three beams. Similar to other three beams, beam B3 was also loaded with a load level of
50% of the strengthened capacity at the start of the test. After FRP debonded, the beam
represented an insulated RC beam (un-strengthened) with a higher load level (almost 80%)
compared to the room temperature capacity of RC beam. This resulted in higher deflections in
the beam at a given time. However, after this stage the comparative analysis of trends in
deflections of un-strengthened and un-insulated RC beam (B01) and insulated un-strengthened
beam (B3) showed interesting results. Inspite of higher load levels, the measured deflections in
beam B3 are lower than beam B01. This is mainly due to beneficial effect of insulation (low
thermal conductivity) that slows the temperature rise in steel reinforcement (gradual strength
degradation) which mainly contributes to the moment capacity of the beam after FRP is lost. For
the control RC beam, the rate of deflection is much higher since mechanical properties of
concrete and steel degrade faster in absence of any external fire protection system.
The structural response of beams B1 and B2 is much stiffer as compared to the beam B3.
This is due to the ‘cable action’ behavior (similar to tensile membrane action is slabs) that
effectively reduce deflection progression in the beams after debonding of FRP occurs. This
"cable action" behavior results from unbonded continuous carbon fibers present at the beam
soffit. These carbon fibers are held by the anchorages on either end of the beam, as shown in
Figure 3.24. It should be noted that no formal design of anchorages was implemented during
strengthening of the beams. These anchorages are referred to the bonded FRP to the beam soffit
that lie outside the fire affected area of the beam (refer to Figure 3.25). These cool ends of FRP
act as anchorages for the continuous unbonded carbon fibers running under beam soffit. The
carbon fibers have high tolerance against thermal decomposition and are less sensitive to
temperatures up to 1000oC (Davies et al. 2004). Therefore, in the absence of any complete

102
delamination of FRP due to cool anchorage zone, the unbonded continuous fibers present at
tension face of the beam continue to contribute towards capacity of the beam through "cable"
mechanism.
Beams B3 and B4 were tested under similar test conditions except that beam B4 was axially
restraint against fire induced thermal expansion (refer to Figure 3.26). The effect of axially
restraint force on structural response of FRP-strengthened RC beams can be gauged by
comparing the deflections of beams B3 and B4. In both the beams, debonding of FRP occurred
around 20 minutes. After this stage, the measured deflections in beam B4 are lower for complete
test duration as compared to beam B3. This can be attributed to the counteracting moment
developed in the beam as a result of arch action introduced by the axial restraining force. The
mechanics of arch action is further explained in Chapter 4.
Figure 3.23: Comparison of mid-span deflections
-90
-80
-70
-60
-50
-40
-30
-20
-10
0
0 60 120 180 240 300
Def
lect
ion
(mm
)
Time (minutes)
B01(RC beam)
B02(RC beam)
B1
B2
B3
B4

103
Figure 3.24: Unbonded continuous carbon fibers at the beam soffit
Figure 3.25: Cool anchorage zone of FRP-strengthened RC beam
Figure 3.26: Axially restrained FRP-strengthened RC beam (B4)

104
3.3.3.2 Axial Restraint Force
The measured axial restraint force in axially restrained beam is plotted in Figure 3.27 as a
function of fire exposure time. It can be seen that the fire induced axial force in the beam
increases with fire exposure time due to restraining of the beam against thermal expansion. Test
results of axially restraint RC beam (tested at MSU) referred as beam B02, have also been
included in discussion for comparison purpose (Dwaikat 2009). This beam (B02) has similar
geometric configuration and dimensions, as FRP-RC beams. The beam was tested under design
fire with rapid growth phase followed by gradual cooling phase. The axial restraining force and
deflections (plotted in Figure 3.23) are higher in RC beam B02 as compared to insulated FRP-
strengthened RC beam B4. This is because RC beam experiences greater thermal expansion and
faster degradation in strength and stiffness properties as a result of higher temperature increase in
concrete and steel rebars in absence of any fire protection system. Figure 3.23 shows a slight
recovery in deflections (beam B02) in later stages of fire exposure due to recovery in strength
and stiffness once the beam enters in cooling phase of design fire (Dwaikat 2009).
Figure 3.27 illustrates that the axial force in RC beam is constant after 100 minutes of fire
exposure time. This is because relief valve of the restraining system was set to release the
pressure to avoid any damage to the test facility or the loading frame, as discussed in Section
3.2.5. In insulated FRP-RC beam, axial restraint force develops gradually since insulation helps
in keeping thermal expansion low because temperature increase in beam cross section is slow.
Figure 3.23 shows that measured deflections in beam B4 are lower in comparison to beam B3
after debonding of FRP. This can be attributed to development of arch action in the beam due to
axial restraining force that counteracts moment due to applied loading. It can be seen from
Figure 3.23 that deflections in beam B4 almost match to beams B1 and B2 in which cable action
of the continuous carbon fibers effectively contributed in resisting applied loading after

105
debonding. Therefore, it can be concluded that in absence of any contribution by FRP, the axial
restraint force helps to counteract applied gravity loads as by anchored continuous carbon fibers.
Figure 3.27: Comparison of axial restraint force as function of fire exposure time for beam B4 and beam B02
3.4 Failure Pattern and Fire Resistance
A comparison of fire resistance of five beams is tabulated in Table 3.2. The time to reach
failure is defines as the fire resistance of the structural member. Current provisions in design
standards specify thermal, strength and deflection limit state as failure criteria for beams (ASTM
2007; BSI 2009). Furthermore, in FRP-strengthened structures the properties of FRP degrade
with temperature. Glass transition temperature ( )gT of FRP is often considered as a measure of
determining the effectiveness of FRP in beams. All these failure criterions are included in this
discussion.
All four FRP-strengthened RC beams met the temperature (critical temperature in rebar
defined as 593oC) and strength failure criteria as specified in codes and standards for entire
duration of the test. However, the measured fire resistance of beam B01 (control RC beam) was
0
20
40
60
80
100
120
140
0 60 120 180
Axi
al f
orce
(kN
)
Time (minutes)
B4B02(RC beam)

106
180 minutes (based on strength limit state) which can be attributed to fast degradation of strength
and stiffness properties in absence of any fire protection.
Currently, there are no code provisions that define failure criteria based on FRP, as indicated
in Chapter 2. In these test, special attention was given to study effect of FRP behavior on overall
structural response of FRP-strengthened RC beams. Analysis of tests data showed that glass
transition temperature of FRP exceeded in about 20-25 minutes which resulted in FRP
debonding. However, no strength failure occurred in FRP-strengthened beams. For beams B1
and B2, unbonded continuous carbon fibers at tension face of the beams were influential in
resisting the applied loading through ‘cable action’ mechanism, while for beam B4, axial
restraining force was the key factor that contributed to enhance fire resistance of the beam. Thus,
glass transition temperature failure criterion is overly conservative for insulated FRP-
strengthened RC beams.
3.5 Summary
Full-scale fire tests were carried out on four FRP-strengthened and insulated RC beams and
one RC beam (control beam). Apart from detailed instrumentation, visual observations were
made to investigate possible factors influencing fire response of FRP-strengthened beams. The
temperature data recorded during tests allowed to evaluate effectiveness of new insulating
system, fire induced bond degradation and axial restraint force effect, effect of fire scenario, as
well as thickness and geometric configuration effect on fire performance of FRP-strengthened
RC beams. Except for the control RC beam (beam B01), all FRP-strengthened RC beams
demonstrated fire endurance for more than 3 hours. For entire duration of tests, the average
temperature in concrete (inner surfaces) and steel rebars remained less than 400oC. This clearly
indicates that both concrete and reinforcing steel retained most of the room temperature strength

107
for the entire test duration. Results from these fire tests provide better understanding of the
response of FRP-strengthened RC beams under realistic fire and loading scenarios and restraint
condition. These tests also provide valuable data for validating computer models developed to
trace the fire response of FRP-strengthened RC beams.

108
CHAPTER 4
NUMERICAL MODEL
4.1 General
Fire response of FRP-strengthened RC beams can be modeled through general purpose finite
element programs such as ANSYS and ABAQUS. In these microscopic finite element models
(FEM), detailed thermal and structural analysis can be carried out, through coupled or uncoupled
ways to trace the response of FRP-strengthened concrete members. Analysis using these models
is complex, and involves significant computational effort. Further, specific high temperature
material models have to be specially provided as input for wide variety of FRP’s and insulation
materials. Furthermore, modeling in three dimensions has limited application since constitutive
relationships are not well established at high temperatures.
In lieu of microscopic based FEM, macroscopic FE models can be used for evaluating fire
response of structural systems. Recently, such macroscopic computer models have been
successfully applied to trace the response of RC members (Dwaikat 2009; Kodur and Dwaikat
2008). The model has been extended for FRP-strengthened RC beams where it is capable to
handle beams of different cross sectional configurations such as rectangle, T or I section FRP-
strengthened RC beams and varying insulation thickness and configuration. This new developed

109
model can account for high temperature material properties of all constitutive materials including
FRP and insulation, effect of fire induced bond degradation and axial restraining force, to
evaluate fire resistance of FRP-strengthened RC beams. In the model, sectional response
generated for various cross sections along the beam length, are utilized to predict over all fire
response of FRP-strengthened RC beam. The details of macroscopic FE model are discussed in
following sections.
4.2 Macroscopic Finite Element Model - Methodology
A numerical model, initially developed for tracing the fire exposure of RC beams (Kodur
and Dwaikat 2008), has been extended to model the response of FRP-strengthened beams. The
earlier model developed for RC beams accounts for fire induced spalling, axial restraint effect,
high temperature material properties, softening of concrete and various failure criteria. However,
the model could not be applied to trace the response of FRP-strengthened RC beams. Current
available guidelines for FRP strengthened concrete members assume that the FRP is completely
lost during a fire. Therefore, development of a numerical model was challenging due to the lack
of available research in this area. A model extension first required a complete understanding of
the complex behavior of FRP composites exposed to elevated temperatures. Further, it required
incorporation of the mechanics and the effect of degradation of mechanical and bond properties
of the FRP, both at ambient and elevated temperatures and possible failure modes. Also, the
model needed to be generalized to handle different beam cross sections such as rectangular, T-
beams, and various geometric insulation configurations.
A numerical model, based on the macroscopic finite element (FE) approach that uses
moment-curvature relationships is developed to trace the response of FRP-strengthened RC
beams in the entire range of behavior up to collapse under fire. In the analysis, the fire exposure

110
time is incremented in steps and the response of the beam is evaluated at each time step. The
beam is idealized by dividing it into a number of segments along its length and the mid-section
of each segment is assumed to represent the overall behavior of the segment. This mid-section is
discretized into a number of elements (see Figure 4.1(c)).
(a) Elevation (b) Idealization along the beam span
Beam cross section Discretization Boundary condition
(c) Discretization and boundary conditions
Figure 4.1: Layout of typical FRP-strengthened RC beam, its idealization and discretization for
analysis
At each time step, thermal analysis is carried out to determine the temperature distribution
within the cross-section of each segment. The computed temperatures are used to generate
moment-curvature (M-) relationships for each segment at various time steps. These M-
relationships are in turn used to trace the structural response of the beam under fire conditions.
The M- relationships, at various time steps, are generated using the changing properties of
FRP laminate/sheet
w
Insulation
L/2
1 2 3

111
constituent materials namely concrete, steel reinforcement, FRP and insulation. Thus, the
material nonlinearity is automatically accounted for in the generation of M- relationships.
The load carrying capacity of the beam at a particular time step is evaluated by taking the
maximum moment in the M- relationships. The deflection of the beam at each time step is
calculated through the stiffness approach by evaluating average stiffness of the beam. The
strength and stiffness of the beam decreases with time and failure is said to occur when one of
the failure limit states is reached. A flowchart showing the numerical procedure for fire
resistance calculations is illustrated in Figure 4.2.
At each time step, numerical calculations are performed in four steps: namely, calculation of
fire temperature to which the beam is exposed, calculation of cross-sectional temperatures in the
beam, generation of M- relationships for each beam segment, and calculation of resulting beam
deflection and strength through nonlinear structural analysis. The detailed procedure is outlined
in the following sections.

112
Figure 4.2: Flowchart illustrating the steps associated with fire resistance analysis of FRP-strengthened RC beam
Start
Calculation of fire temperature
Calculation of cross-sectional temperatures including in FRP for segment i
Initial total strain at top level of concrete
Initial curvature
Calculation of strains an stresses
Initial axial force = applied force
Input data
Thermal properties
Stress-strain relationship
and deformation properties
Increment curvature
No
Yes
Subroutine to compute fire induced bond degradation and axial restraint force
2
3
4
1

113
Figure 4.2: (cont′d) Flowchart illustrating the steps associated with fire resistance analysis of FRP-strengthened RC beam

114
Start Sunroutine
Calculation of bond-slip at FRP/concrete interface
Initial axial force
Calculation of central strain in each element
Checking the compatibility and equilibrium
End
HT properties
of adhesive
No
Yes
Curvatures and deflections from preceding
time step
Figure 4.2: (cont′d) Flowchart illustrating the steps associated with fire resistance analysis of FRP-strengthened RC beam

115
4.3 FE Model for FRP-strengthened RC Beams
4.3.1 Fire Temperatures
In the model, the beam is assumed to be exposed to fire from three sides (sides and bottom
surface) while ambient conditions are assumed to prevail on the top side to represent presence of
slab. The fire temperatures follow that of a standard fire exposure or any other specified design
fire scenario. The time-temperature relationship for the ASTM E119 (2007) and ISO 834
standard fires can be approximated by the following equations:
ASTM E119: 750 1 exp 3.79553 170.4160 60f ot tT T
(4.1)
ISO 834: 20 345log 8 1fT t (4.2)
where: th = time (minutes), To= initial temperature (C), and Tf = fire temperature (C)
Any design fire or standard hydrocarbon fire can be used in the model provided the time-
temperature relationships are known.
4.3.2 Thermal Analysis
The temperatures within the beam cross section, including FRP and insulation layer, is
calculated through finite element analysis.The beam is divided into number of beam segments
(smaller segments towards the mid-span for more accuracy) along its length and the cross section
of each segment is further subdivided into elements (see Figure 4.1(c)). For elemental
discretization, a finer mesh is used for surfaces (insulation and FRP) in close proximity to fire
zone for more accuracy because these are highly sensitive to temperature rise.
In the model, it is assumed that the temperature is uniform along the length of the segment
thus allowing the calculations for a unit length of each segment. Temperature distribution in the
beam cross section is not significantly influenced if steel reinforcement is not included in

116
discretization of beam cross-section for thermal analysis (Lie and Irwin 1993). However, in the
model, the location of the steel reinforcement is accounted for while discretizing the beam cross-
section in to elements for thermal analysis such that more accurate temperature distribution is
obtained. The heat transfer from fire to the boundary elements is through convection and
radiation. However, from insulation to FRP and FRP to concrete, conduction is the dominant
heat transfer mechanism. The governing equation for transient heat conduction within the beam
cross-section is given as (Cook et al. 2007):
2 Tk T Q c
t
(4.3)
where: k = thermal conductivity, c = heat capacity, T = temperature, t = time, and Q =
heat source, 2 = Laplacian operator defined in Cartesian coordinates by 2 2 2
22 2 2x y z
The heat flux on the boundary due to convection and radiation can be given by the following
two equations:
rad rad Eq h T T (4.4)
con con Eq h T T (4.5)
where: q is heat flux and h is heat transfer coefficient. The subscripts rad and conv represent
radiation and convection, respectively.
The radiative heat transfer co-efficient is expressed by:
2 24rad E Eh T T T T (4.6)
where:
TE = temperature of the environment surrounding the boundary,
= Stefan-Boltzman constant = 5.6710-8
(W/m2.K4
), and
= Emissivity factor

117
Therefore, total heat flux on the beam boundaries (qb) can be given by:
con rad Ebq h h T T (4.7)
Using Fourier’s Law, the governing heat transfer equation on the boundary of the beam can be
written as:
y z fT T
k n n h T Ty z
(4.8)
where:
ny and nz = components of the vector normal to the boundary in the plane of the cross-section,
and
h = hcon + hrad
Since the beam is exposed to fire from three sides, two types of boundary equations must be
considered for thermal analysis, namely:
Fire exposed boundaries where the heat flux is governed by:
y z f fT T
k n n h T Ty z
(4.9)
Unexposed boundary where the heat flux equation is given by:
0y z cT T
k n n h T Ty z
(4.10)
where:
hf and hc = heat transfer coefficient of the fire side and the cold side, respectively, and
Tf and To = fire and cold side temperatures, respectively.

118
Galerkin finite element method is used to solve Eq. (4.3). In this approach, the material
property matrices and the equivalent nodal heat flux (stiffness matrix Ke, mass matrix Me, and
nodal heat flux Fe) are generated for each element. These matrices are given by following
equations:
T T
TN N N NK k k dA N N dse x x y yA
(4.11)
T
AM cNN dAe (4.12)
A
F NQdA N T ds
(4.13)
where N = vector of shape functions
Q = heat source
= hc or hf depending on the boundary condition
s = distance along the boundary and,
T = fire or ambient temperature dependant on boundary
Once the element matrices are computed, they are assembled into a global system of
differential equations and is expressed as:
( )MT KT F t (4.14)
where: K = global stiffness matrix, M = global mass matrix, and F = equivalent nodal heat flux
and T = temperature derivative with respect to time (t).
Eq. (4.14) is solved using finite difference algorithm of trapezoidal family (θ algorithm) in
the time domain. This algorithm computes the temperature distribution at any time step using the
information available at previous time step, and can be written as (William and Richard 1990):
1 1( (1 ) )n n n nT T T T (4.15)

119
Multiplying both sides of Eq. (4.15) by M and using Eq. (4.14) at the beginning and the end of
the time interval (tn, tn+1), the following equation can be obtained:
1 11 1n n n nM h K T M h K T h F F (4.16)
where: h = time step, Tn and Tn+1 = temperature at the beginning and the end of time step,
respectively, Fn and Fn+1 = equivalent nodal heat flux at the beginning and the end of time step,
and = a constant between 0 and 1.
For unconditional stability of the numerical calculations, the value of has to be greater
than or equal to 0.5 (William and Richard 1990). By knowing the temperatures at ambient
conditions, Eq. (4.16) can be applied to obtain the temperature-time history at the following time
step, and this can be repeated for subsequent time steps. In each time step, an iterative process is
required to solve Eq. (4.16) due to the nonlinearity of both material properties and boundary
conditions. Details on finite element formation for solving heat and mass transfer equations are
provided in Appendix C.
4.3.3 Strength Analysis
4.3.3.1 General Analysis Procedure
The cross-sectional temperatures generated from thermal analysis are used to develop M-
relationships at various time steps. For the generation of M- relationships, the following
assumptions are made:
Plane sections before bending remain plane after bending
The FRP has linear stress-strain relationship till failure
No relative slip occurs between FRP and concrete substrate
There is no bond-slip between steel reinforcement and concrete
120
Also, for fire induced bond-slip and axial restraint force calculations, following assumptions
are made:
Shear stresses are invariant across adhesive thickness
Stress distribution is independent of flexural cracks in concrete
Curvature at beam soffit and FRP is to be the same
Axial restraint force is constant along the span of the beam (for each time step)
The curvatures and displacements from preceding time step are used for computing axial
force for current time step
The strength calculations, at elevated temperatures, are carried out using the same mesh as
used for thermal analysis. The strength analysis is performed by first estimating fire induced
bond-slip at FRP/concrete interface, and axial restraint force in each beam segment. Following
this M relationship for each segment is generated. Then the generated M relationships
are used to undertake non-linear stiffness (beam) analysis to trace the response of FRP-
strengthened RC beams. At first time step (room temperature), a perfect bond at FRP/concrete
interface, with zero axial restraining force is assumed. For subsequent time steps, curvatures
distribution obtained from preceding time step are utilized compute bond-slip and axial force. It
should be noted that using curvatures from preceding time step has negligible influence on
computations if the time increment are small.
The temperatures, deformations and stresses in each element are represented by the
corresponding values at the center of the element. The temperature in each element is obtained
by averaging the nodal temperatures of rectangular elements. For steel rebars the temperature is
assumed to be that at the center of the rebar.

121
The total strain in a concrete element, at any fire exposure time, is taken as the sum of
thermal strain (expansion), mechanical strain, creep strain, and transient strain:-
tc thc mec crc trc (4.17)
where: t = total strain, th = thermal strain, me = mechanical strain, cr = creep strain, and tr =
transient strain. Subscript c for concrete
In the model, thermal strain is calculated by integrating the coefficient of thermal expansion
(which depends on the temperature of the concrete) over the temperature domain. Creep strain in
concrete is assumed to be a function of time, temperature and stress level, and is computed based
on Harmathy’s (1993) approach using the following expression:
1
,
293cr
c T
d Tt e
f
(4.18)
where: -6 -0.51 = 6.28 10 s (constant) , -3 -1 2.658 10 K (empirical constant)d , T = current
concrete temperature (K), t = time (s), fc,T = concrete strength at temperature T, and = current
stress in the concrete.
The transient strain, which is specific to concrete under fire conditions, is computed based
on the relationship proposed by Anderberg and Thelandersson (1976). The transient strain is
related to thermal strain as follows:
2,20
tr thc
kf
(4.19)
where: k2 = a constant that ranges between 1.8 and 2.35 (a value of 2 will be used in the
analysis); th = change in thermal strain; tr = change in transient strain and fc,20 = concrete
strength at room temperature.

122
At any fire exposure time, the total strain in steel reinforcement is calculated as the sum of
three components given in the following equation:
ts ths mes crs (4.20)
where: ts, ths, mes and crs are total strain, thermal strain, mechanical strain and creep strain
respectively in the steel reinforcement.
Similar to concrete, thermal strain (expansion) in steel can be calculated. The thermal strain
can be computed by knowing the values of coefficient of thermal expansion and temperature of
the reinforcing steel. Eurocode 3 (1995) provides a linear coefficient of thermal expansion for
use in the design equations. According to Eurocode 3, the thermal strain of reinforcing steel can
be approximated as follows:
614 10 ( 20)ths T (4.21)
where: T=Temperature oC
High temperature creep strain in reinforcing steel is computed based on Dorn’s theory and
the model proposed by Harmathy (1967) with some modifications to account for varying yield
strengths of steel. According to Harmathy’s model, creep strain in steel is given as:-
1 32 1 303crs tZ Z (4.22)
where:
4.719
10.816
56.755 10
12
51.23 10
12
y y
f y
y
f fZ
ef

123
H RTe dt , o38900 KH
R
, t = time (hours),
1.75
0.016toyf
, = stress in steel as
function of temperature, and fy = yield strength of steel (room temperature).
For FRP, the total strain at any time step can be calculated using the following equation:
tfrp thfrp mefrp crfrp bi slip (4.23)
where: tfrp = total strain, thfrp = thermal strain, mefrp = mechanical strain, crfrp = creep strain in
FRP, bi = initial strain at the soffit of the beam at the time of retrofitting with FRP, and slip
slip at the interface of FRP and concrete
At the time of FRP strengthening, RC beam is subjected to dead loads. Consequently the
strains in concrete at the level of FRP ( )bi , resulting from dead loads, needs to be considered
(deducted) in computing effective strain in FRP. The value coefficient of thermal expansion
(CTE) for FRP material in transverse direction is higher as compared to the longitudinal
direction. This is because the transverse properties are dominated by the matrix while
longitudinal properties for unidirectional FRP are dominated by the fiber properties. From the
literature, the CTE of high modulus carbon/epoxy at room temperature in longitudinal direction
is 6 o0.09 10 / C while it is 6 o27 10 / C in transverse direction (Mallick 1993). Therefore,
the coefficient of thermal expansion in the fiber direction, is assumed negligible.
At elevated temperatures, creep strains in FRP are considerable depending on the material
used in matrix and the fibers and orientation. The creep effects are minimal both at room and at
elevated temperatures if the fibers orientation is parallel to the longitudinal axis of the beam
since in such case fiber properties will dominate the overall behavior (Rahman et al. 1993).
However, creep strains will be significant if the fiber orientation is off-axis (at 90 degrees). For
124
the analysis, creep strains in FRP have not been accounted since fiber axis coincides with beam
longitudinal axis.
The total strain in a concrete or steel or FRP element, at any fire exposure time can be
related to the curvature of the beam by the following expression:
t c y (4.24)
where: t = total strain, c = strain at the top most fiber in concrete , = curvature, and y =
distance from uppermost fiber in concrete to the center of the element.
At any time step, and for an assumed value of c and (curvature), the total strain in each
element (concrete, FRP or rebar) can be computed using Eq. (4.24). For known temperatures,
other strain components like thermal, transient (for concrete only), bi (for FRP only) and creep
strains in the concrete and rebars are calculated using appropriate equation given above. Then,
the mechanical strain in each element is computed by rearranging Eq. (4.17), (4.20) and (4.23) as
follows:-
(for concrete)mec tc thc crc trc (4.25)
(for steel)mes ts ths crs (4.26)
(for FRP)mefrp tfrp crfrp bi slip (4.27)
For the estimated mechanical strain, the stresses and subsequently the corresponding forces
in each element can be computed using temperature dependent stress strain relationships for
concrete, steel, and FRP (Figure 4.3(a)). These forces are used to check force equilibrium for
each assumed value of strain and curvature. For an assumed total strain at the top layer of
concrete ,( )c T , is iterated until force equilibrium is satisfied. This iterative procedure is
repeated till equilibrium, compatibility and convergence criterion are satisfied. Once these

125
conditions are satisfied, moment and curvature corresponding to that strain are computed.
Through this approach, various points on the moment-curvature curve are generated for each
time step.
4.3.3.2 Evaluating Strain ( )slip due to Bond Slip
In FRP-strengthened RC members, the binding material (adhesive) provides load path for
transfer of stresses from concrete substrate to FRP reinforcement. At temperatures beyond gT ,
bond properties (shear and bond strength) deteriorate considerably and this introduces a slip at
bond interface. Due to this bond-slip, adhesive loses its ability to effectively transfer forces
between concrete and FRP and this result in FRP developing only partial tensile stresses as
compared to a perfect bond case where full stresses in FRP can effectively be utilized. With
increasing slip, the bond deteriorates considerably and ultimately leads to debonding of FRP.
Thus, bond degradation with temperature is to be properly accounted for reliable assessment of
fire resistance in FRP-strengthened RC members.
In FRP-strengthened members, FRP terminates at a distance from the support. Concentration
of shear stresses, which mainly contribute in transfer of forces from concrete to FRP, is
substantial near edges of FRP reinforcement. Previous studies have shown that this high shear
stress concentration is a major cause of FRP debonding. Figure 4.4 schematically shows
development of shear stresses in a beam segment of FRP-strengthened RC beam and related
bond-slip at FRP-concrete interface. Thus, variation of these shear stresses with temperature can
be used to derive an expression for computing bond-slip at FRP-concrete interface. This
expression will account for changing material properties of adhesive (shear stiffness) with
temperature. The beam is idealized into a number of segments along its length. For a small
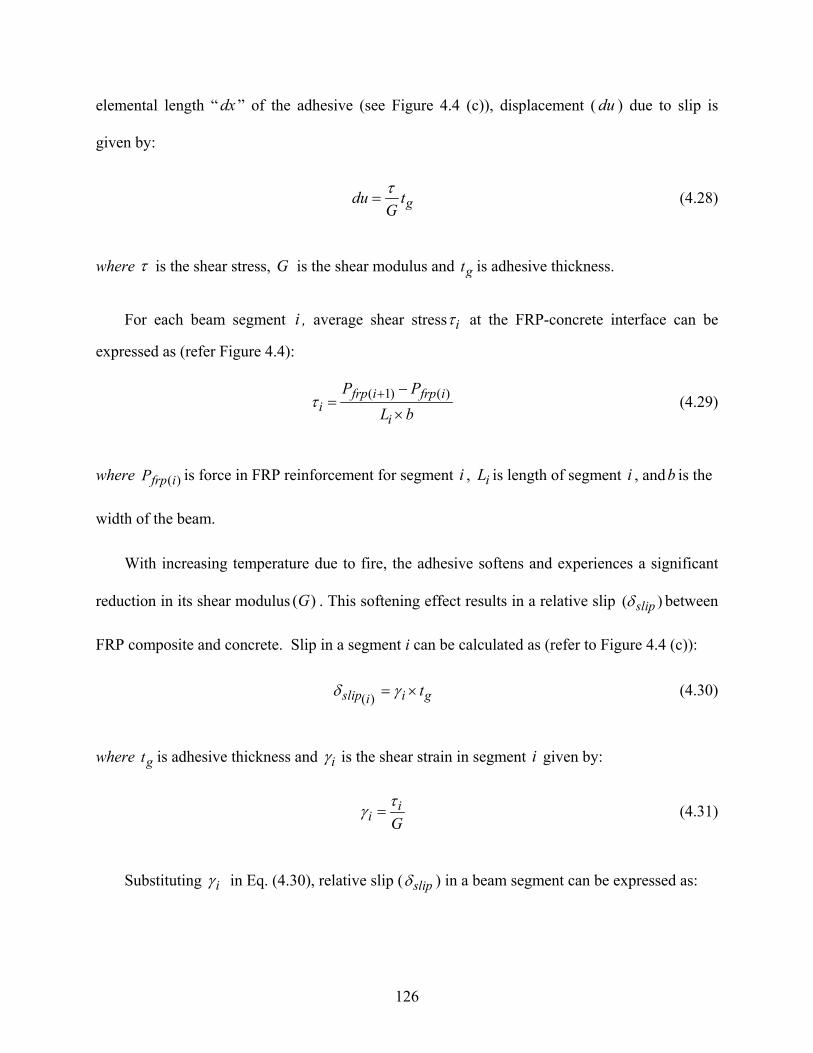
126
elemental length “ dx ” of the adhesive (see Figure 4.4 (c)), displacement ( du ) due to slip is
given by:
gdu tG
(4.28)
where is the shear stress, G is the shear modulus and gt is adhesive thickness.
For each beam segment i , average shear stress i at the FRP-concrete interface can be
expressed as (refer Figure 4.4):
( 1) ( )frp i frp i
ii
P P
L b
(4.29)
where ( )frp iP is force in FRP reinforcement for segment i , iL is length of segment i , andb is the
width of the beam.
With increasing temperature due to fire, the adhesive softens and experiences a significant
reduction in its shear modulus ( )G . This softening effect results in a relative slip ( )slip between
FRP composite and concrete. Slip in a segment i can be calculated as (refer to Figure 4.4 (c)):
( )slip i gi
t (4.30)
where gt is adhesive thickness and i is the shear strain in segment i given by:
ii G
(4.31)
Substituting i in Eq. (4.30), relative slip ( slip ) in a beam segment can be expressed as:

127
( 1) ( )
( )1frp i frp i
slip i gi
P Pt
L b G
(4.32)
Knowing slip , the relative strain due to slip can be established as:
( ) ( 1) ( )( ) 2
change in length 1
original segment length
slip i frp i frp islip gi
i i
P Pt
L GL b
(4.33)
In Eq. (4.33), force in FRP ( )frpP is dependent on temperature and strain ( )frp
distribution in FRP reinforcement, while shear modulus decreases with temperature. The bond-
slip ( )slip in each beam segment can be calculated at any fire exposure time using Eq. (4.33).
The variation of bond-slip is a function of distance from FRP plate ends. As schematically shown
in Figure 4.5, peak bond-slip occurs near FRP plate end and varies exponentially towards center
of the beam. The beam segment with peak bond-slip represents critical segment of the FRP-
strengthened beam since delamination of FRP initiates at this segment. For simplification, bond-
slip evaluated in critical segment can be assumed consistent in all beam segments, for a given
time step.
Under fire conditions, FRP only develops partial tensile strength due to bond-slip.
Therefore, in computing effective mechanical strain in FRP, strain due to bond-slip ( )slip is to
be subtracted from the total strain. This effective mechanical strain, which takes into
consideration bond degradation, can be used to calculate stress and tensile force in FRP. The
effect of temperature induced bond-slip is significant when the temperature at FRP-concrete
interface exceeds gT .

128
(a) Variation of strains, stresses and internal forces in a beam cross section exposed to fire
(b) M of typical beam segment (c) Segments in idealized beam and bending moment diagram
Figure 4.3: Discretization of beam for analysis and M relationship for idealized segment

129
( )P
frp i( 1)
Pfrp i
(a): Elevation (b): Idealization along the beam span
(c) Elemental length of adhesive (d) Slip and shear stresses in beam segment i
Figure 4.4: Development of shear stresses and bond-slip in a beam segment
(a) Elevation of FRP-strengthened RC beam (b) Dicretization
(c ) Typical interfacial shear stress distribution
Figure 4.5: Schematic interfacial shear stress distribution
du
dx
tg
slip
iL
FRP laminate/sheet
w
adhesive
A
A
Str
ess
(MP
a)

130
4.3.3.3 Fire Induced Axial Restraint Force
In addition to bond slip, the effect of fire induced axial restraint force can significantly
influence fire resistance of FRP-strengthened RC beam. This is because FRP-strengthened RC
beam can experience considerable expansion when exposed to high temperature. If the beam is
restrained from expanding, a significant axial restraint force develops at the supports. This
restraint axial force, which can be computed in a similar manner to that for a RC beam (Dwaikat
and Kodur 2008), can have a positive effect on fire resistance. The total axial restraint force ( )P
induced in the beam can be calculated from summation of compressive and tensile forces in each
element of the beam cross section. Thus, the total axial force ( )P in the beam is:
e eP C T A (4.34)
where e is stress and eA is area of each element in beam cross section.
In the calculations, it is assumed that axial restraint force in all the beam segments remains
constant (is equal) at a given time step. Also, as a starting point, it is assumed that the curvature
( ) in beam segment i , at nth time step is equal to the curvature computed in the previous time
step ( 1n ). It should be noted that for a small increment in time step, this difference in curvature
will be negligibly small. With these assumptions, Eq. (4.34) can be expressed in terms of central
total strain ( )o and curvature ( ) for each beam segment i as:
1( ) ( )n noi i oi iP (4.35)
After establishing total axial restraint force P, compatibility along the beam length (L)
needs to be satisfied which is given by Dwaikat and Kodur (2008):
0il L (4.36)
2 1 1 22 11 ( ) 0n n
oi i i iL w w L (4.37)

131
where oi = total central strain for segment i , li = length of beam segment i , 1 2andw wi i are
deflection of the two nodes of beam segment i computed for ( 1n ) and nth time step, as shown in Figure 4.6.
An iterative procedure is applied to evaluate axial restraint force ( P ) in FRP-strengthened
RC beam and this involve following steps:
Assume a value of ' 'P (axial restraint force) for known value of curvature ( 1ni ) from
previous time step ( 1)n . For first time step (at room temperature), 0P .
Compute central total strain ( oi ) for each beam segment i .
Calculate ' ' for a known value of spring stiffness (k).
Check compatibility using Eq. (4.37)
Iterate ' 'P until Eq. (4.37) is satisfied within a pre-determined tolerance value.
At the support, boundary conditions are represented by a spring with stiffness ( ) . The
stiffness ( ) can be assigned any value depending on the degree of restraint experienced in
practical applications. Once the axial restraint force is computed through iterative procedure
explained above, M relationships are generated through similar approach described for
previous numerical model (Kodur et al. 2009). Therefore, accounting for axial restraint force
allows a more realistic analysis of the strengthened beams while taking into account primary
(due to loading) as well as secondary moments due to P effect.

132
Figure 4.6: Illustration of axial restraint force calculations
4.3.4 Generation of Moment-curvature ( )M Relationships
The M- generation, at elevated temperatures, is carried out using the same rectangular
network described above and shown in Figure 4.1 (c). Once the bond-slip and axial restraint
force in the beam is computed, the M- relationships are generated through an approach
analogous to the method used for the analysis of prestressed concrete beams. In this approach,
M- relationships are established by iterating the total top strain ,( )c T and the curvature ( ) .
11n
iw1
2n
iw2
wni
nth time step(n-1)th time step
(b) Typical Beam Segment
1wn
i
1nis n
is
nil
1nil
L
kr
kr
kr
(n-1)th time step
nth time step
Segment i
A B
11niw
12niw
2nwi
1wn
i
1nis
sni
nil
1nil
1n
n
iL
(a) Deflected shape at the (n-1)th and nth

133
At the beginning of the analysis, values for curvature and total top strain (in concrete) are
assumed, as shown in Figure 4.3(a). Then, the total strain in each of the concrete elements, steel
reinforcement and FRP is computed from the assumed strain and curvature. Constitutive laws of
materials are used to determine stresses in concrete, steel reinforcement and FRP. Once the
stresses are known, then the forces in concrete, steel and FRP are computed. The curvature is
then iterated until equilibrium of forces is satisfied (internal force equal to the fire induced axial
restraint force). Once the equilibrium is satisfied, the moment and the corresponding curvature
are calculated. Thus, the values of moment and curvature are stored to represent a point on the
M- curve.
The value of the total top strain is incremented to generate subsequent points on the moment
curvature curve. This procedure is repeated for each time step of fire exposure. The generated M-
curves are used for tracing the behavior of the FRP-strengthened RC beam through nonlinear
structural analysis. The generation of M- relationships is an important part of the numerical
model since these relationships form the basis for the fire resistance analysis of the beam.
4.3.5 Beam Analysis
4.3.5.1 Stiffness Approach
The moment curvature relationships generated for various segments are used to trace the
response of the beam exposed to fire. At each time step, the beam analysis is carried out by
utilizing updated secant stiffness of various segments. The secant stiffness for each segment is
determined from the moment-curvature relationships, based on the moment level reached in that
particular segment.
Following the generation of M relationships, an iterative procedure described by
Cambell and Kodur (1990) is employed to evaluate deflections of the beam at each time step.

134
The beam analysis starts under a unit applied load using initial rigidity ( )oEI and the moment
and corresponding curvature in each beam segment is determined. The segment that has the
maximum moment is selected as the critical (key) segment of the beam. Then, a target curvature
in the key beam segment is selected on pre- generated M curve. Utilizing unit load analysis,
a scaling factor is evaluated by dividing the target curvature with unit load curvature in the key
segment. The unit load curvatures in all beam segments are scaled by multiplying them with the
by this scaling factor. An iterative procedure, illustrated in Figure 4.3(b) and (c), is employed till
convergence of secant rigidity within a certain tolerance is achieved. Once tolerance is achieved,
the above procedure is repeated for next assumed target curvature (Dwaikat 2009). After each
iteration procedure, load required to attain target curvature (key segment) is computed and
stored. To compute the actual curvatures and deflections in the beam, applied load is interpolated
between these stored values. The flow chart explaining the procedure is shown in Figure 4.7.
In the above procedure, stiffness matrix and the loading vector are computed for each
longitudinal segment and assembled in the form of a nonlinear global stiffness equation, and
solved to compute deflections at that time step:
[ ] [ ] [ ]gK P (4.38)
where: gK = global stiffness matrix, δ = nodal displacements, sfP P P where fP
equivalent load vector due to applied loading and sP equivalent nodal vector due to P
effect.
The effect of the second order moments, developed due to the axial restraint force, is
calculated using the following equation:
[ ] [ ][ ]s geoP K (4.39)
where: [Kgeo] = geometric stiffness matrix, [δ] = nodal displacements, and [Ps] = equivalent
nodal load vector due to P- effect.

135
4.3.5.2 Failure Limit States
In the analysis, various parameters, including cross sectional temperatures, stresses,
deflections, and moment capacity are generated at each time step. These parameters are used to
evaluate failure of the beam. ASTM E119 specifies thermal and strength limit state as failure
criteria for beams. In addition, British Standard BS 476-10 (BSI 2009) specifies deflection
criterion as failure limiting state. Furthermore, in FRP-strengthened structures the properties of
FRP degrade with temperature. Glass transition temperature of FRP is often considered as a
measure of determining the effectiveness of FRP in beams. Therefore, in the model the
temperature of FRP ( )gT can be used as a possible failure limit state. The following limiting
criteria have been incorporated in the model to determine the failure of the FRP-strengthened RC
beam:-
In the model, any or all of the following limiting criteria can be applied to evaluate failure of
the FRP-strengthened RC beam:-
The moment due to applied load exceeds the strength capacity of the beam.
The temperature in reinforcing steel (tension reinforcement) exceeds593 Co .
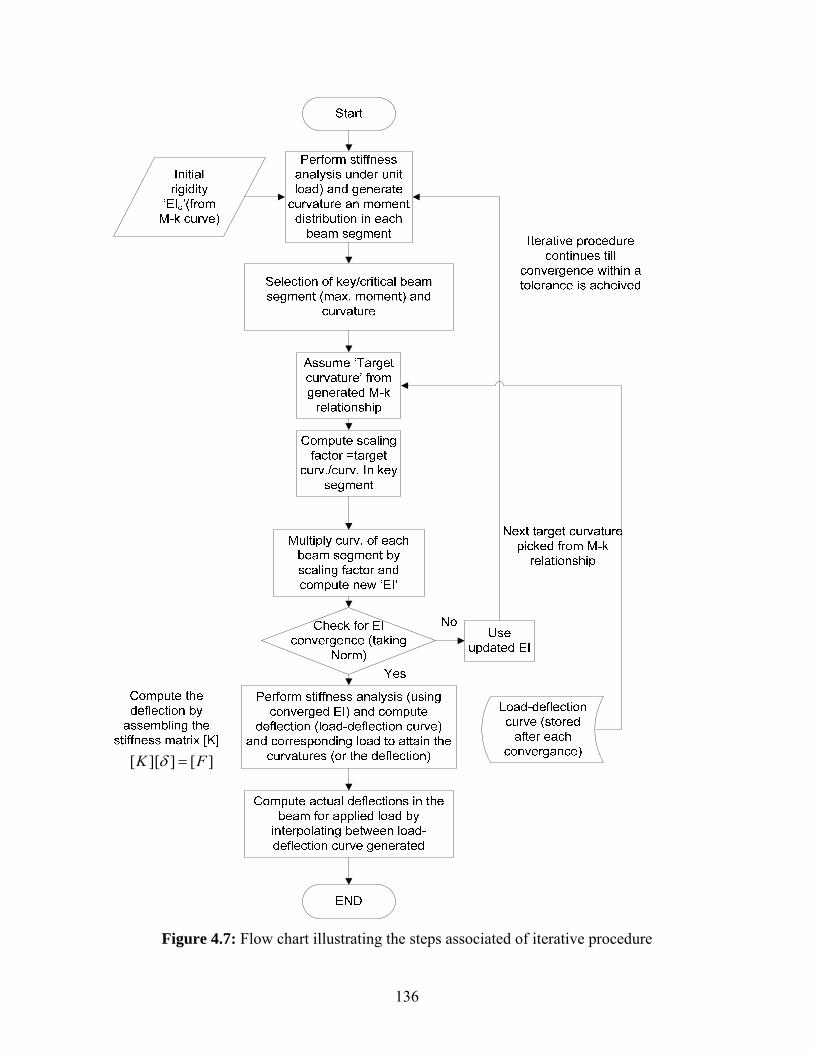
136
[ ][ ] [ ]K F
Figure 4.7: Flow chart illustrating the steps associated of iterative procedure

137
The deflection of the beam exceeds / 20L , where L is the length of the beam, at any fire
exposure time.
The rate of deflection exceeds the limit 2 / 9000L d (mm/min) where L is the length of the
beam (mm); and d, effective depth of the beam (mm).
The temperature in FRP layer exceeds glass transition temperature ( )gT of FRP.
It should be noted that the user has the option to specify any (or all) of the five limit states to
define failure.
4.4 Computer Implementation
4.4.1 Computer Program
To facilitate large computations involved in numerical procedure described in Section 4.3
and 4.4, computer program has been developed using FORTRAN language. This program takes
into account the iterative approach required for computations. The flow chart explaining this
numerical procedure is shown in Figure 4.2.
4.4.2 Beam Idealization
The numerical procedure involves idealization of FRP-strengthened RC beam in
longitudinal beam segments. For hydro-thermal and mechanical analysis, the cross-section of the
beam is idealized as a mesh of elements as shown in Figure 4.1(b). The number of longitudinal
segments and the number of elements and the grid size in each direction must be specified in the
input file. The program allows for non-uniform grid size in the cross-sectional mesh. The
program determines the element size based on the specified number of elements. The program
also allows for any rebar configuration. However, the section must be symmetrical around the
vertical centroidal axis, since the model cannot account for the development of torsional forces
due to non-symmetrical geometry.

138
4.4.3 Material Properties
For modeling the response of FRP-strengthened beams, high temperature properties of
concrete, steel, FRP and insulation are required. These properties include thermal, mechanical
and deformation properties which vary as a function of temperature. There is reliable data on
high temperature properties of concrete and steel. However, only limited knowledge of high
temperature properties of FRP and insulation exists. In the following sections, the constitutive
models that have been inbuilt into the numerical model for thermal and structural analyses are
presented. A detailed discussion on mechanical and thermal properties of each constitutive
material has been included in Chapter 2 and 3. The selection of the constitutive models that will
be used in the analysis (as presented in Chapter 5) is based on the material type used for
fabrication (like aggregate type with moisture content measure at time of testing) and mechanical
and thermal properties of specific material used for strengthening and insulating beams.
4.4.3.1 Concrete
Three sets of concrete properties suggested by Eurocode 2 (2004), the ASCE Manual (Lie
1992), and Kodur et al. (2004), as discussed in Chapter 2 (Section 2.4.2), have been incorporated
into the program. In addition, the program allows for general material properties read from other
input files where the material properties should be presented in a tabular format as a function of
temperature. The user can specify any of the material models in the input file. The user also has
the option of selecting either siliceous aggregate concrete or carbonate aggregate concrete.
Relevant formulae for both mechanical and thermal properties of concrete as a function of
temperature are built into the program. In the input file the user has to specify the 28-day
compressive strength of concrete, initial moisture content, initial concrete permeability, tensile
strength of concrete, concrete model (Eurocode, ASCE, or Kodur), and the type of aggregate in
the concrete.

139
4.4.3.2 Steel Reinforcement
The mechanical properties of reinforcing steel (stress-strain-temperature relationships) given
in the ASCE Manual (Lie 1992) and in Eurocode-2 (2004) have been incorporated into the
program. In addition, the program also allows for general stress strain relationships as a function
of temperature, which can be input into the program in a tabulated form. For a selected ASCE or
Eurocode model, yield strength of steel is provided as input parameter to the program that uses
the built-in stress-strain-temperature relationships.
4.4.3.3 FRP and Insulation Material
As previously illustrated in the literature review (Chapter 2), very limited data on high
temperature material properties of FRP and insulation are available. In the current model, high
temperature material properties of FRP’s (carbon-, glass-, and aramid-, fiber reinforced
polymers) and insulations (Tyfo Vermiculate-Gypsum (VG), Promatect calcium silicate boards
and Tyfo WR AFP system) have been incorporated in the model. For VG insulation and calcium
silicate boards, constitutive relationships which are based on semi-empirical relationships
suggested by Bisby (2003) and accounts for variation of strength and stiffness as a function of
temperature for unidirectional FRP composites, have been included in the model. Thermal
properties of new insulation system (Tyfo WR AFP system) used for fire protection of the test
beams were obtained from high temperature material testing at MSU. The details are discussed
in Chapter 3. It should be noted that the model cannot account for mechanical properties (bond
strength) of the insulation which are required to predict its delamination (falling off) since there
is lack of data availability at room as well as at elevated temperatures. In addition, the model can
be easily extended to account for other types of FRP and insulation materials provided thermal
property data are available at room as well as elevated temperatures.

140
4.4.3.4 Input Data
The basic input for the program consists of cross-sectional properties, material properties,
and general data such as the number of time increments. The sequential order of the input data
must be followed. Consistent units must be used throughout.
4.4.3.5 Output Results
The output from the program includes the results from the hydro-thermal and structural
analyses. At each incremental time step, the temperature at each elemental node is computed.
The output results also include the M- curves. In addition, the deflection of the beam and the
rate of deflection are also recorded for each time step.
4.5 Summary
A numerical model was developed for tracing the response of FRP-strengthened RC beams
exposed to fire. The three stages associated with the fire resistance analysis, namely; fire growth,
thermal, and structural analysis, are explained. Equations governing the hydro-thermal and
mechanical analyses are derived. The proposed macroscopic FE model accounts for high
temperature material properties, various fire scenarios, fire induced bond degradation in FRP,
axial restraint effect, geometrical nonlinearity, and different high temperature strain components.
In the nonlinear beam analysis, the model uses a curvature controlled iterative procedure in
which the softening of the beam is accounted for. This numerical procedure was incorporated
into a computer program and the program is capable of tracing the response of rectangular, T or I
RC beams strengthened with FRP. The validity of the computer model will be established in the
following chapter.

141
CHAPTER 5 MODEL VALIDATION
5.1 General
In this chapter, the validity of the computer model, presented in Chapter 4, is established
by comparing predictions from the model with data from fire tests. The validation process
covered response parameters from both thermal and structural analysis. The validation was
carried out using data from the fire tests on FRP-strengthened RC beams that are published in the
literature, as well as from fire tests conducted as part of the current research. The response
parameters covered in validation include cross sectional temperatures in FRP, rebars, insulation
and concrete, mid-span deflections, debonding of FRP and fire resistance. In addition to
validation, an FRP-strengthened RC beam designated as Beam I, has been analyzed to illustrate
the usefulness of the program and to discuss various trends, in tracing the fire response of a
typical FRP-strengthened RC beam in the entire range of loading up to collapse under fire
exposure.
5.2 Typical Response of FRP-strengthened Beam
5.2.1 Details of the Beam
A beam was analyzed using the computer program to illustrate the behavior of fire
exposed FRP-strengthened RC beam. The details of the beam, including geometric and material

142
properties are summarized in Figure 5.1 and Table 5.1. The RC beam is strengthened with 2 mm
thick CFRP laminate and has 20 mm thick insulation at the beam soffit extending on two sides of
the beam up to 105 mm height (measured from the soffit insulation thickness), as shown in
Figure 5.1. The beam has a uniformly distributed load of 60 kN/m which represents a load level
of 52% of its strengthened capacity. The load ratio is defined as the ratio of the applied loading
during the time of fire to the capacity at room temperature. The high temperature material
properties for concrete and steel are assumed to follow that specified in ASCE manual (Lie
1992) while for FRP and insulation, the properties suggested by Bisby (2003) have been utilized.
For hydro-thermo-mechanical analysis, the beam is idealized into a number of longitudinal
segments along its span length. Each segment is further idealized into a mesh of elements (see
Figure 5.1(c) and (d)). The beam is exposed to ASTM E119 standard fire (2007) and fire
resistance analysis is carried out by incrementing exposure time at every 5 minutes. Results from
the analysis are used to illustrate the response of a typical FRP-strengthened RC beam (refer to
Figures 5.2 through 5.10).
5.2.2 Thermal Response
Figure 5.2 shows temperatures at various cross-sectional locations of the beam as a
function of fire exposure time. As expected, the predicted temperatures in FRP, rebars and
concrete decreases with increasing distance from the fire-exposed side. The low thermal
conductivity and high heat capacity of insulation keeps the temperatures in FRP and steel rebars
quite low. The analysis shows that the concrete temperature at mid-depth of the section remains
relatively low throughout the fire exposure. This is due to the low thermal conductivity and high
thermal capacity of concrete. Figure 5.2 shows that the temperature in the corner rebar is higher
than that in the inner (central) rebar throughout fire exposure time. This trend can be attributed to

143
the fact that the corner rebar is exposed to fire from two faces, the bottom and the side faces of
the beam cross section, while the inner rebars experience heat transfer only from the bottom face.
Externally bonded FRP-strengthened RC members are bond-critical applications and the
bond strength is particularly important for evaluating the structural fire response. The
temperature rise at FRP/concrete interface serves as an indicator for potential loss of bond
between FRP and concrete. The bond properties are sensitive to even a modest increase in
temperature and bond strength degrades significantly when the temperature exceeds the glass
transition temperature of the adhesive (matrix). The temperature rise at the interface depends on
the thermal properties of insulation (thermal conductivity) and the insulation thickness. Figure
5.2 shows that the temperature at FRP/concrete interface reaches the glass transition temperature
at about 40 minutes ( gT 81oC)

144
(a) Simply supported beam (b) Beam cross section
(c) Idealized beam into longitudinal beam segments (d) Mesh of beam segment
Figure 5.1: Beam elevation and cross section details
Figure 5.2: Temperatures at various locations in the beam as a function of fire exposure time
0
300
600
900
1200
1500
0 60 120 180 240 300 360 420
Tem
pera
ture
( o C
)
Time (minutes)
ASTM E119
Corner Rebar
Inner Rebar
FRP Layer
Mid-depth
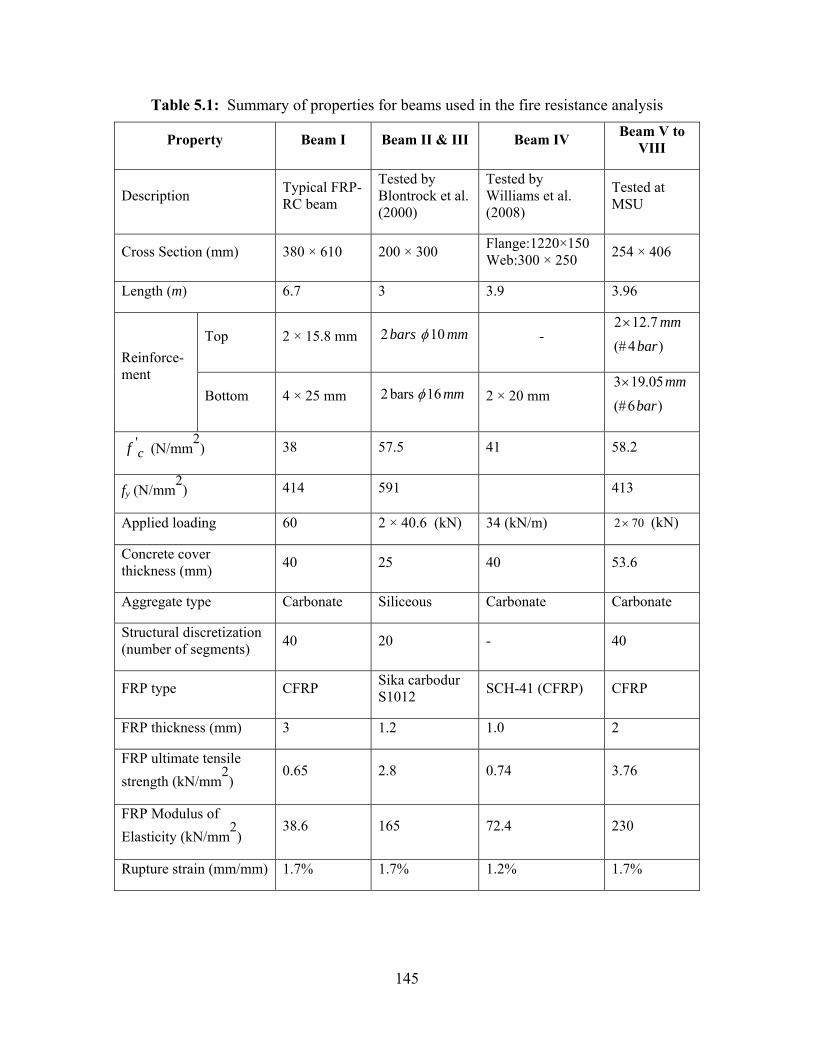
145
Table 5.1: Summary of properties for beams used in the fire resistance analysis
Property Beam I Beam II & III Beam IV Beam V to
VIII
Description Typical FRP-RC beam
Tested by Blontrock et al. (2000)
Tested by Williams et al. (2008)
Tested at MSU
Cross Section (mm) 380 × 610 200 × 300 Flange:1220×150 Web:300 × 250
254 × 406
Length (m) 6.7 3 3.9 3.96
Reinforce-ment
Top 2 × 15.8 mm 2 10bars mm -
2 12.7
(# 4 )
mm
bar
Bottom 4 × 25 mm 2 bars 16 mm 2 × 20 mm
3 19.05
(#6 )
mm
bar
'cf (N/mm
2) 38 57.5 41 58.2
fy (N/mm2) 414 591 413
Applied loading 60 2 × 40.6 (kN) 34 (kN/m) 2 70 (kN)
Concrete cover thickness (mm)
40 25 40 53.6
Aggregate type Carbonate Siliceous Carbonate Carbonate
Structural discretization (number of segments)
40 20 - 40
FRP type CFRP Sika carbodur S1012
SCH-41 (CFRP) CFRP
FRP thickness (mm) 3 1.2 1.0 2
FRP ultimate tensile
strength (kN/mm2)
0.65 2.8 0.74 3.76
FRP Modulus of
Elasticity (kN/mm2)
38.6 165 72.4 230
Rupture strain (mm/mm) 1.7% 1.7% 1.2% 1.7%

146
Table 5.1 (cont′d)
Insulation thickness (mm)
20 25 38 25
Insulation type VG-EI-R Promatect - H Vermiculite-gypsum (VG)
Vermiculite-gypsum (VG)
*Insulation thermal conductivity (W/m-oK)
0.0815 0.175 0.0815 0.0815
* at room temperature
5.2.3 Structural Response
5.2.3.1 Moment-curvature Relationships
For beam, the structural response can be gauged by looking at the moment-curvature
relationships as a function of fire exposure time. The moment-curvature curves, generated at
various time steps for a representative segment in FRP-strengthened RC beam, are shown in
Figure 5.3. At early stages of fire exposure (up to about 30 minutes), the bending moment
increases with curvature till certain a curvature and thereafter, the moment drops, and this is
mainly due to the rupture of FRP. At ambient temperature, this moment drop is not captured
since the concrete crushes prior to the rupture of FRP. The percentage drop in the moment
capacity after rupture of FRP decreases with increasing fire exposure time. This can be attributed
to the rapid loss of strength and stiffness of FRP at elevated temperatures which reduce its
contribution towards the moment capacity of the beam. The ultimate curvature of the beam
increases with temperature due to the higher deterioration in the strength and stiffness properties
of the constituent materials. The beam behaves as un-strengthened RC beam after FRP loses all
its strength and does not contribute towards the moment capacity. It should be noted that the
moment capacity of the strengthened beam at room temperature (735 kN-m) is slightly higher
(12%) than the calculated capacity based on ACI 440.2R-08 (2008) provisions (without taking

147
into account the additional reduction factor 0.85 for bending strength contribution by FRP).
This can be attributed to strain hardening effect of the steel reinforcement which is accounted for
in the model (Dwaikat 2009). This effect is not taken in to account in ACI design equations.
Figure 5.3: Moment-curvature curves at various times for Beam-I under fire exposure
5.2.3.2 Moment Capacity and Deflections
The variation of mid-span deflection and moment capacity are plotted as a function of
fire exposure time in Figure 5.4. The trends in Figure 5.4 indicate that there is a slight increase in
moment capacity for early stages of fire exposure followed by its degradation. This slight
increase in the moment capacity results from full utilization of the bonded length of FRP at the
beam soffit. The cross sectional temperatures of the beam increase with fire exposure time,
particularly in the upper part of the beam cross section since the two surfaces of the beam are
exposed to direct heat flux in absence of any fire protection. This results in a rapid loss of
concrete strength and stiffness properties. Correspondingly, the beam curvature increases with
the fire exposure time under a constant applied load. This increase in curvature introduces an
even distribution of strain in FRP. This uniform strain distribution results in an increase in the
0
100
200
300
400
500
600
700
800
900
0 50 100 150 200
Mom
ent (
kN-m
)
Curvature (1/km)
Time = 0Time = 30 minsTime = 60 minsTime = 120 minsTime = 180 minsTime = 225 mins

148
tensile force in FRP which leads to a slight increase in the moment capacity. However, strength
and stiffness properties of constituent materials (FRP, concrete and reinforcing steel) degrade
significantly with the increasing temperature, and this results in a reduction in the moment
capacity of the beam with an increase in the mid-span deflection, as shown in Figure 5.4.
Figure 5.4: Moment capacity and deflection of FRP-RC beam as a function of fire exposure time
The fire resistance of the beam is evaluated by applying five failure criteria as discussed
in Chapter 4, Section 4.6.2. The predicted fire resistance based on the critical temperature in the
steel (corner) rebar is 315 minutes. However, based on the strength limit state, the failure occurs
in 225 minutes. The deflection failure limit state did not govern since the insulation delays the
degradation of strength and stiffness of reinforcing steel and FRP, and this result in a relatively
lower deflection.
5.2.3.3 Bond Degradation
To illustrate the effect of bond degradation at FRP-concrete interface on fire response,
Beam I was analyzed under three cases of possible bond namely; with perfect bond, with
temperature induced bond degradation and with a plain RC beam. Figure 5.5show a comparison

149
of time-deflection response for two cases of FRP-strengthened RC beams, namely; with perfect
bond, with temperature induced bond-slip, and the case of an un-strengthened RC beam with no
externally applied fire protection. It can be seen that the response of both strengthened beams
(with and without accounting for bond degradation) is stiffer as compared to the un-strengthened
RC beam, and this is due to high strength and stiffness properties provided by FRP composite.
For the un-strengthened RC beam, the rate of deflection is much higher because the mechanical
properties of concrete and steel degrade faster in the absence of any external fire protection. For
the strengthened beam with a perfect bond, the response primarily depends on the high
temperature properties of FRP. The strength properties of FRP, used for flexural strengthening of
the analyzed beam (Beam I), only degrade when the temperature is above the range of 250-
300oC, as shown in Figure 5.6. The externally applied insulation limits the rise in temperature of
FRP. Therefore, the contribution of FRP towards the capacity of the strengthened beam is for
longer time which results in lower mid-span deflections.
Figure 5.5: Deflection of FRP-strengthened and RC beam as function of fire exposure time
-450
-400
-350
-300
-250
-200
-150
-100
-50
0
0 60 120 180 240
Def
lect
ion
(mm
)
Time (minutes)
FRP-RC beam (No slip)
FRP-RC beam (Slip)
Unstrengthened RC Beam
Loss of
composite action

150
Figure 5.6: Ultimate tensile strength ( )Tf of CFRP as a function of temperature
Analysis of similar a beam, with accounting for bond degradation at FRP/concrete
interface, shows that the FRP debonded at around 40 minutes when the temperature at bond
interface exceeded the glass transition temperature of the adhesive ( gT of adhesive is 81oC), as
shown in Figure 5.7. The bond properties of the adhesive degrade with increasing temperature,
and this result in a relative slip between FRP and concrete. Due to this bond-slip, the force
transfer from concrete to FRP reduces as compared to a perfect bond case. Figure 5.5 illustrates
that this effect of bond-slip appears at about 25 minutes, when the temperature at bond interface
is 46oC, and full debonding of FRP occurs at 40 minutes. At this stage, stiffness of the beam
decreases significantly and the beam behaves as an insulated and un-strengthened RC beam since
the contribution of FRP to the beam capacity is zero. This results in an increase in rate of
deflection of the beam. However, this increase in deflection is smaller when compared to an un-
strengthened and un-insulated RC beam. This is mainly due to the beneficial effect of the
insulation which slows the temperature rise in steel reinforcement, which mainly contributes to
0.00
0.20
0.40
0.60
0.80
1.00
1.20
0 500 1000 1500
f, T/ f
,T =
20o C
Temperature ( oC)
50% strength

151
resist the applied load on the beam after the FRP is lost. Therefore, strength and stiffness
degradation in steel reinforcement is gradual and this leads to a lower deflection, at a given time.
Figure 5.7: Temperature variation at the interface of FRP-concrete interface as a function of fire exposure time
Effect of bond-slip on the strength of FRP-strengthened RC beams is further illustrated in
Figure 5.8 where the variation of moment capacity is plotted as a function of time for two cases
of bond. In both of the cases, the behavior of the beams is identical in the early stages of fire
exposure (up to 30 minutes) when there is an abrupt decrease in the moment capacity of FRP-
strengthened beam that accounts for bond degradation. This sudden drop represents the
debonding of FRP. In case of the FRP-strengthened RC beam with a perfect bond, the moment
capacity decreases almost linearly since strength and stiffness of FRP degrade gradually with
temperature.
0
40
80
120
160
200
0 30 60 90 120
Tem
pera
ture
( o
C)
Time (minutes)
40

152
Figure 5.8: Moment capacity of FRP-strengthened and RC beam as function of fire exposure time
The variation of interfacial shear stress and strain (bond-slip) distribution over half the
span of the beam for various fire exposure times is presented in Figures 5.9 and 5.10. It can be
noticed that the peak interfacial shear stress and strain ( )slip occur in the vicinity of FRP
termination zone (edges) and are relatively more uniformly distributed far from FRP ends
(towards mid-span of the beam). As expected, shear stresses predicted at the FRP end are zero
and match the free surface stress condition. As the temperature at the interface increases with fire
exposure time, the maximum interfacial shear stress and corresponding strain ( )slip also
increase towards the FRP end. These increasing shear stresses contribute to debonding of FRP
when its magnitude exceeds decreasing shear capacity of the adhesive with temperature. Also,
with increase in temperature, strain distribution along the bonded length of FRP becomes more
uniform which can be attributed to the reduction in stiffness of the adhesive with temperature. As
the temperature in FRP exceeds the glass transition temperature, the strain in FRP increases
significantly ultimately leading to debonding of FRP (refer to Figure 5.9).
0
200
400
600
800
1000
0 50 100 150 200 250
Mom
ent C
apac
ity (
kN-m
)
Time (minutes)
No Slip
SlipLoss of composite action

153
Figure 5.9: Variation of interfacial shear stress as a function of fire exposure time
Figure 5.10: Slip distribution for mid span of the beam as a function of fire exposure time
0
0.05
0.1
0.15
0.2
0.25
0.3
0.35
0.4
0 0.5 1 1.5 2 2.5 3
She
ar S
tres
s (M
Pa)
Distance from CFRP end (m)
Time = 5 mins
Time = 15 mins
Time = 25 mins
Time = 30 mins
x
0
50
100
150
200
250
0 0.5 1 1.5 2 2.5 3
Bon
d-sl
ip (μ
m/m
)
Distance from CFRP end (m)
Time = 5 mins
Time = 15 mins
Time = 25 mins
Time = 30 mins
x

154
5.2.4 Summary
FRP-strengthened RC beams experience significant degradation in moment capacity and
stiffness when the temperature at FRP-concrete interface exceeds glass transition temperature.
FRP-strengthened RC beam protected with insulation, attains lower deflection under fire
conditions as compared to an un-strengthened RC beam, due to the beneficial effect of external
insulation which slows the temperature rise and strength loss in steel reinforcement. The
adhesive loses its strength and stiffness with temperature, and composite action between FRP
and concrete is lost when the temperature approaches glass transition temperature. At this point,
results show an abrupt decrease in the moment capacity of FRP-strengthened beam that accounts
for bond degradation. However, for FRP-strengthened beam with a perfect bond, the moment
capacity of the beam decreases almost linearly since strength and stiffness of FRP degrade with
temperature.
5.3 Validation Against the Test Data
The validity of the numerical model is established by comparing predictions from the
model with test results published in the literature and against results from fire tests conducted as
part of the current research. From the literature, two beams that were selected for the validation
are rectangular FRP-strengthened RC beams tested by Blontrock et al. (2000) while the third
beam is a T-beam tested by Williams et al. (2008). The remaining four beams are the specimens
tested as part of this study.
5.3.1 Blontrock et al. Test Beams
The two beams, designated as Beam II and III, were simply supported (not axially
restrained) and tested under ISO 834 standard fire exposure. Both of the beams had a cross
section of 200×300 mm and a span length of 3 m, as shown in Figure 5.11. The beams had two

155
10 mm and 16 mm diameter rebars as top and bottom reinforcement respectively. Both beams
were strengthened with CFRP (1.2 mm thick and 100 mm width) at the beam soffit and were
insulated with Promatect-H type insulation. Beam II and III had 25 mm of insulation thickness at
bottom of the beam, while for Beam III an additional 12 mm thickness of insulation was
provided on the two sides of the beam that extended up to a height of 105 mm, as shown in
Figure 5.11. The geometric and material properties of these beams are tabulated in Tables 5.1
and 5.2. Predicted results from analysis are compared with measured values in Figures 5.12 to
5.14. The length of the beam was idealized into 40 beam segments (keeping finer segment length
near mid-span) and fire resistance of the beams is computed based on four failure criteria as
discussed in Chapter 4.
Table 5.2: Material properties for Blontrock beams
Material Property
Concrete 'cf =58 N/mm
2 ; Ec (elastic modulus) = 34,825 N/mm
2
Steel yf =591 N/mm
2 ; Es (elastic modulus) = 20,5000 N/mm
2
u (ultimate strain) = 6.7%
Sika Carbodur S1012 (CFRP)
fu =2800 N/mm2 ; Efrp (elastic modulus) = 16,5000 N/mm
2
u (ultimate strain) = 1.7%
For Beam II, Blontrock et al. have measured the corner rebar temperature and mid span
deflection only, while for Beam III, temperature increase at FRP-concrete interface has also been
reported. During the test on Beam II, the insulation had fallen off after 7 minutes of fire
exposure, and thereafter, the interaction between FRP and concrete was lost. This effect was
simulated in the analysis.

156
Figure 5.11: Elevation and cross section of beams tested by Blontrock et al.
Figure 5.12 shows a comparison between the predicted and the temperatures measured in
steel reinforcement and mid-span deflection as a function of exposure time for Beam II. There is
a good agreement between the predicted and the measured temperatures of steel reinforcement
for the entire range of the test. In the test, deflections could not be recorded beyond 75 minutes
of fire exposure time due to increase in rate of deflection just prior to the failure. For most part,
the deflections computed by the model are in good agreement with measured values. The model
predicts strength failure in the beam at about 85 minutes.
FRP laminate
Insulation
1000 mmP P
3000 mm
105
mm
300 mm
200 mm
25 mm
12 mm
100 mm

157
Figure 5.12: Measured and predicted rebar temperatures and mid-span deflection in Beam II
Results from the fire resistance analysis for Beam III have been compared with measured
test data in Figures 5.13 and 5.14. Blontrock et al. (2000) reported loss of interaction between
FRP and concrete after 26 minutes of fire exposure time while analyzing the test data. Figure
5.13 shows the comparison of the predicted and the measured temperature in steel reinforcement
and at the interface of FRP/concrete, respectively. There is a good agreement between the
predicted and measured values in the entire range of fire exposure. Predicted deflections are
compared with the measured deflections in Figure 5.14. Analysis of the results indicates that
debonding of FRP occurred at 30 minute of fire exposure time, and that is slightly higher than
that reported by Blontrock et al. (26 minutes when the temperature at the interface was 52.1oC
i.e., less than measured 62ogT C . This can be attributed to a variation in bond properties used
in the analysis as compared to actual properties. Nevertheless, over all model prediction of the
beam deflection up to and beyond debonding point of the FRP, matches the measured test data
closely.
0
50
100
150
200
0
100
200
300
400
500
600
700
0 20 40 60 80 100
Def
lect
ion
(mm
)
Tem
pera
ture
( o C
)
Time (minutes)
Test
ModelCorner Rebar
Deflection
Unloading ofbeam

158
Figure 5.13: Measured and predicted temperatures at the interface of FRP/concrete and corner rebar for Beam III
Figure 5.14: Measured and predicted deflection as a function of fire exposure time for Beam III
The above comparison indicates that the model is capable of tracing overall thermal and
structural response of FRP-strengthened beams, including the effect of fire induced bond.
0
200
400
600
800
1000
0 20 40 60 80 100
Tem
pera
ture
( o
C)
Time (minutes)
Test
Model
ISO 834
Rebar
FRP/Concreteinterface
-60
-50
-40
-30
-20
-10
0
0 20 40 60 80 100
Def
lect
ion
(mm
)
Time (minutes)
Model
Test
Loss of composite action

159
5.3.2 William et al. Tested T-Beam
The T-beam was tested in accordance with the ASTM E119 standard fire testing
procedure under sustained service load. The overall length of the insulated T-beam was 3900
mm and 400 mm in depth. The flange width and web depth were 1220 mm and 300 mm,
respectively. Two 20 mm diameter rebars were used as flexural reinforcement. The beams were
strengthened with 100 mm wide CFRP layer. The beam was fire protected with 25 mm of VG
insulation on the bottom as well as both sides of the web. The VG insulation extended to a
distance of 125 mm under flanges as shown in Figure 5.15. The material properties, taken from
the test data reported by Blontrock et al. and used in the analysis, are presented in Table 5.3.
Table 5.3: Material properties for T-beam
Material Property
Concrete 'fc = 41 N/mm2 ; Ec (elastic modulus) = 30,414 N/mm
2
Steel f y = 450 N/mm
2 ; Es (elastic modulus) = 20,0000 N/mm
2
u (ultimate strain) = 0.2%
SCH-41 (CFRP) fu =745 N/mm
2 ; Efrp (elastic modulus) = 72,400 N/mm
2
u (ultimate strain) = 1.2%
The measured and predicted temperatures at steel rebar, interface of FRP/concrete and
unexposed top surface for the T-beam are shown in Figure 5.15. In addition, Figure 5.15
provides a comparison of temperatures measured in steel against temperature predicted by the
model. Overall there is a good agreement between the predicted and measured values in the

160
entire range of fire exposure time. The model could not be validated against measured
deflections in this test since the applied loading was lost during the test.
Figure 5.15: Measured and predicted temperatures at various locations in Beam IV
5.3.3 MSU Test Beams
Further validation of the numerical model was undertaken by comparing measured
temperatures, deflections and axial restraint force in the fire tests conducted as part of the current
research, with the model predictions. Two beams (Beams V and VI) were tested under design
fire (with well defined decay phase), while the other two beams (Beams VII and VIII) under
ASTM E119 standard fire exposure. The details about the beams characteristics and the fire
scenarios is given in Chapter 3 and tabulated in Table 5.1. Each beam is analyzed under the
corresponding fire scenario and end support conditions and the results are presented in Figures
5.16 through 5.20.

161
5.3.3.1 Thermal Response
Figure 5.16 and 5.17 provides a comparison of temperatures at FRP/concrete and
FRP/insulation interfaces, and at three different locations (TC5, TC6 and TC9) in the beam cross
section. TC5 represent the temperature in compression reinforcement, TC6 represent corner
rebar temperature (flexural reinforcement) while TC9 is at the mid depth of beam cross section
(203 mm), as shown in Figure 5.18. It can be seen in Figures 5.16 (a) to (d) that the measured
and predicted temperatures are in a good agreement throughout the fire duration for all of the
four beams.
Figures 5.17 (a) to (d) provides a comparison between predicted and measured
temperatures at FRP/concrete and FRP/insulation interfaces. These temperatures are critical
indicators of the performance of FRP under elevated temperatures. The model predicts
temperature fairly well up to 40 minutes of fire exposure time. The model could not capture
100oC plateau observed in the test data. This plateau is most likely due to migration of the
moisture present in the insulation towards the FRP/insulation interface (away from fire). This
accumulated water consumes heat energy in evaporation and this effect was captured by
thermocouple at FRP/insulation interface.
Beyond this point, the model under predicts temperature at FRP/insulation interface and
over predicts FRP/concrete interface temperatures for all FRP-RC beams. This could be
attributed to the fact that measured temperature at FRP/insulation interface increase rapidly after
40 minutes due to the localized burning of the epoxy as a result of cracks propagation in
insulation. Due to this localized burning, measured temperatures are higher as compared to those
predicted by the model. On the contrary, increase in temperatures recorded at FRP/concrete
interface is slightly lower than those predicted by the model. This is because of formation of a

162
solid char layer as a result of thermal degradation of epoxy (pyrolysis process) that acts as a
thermal barrier and restricts the heat flow. Model predictions for beam Beam VII does not match
with the measured temperatures since a portion of insulation fell off when FRP delaminated
around 38 minutes and the model could not account for falling-off of insulation. In beams Beam
V and VI, the temperature rises to a maximum value and starts to drop. This drop is due to the
cooling phase in time-temperature curve of the fire. Also, it is interesting to note that temperature
rises moderately at mid-depth of concrete (TC9) as compared to TC5 (compression
reinforcement) which is closer to the exposed side of the beam cross section. This can be
attributed to low thermal conductivity of concrete. Similarly, temperature decreases slowly
during the cooling phase since it takes longer time to dissipate heat energy from the inner
portions (away from exposed surface) of the beam cross section. Overall, the model predicts
temperature progression reasonably well. Compared to the measured time of FRP debonding
which was around 20 minutes, the model predicts it to be about 25 minutes. This variation can be
attributed to the discrepancy between measured and predicted temperatures at interface of FRP
as discussed above. Overall, the model provides reasonable estimates of temperature at different
locations of beam cross section.

163
Figure 5.16: Comparison of measured and predicted temperatures in compression and flexural reinforcement and mid-depth of cross section for beams Beam V through Beam VIII
0
200
400
600
800
1000
1200
0 60 120 180 240 300 360
Tem
pera
ture
(o C
)
Time (minutes)
TC9(Exp)
TC9(Model)
TC5(Exp)
TC5(Model)
TC6(Exp)
TC6(Model)
Furnace temp.
Beam V
0
200
400
600
800
1000
1200
0 60 120 180 240 300 360
Tem
pera
ture
(o C
)
Time (minutes)
TC9(Exp.)
TC9(Model)
TC5(Exp.)
TC5(Model)
TC6(Exp.)
TC6(Model)
Furnace temp.
Beam VI

164
Figure 5.16 (cont′d): Comparison of measured and predicted temperatures in compression and flexural reinforcement and mid-depth of cross section for beams Beam V through Beam VIII
0
200
400
600
800
1000
1200
0 60 120 180 240
Tem
pera
ture
(o C
)
Time (minutes)
TC9(Exp.)
TC9(Model)
TC5(Exp.)
TC5(Model)
TC6(Exp.)
TC6(Model)
Furnace temp.
Beam VII
0
200
400
600
800
1000
1200
0 60 120 180 240
Tem
pera
ture
(o C
)
Time (minutes)
TC9(Exp.)
TC9(Model)
TC5(Exp.)
TC5(Model)
TC6(Exp.)
TC6(Model)
Furnace temp.
Beam VIII

165
Figure 5.17: Comparison of measured and predicted temperatures at FRP/insulation, FRP/concrete interfaces for beams Beam V through Beam VIII
0
200
400
600
800
1000
1200
0 60 120 180 240 300 360
Tem
pera
ture
(o C
)
Time (minutes)
FRP/C(Exp)
FRP/C(Model)
FRP/VG(Exp)
FRP/VG(Model)
Furnace temp.
Beam V
0
200
400
600
800
1000
1200
0 60 120 180 240 300 360
Tem
pera
ture
(o C
)
Time (minutes)
FRP/C(Exp.)
FRP/C(Model)
FRP/VG(Exp.)
FRP/VG(Model)
Furnace temp.
Beam VI

166
Figure 5.17 (cont′d): Comparison of measured and predicted temperatures at FRP/insulation, FRP/concrete interfaces for beams Beam V through Beam VIII
0
200
400
600
800
1000
1200
0 60 120 180 240 300
Tem
pera
ture
(o C
)
Time (minutes)
FRP/C (Exp.)
FRP/C(Model)
FRP/Insul(Exp.)
FRP/Insul(Model)
Furnace temp.
Beam VII
0
200
400
600
800
1000
1200
0 60 120 180 240 300
Tem
pera
ture
(o C
)
Time (minutes)
FRP/C (Exp.)
FRP/C (Model)
FRP/VG(Exp.)
FRP/VG (Model)
Furnace temp.
Beam VIII

167
(a) Elevation of simply supported FRP-strengthened RC beam showing structural discretization
(b) Cross section
Figure 5.18: Elevation and cross sectional details of MSU tested FRP-strengthened RC beam
5.3.3.2 Structural Response
The predicted and the measured increase in mid-span deflection for the tested FRP-
strengthened RC beams are compared in Figure 5.19. There is a good agreement between the
measured and predicted deflections for all of the four FRP-RC beams. Under fire, the deflection
increased gradually and around 20 minutes, beams experienced a sudden increase in deflections
due to loss of bond at FRP/concrete interface. The model predicts debonding of FRP at about 25-
30 minutes. This discrepancy can be due to differences in measured and predicted temperatures
at the interface due to formation of cracks in the insulation as well as burning of epoxy (matrix)
as discussed earlier.
After debonding, the rate of deflection in Beam VII increases as compared to the measured
rate of deflections of Beam V, VI and VIII. This is because Beam VII, which was initially was
loaded with load ratio 50% of strengthened capacity, experienced higher load ratio (as compared
to capacity of RC beam at room temperature) after FRP contribution to the capacity of the beam
was lost. This leads to higher deflection in the beam as illustrated in Figure 5.19. However, after
debonding of FRP in beam Beam VIII, fire induced axial restraint force contributed to limit

168
deflections due to the development of arch action in the beam that helps resisting the applied
loading.
In Beams V and VI, the factor that contributes towards lower deflections after debonding of
FRP is due to ‘cable action’ (similar to tensile membrane action is slabs) provided by anchored
continuous carbon fibers. The composite action between FRP and beam soffit (concrete) was lost
in the heated portion of the beams (2.44 m). However, delamination of FRP did not occur due to
the location of the anchorages outside the fire zone. Thus, the unbonded continuous fibers at the
beam soffit continued to contribute towards the strength of the beam through ‘cable’ mechanism.
The model predicted no strength failure in Beams V through VIII, same as measured in the test.
Figure 5.19: Measured and predicted deflection of FRP-strengthened RC beams (Beam V through VIII)
-40
-35
-30
-25
-20
-15
-10
-5
0
0 60 120 180 240 300
Def
lect
ion
(mm
)
Time (minutes)
B1(Test)
B1(Model)
B2(Test)
B2(Model)
B3(Test)
B3(Model)
B4(Test)
B4(Model)
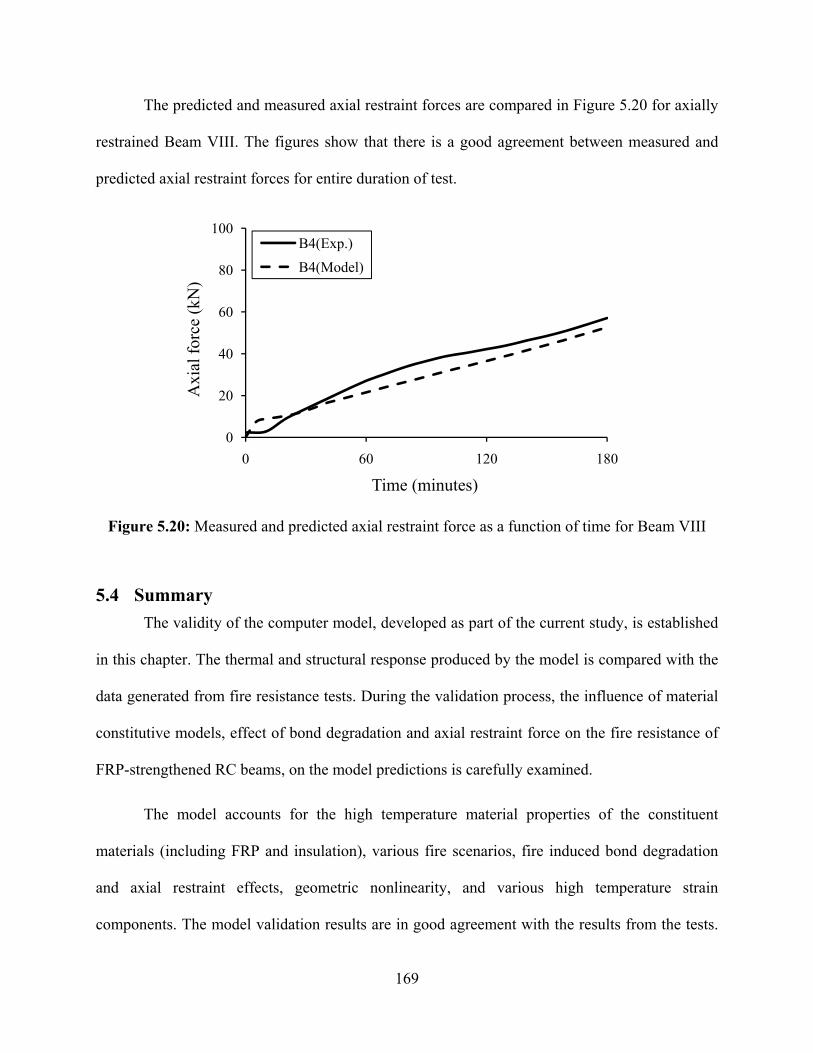
169
The predicted and measured axial restraint forces are compared in Figure 5.20 for axially
restrained Beam VIII. The figures show that there is a good agreement between measured and
predicted axial restraint forces for entire duration of test.
Figure 5.20: Measured and predicted axial restraint force as a function of time for Beam VIII
5.4 Summary
The validity of the computer model, developed as part of the current study, is established
in this chapter. The thermal and structural response produced by the model is compared with the
data generated from fire resistance tests. During the validation process, the influence of material
constitutive models, effect of bond degradation and axial restraint force on the fire resistance of
FRP-strengthened RC beams, on the model predictions is carefully examined.
The model accounts for the high temperature material properties of the constituent
materials (including FRP and insulation), various fire scenarios, fire induced bond degradation
and axial restraint effects, geometric nonlinearity, and various high temperature strain
components. The model validation results are in good agreement with the results from the tests.
0
20
40
60
80
100
0 60 120 180
Axi
al f
orce
(kN
)
Time (minutes)
B4(Exp.)
B4(Model)

170
This indicates that the developed macroscopic finite element model is capable of predicting the
fire response of FRP-strengthened RC beams under realistic fire, loading and restraint scenarios.
In the next chapter, this validated model will be applied to conduct parametric studies to
investigate and quantify the influence of various parameters on the fire resistance of FRP-
strengthened RC beams.
171
CHAPTER 6 PARAMETRIC STUDY AND DESIGN GUIDELINES 6.1 General
The experimental studies presented in Chapter 3 indicated that tracing the thermal and
mechanical response of FRP-strengthened RC beams is complex and a number of parameters
have to be accounted for in the analysis. The valuable data and observations from fire
experiments were utilized to validate the numerical model for tracing the fire response of FRP-
strengthened RC beams. This validated model was then applied to study and quantify the effect
of various parameters on the fire response of FRP-strengthened RC beams. The varying
parameters included: load level, bond strength, insulation material, axial restraint force and its
location, aggregate type, concrete strength, and fire scenario.
6.2 Analysis Details
6.2.1 Significant Factors
The literature review together with fire tests and numerical studies presented in Chapter 2 to
5 clearly indicated that the fire resistance performance of FRP-strengthened beams is influenced
by a number of factors and many of these factors are interdependent. It was shown through

172
qualitative parametric studies (Ahmed and Kodur 2010) that the main factors influencing the fire
response of FRP-strengthened RC beams are:
Load level,
Fire scenario,
Axial restraint stiffness and its location,
Concrete strength,
Aggregate type in concrete,
Insulation thermal properties, its thickness and geometric configuration
Bond strength and adhesive thickness
To generate data on the effect of these factors, fire resistance analysis was carried out by
varying above parameters in the practical range.
6.2.2 Selection of Beam
A simply supported (SS) FRP-strengthened RC beam was selected for the fire resistance
analysis. The beam is 6.7 m in length with a cross section of 380×610 mm (refer to Figure 6.1).
The beam is strengthened in flexure by providing three layers of unidirectional CFRP at tension
face of the beam. These CFRP layers are applied at full width (380 mm) of the beam cross
section. For fire protection, Tyfo®
VG insulation is applied at the bottom of the beam that
extends 105 mm on two sides of the beam cross section, as shown in Figure 6.1. The thickness of
insulation is kept 20 mm (constant) except when specified. The details of geometric properties
are tabulated in Table 6.1.
6.2.3 Material Properties
The beam has normal strength concrete (NSC) with a compressive strength of 38 MPa and
carbonate aggregate. The beam has four 25 mm reinforcing rebars at the bottom (flexural
reinforcement) with yield strength of 414 MPa and 2% yield strain. The CFRP composite has

173
ultimate tensile strength of 650 MPa, an elastic modulus of 3860 MPa and rupture strain of 1.7%.
For analysis, thermal and mechanical properties as suggested by Lie 1992 are used for concrete
and reinforcing steel whereas for FRP and insulation these properties are obtained from semi-
empirical relationships proposed by Bisby [3]. It is assumed that the insulation does not crack
and remain intact for the duration of fire test. It has no strength contribution towards capacity of
the beam. Unless specified, the insulation thickness is assumed to be 20 mm. The high
temperature material properties used in the analysis are given in Table 6.1 and Appendix A.
6.2.4 Mesh Size
For analysis, the beam length is discretized into 40 segments, as shown in Figure 6.1. The
length of beam segments is so arranged that it decreases (gets finer) towards the mid-span
(critical regimes of the beam) in order to improve the accuracy of predicted response. The beam
cross section is idealized into elements such that aspect ratio, defined as ratio of length to depth,
of the mesh is small (refined mesh) close to fire exposed boundary. It is important to note that in
general, the accuracy of the finite element solution is improved by refining the discretization of
the structure. Based on the study by Dwaikat (Dwaikat 2009) on effect of longitudinal and cross
sectional discretization, an optimum mesh size is adopted for parametric analysis. Three cross
sectional discretization patterns are used in analysis, namely; 10×20 mm and 5×6 mm elements
in concrete and 3×3 mm in FRP and insulation, as schematically shown in Figure 6.1.
6.2.5 Failure Criteria
The fire resistance for analyzed beam is computed according to three failure criteria, namely
strength, deflection, rate of deflection, and temperature in steel reinforcement. The glass
transition temperature failure criterion has not been considered to define failure in FRP-
strengthened RC beam since literature review and analysis of the test data, presented in Chapter

174
2 and 3 respectively, showed that the beams do not fail at the time when temperature at
FRP/concrete interface reaches gT . However, this criteria has been included while discussing
about improving fire resistance of FRP-strengthened and insulated beam. Also, deflection and
rate of deflection failure criteria do not govern failure in FRP-strengthened and insulated beams.
Moreover, rebar temperature failure criteria is not effected by load ratio, support conditions
(axial restraint), and mechanical properties of constitutive materials.
6.2.5.1 Range of Parameters
The parameters varied in the analysis include five load ratios (30, 40, 50, 60 and 70%), two
aggregate types (carbonate and siliceous aggregate), four degrees of axial restraint stiffness (5,
50, 100 and 200 kN/mm) and five restraint force locations (Y/H) (0.3, 0.4, 0.5, 0.6 and 0.7), three
types of beams, namely; un-strengthened RC beam, un-strengthened and insulated RC beam and
FRP-RC beam with applied insulation. The analysis includes fire behavior of FRP-strengthened
beam with a perfect bond and also while accounting for bond degradation with temperature. The
location of axial restraint is measured from the top most fiber of the beam cross-section as a ratio
of the total depth of the beam. To investigate the effect of fire scenarios, FRP-RC beams were
analyzed under two standard fire exposures (ASTM E119 (2007) standard fire and ASTM E1529
(1993) hydrocarbon fire) and three design fire exposures (Fire I, Fire II and Fire III). The time
temperature curves for the five fire scenarios are given in Figure 6.2. The fire resistance of this
beam was evaluated based on thermal, strength, and deflection failure criteria. A summary of
parameters studied and fire resistance results are presented in Table 6.2 and 6.3, respectively.

175
(a) Elevation of simply supported FRP-RC beam
(b) Discretization along span of beam
(c) Cross sectional elevation (d) Cross sectional discretization
Figure 6.1: Longitudinal and cross sectional discretization for fire resistance analysis
Figure 6.2: Time-temperature curves for different fire scenarios
FRP laminate/sheet
w
Insulation
L/2
1 2 3
0
200
400
600
800
1000
1200
1400
0 100 200 300 400 500
Tem
pera
ture
(o C
)
Time (minutes)
ASTM E119
Hydrocarbon Fire
Design Fire I
Design Fire II
Design Fire III
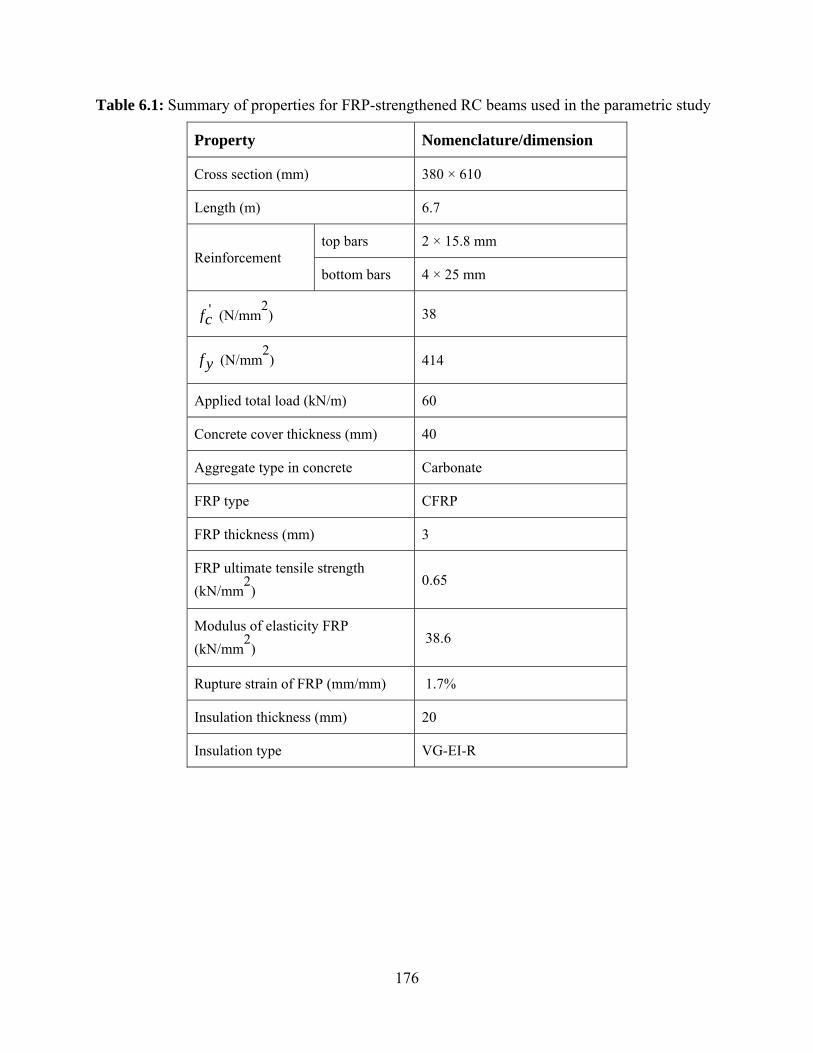
176
Table 6.1: Summary of properties for FRP-strengthened RC beams used in the parametric study
Property Nomenclature/dimension
Cross section (mm) 380 × 610
Length (m) 6.7
Reinforcement top bars 2 × 15.8 mm
bottom bars 4 × 25 mm
'fc (N/mm2) 38
f y (N/mm2) 414
Applied total load (kN/m) 60
Concrete cover thickness (mm) 40
Aggregate type in concrete Carbonate
FRP type CFRP
FRP thickness (mm) 3
FRP ultimate tensile strength
(kN/mm2)
0.65
Modulus of elasticity FRP
(kN/mm2)
38.6
Rupture strain of FRP (mm/mm) 1.7%
Insulation thickness (mm) 20
Insulation type VG-EI-R

177
Table 6.2: Summary of parameters studied in analysis
Factors Range Relevant Figures
Section type RC beam (Plain) Un-strengthened RC beam with
insulation FRP-RC beam with insulation
Figure 6.3
Fire scenario ASTM E119, ASTM E1529, and three design fires (Fire I, II and III)
Figure 6.4, 6.5, and 6.6
Load ratio 30,40,50,60 and 70 % Figure 6.7
Axial restraint stiffness 0, 5, 50, 100 and 200 kN/m Figure 6.8, and 6.9
Location of axial restraint force (Y/H)
0.3, 0.4, 0.5, 0.6 and 0.7 Figure 6.10 and 6.11
Concrete strength 40, 50 and 60 MPa Figure 6.12
Type of aggregate Carbonate and siliceous Figure 6.13
Insulation thickness 0, 15, 25, 40 and 50 mm Figure 6.14 and 6.15
Insulation depth on sides of the beam
20, 50, 100, 150 and 200 mm Figure 6.16
Thermal property of insulation (thermal conductivity)
0.1, 0.2, 0.3, 0.4, 0.5, 0.6, 0.8, 1.0, 2.0, 3.0, 4.0 W/m-oK Figure 6.17
Bond degradation Bond degradation with temperature
Perfect bond Figure 6.18 and 6.19
Adhesive thickness 1, 2, 3 and 4 mm Figure 6.20

178
Table 6.3: Summary of the fire resistance values for the analyzed beams
Studied
Parameter Designation
Load
Ratio
(%)
Y/H
ratio
Axial
Restraint
k (kN/mm)
Fire resistance based on failure
criteria (minutes)
Strength Deflection Rate of
deflection
Section Type
RC Beam 50 0 0 80 NF NF Insulated RC beam
50 0 0 190 190 NF
FRP-RC beam (bond degradation)
50 0 0 190 190 NF
FRP-RC beam (perfect bond)
50 0 0 230 NF NF
Load Ratio
FRP-RC beam 30 0 0 440 NF NF FRP-RC beam 40 0 0 345 NF NF FRP-RC beam 50 0 0 235 NF NF RC Beam 50 0 0 210 190 NF FRP-RC beam 60 0 0 190 NF NF FRP-RC beam 70 0 0 165 NF NF
Fire Scenario
ASTM E119 50 0 0 225 NF NF Hydrocarbon 50 0 0 180 NF NF Design Fire-I 50 0 0 165 NF NF Design Fire-II 50 0 0 NF NF NF Design Fire-III 50 0 0 NF NF NF
Axial Restraint
FRP-RC Beam 50 0.5 0 225 NF NF FRP-RC Beam 50 0.5 5 235 NF NF FRP-RC Beam 50 0.5 50 300 NF NF FRP-RC Beam 50 0.5 100 310 NF NF FRP-RC Beam 50 0.5 200 305 NF NF
Location of Axial
Restraint
FRP-RC Beam 50 0.3 200 140 NF NF FRP-RC Beam 50 0.4 200 185 NF NF FRP-RC Beam 50 0.5 200 280 NF NF FRP-RC Beam 50 0.6 200 480 NF NF FRP-RC Beam 50 0.7 200 600 NF NF
Aggregate Type
Siliceous 50 0 0 180 NF NF Carbonate 50 0 0 190 NF NF
Concrete Strength
'fc 40 MPa 50 0 0 190 NF NF
'fc 50 MPa 50 0 0 195 NF NF
'fc 60 MPa 50 0 0 200 NF NF

179
Table 6.3 (cont′d)
Thermal Conductivity
k =0.1 W/m-oK 50 0 0 190 NF NF k =0.2 W/m-oK 50 0 0 155 NF NF k =0.3 W/m-oK 50 0 0 135 NF NF k =0.4 W/m-oK 50 0 0 125 NF NF k =0.5 W/m-oK 50 0 0 115 NF NF k =0.8 W/m-oK 50 0 0 105 NF NF k =1.0 W/m-oK 50 0 0 100 NF NF k =2.0 W/m-oK 50 0 0 95 NF NF k =3.0 W/m-oK 50 0 0 90 NF NF k =4.0 W/m-oK 50 0 0 90 NF NF
Insulation depth
H = 0 mm 50 0 0 80 NF NF H = 20 mm 50 0 0 140 NF NF H = 50 mm 50 0 0 160 NF NF H = 100 mm 50 0 0 185 NF NF H = 200 mm 50 0 0 265 NF NF
6.3 Results from Parametric Studies
Results from the parametric studies are presented in Table 6.3 and 6.5 and Figures 6.3
through 6.20 where progression of deflection with time is plotted. The effect of the studied
parameters on structural response of FRP-strengthened RC beam (time-deflection curves) is
included in the discussion. The thermal response of the beam (rebar and concrete temperatures)
is not presented here explicitly except for the parameter of fire scenario because many of these
parameters such as load ratio, axial restraint do not influence the thermal response of the
analyzed beams especially when the FRP-strengthened beam is provided with insulation. The
effect of each of the parameters on the fire response of the beam is discussed below.
6.3.1 Effect of FRP Strengthening
The effect of different section types on fire response can be gauged from Figure 6.3 that
shows a comparison of deflection-time response for two cases of FRP-strengthened RC beams,
namely; with a perfect bond, with temperature induced bond-slip, and two cases of un-
strengthened RC beams, namely with and without externally applied fire protection. For

180
comparison purposes, all beams were analyzed under similar load level. In early stages of fire
exposure, the response of both strengthened beams (with and without accounting for bond
degradation) is stiffer as compared to un-strengthened RC beam due to high strength and
stiffness properties provided by FRP composite. For the un-strengthened RC beam, the rate of
deflection is much higher since mechanical properties of concrete and steel degrade faster in the
absence of any external fire protection. For strengthened beam with a perfect bond, the response
of the beam is stiffer for entire duration of fire exposure as compared to the FRP-RC beam that
accounts for bond degradation. This is because overall behavior of the beam (deflection)
primarily depends on high temperature properties of FRP (degrades beyond 300-400oC) and
strength and stiffness properties of FRP are not much affected since insulation works efficiently
in keeping FRP temperatures sufficiently low. This results in relatively low deflections in FRP-
RC beam with a perfect bond.
For the case of FRP-strengthened beam, where slip is accounted for in the analysis, it can be
noticed from Figure 6.3 that debonding of FRP occurred at around 40 minutes. This can be
attributed to the loss of bond when the temperature reaches glass transition temperature of the
adhesive ( oof adhesive is 81 CgT ). However, rate of increase in deflection in this FRP-
strengthened RC beam and un-strengthened insulated RC beam is much slower than that in RC
beam (no insulation) which is mainly due to beneficial effect of insulation that slows the
temperature rise in steel reinforcement leading to a slower stiffness degradation. For initial 20-30
minutes of fire exposure, the behavior of un-strengthened insulated RC beam is similar to that of
RC beam with no external fire protection. This is because in absence of any strengthening in
these beams, flexural steel reinforcement that mainly contribute to moment capacity, maintains
its full strength due to slower rebar temperature increase resulting from effective protection

181
provided by the concrete cover. In later stages with increasing temperatures, fire insulation
continues to protect the un-strengthened insulated RC beam, while non-insulated RC beam loses
much of its strength and stiffness in the absence of externally applied fire protection. This leads
to rapid increase in deflections in un-insulated RC beam, as shown in Figure 6.3. This behavior
concludes that in absence of any fire protection, FRP will debond in first 5-6 minutes of fire
exposure (Gamage et al. 2006) and thereafter, the beam will fail in strength (before reaching
critical temperature limit state) due to higher load ratio (compared to capacity of RC beam). In
RC beam (loaded with 50% load ratio), critical temperature (593oC) in steel rebar mostly
governs the failure criteria (Kodur and Ahmed 2010). It can also be noticed that after FRP fully
debonds, the deflections in FRP-strengthened RC beam and insulated un-strengthened RC beam
closely match. This is because, after debonding, FRP does not contribute towards capacity of the
beam and the steel rebars are the one that carry tensile forces. Thus, FRP-strengthened RC beam
behaves similar to un-strengthened insulated RC beam. This comparison highlights the
importance of fire protection system for fire endurance of FRP-strengthened RC beams.
Figure 6.3: Effect of FRP strengthening on fire response of RC beams
-450
-400
-350
-300
-250
-200
-150
-100
-50
0
0 60 120 180 240
Def
lect
ion
(mm
)
Time (minutes)
FRP-RC beam (No slip)
FRP-RC beam (Slip)
Unstrengthened RC Beam
Loss of
composite action

182
6.3.2 Effect of Fire Scenario
To study the effect of fire scenario on fire resistance, FRP-strengthened RC was analyzed
under five different fire exposures. Figure 6.4 shows the time-temperature curve of two standard
(ASTM E119 and ASTM E1525 (hydrocarbon)) and three design (realistic) fire scenarios
namely; Fire I, Fire II and Fire III. There is no decay phase in the time temperature curves of the
standard fire scenario. However, the design fires takes into account compartment characteristic
such as fuel load, lining material and ventilation and therefore, have a well-defined decay phase.
Three design fires, taken from Eurocode 1 (2002), are selected to represent wide range of
compartment characteristics including fuel load and ventilation. Design fires are assumed to
occur in a room with dimensions of 8×4×3 m and other assumed properties are tabulated in
Table 6.4. Design Fire I represents severe fire in a library or a storage area with sufficient
ventilation and large amount of combustible material. The peak temperature of about 1250oC is
attained in about 150 minutes, while the decay phase lasts for about 200 minutes representing
slow burn out fire. Design Fire II is also a sever fire, however, it burns out quickly compared to
Fire I. Design Fire III represents a typical fire in a residential compartment.
Table 6.4: Properties used for design fires
Fire Scenario
Lining material
Thermal Capacity of lining material
0.5 2( / )oW m Ks
Ventilation
Factor ( )m
Fuel Load
(MJ/m2 of
floor area)
Fire I Gypsum
board 488 0.02 1600
Fire II Gypsum
board 488 0.02 1200
Fire III Concrete 1900 0.02 1600

183
The variation of temperature at corner rebar and at the interface of FRP-concrete is plotted
in Figures 6.4 and 6.5. As expected in the first 120 minutes, temperatures in rebar and at
interface of FRP-concrete increases for standard, as well as design fire exposure. The rate of
increase in temperature is high for Hydrocarbon, and Fire I and II exposures since there is steep
increase in fire temperature at early stages of fire exposure. However, for all design fires, the
temperature starts to decrease after attaining the peak temperature. This can be attributed to
presence of decay phase in design fires wherein fire temperature starts to cool down. It can also
be noticed in Figure 6.4 that critical (failure) temperature in rebars (593oC) is not attained under
design Fire I and II inspite of fire temperatures exceed 1200oC. This can be attributed to low
thermal conductivity of the insulation that keeps the temperatures low till fire temperatures starts
to cool down in the decay phase.
Figure 6.4: Variation of rebar temperature as a function of fire exposure time in FRP-strengthened RC beam
0
100
200
300
400
500
600
700
0 100 200 300 400
Tem
pera
ture
(o C
)
Time (minutes)
ASTM E119HydrocarbonDesign Fire IDesign Fire IIDesign Fire III

184
Figure 6.5: Variation of temperature at FRP-concrete interface as a function of fire exposure time
Figure 6.6 compares deflections of FRP-RC beam under five fire scenarios. Under
Hydrocarbon and Fire I and II scenarios, the cross sectional temperature increases faster in early
stages of fire exposure and thus leads to relatively large deflections resulting from high thermal
strains. The deflections under Fire II exposure starts to decrease in later stages which can be
attributed to strength and stiffness recovery in concrete and rebars during cooling phase of fire.
Under design Fire I, deflection increase is considerable after 120 minutes into the fire. This can
be attributed to high temperature creep strains. During decay phase under design Fire I, recovery
in strength and deflection is not noticed since the beam fails under strength limit state.
0
50
100
150
200
250
300
350
400
450
500
0 50 100 150 200 250
Tem
pera
ture
(o C
)
Time (minutes)
ASTM E119HydrocarbonDesign Fire IDesign Fire IIDesign Fire III
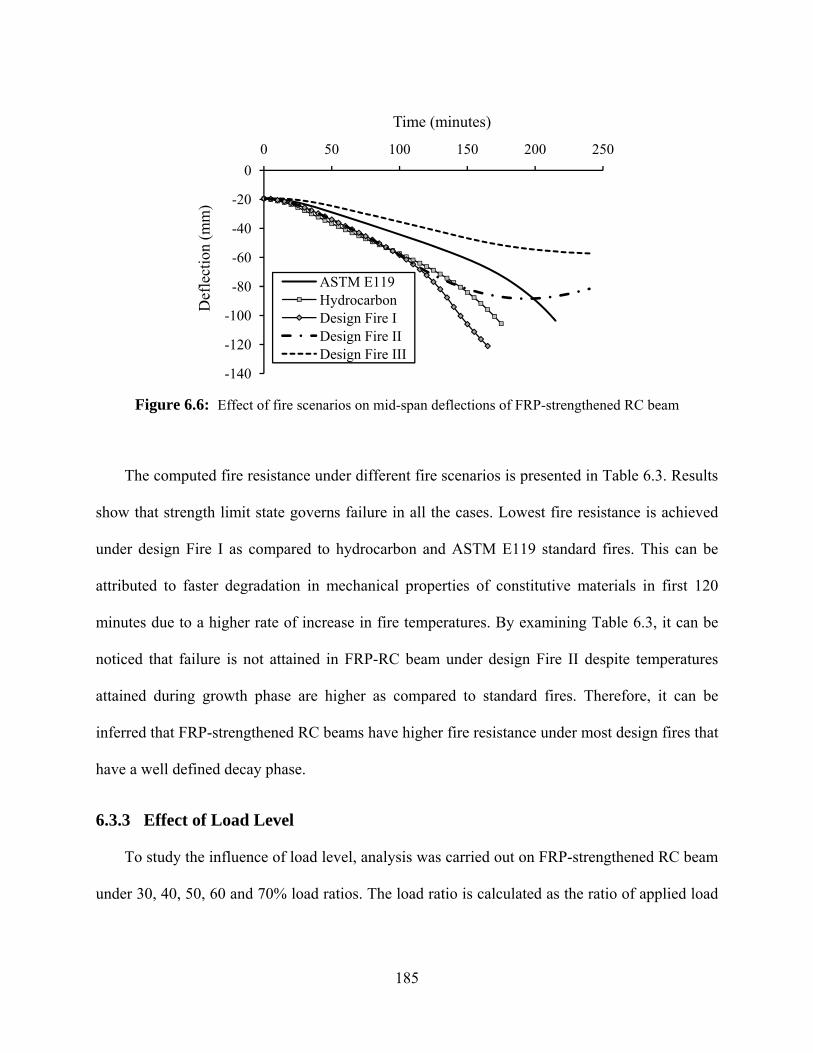
185
Figure 6.6: Effect of fire scenarios on mid-span deflections of FRP-strengthened RC beam
The computed fire resistance under different fire scenarios is presented in Table 6.3. Results
show that strength limit state governs failure in all the cases. Lowest fire resistance is achieved
under design Fire I as compared to hydrocarbon and ASTM E119 standard fires. This can be
attributed to faster degradation in mechanical properties of constitutive materials in first 120
minutes due to a higher rate of increase in fire temperatures. By examining Table 6.3, it can be
noticed that failure is not attained in FRP-RC beam under design Fire II despite temperatures
attained during growth phase are higher as compared to standard fires. Therefore, it can be
inferred that FRP-strengthened RC beams have higher fire resistance under most design fires that
have a well defined decay phase.
6.3.3 Effect of Load Level
To study the influence of load level, analysis was carried out on FRP-strengthened RC beam
under 30, 40, 50, 60 and 70% load ratios. The load ratio is calculated as the ratio of applied load
-140
-120
-100
-80
-60
-40
-20
0
0 50 100 150 200 250
Def
lect
ion
(mm
)
Time (minutes)
ASTM E119HydrocarbonDesign Fire IDesign Fire IIDesign Fire III

186
present under fire condition to the room temperature nominal capacity of the beam. The effect of
load ratio on the fire response of FRP-RC beam is illustrated in Figures 6.7 and Table 6.3.
Results from the analysis show that load ratio does not affect failure evaluated based on
limiting temperature (593oC) since rebar properties are independent of applied loading.
However, load ratio significantly influences fire resistance of FRP-strengthened RC beam
computed based on strength criteria. It can be seen from results listed in Table 6.3 that the fire
resistance decreases with increasing load ratio. This is mainly due to the fact that at higher loads,
the strength and stiffness properties of constitutive materials degrade significantly with
temperature and beam will experience higher stresses and moments leading to early strength
failure. The results from analysis also shows that the beam with higher load ratios (more than
50%) experience lower deflections just prior to failure (refer Figure 6.7). This can be attributed
to external insulation that keep the temperature relatively cool at the bottom face of the beam that
introduces reverse thermal gradient leading to lower thermal and creep strains in steel
reinforcement. After FRP ruptures at ultimate strain value, the beam behaves as RC beam that
has higher load levels as compared to capacity of RC beam. This leads to an early strength
failure before deflections are pronounced at later stages of fire due to increased ductility as
shown in Figure 6.7.
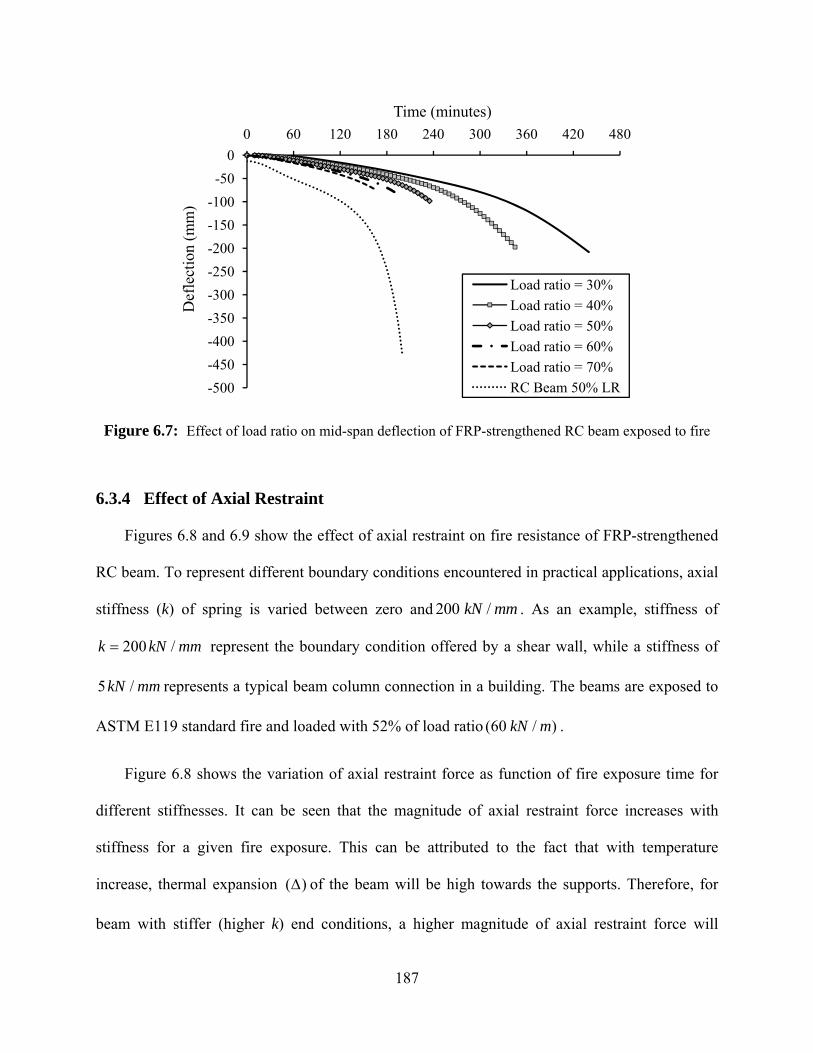
187
Figure 6.7: Effect of load ratio on mid-span deflection of FRP-strengthened RC beam exposed to fire
6.3.4 Effect of Axial Restraint
Figures 6.8 and 6.9 show the effect of axial restraint on fire resistance of FRP-strengthened
RC beam. To represent different boundary conditions encountered in practical applications, axial
stiffness (k) of spring is varied between zero and 200 /kN mm . As an example, stiffness of
200 /k kN mm represent the boundary condition offered by a shear wall, while a stiffness of
5 /kN mm represents a typical beam column connection in a building. The beams are exposed to
ASTM E119 standard fire and loaded with 52% of load ratio (60 / )kN m .
Figure 6.8 shows the variation of axial restraint force as function of fire exposure time for
different stiffnesses. It can be seen that the magnitude of axial restraint force increases with
stiffness for a given fire exposure. This can be attributed to the fact that with temperature
increase, thermal expansion ( ) of the beam will be high towards the supports. Therefore, for
beam with stiffer (higher k) end conditions, a higher magnitude of axial restraint force will
-500
-450
-400
-350
-300
-250
-200
-150
-100
-50
0
0 60 120 180 240 300 360 420 480
Def
lect
ion
(mm
)
Time (minutes)
Load ratio = 30%
Load ratio = 40%
Load ratio = 50%
Load ratio = 60%
Load ratio = 70%
RC Beam 50% LR

188
develop. The location of axial restraint force is generally below the geometric centeroid (neural
axis) of the beams (Dwaikat and Kodur 2008). Thus, axial force developed at the support
introduces an arch action in the beam that helps in resisting the applied loading and reduces mid-
span deflection. Axially restraint FRP-strengthened RC beam with stiffness of 50 /kN mm
experiences a 75 minutes increase in fire resistance as compared to a simply supported beam.
This increase in fire resistance can be attributed to arch action developed in the beam due to
restraint effect at the supports.
Figure 6.9 shows the variation of deflection with axial stiffness as a function of fire
exposure time. FRP-strengthened RC beam behaves stiffer (less deflections) as compared to un-
strengthened beam due to high strength and stiffness properties of CFRP. Moreover, results
indicate that at early stages of fire exposure, the deflection in axially restrained FRP-
strengthened beam is less as compared to an un-restrained beam. This is due to arch action
generated in the beam as a result of fire induced restraint force. However, for beams with higher
stiffness, large deflections are observed prior the failure. This can be attributed to P effect
that creates an additional moment at the critical section of the beam thereby increasing
deflections.

189
Figure 6.8: Fire induced axial restraint force as a function of time in an FRP-strengthened RC beam
Figure 6.9: Effect of axial restraint on mid-span deflection of FRP-strengthened RC exposed to fire
0
500
1000
1500
2000
2500
0 50 100 150 200 250 300 350
Axi
al F
orce
(kN
)
Time (minutes)
1 - SS(k = 5kN/mm)
2 - SS(k = 50kN/mm)
3 - SS(k = 100 kN/mm)
4 - SS (k = 200 kN/mm)
-200
-160
-120
-80
-40
0
0 50 100 150 200 250 300 350
Def
lect
ion
(mm
)
Time (minutes)
1 - SS (k = 0)
2 - SS (k = 5 kN/mm)
3 - SS (k = 50 kN/mm)
4 - SS (k = 100 kN/mm)
5 - SS ( k = 200 kN/mm)

190
6.3.5 Effect of Location of Axial Restraint
The effect of location of axial restraint location is illustrated in Figure 6.10. For this study,
the value of spring constant is assumed to be 200 /kN mm , and fire induced bond degradation is
accounted for. Five positions of axial restraint (Y/H), namely; 0.3, 0.4, 0.5, 0.6, and 0.7 were
used in the analysis. The definition of Y and H is illustrated in Figure 6.10. The bond-slip is
accounted for this analysis and beam is exposed to ASTM E119 standard fire.
Figure 6.10 show variation of deflection for FRP-RC beam for different axial restraint
locations. The analysis results show that location of axial restraint has significant influence on
response of FRP-strengthened RC beams. The deflection of the beam reduces by shifting the
location of axial restraint downward (increasing Y/H). For Y/H ratio greater than 0.5, it can be
seen the beam deflections are considerably lower at any stage of fire exposure. This is because of
arch action developed in the beam that contributes in resisting applied loading and its effect is
more pronounced when the location is shifted downward. For the values of Y/H ratio equal to 0.5
and lower, the FRP-RC beam experience maximum deflections and time to failure. This is
attributed to P effect as a result of axial restraint force. At early stages of fire exposure, fire
induced axial force (P) and the beam deflections re small, therefore, the effect of P is small.
However, at later stages, this increasing axial restraint force induces secondary moments in the
beam that causes flexural buckling. Thus, for Y/H < 0.5, the development of axial force is not
beneficial for FRP-RC beam.
The variation of fire induced axial restraint force with its location (Y/H) is shown in Figure
6.11. It can be seen that with increasing Y/H ratio, magnitude of axial restraint increases and is
maximum for Y/H = 0.6. This is because for lower Y/H ratios (less than 0.5), time to failure of
the beam is minimum that result in lower axial restraint force. While for higher Y/H ratios

191
(greater than 0.5) the response of the beam is predominantly controlled by arch action that
reduces the deflection and increase time to failure. Thus, larger axial restraining force is
developed. Figure 6.11 shows that axial force starts to reduce after reaching maximum value for
Y/H = 0.7. This can be attributed to increase in beam deflections due to degradation of strength
and stiffness properties at later stages of fire exposure.
Figure 6.10: Effect of location of axial restraint force on mid-span deflection of FRP-
strengthened RC beam exposed to fire
-260
-210
-160
-110
-60
-10
0 200 400 600 800
Def
lect
ion
(mm
)
Time (minutes)
Y/H=0.3
Y/H=0.4
Y/H=0.5
Y/H=0.6
Y/H=0.7

192
Figure 6.11: Effect of axial restraint force location on axial force development
6.3.6 Effect of Concrete Strength
Figure 6.12 shows the effect of compressive strength of concrete '( )cf on fire resistance of
FRP-strengthened RC beams. Three different strengths of concrete '( 30, 40 and 50 MPa)cf
were analyzed and results are plotted in Figure 6.12. It can be seen that concrete strength does
not influence fire response of FRP-strengthened RC beam. In general, it is accepted that a dense
concrete with low permeability is produced by increasing concrete strength. However, insulation
plays a vital role in influencing overall response of such beams. The insulation limits increase in
temperature in the beam cross section including in flexural reinforcement. Therefore, no fire
induced spalling occurs in concrete and this has been verified in fire tests presented in Chapter 3.
Secondly, after FRP debonds, flexural steel reinforcement mainly contributes in moment
capacity of the beam. Thus, in presence of externally applied fire protection, rebars maintain
much of its room temperature strength due to low increase in temperature. Moreover,
0
500
1000
1500
2000
2500
0 200 400 600 800
Axi
al F
orce
(kN
)
Time (minutes)
Y/H=0.3
Y/H=0.4
Y/H=0.5
Y/H=0.6
Y/H=0.7
K(spring)=200 kN/mm

193
temperature in tension rebars is not significantly influenced by concrete strength. Under fire
conditions, reduction in moment capacity and increase is deflection of the beam is mainly
attributed to strength degradation of rebars which is directly related to rebar temperature.
Therefore, effect of concrete strength on fire resistance of FRP-strengthened and an insulated
beam is minor.
Figure 6.12: Effect of compressive strength of concrete on mid-span deflection of FRP-strengthened RC beam exposed to fire
6.3.7 Effect of Concrete Aggregate
Two types of concrete aggregate are considered in this parametric study, namely; carbonate
and siliceous. In literature, previous studies have shown that the type of aggregate in concrete
influences the high temperature concrete properties and thus the fire resistance of FRP-RC
members. Figure 6.13 illustrates that the beam with carbonate aggregate concrete attains lower
deflection at a given time as compared to siliceous aggregate. This is mainly because of high
thermal capacity and low thermal conductivity of carbonate aggregate that result in lower rise in
-350
-300
-250
-200
-150
-100
-50
0
0 50 100 150 200 250
defl
ecti
on (
mm
)
Time (minutes)
fc = 40 MPa
fc = 50 MPa
fc = 60 MPa
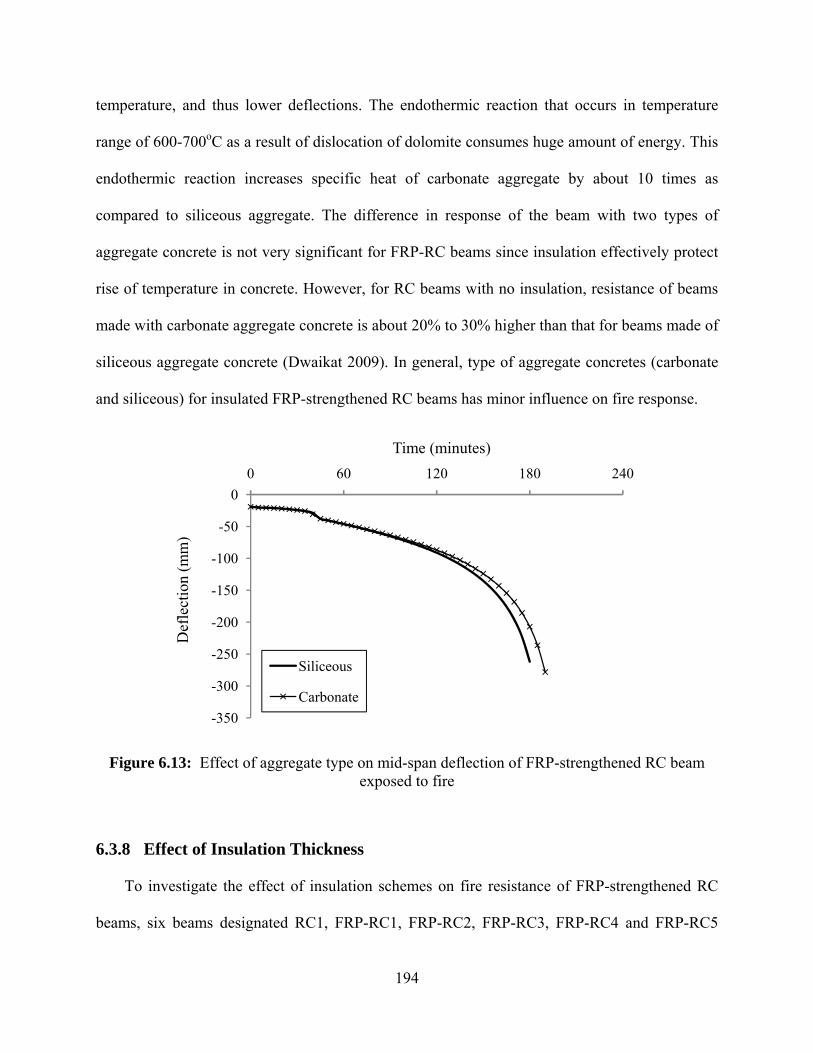
194
temperature, and thus lower deflections. The endothermic reaction that occurs in temperature
range of 600-700oC as a result of dislocation of dolomite consumes huge amount of energy. This
endothermic reaction increases specific heat of carbonate aggregate by about 10 times as
compared to siliceous aggregate. The difference in response of the beam with two types of
aggregate concrete is not very significant for FRP-RC beams since insulation effectively protect
rise of temperature in concrete. However, for RC beams with no insulation, resistance of beams
made with carbonate aggregate concrete is about 20% to 30% higher than that for beams made of
siliceous aggregate concrete (Dwaikat 2009). In general, type of aggregate concretes (carbonate
and siliceous) for insulated FRP-strengthened RC beams has minor influence on fire response.
Figure 6.13: Effect of aggregate type on mid-span deflection of FRP-strengthened RC beam exposed to fire
6.3.8 Effect of Insulation Thickness
To investigate the effect of insulation schemes on fire resistance of FRP-strengthened RC
beams, six beams designated RC1, FRP-RC1, FRP-RC2, FRP-RC3, FRP-RC4 and FRP-RC5
-350
-300
-250
-200
-150
-100
-50
0
0 60 120 180 240
Def
lect
ion
(mm
)
Time (minutes)
Siliceous
Carbonate

195
have been analyzed. The dimensions and material properties of all the beams are similar (Table
6.4). Beam RC1 is un-strengthened RC beam, Beam FRP-RC1 is FRP- strengthened RC beam
with no insulation applied, while the remaining four beams have been strengthened with FRP
and provided with supplement insulation of varying thicknesses and configuration schemes. On
the sides of the beam, the insulation thickness (20 mm) and application depth (105 mm) is kept
consistent. However, insulation thickness at the beam soffit has been varied to be 15, 25, 40, and
50 mm for beams FRP-RC2, FRP-RC3, FRP-RC4 and FRP-RC5, respectively. The analysis was
carried out by exposing the beams to the standard ASTM E119 fire from three sides with applied
load ratio of 52%.
Results presented in Table 6.4 can be used to gauge the influence of insulation thickness on
the fire resistance of beams. The failure of the beam is computed based on strength, rebar critical
temperature and deflection limit states. No failure occurred in any of the insulated FRP-
strengthened beams under deflection or rate of deflection limit states. Previous experimental
studies and test results presented in Chapter 3, illustrated that reaching glass transition
temperature of FRP does not indicate failure of FRP-strengthened RC beams. Therefore, failure
based on this failure criterion has not been included in the Table 6.4. However, provision of
insulation is a requirement for externally bonded FRP systems to protect FRP from direct fire
exposure since it is highly combustible material. Externally bonded FRP strengthening is bond
critical application and its effectiveness depend on the glass transition temperature of the
adhesive. Figure 6.14 shows effect of insulation thickness on time to reach glass transition
temperature of the adhesive. As expected, time to reach gT decreases with increasing insulation
thickness. An increase in insulation thickness from 15 to 40 mm enhances time to reach gT by
about 70 minutes. This can be attributed to the low thermal conductivity of the fire insulation
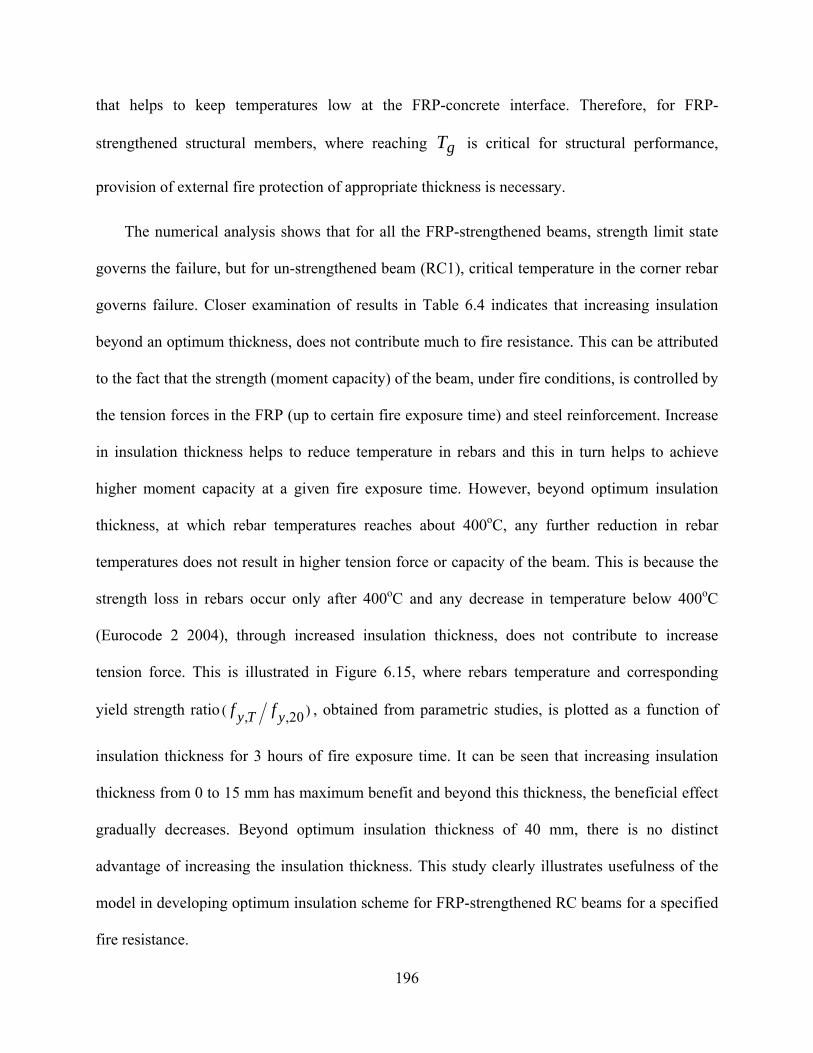
196
that helps to keep temperatures low at the FRP-concrete interface. Therefore, for FRP-
strengthened structural members, where reaching gT is critical for structural performance,
provision of external fire protection of appropriate thickness is necessary.
The numerical analysis shows that for all the FRP-strengthened beams, strength limit state
governs the failure, but for un-strengthened beam (RC1), critical temperature in the corner rebar
governs failure. Closer examination of results in Table 6.4 indicates that increasing insulation
beyond an optimum thickness, does not contribute much to fire resistance. This can be attributed
to the fact that the strength (moment capacity) of the beam, under fire conditions, is controlled by
the tension forces in the FRP (up to certain fire exposure time) and steel reinforcement. Increase
in insulation thickness helps to reduce temperature in rebars and this in turn helps to achieve
higher moment capacity at a given fire exposure time. However, beyond optimum insulation
thickness, at which rebar temperatures reaches about 400oC, any further reduction in rebar
temperatures does not result in higher tension force or capacity of the beam. This is because the
strength loss in rebars occur only after 400oC and any decrease in temperature below 400oC
(Eurocode 2 2004), through increased insulation thickness, does not contribute to increase
tension force. This is illustrated in Figure 6.15, where rebars temperature and corresponding
yield strength ratio ( ), ,20y T yf f , obtained from parametric studies, is plotted as a function of
insulation thickness for 3 hours of fire exposure time. It can be seen that increasing insulation
thickness from 0 to 15 mm has maximum benefit and beyond this thickness, the beneficial effect
gradually decreases. Beyond optimum insulation thickness of 40 mm, there is no distinct
advantage of increasing the insulation thickness. This study clearly illustrates usefulness of the
model in developing optimum insulation scheme for FRP-strengthened RC beams for a specified
fire resistance.

197
Table 6.5: Effect of insulation thickness on fire resistance of FRP-strengthened RC beams
* RC beam , ** No failure, # FRP-strengthened RC beam with no insulation
Figure 6.14: Effect of insulation thickness on time to reach gT
0
50
100
150
200
250
300
350
400
0 20 40 60 80 100 120 140 160 180
Tem
per
atu
re a
t F
RP
-con
cret
e In
terf
ace
(o C)
Time (minutes)
15 mm25 mm40 mm50 mm
Tg
Beam designation
Insulation thickness (mm)
Fire resistance based on failure criteria (minutes)
Beam soffit
Side face Rebar temp
Strength Deflection
RC1* 0 0 155 200 180
FRP-RC1# 0 0 155 80 **
FRP-RC2 15 20 295 205 **
FRP-RC3 25 20 330 235 **
FRP-RC4 40 20 355 280 **
FRP-RC5 50 20 370 300 **

198
Figure 6.15: Corner rebar temperature and yield strength ratio as a function of insulation thickness for 3-hour of fire exposure time
6.3.9 Effect of Insulation Configuration
For externally bonded FRP-strengthened RC beams, supplemental fire protection system is
necessary to achieve desired fire resistance. The parametric study results presented in Section
6.3.8 showed that an optimum insulation thickness is required to achieve required fire resistance.
The study was extended to quantify the effect of geometric configuration of insulation on fire
performance of FRP-RC beam. For this study, the thickness of insulation is kept constant (20
mm), while insulation depth "H" (refer to Figure 6.16) has been varied. The bond degradation is
accounted for in this analysis and beam is exposed to standard fire exposure from three sides.
Figure 6.16 shows the effect of insulation depth "H" on mid-span deflection of the beam as a
function of fire exposure time. It can be seen that the beam strengthened with FRP without
providing any fire protection experience large deflections and fails in 80 minutes. This is because
in absence of any insulation, FRP is lost in first 5-10 minutes and strength and stiffness
degradation in steel reinforcement and concrete is at a faster rate. Examining the Figure 6.16, it
0
0.2
0.4
0.6
0.8
1
1.2
0
100
200
300
400
500
600
700
0 10 20 30 40 50 60
Yie
ld s
tren
gth
rati
o (f
y,T
/ fy,
20)
Reb
ar te
mpe
ratu
re (
o C)
Insulation thickness (mm)
Rebar Temp.
Yield Strength Ratio

199
can also be seen that the time to reach debonding of FRP is independent of insulation depth
provided on the two side of the beam cross section since it depends on insulation thickness
provided at beam soffit which is assumed to be constant for this study. Results indicate that
increasing insulation depth improves fire resistance of FRP-strengthened RC beam. This is
mainly attributed to the low thermal conductivity of insulation that helps to limit rise of
temperature in beam cross section. Increasing insulation depth from 20 mm to 200 mm (100%)
enhances the fire resistance by about 120 minutes. This indicates that by increasing the insulation
depth, the degradation of strength and stiffness properties is slower and this enhances the fire
resistance of FRP-strengthened RC beams. Figure 6.16 also shows that before and after
debonding of FRP occurs, the response of the beam with insulation depth of H=200 mm is stiffer
as compared to the case of H= 20 mm. The more ductile behavior of FRP-strengthened RC beam
with smaller insulation depth of H=20 mm is attributes to rapid loss of strength and stiffness of
the beam due to more exposed surface area. After debonding, tension rebars mainly contribute in
moment capacity of the beam. Due to low insulation depth, its contribution is not very effective
to limit increase of temperature in rebars and this result in rapid reduction in strength and
stiffness properties leading to more deflections in the beam. Therefore, insulation configurations
significantly affect fire resistance of FRP-strengthened RC beams.

200
Figure 6.16: Effect of insulation depth on beam sides on fire response of FRP-strengthened RC beam exposed to fire
6.3.10 Effect of Insulation Thermal Conductivity
Thermal conductivity of insulation has significant influence on temperature distribution in
beam cross section. Typically, thermal conductivity of insulation varies with temperature.
However, for this parametric study it is assumed to be constant with temperature for each case
study. Currently, data on variation of thermal conductivity with temperature is proprietary in
nature and mostly is not provided by the manufacturers. Therefore, it is essential to study
influence of this parameter on fire performance of FRP-strengthened and insulated beams.
Thermal conductivity of VG insulation (Tyfo® WR AFP system) 0.12 W/m-oK is taken as a
reference and correspondingly, its value is increased up to a maximum of 4 W/m-oK. For
analysis, the beam is externally applied with 25 mm of insulation, the effect of bond degradation
is accounted for and the beam is exposed to standard fire from three sides.
-400
-350
-300
-250
-200
-150
-100
-50
0
0 60 120 180 240 300
Def
lect
ion
(mm
)
Time (minutes)
H=0mm H=20mmH=50mm H=100mmH=150mm H=200mmStrengthened w/o Insul
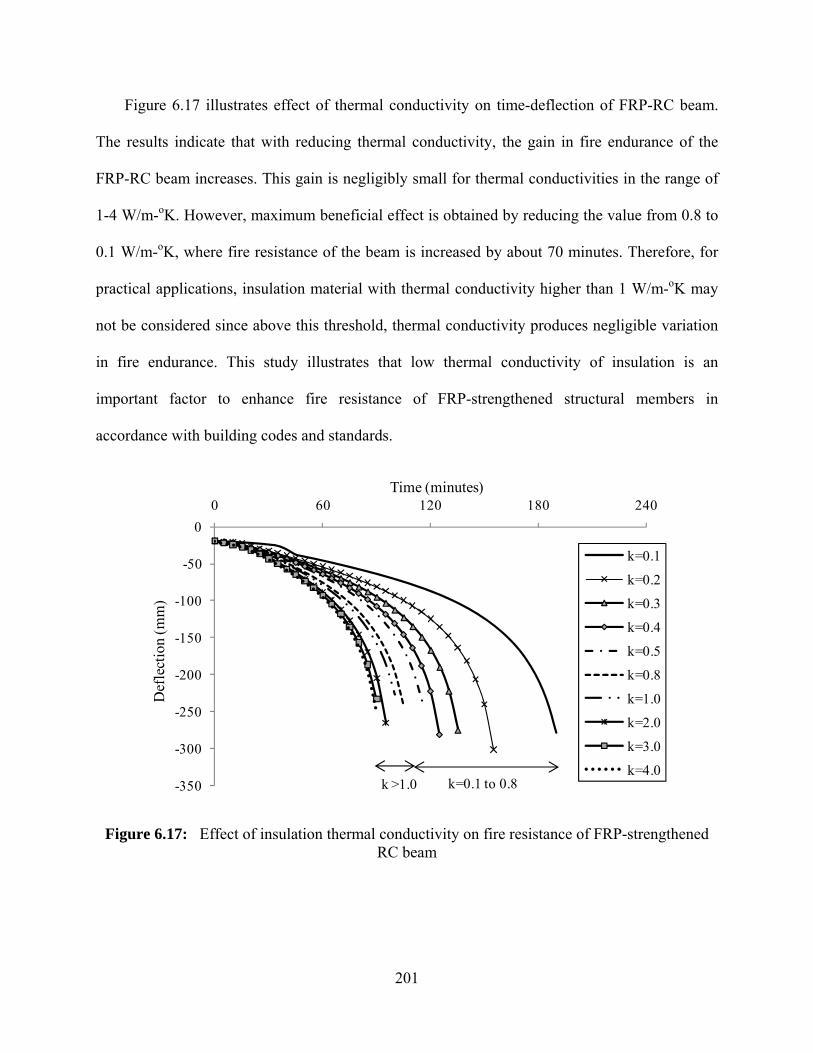
201
Figure 6.17 illustrates effect of thermal conductivity on time-deflection of FRP-RC beam.
The results indicate that with reducing thermal conductivity, the gain in fire endurance of the
FRP-RC beam increases. This gain is negligibly small for thermal conductivities in the range of
1-4 W/m-oK. However, maximum beneficial effect is obtained by reducing the value from 0.8 to
0.1 W/m-oK, where fire resistance of the beam is increased by about 70 minutes. Therefore, for
practical applications, insulation material with thermal conductivity higher than 1 W/m-oK may
not be considered since above this threshold, thermal conductivity produces negligible variation
in fire endurance. This study illustrates that low thermal conductivity of insulation is an
important factor to enhance fire resistance of FRP-strengthened structural members in
accordance with building codes and standards.
Figure 6.17: Effect of insulation thermal conductivity on fire resistance of FRP-strengthened RC beam
-350
-300
-250
-200
-150
-100
-50
0
0 60 120 180 240
Def
lect
ion
(mm
)
Time (minutes)
k=0.1
k=0.2
k=0.3
k=0.4
k=0.5
k=0.8
k=1.0
k=2.0
k=3.0
k=4.0k=0.1 to 0.8k >1.0

202
6.3.11 Effect of Bond Degradation
To illustrate the effect of bond-slip at FRP-concrete interface, the beam was analyzed under
three scenarios, namely un-strengthened (RC beam), FRP-strengthened RC beam assuming a
perfect bond and bond degradation. The beam was strengthened with CFRP which is bonded to
concrete substrate using 2 mm thickness of adhesive layer. The beam was analyzed under ASTM
E119 standard fire exposure with applied load of 60 KN/m (load ratio=0.52).
Figure 6.18 shows comparison of deflections for three different cases as function of fire
exposure time. Results indicate a stiff response (lower deflections) for CFRP strengthened beam
as compared to un-strengthened beam and this can be attributed to high strength and stiffness
properties of CFRP. For the beam with perfect bond, FRP contributes to moment capacity till its
strength degrades with temperature and its effect diminishes beyond certain temperature range.
Results from analysis of the strengthened beam showed that debonding of FRP occurred in 40
minutes. This can be attributed to degradation of mechanical properties of adhesive close to glass
transition temperature ( 81 )ogT C . Figure 6.19 shows that at FRP-concrete interface, bond-slip
occurs after about 20 minutes of fire exposure and then increases exponentially beyond 35
minutes indicating debonding of FRP. Also, it can be seen that after FRP debonds, the
deflections are not high as compared to RC beam. This can be attributed to presence of insulation
that keeps the temperatures low in rebars thereby delaying the loss of strength and stiffness
properties. For the RC beam with no insulation, the rate of deflection is higher due to faster
degradation in mechanical properties of concrete and steel with rise in temperature.

203
Figure 6.18: Fire induced mid-span deflection in RC beam under different bond configurations
Figure 6.19: Bond-slip at FRP concrete interface as a function of fire exposure time
6.3.12 Effect of Adhesive Thickness on Bond Degradation
To study the effect of adhesive thickness on temperature induced debonding of FRP, an
FRP-strengthened RC beam was analyzed for varying thickness of adhesive from 1 to 4 mm.
-300
-250
-200
-150
-100
-50
0
0 50 100 150 200 250
Def
lect
ion
(mm
)
Time (minutes)
No Slip
Slip
RC Beam
Loss of composite action
0.0E+00
5.0E-04
1.0E-03
1.5E-03
2.0E-03
2.5E-03
3.0E-03
3.5E-03
4.0E-03
0 10 20 30 40 50
Sli
p (m
m/m
m)
Time (minutes)

204
Figure 6.20 shows the deflection-time curves for the four cases of insulation thicknesses and for
the case of fully bonded FRP beam. Results from the analysis indicate that up to first 20 minutes
of fire exposure, there is no noticeable effect of adhesive thickness on time-deflection response.
Beyond 20 minutes when debonding starts to occur, insulation thickness has minor influence on
the deflections. For an increased adhesive thickness, bond-slip starts to occur in an earlier fire
exposure time and as a consequence, the beam deforms slightly more. However, irrespective of
adhesive thickness, beam experiences similar deflection after debonding of FRP. Therefore,
adhesive layer thickness does not have significant effect on bond degradation and fire resistance
of FRP-strengthened RC beam.
Figure 6.20: Effect of adhesive thickness on slip at FRP-concrete interface as function of fire exposure time
-45
-35
-25
-15
0 10 20 30 40 50 60
Def
lect
ion
(mm
)
Time (minutes)
2 mm (perfect bond)
Bond-slip (1mm)
Bond-slip (2mm)
Bond-slip (3mm)
Bond-slip (4mm)

205
6.4 Critical Factors Influencing Fire Performance
The above parametric studies indicate that fire scenario, insulation scheme, anchorages,
bond degradation, axial restraint force and load level, have significant influence on the fire
response of FRP-strengthened RC beams. The concrete strength, aggregate type (carbonate and
siliceous), and adhesive thickness at FRP/concrete interface does not influence fire resistance
significantly. Based on the parameters studied, the critical factors that have to be considered in
fire design of FRP-strengthened RC beams are further discussed below.
Design Fire
In practical situations, when fire occurs there always exists a growth phase and a decay
(cooling) phase. These fires are generally referred to as design fires in codes and standards.
Under such fires, the fire performance of FRP-strengthened RC beams is generally better.
Results from parametric studies show that in the cooling phase of the design fire, the beam
recovers parts of its strength and stiffness in concrete and reinforcing steel and this enhances the
fire resistance of the beam. Hence, fire resistance values computed based on standard fire
scenario are conservative if the resulting fires have a decay phase. Therefore, type of fire
exposure plays an important role and should be taken into account in evaluating fire resistance of
FRP-strengthened RC beams.
Anchorages
For flexural strengthening of RC beams, FRP strengthening is often applied at the critical
(higher) moment zones. It is well established that for achieving desired fire resistance, FRP
reinforcement along the beam length is to be insulated. Results from both experimental and
parametric studies show that provision of adequate fire protection in the anchorage zones
(terminating ends of FRP) is critical in achieving good fire resistance in FRP-strengthened RC

206
beams. Such insulation schemes help to keep the temperature of FRP, particularly in anchorage
zones, relatively low. The lower temperatures in FRP fibers within anchorage zone help to
maintain the bond between FRP and concrete to be effective for longer duration. The
effectiveness of bond at anchorages ensures unbonded continuous fibers to act as cables and
facilitate in load transfer through cable mechanism. This cable mechanism helps the member to
carry the applied loads for longer duration. Therefore, ensuring adequate fire protection to the
anchorage zone is critical to enhance the fire resistance of the FRP-strengthened RC beams.
Insulation Schemes
Provision of supplemental fire insulation in FRP-strengthened RC beams not only protects
FRP, but also limits temperature rise in concrete and reinforcing steel. In externally bonded FRP
strengthened RC beams, fire resistance depends on the rate of bond degradation at FRP and
concrete interface with temperature. At certain stage, when bond (and FRP contribution) is lost,
concrete and steel reinforcement carry the applied moments. Hence, after debonding of FRP, the
overall fire response of the beam depends on the strength and stiffness properties of concrete and
steel reinforcement. An optimum fire protection scheme (both thickness and geometric
configuration) for the whole FRP-strengthened RC beam (that includes concrete, steel rebars and
FRP) is required for achieving good fire resistance rating.
Load Level
In evaluating fire resistance of FRP-strengthened RC beams, the strength failure criterion is
the one that often governs failure. Under this failure criterion, the load level influences the fire
resistance significantly. Since higher the load, lower will be the fire resistance. However, in
many fire tests, temperature limit in FRP or steel rebars is often used to determine the failure.
This is not a realistic failure limit state and using this failure criterion may not account for effect

207
of load level on fire resistance since the resulting temperatures in FRP or steel rebars are
independent of the applied loading. Higher load level cause an early softening and weakening of
the constitutive materials which already experience degradation in strength and stiffness
properties with increasing temperature. This results in higher stresses and moments and
ultimately leads to early strength failure. Therefore, strength limit state is to be applied to
evaluate fire resistance of FRP-strengthened RC beams.
Axial Restraint Force
Flexural members can experience considerable expansion when exposed to high
temperatures and when the beam is restrained from expanding, a significant axial restraint force
develops at the supports. The magnitude of fire induced axial restraint force and its location
influences the fire resistance of FRP-strengthened RC beams. This axial force introduces an arch
action in the beam that contributes to load carrying mechanism in later stages of fire exposure.
The fire response of FRP-strengthened RC beam improves when the axial restraint force is
located below the geometric centroid of the beam. By shifting the location towards top of the
beam significantly reduces the fire resistance due to development of secondary moments in the
beam which causes flexural buckling. Therefore, it is important to consider the stiffness of the
structural members surrounding the FRP-strengthened RC beam for realistic fire resistance
analysis.
Bond Strength
Results from fire tests and parametric studies show that in FRP-strengthened RC beams,
temperature induced bond deterioration degrade the fire response of the beam. The bond between
FRP and substrate concrete is lost when the temperature at the interface exceeds glass transition
208
temperature ( )gT of FRP since shear stresses in the adhesive (polymer resin) remain sufficiently
low above gT . It is often assumed that after debonding, the FRP does not contribute to the
moment capacity. However, an insulated FRP-strengthened RC beam exhibits better fire
performance (higher strength capacity with lower deflections) due to lower temperatures in
concrete and steel rebars. Therefore, the beam continues to resist applied service loads and
reaching gT cannot be taken as failure of the FRP-strengthened RC beam.
6.5 Design Guidelines
The research presented in this study clearly emphasis that there are a number of critical
factors apart from insulation, that influence the response of FRP-strengthened RC beams under
fire conditions. The current guidance for fire design of FRP-strengthened RC beams, which is
based on standard fire tests, specifies that fire insulation as a means to achieve desired fire
resistance. Provisions in current codes and standards recommend treating FRP to be ineffective
in the event of fire. There are very few specifications that take into consideration the critical
factors discussed above. Based on test results and parametric studies, the following guidelines
are recommended for enhancing fire response of FRP-strengthened RC beams.
6.5.1 Insulation Scheme
It is well established that an FRP-strengthened RC beam is to be provided with adequate
insulation to achieve code specified fire resisting ratings. However, there is lack of guidance with
respect to optimum insulation thickness and its geometric configuration to achieve desired fire
resistance.

209
Insulation Layout
In FRP-strengthened RC members, in addition to insulation thickness, the layout of
insulation should be an important consideration for achieving fire resistance. The insulation
helps to keep overall beam cross sectional temperatures (concrete steel rebars and FRP) low.
Therefore, proper detailing of insulation can help to keep the temperatures low not only in FRP
but also in tension steel reinforcement and assist in arriving at optimum insulation levels. An
optimum geometric insulation configuration can be developed to achieve good fire resistance in
FRP-strengthened RC beams.
The five insulation schemes that can be adopted for FRP-strengthened RC beam with
rectangular beam cross section are shown in Figure 6.21. It has been established that externally
bonded FRP without fire protection is not appropriate for FRP-strengthened RC beams (Gamage
et al. 2006). Therefore, FRP without supplemental insulation is not recommended (refer to
Figure 6.21(a)). The two insulation schemes shown in Figure 6.21(b) and (c) do not lead to
optimum protection since these insulation schemes do not help in keeping temperatures low in
bottom rebars for sufficient time to yield good fire resistance. From the parametric studies and
fire tests, it was found that extending the insulation to a depth of "2cc" from bottom of the beam
cross section (on either side) is required to achieve optimum fire resistance. Based on this results,
the two recommended insulation configurations are shown in Figure 6.21 (d) and (e). Both these
insulation configurations can provide effective fire protection to overall beam cross section.
However, the insulation scheme shown in Figure 6.21(d) is preferred option as compared to the
one shown in Figure 6.21(e) since applying insulation along complete exposed surfaces of the
beam cross section is not practical and is a very expensive proposition. Similar insulation
schemes can also be utilized for FRP-strengthened T-beams. Based on the results from

210
parametric studies conducted as part this research and test results on T-beams (Williams et al.
2006), the recommended insulation schemes for FRP-strengthened RC T-beams are shown in
Figure 6.22 (a) to (e).
FRP Insulation
(a) Not recommended
(b) Not recommended
(c) Not preferred (d) Recommended option
(e) Workable but can be expensive
Figure 6.21: Proposed geometric configuration schemes for fire insulation in FRP-strengthened RC beams
FRP Insulation
(a) Not recommended (b) Not recommended (c) Not preferred
(d) Recommended option (e) Workable but not optimum option
(e) Workable but not optimum option
Figure 6.22: Proposed geometric configuration for insulation in FRP-strengthened RC T-beams

211
Insulation thickness
Apart from the geometric configuration, insulation thickness is another key factor that
governs fire resistance of FRP-strengthened RC beams. The effectiveness of insulation on fire
resistance mainly depends on the thickness, specific heat and thermal conductivity properties of
fire insulation. The available fire insulation in the market has thermal conductivity in the range
of 0.12 to 0.5 W/m-oK. The fire resistance of FRP-strengthened RC beams increases with
insulation thickness. However, there is a certain level of thickness beyond which any further
increase in the thickness is not beneficial. This level of insulation thickness is referred to as
"optimum insulation thickness″.
For flexural members such as beams, it is not desirable to have insulation thickness beyond
an optimum value since it adds weight and accelerate insulation fall off under its dead weight,
especially when beam deflections increases under fire conditions. The insulation also limits the
temperature rise in steel reinforcement and this in turn helps to achieve higher moment capacity
at a given fire exposure time. However, beyond optimum insulation thickness, at which steel
rebar temperatures reaches about 400oC, any further reduction in steel reinforcement temperature
does not result in higher tension force or capacity of the beam (Eurocode 2 2004). Figure 6.22 (a)
and (b) shows the optimum insulation thicknesses required for FRP-strengthened RC beam
derived from parametric studies for insulation that has thermal conductivity of 0.12 W/m-oK. An
optimum insulation thickness of 40 mm is required to achieve 3 hours of fire resistance while a
minimum of 20 mm thickness is needed to acquire fire resistance up to 2 hours.
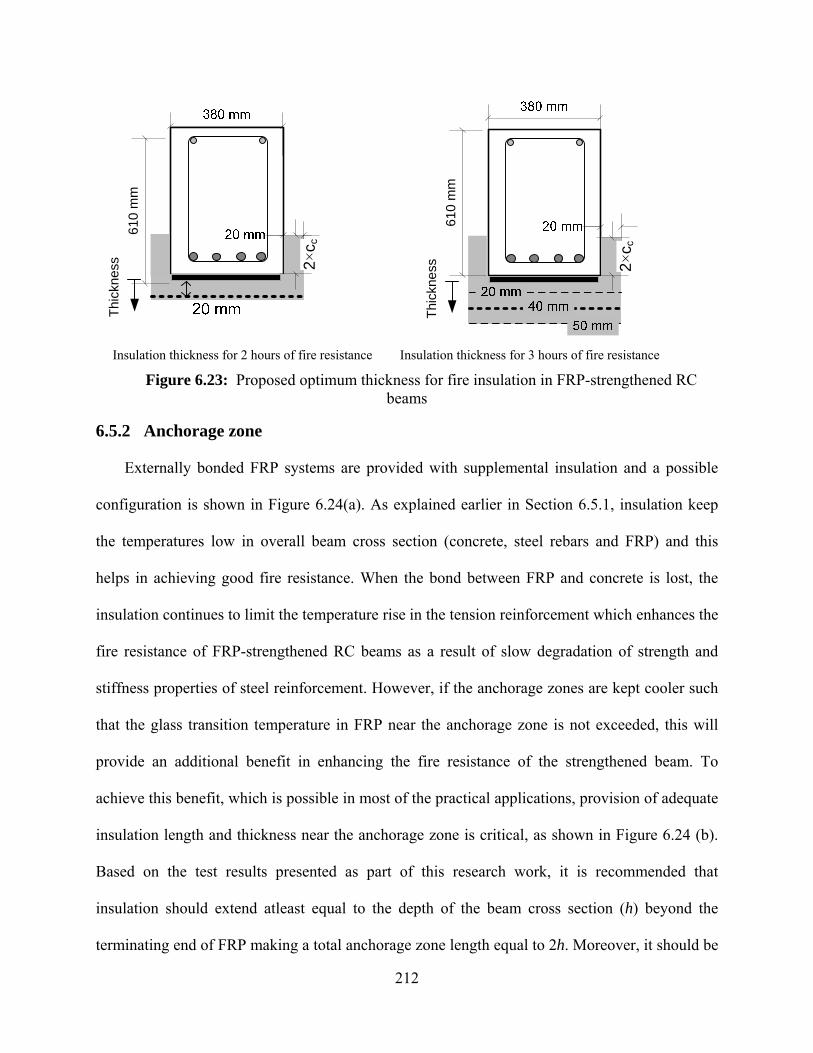
212
Insulation thickness for 2 hours of fire resistance Insulation thickness for 3 hours of fire resistance
Figure 6.23: Proposed optimum thickness for fire insulation in FRP-strengthened RC beams
6.5.2 Anchorage zone
Externally bonded FRP systems are provided with supplemental insulation and a possible
configuration is shown in Figure 6.24(a). As explained earlier in Section 6.5.1, insulation keep
the temperatures low in overall beam cross section (concrete, steel rebars and FRP) and this
helps in achieving good fire resistance. When the bond between FRP and concrete is lost, the
insulation continues to limit the temperature rise in the tension reinforcement which enhances the
fire resistance of FRP-strengthened RC beams as a result of slow degradation of strength and
stiffness properties of steel reinforcement. However, if the anchorage zones are kept cooler such
that the glass transition temperature in FRP near the anchorage zone is not exceeded, this will
provide an additional benefit in enhancing the fire resistance of the strengthened beam. To
achieve this benefit, which is possible in most of the practical applications, provision of adequate
insulation length and thickness near the anchorage zone is critical, as shown in Figure 6.24 (b).
Based on the test results presented as part of this research work, it is recommended that
insulation should extend atleast equal to the depth of the beam cross section (h) beyond the
terminating end of FRP making a total anchorage zone length equal to 2h. Moreover, it should be
Thi
ckne
ss 2×c c
610
mm
Thi
ckne
ss 2×c c
610
mm

213
provided with an adequate insulation thickness to keep temperatures at FRP/concrete interface
(bond face) lower than glass transition temperature ( )gT of FRP for desired length of time. For
instance, an insulation thickness of 50 mm is required to keep the temperature at FRP/concrete
interface within anchorage zone below gT for more than 2 hours.
(a) Not preferred option (b) Recommended zone of anchorages
Figure 6.24: Proposed fire insulation layout for FRP-strengthened RC beams
6.5.3 Performance-based Design
FRP-strengthened RC beams have higher inherent fire resistance under realistic (design) fire
scenarios, loading conditions and failure criteria. This higher fire resistance in FRP-strengthened
RC beams can be realized by accounting for these critical factors:
Realistic (design) fire scenario
Axial restraint force
Failure criteria
Load level
Design fire
In prescriptive approach, the fire resistance is mostly evaluated under standard fire exposure
(ASTM E119 fire or ISO 834 fire). In these fires, temperature increases with time throughout the

214
fire duration, and there is no decay phase, as shown in Figure 6.25. Therefore, such standard fires
do not represent often less heating environments encountered in real fires. In real fires a cooling
phase starts after flash over since the fire progression is characterized by availability of fuel load
and ventilation factor of the fire compartment. In the decay phase of the fire, the cross section of
the beam enters the cooling phase, in which the steel reinforcement and the concrete recovers
parts of its strength and stiffness (assuming that FRP has debonded in early stages of fire
exposure), and this enhances the fire resistance of the beam. In general, FRP-strengthened RC
members have higher fire resistance under most design (realistic) fires that have well defined
decay phase.
Figure 6.25:Effect of standard and design (realistic) fire on temperature profile of an insulated FRP-strengthened RC beam
Axial Restraint
The effect of axial restraints on the fire resistance of FRP-strengthened RC beams depends
on the vertical location of the restraint force. The location of axial restraint force below the

215
geometric centroid of beam improves the fire resistance of the FRP-strengthened RC beam
through the arch action associated with axial restraint force, which increases the load carrying
capacity of the beam under fire exposure. For realistic fire resistance assessment of fire
resistance, relevant axial restraint scenario should be accounted for.
Failure Criteria
The conventional approach of evaluating fire resistance is based on thermal and strength
failure criteria as specified in ASTM E119. For FRP-strengthened RC beams, in addition to
strength and deflection limit states, glass transition temperature ( )gT limit is also considered as
one of the failure criteria. This gT criterion is overly conservative from fire resistance point of
view since a number of fire tests indicated no strength failure of FRP-strengthened RC beams
even though gT exceeded in early stages of the fire exposure. Therefore, in reality fire resistance
of FRP-strengthened RC beams will be governed by strength or deflection limit state. These
criteria should be applied for evaluating failure in FRP-strengthened RC beams under fire
conditions.
Load Factors and Load Level
Generally RC beams are strengthened to increase the moment capacity by up to 50% of
original room temperature capacity. Generally in fire design, the expected loads on the structures
are often taken to be about 50% of the ultimate capacity of the beam or equal to the service load
levels (Buchanan 2002). ACI 440.2R-08 requires that the FRP-strengthened RC member must be
capable of withstanding service loads (1.2 times the dead load (DL) and 0.85 times the live load
(LL)) under fire exposure. This is expressed by following equation:
1.2 0.85originaln new newR SD SL

216
where: SD and SL is dead load and live load effect, respectively.
However for evaluating fire resistance, recent edition of ASCE 7-05 recommends a further
reduction in load levels by lowering live load factor from 0.85 to 0.5, but maintain 1.2 factor for
dead load. Such lower load levels are consistent with limit state design approaches used in
Europe. For fire resistance evaluation, Ellingwood and Corotis (1991) have proposed to use load
factors of 1.0 and 0.5 for dead and live loads, respectively. Under such lower load levels, an
FRP-strengthened beam will have higher fire resistance since the beam can sustain the loads for
a longer duration under lower load levels. Therefore, accounting for relevant and realistic load
factors through rational fire resistance calculations can yield higher fire resistance. Thus, this
factor should be considered for realistic fire safety assessment of FRP-strengthened RC beams.
6.5.4 Rational Fire Resistance Assessment
Once the above relevant factors are established, then a fire resistance analysis can be carried
out using a computer model, such as the one presented in this research. The analysis can be
performed as explained in Chapter 4. In such analysis, the main steps involved are:
Identifying appropriate realistic (design) fire scenario, load level, and axial restraint
conditions.
Carryout detailed thermal and structural analysis of FRP-strengthened RC beam.
Applying realistic limit state (strength or deflection, not gT criterion) to evaluate
failure.
The application of above rational approach for fire resistance assessment can be facilitated
under recently introduced performance-based codes.
217
6.6 Summary
A parametric study was performed to illustrate the sensitivity of various factors on fire
resistance of FRP-strengthened RC beams. Results of parametric studies indicate that fire
scenario, load level, bond degradation, axial restraint and its location, thermal properties,
thickness and geometric configuration of insulation has significant influence on fire resistance of
FRP-strengthened RC beams. The parameters that have moderate influence are: concrete
strength, aggregate type (carbonate and siliceous), and adhesive thickness. Data from parametric
studies and fire resistance tests was utilized to recommend fire design guidelines for enhancing
the fire resistance of FRP-strengthened RC beams. These guidelines can be applied to undertake
realistic fire assessment and also to achieve good fire resistance performance in FRP-
strengthened RC beams.
218
CHAPTER 7
CONCLUSIONS AND RECOMMENDATIONS 7.1 General
The experimental and numerical studies presented in this thesis examined the behavior of
FRP-strengthened RC beams under realistic fire and loading conditions. A numerical model was
developed to trace the response of FRP-strengthened RC beams under realistic fire, loading and
restraint conditions. The model is based on a macroscopic finite element approach and uses time-
dependent moment-curvature relationships to trace the response of the beam from pre-fire stage
to failure under fire conditions. The critical factors, namely; high temperature material
properties, fire induced bond degradation, axial restraint force, and different strain components
having significant influence on the fire response of FRP-strengthened RC beams were
incorporated in the model. For model validation, four FRP-strengthened RC beams were tested
under non-standard fire, loading, and axially restraint conditions. Data from these tests was used
to validate various response parameters which included cross sectional temperatures, debonding
of FRP, mid-span deflections, and fire resistance. The validated model was used to conduct a set

219
of parametric studies to quantify the influence of various factors on the fire response of FRP-
strengthened RC beams. Finally, results of parametric studies and fire resistance tests were
utilized to recommend broad guidelines for enhancing the fire resistance of FRP-strengthened
RC beams. These guidelines can be applied in design process to rationally evaluate fire
resistance and ensure satisfactory fire endurance of FRP-strengthened RC beams.
7.2 Key Findings
Based on the information presented in this thesis, the following key conclusions are
drawn:
There is very little information on performance of FRP-strengthened RC beams under
realistic fire and loading scenarios. Few available fire design guidelines for FRP-
strengthened RC beams are based on limited fire tests conducted under "standard fire"
exposure and are case specific. Therefore, these guidelines do not facilitate a rational
approach in evaluating fire resistance of FRP-strengthened RC beams.
The results of fire resistance experiments indicate that the fire performance of FRP-
strengthened RC beams is enhanced when anchorage zone (terminating ends of FRP) is
well protected against temperature rise. Presence of cooler anchorages enhances load
carrying capacity of FRP-strengthened RC beams through cable mechanism which is
provided by unbonded continuous fibers at the beam soffit. Also, presence of axial
restraint conditions enhances the fire resistance of FRP-strengthened RC beams.
The proposed macroscopic finite element model, based on moment-curvature
relationships, is capable of predicting the response of FRP-strengthened RC beams in the
entire range from the pre-fire stage to collapse under fire conditions. The model accounts

220
for high temperature material properties of constitutive materials (concrete, steel rebars,
FRP and insulation), fire induced bond degradation, axial restraint force, and different
strain components.
Results from the parametric studies and fire resistance tests indicate that fire scenario,
load level, fire induced bond degradation at FRP/concrete interface, magnitude and
location of axial restraint force, thermal properties of insulation, insulation thickness and
its geometric configuration are the key parameters that influence the fire resistance of
FRP-strengthened RC beams, specifically:
- The type of fire exposure has a significant effect on fire resistance of FRP-
strengthened RC beams. Under most design fire scenarios, FRP-strengthened RC
beams have higher fire resistance than under a standard fire exposure.
- Higher load level leads to a lower fire resistance of FRP-strengthened RC beams.
- The magnitude and location of fire induced axial restraint force significantly
affect the fire resistance of FRP-strengthened RC beam. Fire resistance is higher
when the axial restraint force is located below the centroidal axis of the beam.
- The fire resistance of FRP-strengthened RC beams does not improve much by
increasing the insulation thickness beyond an optimum thickness level.
Data from fire tests clearly shows that FRP-strengthened RC beams, supplemented with
25 mm spray-applied Tyfo®
WR Advanced Fire Protection system can survive failure
under fire exposure comprising of 3 hours of ASTM E119 growth phase followed by a
decay (cooling) phase.

221
Reaching glass transition temperature ( )gT in CFRP does not lead to the strength failure
in insulated CFRP-strengthened RC beams, thus, this is overly conservative failure
criteria from structural point of view.
Fire resistance in FRP-strengthened RC beams is not only influenced by the thickness of
insulation, but also by insulation scheme. The proposed design guidelines for optimum
insulation schemes and application of rational calculation methods will yield higher fire
resistance for FRP-strengthened RC beams.
7.3 Recommendations for Future Research
Although a number of significant contributions have emerged from this study, further
research is deemed necessary to fully characterize the complex behavior of FRP-strengthened
RC members under fire. Some of the important recommendations for future research are:
The proposed moment-curvature based macroscopic finite element numerical model can
be extended to other concrete structures such as prestressed concrete beams strengthened
with FRP and also to reinforced and pre-stressed concrete beam with near surface
mounted (NSM) FRP reinforcement.
More work is required to understand and accurately model the insulation behavior in
terms of bond strength (mechanical properties) with concrete and FRP and possible
mechanisms of delamination at elevated temperatures, crack formation and propagation.
In addition, more investigation is needed to study the effect of charring as a result of
pyrolysis process in thin FRP sheets.
222
Further experimental data is needed to enhance the understanding on the behavior of
FRP-strengthened members under other parameters such as fibers and matrix with
different thermal and mechanical properties, and influence of different anchorage and
insulation schemes. In addition, more work is needed to understand the relationship
between gT , heating rate, thermal and loading history on the beams for various currently
available FRP and adhesives used in civil engineering applications.
There is a need for characterizing high temperature constitutive relationships for thermal
and mechanical (including bond) properties for wide variety of FRP and insulation
materials available in the market. These high temperature material properties are
essential to enhance the capability and confidence level in model predictions.
Strain gage measurements can provide useful data for validation of the model under
combined effect of applied load and fire, and to quantify different strain components
under fire exposure. The high temperature strain gages currently available in the market
do not provide reliable measurements at high temperatures (above 300oC) and thus there
is a need for developing reliable high temperature strain gages.
7.4 Research Impact
Currently, there is very little guidance in codes and standards on the fire design FRP-
strengthened RC beams under realistic fire and loading conditions. This is mainly because the
response of FRP-strengthened RC beams under fire is not well understood and a number of
phenomenons complicate fire resistance evaluation. Currently available FRP materials for civil
engineering application experience significant loss of strength, stiffness and bond properties at
elevated temperatures. A wide variety of FRP and adhesive (resins) systems are being used in

223
structural strengthening industry. Fire testing of full-scale FRP strengthened beams, with
different combinations of FRP, insulation and RC beam parameters is expensive and time
consuming. In recent years, the shift is towards rational design approaches and numerical fire
modeling will become an important research tool for undertaking fire resistance analysis.
In lieu of full-scale fire testing of FRP-strength RC beams, the validated numerical model
such as the one presented here, will provide a convenient way to evaluate fire resistance, and
estimate optimum insulation thickness and its geometric configuration. Experimental studies,
such as the one presented here, provide an insight to develop an understanding on the response of
FRP-strengthened RC beams under realistic fire, loading, bond degradation and restraint support
conditions. These fire tests and numerical studies have shown that FRP-strengthened RC beams
with applied service loads and appropriate supplementary insulation can achieve fire endurance
in excess of 3 hours under standard, as well as realistic (design) fire exposure. The proposed fire
design guidelines, which have evolved from both experimental and numerical studies, will
facilitate the wider use of FRP in strengthening of concrete members in buildings and other
structures, where fire safety is one of the crucial issues.

224
APPENDIX A
Material Properties at Elevated Temperatures
This Appendix provides a summary of high temperatures material property relationships
used in the numerical model and parametric studies. Information is presented for concrete, steel,
FRP, and insulation, with respect to both thermal (specific heat, thermal conductivity) and
mechanical (strength, stiffness) properties.
A.1 Concrete – ASCE Properties
These equations presented in this section have been reproduced after Lie (1992).
A.1.1 Thermal Capacity, , ,c T c Tc
For siliceous aggregate concrete, with cT in oC and 3/, ,C in J m Cc T c T
6, ,
6, ,
6, ,
6, ,
6, ,
0 200 : 0.005 1.7 10
200 400 : 2.7 10
400 500 : 0.013 2.5 10
500 600 : 0.013 10.5 10
3316 : 2.7 10
c c T c T c
c c T c T
c c T c T c
c c T c T c
c c T c T
T c T
T c
T c T
T c T
T c

225
For carbonate aggregate concrete
6, ,
6, ,
6, ,
6, ,
6, ,
, ,
0 400 : 2.566 10
400 410 : 0.1765 68.034 10
410 445 : 0.05043 25.00671 10
445 500 : 2.566 10
500 635 : 0.01603 5.44881 10
635 715 : 0.00
c c T c T
c c T c T
c c T c T
c c T c T
c c T c T
c c T c T
T c
T c T
T c T
T c
T c T
T c
6
6, ,
6, ,
5 100.90225 10
715 785 : 0.22103 176.07343 10
785 : 2.566 10
c c T c T
c c T c T
T
T c T
T c
For lightweight aggregate concrete
6, ,
6, ,
6, ,
6, ,
6, ,
, ,
0 400 : 1.930 10
400 420 : 0.0772 28.95 10
420 435 : 0.1029 46.706 10
435 600 : 1.930 10
600 700 : 0.03474 18.9140 10
700 720 : 0.1737
c c T c T
c c T c T
c c T c T
c c T c T
c c T c T
c c T c T
T c
T c T
T c T
T c
T c T
T c T
6
6, ,
126.994 10
720 : 1.930 10c c T c TT c

226
A.1.2 Thermal Conductivity, ,c Tk
,
,
,
,
,
For siliceous aggregate concrete, with in and in /
0 800 : 0.000625 1.5
800 : 1.0
For carbonate aggregate concrete
0 293: 1.355
293: 0.001241 1.7162
For lightweight aggregate c
c c T
c c T c
c c T
c c T
c c T c
T C k W m C
T k T
T k
T k
T k T
,
,
oncrete
0 600 : 0.00039583 0.925
600 : 0.6875
c c T c
c c T
T k T
T k
A.1.3 Thermal Strain (All Type)
2 60.004 400 6 20 10th T T
A.1.4 Stress-Strain Relationships
2max,
, max,max,
2max,
, max,max,
1 ,
1 ,3
Tc T T
T
c
Tc T T
T
f
f

227
,
, 20 450
202.011 2.353 , 450 874
1000
0 , 874
c
c T c
f C T C
Tf f C T C
C T
2 6max, 0.0025 6.0 0.04 10T T T
A.2 Concrete – Eurocode Properties
These equations presented in this section have been reproduced after Eurocode 2 (2004)
A.2.1 Thermal Capacity
Specific Heat (J/kg-oC)
900 20 100
900 100 100 200
1000 200 / 2 200 400
1100
c for C T C
c T for C T C
c T for C T C
c f
400 1200or C T C
Density (kg/m3)
20 20 115
20 1 – 0.02 115 / 85 115 200
20 0.98 – 0.03 200 / 200 200 400
20 0.95
C for C T C
C T for C T C
C T for C T C
C
– 0.07 400 / 800 400 1200T for C T C
A.2.2 Thermal Conductivity (All Type)
Upper Limit
2 – 0.2451 / 100 0.0107 / 100 2 20 1200ck T T for C T C

228
Lower Limit
1.36 – 0.136 / 100 0.0057 / 100 2 20 1200ck T T for C T C
A.2.3 Thermal Strain
Siliceous Aggregate
4 6 11 3
3
1.8 10 9 10 2.3 10 20 700
14 10 700 1200
th
th
T T for C T C
for C T C
Carbonate Aggregate
4 6 11 3
3
1.2 10 6 10 1.4 10 20 805
12 10 805 1200
th
th
T T for C T C
for C T C
A.2.4 Stress-Strain Relationship
',
1,3
1,1,
3 ,
2
c Tc cu T
c Tc T
f
For εc1(T) < ε ≤ εcu1(T) , the Eurocode permits the use of linear as well as nonlinear
descending branch in the numerical analysis. For the parameters in this equation refer to Table
A.1.

229
Table A.1 Values for the Main Parameters of the Stress-strain Relationships of NSC at Elevated
Temperatures (Eurocode 2)
T(oC)
Normal Strength Concrete
Siliceous Aggregate Calcareous Aggregate
',
' (20 )
c T
c
f
f C 1,c T 1,cu T
',
' (20 )
c T
c
f
f C 1,c T 1,cu T
20 1 0.0025 0.02 1 0.0025 0.02
100 1 0.004 0.0225 1 0.004 0.023
200 0.95 0.0055 0.025 0.97 0.0055 0.025
300 0.85 0.007 0.0275 0.91 0.007 0.028
400 0.75 0.01 0.03 0.85 0.01 0.03
500 0.6 0.015 0.0325 0.74 0.015 0.033
600 0.45 0.025 0.035 0.6 0.025 0.035
700 0.3 0.025 0.0375 0.43 0.025 0.038
800 0.15 0.025 0.04 0.27 0.025 0.04
900 0.08 0.025 0.0425 0.15 0.025 0.043
1000 0.04 0.025 0.045 0.06 0.025 0.045
1100 0.01 0.025 0.0475 0.02 0.025 0.048
1200 0 - - 0 - -

230
A.3 Reinforcing Steel – ASCE Properties
A.3.1 Thermal Strain
2 60.004 400 6 20 10 1000ths T T T C
A.3.2 Stress-strain Relationship
,0.001
0.001,0.001
, 0.001 ,0.0010.001
s s p
s
p s p s p
f T
f Tf T f T
, 6.9 50 0.04 1 exp 30 0.03f T x T T x
6,204 10p yf
where:s and s = stress (MPa) and strain in steel reinforcement, respectively, and fy,20 is
the yield strength of reinforcing steel (MPa) at room temperature.
A.4 Reinforcing Steel – Eurocode Properties
A.4.1 Thermal Strain
5 8 2 4
2
5 3
1.2 10 0.4 10 2.416 10 20 750
1.1 10 750 860
2 10 6.2 10 20 750
ths
T T C T C
C T C
T C T C
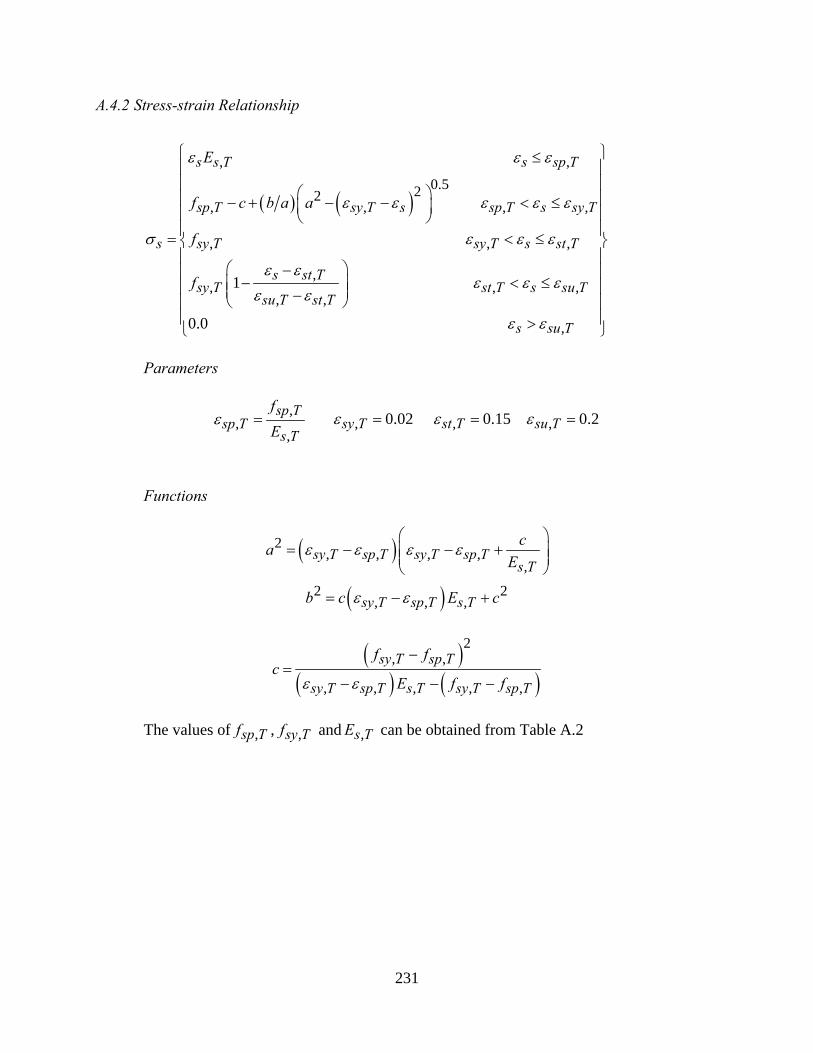
231
A.4.2 Stress-strain Relationship
, ,
0.522, , , ,
, , ,
,, , ,
, ,
,
1
0.0
s s T s sp T
sp T sy T s sp T s sy T
s sy T sy T s st T
s st Tsy T st T s su T
su T st T
s su T
E
f c b a a
f
f
Parameters
,,
,
sp Tsp T
s T
f
E , 0.02sy T , 0.15st T , 0.2su T
Functions
2, , , ,
,sy T sp T sy T sp T
s T
ca
E
2 2, , ,sy T sp T s Tb c E c
2, ,
, , , , ,
sy T sp T
sy T sp T s T sy T sp T
f fc
E f f
The values of ,sp Tf , ,sy Tf and ,s TE can be obtained from Table A.2
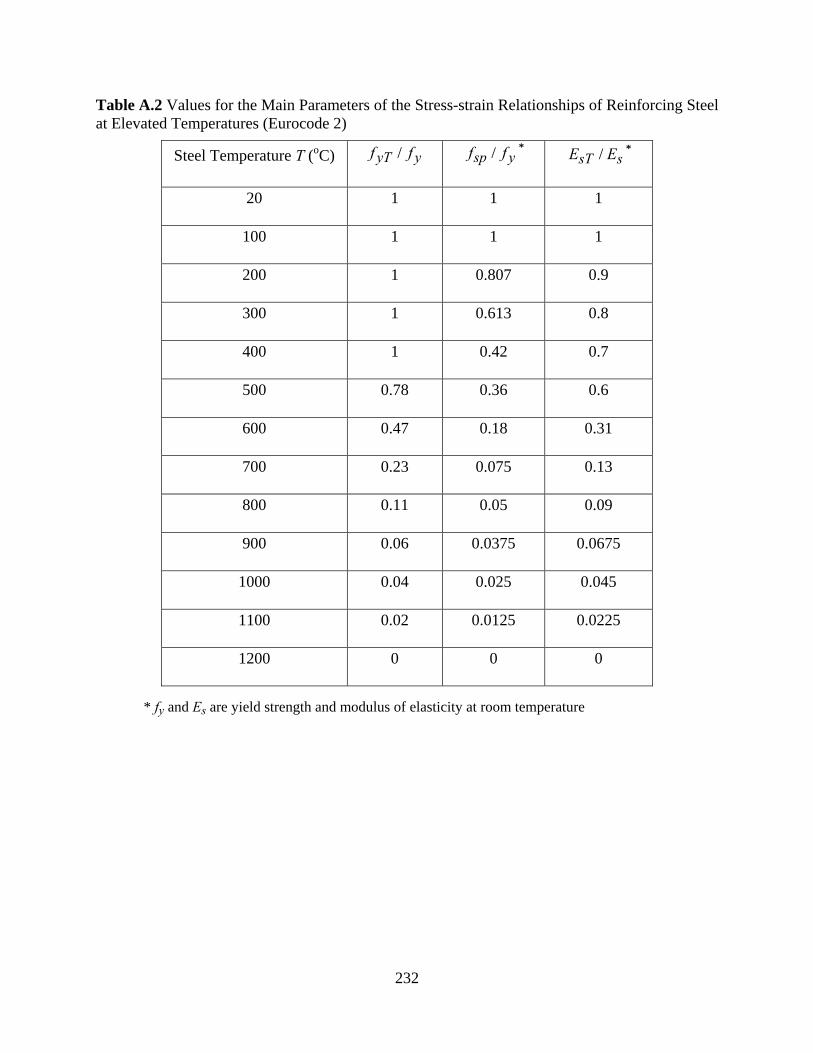
232
Table A.2 Values for the Main Parameters of the Stress-strain Relationships of Reinforcing Steel at Elevated Temperatures (Eurocode 2)
Steel Temperature T (oC) /yT yf f /sp yf f * /sT sE E *
20 1 1 1
100 1 1 1
200 1 0.807 0.9
300 1 0.613 0.8
400 1 0.42 0.7
500 0.78 0.36 0.6
600 0.47 0.18 0.31
700 0.23 0.075 0.13
800 0.11 0.05 0.09
900 0.06 0.0375 0.0675
1000 0.04 0.025 0.045
1100 0.02 0.0125 0.0225
1200 0 0 0
* fy and Es are yield strength and modulus of elasticity at room temperature

233
A.5 Insulation - Tyfo ® Vermiculite-Gypsum (VG)
This insulation is manufactured by Fyfe Co. LLC as fire proofing system for FRP
composites. These thermal properties relationships are based on Thermogravimetric Analysis
(TGA) performed by Bisby (2003), as well as material property estimates from other sources:
A.5.1 Density
The VG insulation has two primary components, namely; gypsum and vermiculite. Based
on typical densities of gypsum (865 kg/m3) and vermiculite (128 kg/m3) mixed in 2:1 ratio, the
relationships obtained through TGA (Bisby 2003) are:
,
,
,
,
0 100 : 351
351 287100 200 : 351 . 100
200 100
351 287100 200 : 351 . 100
200 100
200 : 287
VG VG T
VG VG T VG
VG VG T VG
VG VG T
T
T T
T T
T
where; VG is density in kg/m3 and temperature VGT in oC
A.5.2 Specific Heat
The two components of insulation (vermiculite and gypsum) have different specific heat
values with temperature variation. For specific heat relationships presented below, it has been
assumed that specific heat of vermiculite remains constant whereas it changes with temperature
for gypsum. The effect of dehydration has been included by artificially increasing the specific
heat around 100oC.

234
,
,
,
,
,
0 20 : 1.1763
1.3058 1.176320 18 : 1.1763 . 20
78 20
6.9066 1.305878 125 : 1.3058 . 78
125 78
1.3722 1.1763125 137 : 6.9066 . 125
137 125
1.3137 153: 1.3722
VG VG T
VG VG T VG
VG VG T VG
VG VG T VG
VG VG T
T c
T c T
T c T
T c T
T c
,
,
,
,
722 1.0136. 137
153 137
1.0136 0.8509153 610 : 1.0136 . 153
610 153
1.6976 0.8509610 663: 0.8509 . 610
663 610
1.6976 0.9167663 690 : 1.6976 . 663
690 663
690 : 0.
VG
VG VG T VG
VG VG T VG
VG VG T VG
VG VG T
T
T c T
T c T
T c T
T c
9167
where; VGc is specific heat of VG insulation (J/kg-oC) and temperature in oC
A.5.3 Thermal Conductivity
The thermal conductivity of vermiculite is constant with temperature and that of gypsum
varies with temperature. The variation of thermal conductivity (W/m-oC) with temperature (oC)
is expressed by:
,
,
,
,
,
0 100 : 0.1158
0.1158 0.0726100 101: 0.1158 . 100
101 100
101 400 : 0.0726
0.1224 0.0726400 800 : 0.0726 . 400
800 400
0.2087 0.12248000 : 0.1224 .
1000 800
VG VG T
VG VG T VG
VG VG T
VG VG T VG
VG VG T VG
T
T T
T
T T
T T
800
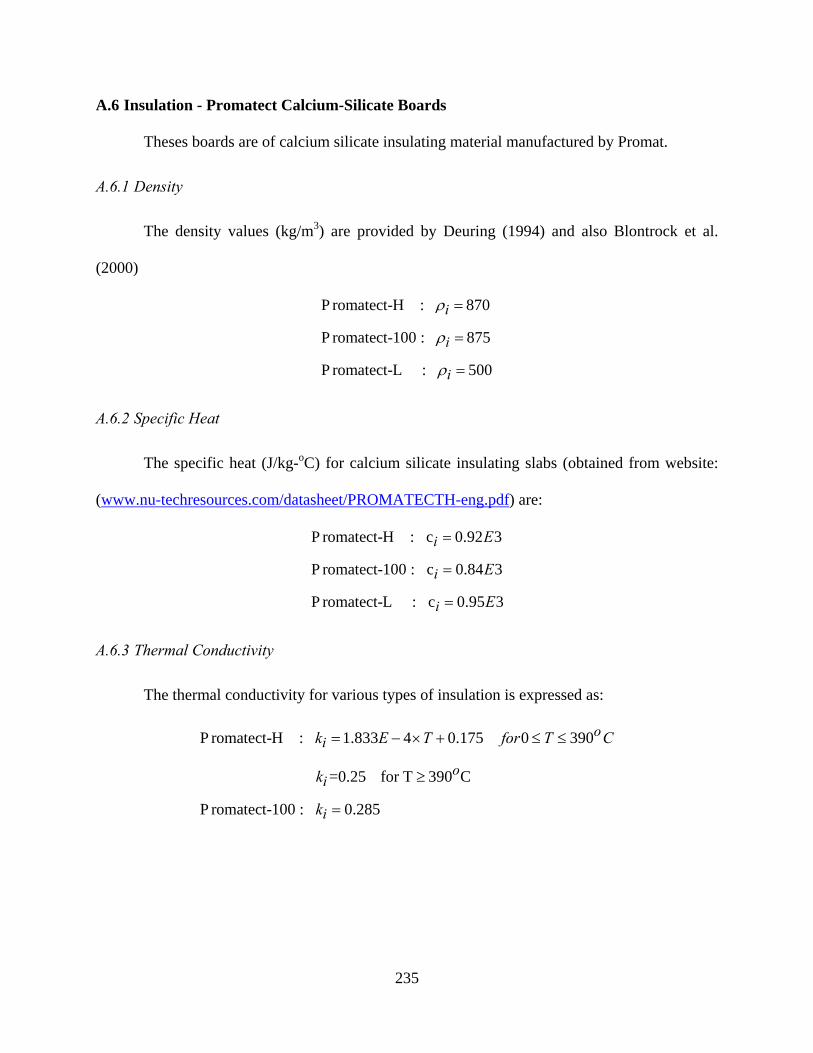
235
A.6 Insulation - Promatect Calcium-Silicate Boards
Theses boards are of calcium silicate insulating material manufactured by Promat.
A.6.1 Density
The density values (kg/m3) are provided by Deuring (1994) and also Blontrock et al.
(2000)
P romatect-H : 870
P romatect-100 : 875
P romatect-L : 500
i
i
i
A.6.2 Specific Heat
The specific heat (J/kg-oC) for calcium silicate insulating slabs (obtained from website:
(www.nu-techresources.com/datasheet/PROMATECTH-eng.pdf) are:
P romatect-H : c 0.92 3
P romatect-100 : c 0.84 3
P romatect-L : c 0.95 3
i
i
i
E
E
E
A.6.3 Thermal Conductivity
The thermal conductivity for various types of insulation is expressed as:
P romatect-H : 1.833 4 0.175 0 390
=0.25 for T 390 C
P romatect-100 : 0.285
oi
oi
i
k E T for T C
k
k

236
P romatect-L : 7.07 5 0.083 0 100
4.0 5 0.086 100 200
6.0 5 0.082 200 400
oi
oi
oi
k E T for T C
k E T for T C
k E T for T C
8.0 5 0.074 400 500
0.144 500
oi
oi
k E T for T C
k for T C
where; ik is thermal conductivity (W/m-oC) and T is temperature (oC)
A.7 FRP
A.7.1 Specific Heat, ,w Tc
In the following equations, ,w Tc has units of (kJ/kg-oC) and wT is in oC
,
,
,
,
,
,
0.950 325 : 1.25 .
325
2.8325 343: 2.2 . 325
18
0.15343 510 : 5.0 . 343
167
3.59510 538 : 4.85 . 510
28
1.385538 3316 : 1.265 . 538
2778
3316 : 0
w w T w
w w T w
w w T w
w w T w
w w T w
w w T
T c T
T c T
T c T
T c T
T c T
T c

237
A.7.2 Density, ,w T
In the following equations, ,w T has units of (g/cm3) and wT is in oC
,
,
,
0 510 : 1.6
0.35510 538 : 1.6 . 510
28
538 1200 : 1.25
w w T
w w T w
w w T
T
T T
T
A.7.3 Thermal Conductivity, ,w Tk
In the following equations, ,w Tk has units of (W/m-oC) and wT is in oC
,
,
,
1.10 500 : 1.4 .
500
0.1500 650 : 1.4 . 500
150
650 : 0.2
w w T w
w w T w
w w T
T K T
T K T
T K
A.7.4 Strength, ,com Tf and Elastic Modulus, ,com TE
In the following equations the units of strength ,( )com Tf and elastic modulus ,( )com TE are
MPa and for temperature ( )wT is oC
,
,
1 1tanh
2 2
1 1tanh
2 2
com T com w
E Ecom T com E w E
a af f b T c
a aE E b T c

238
where for:
CFRP: 0.1; 5.83 3; 339.54; 0.05; 8.68 3; 367.41E E Ea b e c a b e c
GFRP: 0.1; 8.10 3; 289.14; 0.05; 7.91 3; 320.35E E Ea b e c a b e c
AFRP: 0.1; 8.48 3; 287.65; 0.05; 7.93 3; 290.49E E Ea b e c a b e c

239
APPENDIX B
B.1 Design and Load Calculations of FRP-Strengthened RC Beam
This Appendix summarizes the design and load calculations using ACI 318 (2008)
provisions reinforced concrete (RC) beam. The cross-section, shear force diagram, and bending
moment diagram for the tested beams are shown in Figure B.1. The design calculations are
presented in the following two sections.
B.1.1 Design of RC Beam
406
mm
Figure B.1: Cross-section, Elevation, Shear Force Diagram, and Bending Moment Diagram for Tested Beams

240
41.3fc MPa 413f y MPa
Neglecting the area of steel in the compression zone
The tensile area of steel As = 855 mm2
Clear concrete cover = 38 mm
h = 406 mm b = 254 mm
d = 352.4 mm
39.6a mm
a = 1 c
Hence, 0.751
Therefore, 39.6
52.80.75
c mm
Strain in tensile steel can be calculated by interpolation as follows:
0.003 0.003352.4 52.8 0.017 0.005
52.8d ct c
Therefore, = 0.9
Check minimum reinforcement
0.0039min
0.00955 minAsbd
The moment capacity of the beam is
39.6855 413 352.4
2117
62 10
aM A f dn s y
kN.m
1.4M Pn n

241
83.9Pn kN and 75.5Pu kN
Design for shear
The ultimate shear force is at distance d from the face of the support:
75.5V Pu u kN
Required nominal shear strength:
0.75
75.5100.7
0.75
VuVn kN
The concrete shear strength is:
0.16 41.3 254 352.40.16 92
1000V f b dc c w
kN
The required shear strength obtained by shear reinforcement must be:
V Vn c
100.7 92 8.7V V VS n C kN
0.344max 35min
0.06
b dwVs
f b dc w
kN
Use minimum shear reinforcement
The required shear reinforcement will be found to be
0.237Avs mm
Using #2 stirrups
The area of each leg is 31.6 mm2
Hence, Av =231.6 = 63.2 mm2
The required spacing will be:
63.2267
0.237s mm
352.4176.2
2 2
d mm (ACI 318 11.5.4.1)
Hence, use #2 stirrups 150 mm c/c

242
Check Deflection
The gross moment of inertia (neglecting the compressive and tensile steel) can be calculated as:
391.416 10
12
bhIg mm
4
The cracked moment of inertia (neglecting the compressive steel) can be calculated as follows:
210Es GPa
4730 30.4E fc c GPa
6.9EsnEc
2 2nA bdnA nAs s sxb
= 106.9 mm
3
23
bxI nA d xcr s
90.459 10Icr mm4
The modulus of rupture is:
0.6 3.86f fr c MPa
The cracking moment is
f Ir gMcr yt
26.9 kN.m
The effective moment of inertia will be:
Assume Ma to be 0.7Mu, then
Ma = 0.71170.9 = 73.71 kN.m
3 31
M Mcr crI I I Ie g cr gM Ma a
90.506 10Ie mm4
Hence, the deflection of the beam will be:

243
2 26.5
2 4 3
M L a
E Ic e
mm
Load Calculations
58.2fc MPa 450f y MPa
Neglecting the area of steel in the compression zone
The tensile area of steel As = 855 mm2
Clear concrete cover = 38 mm
h = 406 mm b = 254 mm
d = 352.4 mm
30.62a mm
a = 1 c
Hence, 0.6241
Therefore, 30.62
49.070.624
c mm
Strain in tensile steel can be calculated by interpolation as follows:
0.003 0.003352.4 49.07 0.0185 0.005
49.07d ct c
Hence, = 0.9
Check minimum reinforcement:
0.0039min
0.00955 minAsbd
The moment capacity of the beam is:

244
30.62855 450 352.4
2129.7
62 10
aM A f dn s y
kN.m
1.4M Pn n ; 92.64Pn kN and 83.5Pu kN
The load ratio is defined as the ratio of applied load under fire conditions to the capacity of the
section at room temperature (Buchanan 2002). Accordingly, the load ratio is given as:
50100
92.7LR % = 54%

245
B.2.1 FRP Strengthening of RC Beam
All calculations have been performed in SI units. The design equations from American codes
(ACI 318 and ACI 440.2R-08) have been used. The RC beam is required to be strengthened to
increase the moment capacity by about 50%. Two unidirectional CFRP sheets of 203 mm width
are used to strengthen the beam. The detailed calculations are as follows:
Material properties
h = 406 mm b = 254 mm d = 352.4 mm
855As mm2
58.2fc MPa 450f y MPa
Es 210000 MPa 36000Ec MPa 52000E frp MPa
634f fu MPa (assuming CE =0.85)
FRP Area Calculations
The properties of existing steel reinforcement:
855As mm2
39.552 10As
s b d
Modular ratio: 5.8Esns Ec
The properties of externally bonded CFRP reinforcement:
Number of CFRP sheets
2n
Width of each sheet

246
203bfrp mm
Hence, the area of externally bonded CFRP is:
406A n t bfrp frp frp mm2
34.536 10Afrp
s b d
Modular ratio: 1.4E frp
n frp Ec
Since the beams are strengthened in the laboratory, therefore it is assumed that the initial strains
at the beam soffit at the time retrofitting is zero ( 0)bi
Determining the bond-dependant coefficient of FRP system:
1
1 0.9060 360000
nE tt fm
fu
where: 0.1Cfu E frp
1.14m
Since computed coefficient is greater than 0.9, therefore, 0.9m
Computing the depth of the neutral axis:
' 20.85 ( ) 01f ba A E A f a A E hc frp frp cu bi s y frp frp cu
50.75a mm
81.28c mm
Effective strain in CFRP reinforcement
0.003h c
fe bi m fuc

247
0.012 ≤ 0.009
Therefore, strain in CFRP is 0.009fe and 468f Efe frp fe MPa
Calculating new depth of neutral axis
( )
45.74'0.85
A E A ffrp frp fe s ya
f bc
mm
c = 73.25 mm
The moment capacity of CFRP strengthened RC beam is:
199.582 2
a aM A f d A f hn s y frp fe
kN-m
The increase in moment capacity is 53.88%
Calculations of Load
1.4M P ; 200
142.91.4
P kN
The load ratio given as:
70100 49%
142.9LR

248
APPENDIX C
C.1 Finite Element Formulation
To solve the heat and mass transfer problems, the cross-section of the beam segment is
divided into rectangular elements as shown in Figure 4.1. Since the dependent variable (the
variable to be computed) in the two problems is scalar, Q4 (four node) element is used in the
analysis. Due to the nonlinearity of both the problems, integrations in Eqs. (4.11) through (4.13)
are evaluated numerically using Gaussian quadrate integration technique. The vector of shape
functions for Q4 element can be written as:
1 1
41 1
41 1
41 1
4
s t
s t
Ns t
s t
where: s and t = transformed coordinates as shown in Figure C.1.
The analysis is generally carried out using four Gauss points and the element stiffness
matrix (Ke), mass matrix (Me) and nodal heat or mass flux (Fe) are evaluated at every Gauss

249
point. Those values of the element matrices at the four Gauss points are summed to form the
element material property matrices which are used for the subsequent steps in the analysis.
Figure C.1: Q4 elements in transformed coordinates
1 2
34
(-1,-1) (1,-1)
(1,1)(-1,1)
t
s

250
REFERENCES

251
ACI 318-08. (2008). "Building Code Requirements for Reinforced Concrete and Commentary." American Concrete Institute, Farmington Hills, MI.
Ahmed, A., and Kodur, V. K. R. (2010). "Factors Governing Fire Resistance of FRP- Strengthened Reinforced Concrete Beams." Composite & Polycon, American Composites Manufacturers Association (ACMA), Las Vegas, Nevada.
Al-Homoud, D., and Mohammad, S. (2005). "Performance characteristics and practical applications of common building thermal insulation materials." Building and Environment, 40(3), 353-366.
American Concrete Institute (ACI). (2006). "Guide for the design and construction of structural concrete reinforced with FRP bars." ACI 440.1R-06, ACI Committee 440, Farmington Hills, MI.
American Concrete Institute (ACI). (2008). "Guide for the design and construction of externally bonded FRP systems for strengthening concrete structures ", ACI 440.2R-08, ACI Committee 440, Farmington Hills, MI.
American Society for Testing and Materials (ASTM). (1993). "Standard test methods for determining glass transition temperature." ASTM E1545
American Society for Testing and Materials (ASTM). (2007). " Standard test methods for fire tests of building construction and materials." ASTM E119, West Conshohocken, PA.
American Society of Civil Engineers (ASCE). (2009). "Report Card for America's Infrastructure." Reston, Virginia.
Anderberg, Y., and Thelandersson, S. (1976). Stress and deformation characteristics of concrete at high temperatures, 2-Experimental investigation and material behaviour model, Bulletin 54, Lund Institute of Technology, Lund, Sweden
Apicella, F., and Imbrogno, M. (1999a). "Fire Performance ofCFRP-Composites Used for Repairing and Strengthening." Proceedings of Fifth ASCE materials Engineering Conference, Cincinnati, Ohio, 266.
Arduini, M., and Nanni, A. (1997). "`Behavior of pre-cracked RC beams strengthened wth carbon FRP sheets " Journal of Composites for Construction, 1(2), 63-70.
ASCE Manuals and Reports on Engineering Practice No. 78. (1992). "Structural Fire Protection." New York: American Society of Civil Engineers.

252
Ashour, A. F., El-Refaie, S. A., and Garrity, S. W. (2004). "Flexural strengthening of RC continuous beams using CFRP laminates." Cement and concrete composites, 26(7), 765-775.
Bakis, C. E. (1993). FRP reinforcement: materials and manufacturing, Elsevier Science Publisher.
Bakis, C. E., Cosenza, E., Lesko, J. J., and Machida, A. (2002). "Fiber-reinforced polymer composites for construction—state-of-the-art review." Journal of Composites for Construction, 6, 73.
Balaguru, P., Nanni, A., and Giancaspro, J. (2008). FRP composites for reinforced and prestressed concrete structures: a guide to fundamentals and design for repair and retrofit, Taylor & Francis Group.
Ballinger, C., Maeda, T., and Hoshijima, T. "Strengthening of reinforced concrete chimneys, columns and beams with carbon fiber reinforced plastics." Fiber-Reinforced-Plastic (FRP) Reinforcement for Concrete Structures: Properties and Applications, 233–247.
Bank, L. C., Gentry, T. R., and Barkatt, A. (1995). "Accelerated test methods to determine the long-term behavior of FRP composite structures: environmental effects." Journal of Reinforced Plastics and Composites, 14(6), 559.
Barnes, R., and Fidell, J. (2006). "Performance in fire of small-scale CFRP strengthened concrete beams." Journal of Composites for Construction, 10, 503-508.
Bisby, L. A. (2003). "Fire behavior of fibre-reinforced polymer (FRP) reinforced or confined concrete," Doctoral Thesis, Queen’s University, Kingston, Canada.
Blaschko, M., Niedermeier, R., and Zilch, K. (1998). "Bond failure modes of flexural members strengthened with FRP." Fiber Composites in Infrastructure, 315-327.
Blontrock, H., Taerwe, L., and Matthys, S. (1999). "Properties of fiber reinforced plastics at elevated temperatures with regard to fire resistance of reinforced concrete members." 188, 43-54.
Blontrock, H., Taerwe, L., and Vandevelde, P. (2000). "Fire tests on concrete beams strengthened with fibre composite laminates." Third PhD Symposium, Vienna, Austria.
Blontrock, H., Taerwe, L., and Vanwalleghem, H. (2002). "Bond testing of externally glued FRP laminates at elevated temperature." Proceeding of the International

253
Conference Bond in Concrete – from research to standards, Budapest, Hungary, 648-654.
Bourbigot, S., and Flambard, X. (2002). "Heat resistance and flammability of high performance fibres: A review." Fire and Materials, 26(4-5), 155-168.
British Standard Institute (BSI). (1987). "Fire test on building materials and structures - Part 20: Method for determination of fire resistance of elements of construction (General principles)." BS476-20, London, UK.
British Standards Institute (BSI). (2009). "Fire tests on building materials and structures. Guide to the principles, selection, role and application of fire testing and their outputs." BS 476-10, Bristol, UK.
Buchanan, A. H. (2002). Structural design for fire safety, Wiley Chichester, UK.
Camata, G., Pasquini, F., and Spacone, E. (2007). "High temperature flexural strengthening with externally bonded FRP reinforcement." Proceedings of 8th International Symposium on Fiber Reinforced Polymer (FRP) Reinforcement for Concrete Structures (FRP8RCS), Patras, Greece, 1-10.
Campbell, T. I., and Kodur, V. K. R. (1990). "Deformation controlled nonlinear analysis of prestressed concrete continuous beams." PCI Journal, 35(5), 42-90.
Canadian Standards Association (CSA) S806-02. (2002). "Design and construction of building components with fibre-reinforced polymers." CAN/CSA S806-02, Rexdale, Canada.
Chaallal, O., Nollet, M. J., and Perraton, D. (1998). "Strengthening of reinforced concrete beams with externally bonded fiber-reinforced-plastic plates: design guidelines for shear and flexure." Canadian Journal of Civil Engineering, 25(4), 692-704.
Chen, J. F., and Teng, J. G. (2003). "Shear capacity of FRP-strengthened RC beams: FRP debonding." Construction and Building Materials, 17(1), 27-41.
Cook, R. D., Malkus, D. S., Plesha, M. E., and Witt, R. J. (2007). Concepts and applications of finite element, John Wiley & Sons, INC., NY, USA.
Darwish, M. N. (2000). "Upgrading Reinforced Concrete Columns by Jacketing with Carbon Fiber-Reinforced Plastic (CFRP) Sheets." Special Publication, 193, 488-502.

254
Davies, J. M., Wang, Y. C., and Wong, F. M. H. (2004). "Polymer composites in fire." Proceedings of Advanced Composites for Structural Applications in Construction, Guildford, Surrey, UK, 3-17.
Denton, S. R. (2001). "Analysis of stresses developed in FRP plated beams due to thermal effects." FRP Composites in Civil Engineering, 1, 527-536.
Deuring, M. (1994). "Brandversuche an nachtraglich verstarkten tragern aus beton." Swiss Federal Laboratories for Materials Testing and Research, Dubendorf, Switzerland.
Di Tommaso, A., Neubauer, U., Pantuso, A., and Rostasy, F. S. (2001). "Behaviour of Adhesively Bonded Concrete-CFRP Joints at Low and High Temperatures." Mechanics of Composite Materials, 37(4), 327-338.
Dodds, N., Gibson, A. G., Dewhurst, D., and Davies, J. M. (2000). "Fire behaviour of composite laminates." Composites Part A: Applied Science and Manufacturing, 31(7), 689-702.
Dortzbach, J. (1999). "Carbon Fiber Reinforcing Polymers as Negative Moment Reinforcing in Repair of Composite Steel Parking Deck." Special Publication 188, American Concrete Institute, Detroit, Michigan.
Dwaikat, M. B. (2009). "Flexural response of reinforced concrete beams exposed to fire," Doctoral Thesis, Michigan State University, East Lansing, Michigan, USA.
Dwaikat, M. B., and Kodur, V. K. R. (2008). "A numerical approach for modeling the fire induced restraint effects in reinforced concrete beams." Fire Safety Journal, 43(4), 291-307.
El-Hacha, R., Wight, R. G., and Green, M. F. (2001). "Prestressed fibre-reinforced polymer laminates for strengthening structures." Progress in Structural Engineering and Materials, 3(2), 111-121.
Ellingwood, B. R., and Corotis, R. B. (1991). "Load combinations for buildings exposed to fires." Engineering Journal, 28(1), 37-44.
Eurocode 1. (2002). "EN 1991-1-2: Actions on structures. Part 1-2: General actions - Actions on structures exposed to fire." European Committee for Standardization, Brussels, Belgium.

255
Eurocode 2. (2004). "EN 1992-1-2: Design of concrete structures. Part 1-2: General rules - Structural fire design." European Committee for Standardization, Brussels, Belgium.
Eurocode 3. (1995). "Eurocode 3: Design of Steel Structures. Part 1-2: General Rules - Structural Fire Design." European Committee for Standardization, Brussels, Belgium.
Fédération Internationale du Béton (FIB). (2001). "Design and use of externally bonded FRP reinforcement for RC structures." Bulletin 14, Lausanne, Switzerland.
Ferrillo, R. G., and Achorn, P. J. (1997). "Comparison of thermal techniques for glass transition assignment. II. Commercial polymers." Journal of Applied Polymer Science, 64(1), 191-195.
Gamage, J., Al-Mahaidi, R., and Wong, M. B. (2006). "Bond characteristics of CFRP
plated concrete members under elevated temperatures." Composite Structures, 75(1-4), 199-205.
Gao, B., Leung, C. K. Y., and Kim, J. K. (2005). "Prediction of concrete cover separation failure for RC beams strengthened with CFRP strips." Engineering Structures, 27(2), 177-189.
Garden, H. N., and Hollaway, L. C. (1998). "An experimental study of the influence of plate end anchorage of carbon fibre composite plates used to strengthen reinforced concrete beams." Composite Structures, 42(2), 175-188.
Gates, T. S. (1991). "Effects of Elevated Temperature on the Viscoelastic Modeling of Graphite/Polymeric Composites." NASA Technical Memorandum 104160, National Aeronautics and Space Administration, Langely, USA.
Ghobarah, A. (2001). "Seismic rehabilitation of beam-column joints using FRP laminates." Journal of earthquake engineering, 5(1), 113-129.
Grace, N. F. (2001). "Strengthening of negative moment region of reinforced concrete beams using carbon fiber-reinforced polymer strips." ACI Structural Journal, 98(3), 347-358.
Grace, N. F., Sayed, G. A., Soliman, A. K., and Saleh, K. R. (1999). "Strengthening reinforced concrete beams using fiber reinforced polymer (FRP) laminates." ACI structural Journal, 96(5), 865-874.
256
Green, M. F., Bisby, L. A., Beaudoin, Y., and Labossière, P. (2000). "Effect of freeze-thaw cycles on the bond durability between fibre reinforced polymer plate reinforcement and concrete." Canadian Journal of Civil Engineering, 27(5), 949-959.
Green, M. F., Dent, A. J. S., and Bisby, L. A. (2003). "Effect of freeze-thaw cycling on the behaviour of reinforced concrete beams strengthened in flexure with fibre reinforced polymer sheets." Canadian Journal of Civil Engineering, 30(6), 1081-1088.
Griffis, C. A., Masumura, R. A., and Chang, C. I. (1981). "Thermal response of graphite epoxy composite subjected to rapid heating." Journal of Composite Materials, 15(5), 427.
Harmathy, T. Z. (1967). "A comprehensive creep model." J. Basic Eng., 89(3), 496-502.
Harmathy, T. Z. (1993). Fire safety design and concrete, John Wiley & Sons, Inc., New York, NY.
Hawileh, R. A., Naser, M., Zaidan, W., and Rasheed, H. A. (2009). "Modeling of insulated CFRP-strengthened reinforced concrete T-beam exposed to fire." Engineering Structures (In Press), doi:10.1016/j.engstruct.2009.08.008
Hiroyuki, Y., and Wu, Z. (1997). "Analysis of debonding fracture properties of CFS strengthened member subject to tension." Proceedings of 3rd International Symposium Sapporo, Japan, 287-294.
Institute of Structural Engineering (ISE). (1999). "Interim guidance on the design of reinforced concrete structures using fiber composites reinforcement." Reference No 319, London, UK.
Intelligent Sensing for Innovative Structures (ISIS) (2001). "Strengthening reinforced concrete structures with externally-bonded fibre reinforced polymers." Design Manual No. 4,Winnipeg, Canada.
Intelligent Sensing for Innovative Structures (ISIS) (2006). "Monograph on durability of fiber reinforced polymers in civil infrastructure." Winnipeg , Canada.
Kachlakev, D., and McCurry, D. D. (2000). "Behavior of full-scale reinforced concrete beams retrofitted for shear and flexural with FRP laminates." Composites Part B: Engineering, 31(6-7), 445-452.

257
Khalifa, A., Gold, W. J., Nanni, A., and Aziz, A. (1998). "Contribution of externally bonded FRP to shear capacity of flexural members." ASCE Journal of Composites for Construction, 2(4), 195-203.
Khoury, G. A. (2000). "Effect of fire on concrete and concrete structures." Progress in Structural Engineering and Materials, 2(4), 429-447.
Klamer, E. L., Hordijk, D. A., and Hermes, M. C. J. (2008). "The influence of temperature on RC beams strengthened with externally bonded CFRP reinforcement." Heron, 53(3), 157-185.
Klamer, E. L., Hordijk, D. A., and Janssen, H. J. M. (2005a). "The influence of temperature on debonding of externally bonded CFRP." Special Publication, 230, 1551-1570.
Klamer, E. L., Hordijk, D. A., and Janssen, H. J. M. (2005b). "The influence of temperature on the debonding of externally bonded CFRP." Proceedings of 7th International Symposium on Fiber Reinforced Polymer (FRP) Reinforcement for Concrete Structures (FRP7RCS), Kansas City, 1551-1592.
Kodur, V. K. R. (1999). "Fire resistance requirements for FRP structural members." Annual Conference of the Canadian Society for Civil Engineering, Saskatoon, Canada, 83-95.
Kodur, V. K. R., Ahmed, A., and Dwaikat, M. B. (2009). "Modeling the fire performance of FRP-strengthened reinforced concrete beams." Composite & Polycon, American Composites Manufacturers Association (ACMA), Tampa, Florida.
Kodur, V. K. R., and Ahmed, A. (2010). "A numerical model for tracing the response of FRP-strengthened reinforced concrete beams exposed to fire." in Press: ASCE Journal of Composites.
Kodur, V. K. R., and Baingo, D. (1998). "Fire resistance of FRP reinforced concrete slabs." IRC Internal Report No. 758, Institute for Research in Construction, National Resrach Council of Canada, Ottawa, ON, Canada.
Kodur, V. K. R., and Dwaikat, M. (2008). "A numerical model for predicting the fire resistance of reinforced concrete beams." Cement and concrete composites, 30(5), 431-443.
Kodur, V. K. R., and Harmathy, T. Z. (2008). Properties of building materials, National Fire PRotection Association, Quincy, MA.

258
Kodur, V. K. R., and Sultan, M. A. (2003). "Effect of temperature on thermal properties of high-strength concrete." Journal of Materials in Civil Engineering, 15(2), 101-107.
Kodur, V. K. R., Bisby, L. A., and Green, M. F. (2006). "FRP retrofitted concrete under fire conditions." Concrete International, 28(12), 37-44.
Kodur, V. K. R., Wang, T. C., and Cheng, F. P. (2004). "Predicting the fire resistance behaviour of high strength concrete columns." Cement and concrete composites, 26(2), 141-153.
Kumar, A. (2003). "Behavior of RCC Beams after Exposure to Elevated Temperatures." Journal of the Institute of Engineers (India) : Civil Engineering Division, 84(3), 165-170.
Lan, Y. M., SoteIino, E. D., and Chen, W. F. (1998). "State-of-the-art Review of Highway Bridge Columns Retrofitted with FRP Jackets." Structural Engineering Rep. No. CE-STR-98-5, School of Civil Engineering, Purdue Univ., West Lafayette, Ind.
Leone, M., Matthys, S., and Aiello, M. A. (2009). "Effect of elevated service temperature on bond between FRP EBR systems and concrete." Composites Part B, 40(1), 85-93.
Lie, T. T. (1992). "Structural fire protection." ASCE Committee on Fire Protection, Structural Division, American Society of Civil Engineers, New York, NY, 225-229.
Lie, T. T., and Irwin, R. J. (1993). "Method to calculate the fire resistance of reinforced concrete columns with rectangular cross section." ACI structural Journal, 90(1), 52-60.
Lie, T. T., and Kodur, V. K. R. (1995). "Thermal properties of fibre-reinforced concrete at elevated temperatures." Institute for Research in Construction, National Research Council of Canada, Ottawa, Ont., Internal Report, 683.
Lie, T. T., and Kodur, V. K. R. (1996). "Thermal and mechanical properties of steel-fibre-reinforced concrete at elevated temperatures." Canadian Journal of Civil Engineering, 23(2), 511-517.
Maeda, T., Asano, Y., Sato, Y., Ueda, T., and Kakuta, Y. (1997). "A study on bond mechanism of carbon fiber sheet." Proceedings of 3rd International Symposium, Sapporo, Japan, 279-286.

259
Mallick, P. K. (1993). Fiber-reinforced composites: Materials, manufacturing, and design, Marcel Dekker, New York, NY.
Mallik, P. K. (1988). Fiber reinforced composites: Materials, manufacturing and design, Marcel Dekker Inc., New York.
Mayo, R., Nanni, A., Gold, W., Barker, M., and Rolla, M. O. (1999). "Strengthening of Bridge G270 with externally-bonded CFRP reinforcement." SP-188, American Concrete Institute, Proc., 4th International Symposium on FRP for Reinforcement of Concrete Structures(FRPRCS4), Baltimore, MD.
Meier, U. (1995). "Strengthening of structures using carbon fibre/epoxy composites." Construction and Building Materials, 9(6), 341-351.
Meier, U., and Kaiser, H. (1991). "Strengthening of structures with CFRP laminates." Advanced Composite Materials in Civil Engineering Structures – ASCE Specialty Conference, Las Vegas, Nevada, 224–232.
Mouritz, A. P. (2002). "Post-fire flexural properties of fibre-reinforced polyester, epoxy and phenolic composites." Journal of Materials Science, 37(7), 1377-1386.
Neale, K. (2001). "Strengthening Reinforced Concrete Structures with Externally Bonded Fibre Reinforced Polymers. Design Manual No. 4." ISIS Canada, Winnipeg, Man.
Nelson, G. L. (1995). "Fire and polymers: an overview." Procedings Fire and Polymers II, ASC Symposium Series 599, Washigton DC, 1-26.
Neves, I. C., Rodrigues, J. P. C., and Loureiro, A. D. P. (1996). "Mechanical properties of reinforcing and prestressing steels after heating." Journal of Materials in Civil Engineering, 8(4), 189-194.
Papadopoulos, A. M. (2005). "State of the art in thermal insulation materials and aims for future developments." Energy and Buildings, 37(1), 77-86.
Pei, N., and Pilakoutas, K. (2003). "Concrete beams with externally bonded flexural FRP-reinforcement: analytical investigation of debonding failure." Composites Part B: Engineering, 34(4), 327-338.
Pellegrino, C., and Modena, C. (2002). "Fiber reinforced polymer shear strengthening of reinforced concrete beams with transverse steel reinforcement." Journal of Composites for Construction, 6, 104.

260
Purkiss, J. A. (2007). Fire safety engineering design of structures, Butterworth-Heinemann, UK.
Purser, D. A. (2000). "Toxic product yields and hazard assessment for fully enclosed design fires." Polymer International, 49(10), 1232-1255.
Rahman, A. H., Taylor, D. A., and Kingsley, C. Y. (1993). "Evaluation of FRP as reinforcement for concrete bridges." ACI, Special Publication, 138, 71-86.
Ritchie, P. A., Thomas, D. A., Lu, L. W., and Conelly, G. M. (1991). "External reinforcement of concrete beams using fiber reinforced plastics." ACI structural Journal, 88(4).
Saad, M., Abo-El-Enein, S. A., Hanna, G. B., and Kotkata, M. F. (1996). "Effect of temperature on physical and mechanical properties of concrete containing silica fume." Cement and Concrete Research, 26(5), 669-675.
Saadatmanesh, H., and Ehsani, M. R. (1991). "RC beams strengthened with GFRP plates. I: Experimental study." Journal of Structural Engineering, 117(11), 3417-3433.
Sato, Y., Kimura, K., and Kobatake, Y. (1997). "Bond behavior between CFRP sheet and concrete (Part 1)." Journal of Structural and Construction Engineering, 500, 75-82.
Schneider, U. (1988). "Concrete at high temperatures--A general review." Fire Safety Journal, 13(1), 55-68.
Scott, D. W., Lai, J. S., and Zureick, A. H. (1995). "Creep behavior of fiber-reinforced polymeric composites: a review of the technical literature." Journal of Reinforced Plastics and Composites, 14(6), 588-617.
Shahrooz, B. M., and Boy, S. (2004). "Retrofit of a Three-Span Slab Bridge with Fiber Reinforced Polymer Systems—Testing and Rating." Journal of Composites for Construction, 8, 241-247.
Shahrooz, B. M., Boy, S., and Baseheart, T. M. (2002). "Flexural Strengthening of Four 76-Year-Old T-Beams with Various Fiber-Reinforced Polymer Systems: Testing and Analysis." ACI, 681-691.
Shin, K. Y., Kim, S. B., Kim, J. H., Chung, M., and Jung, P. S. (2002). "Thermo-physical properties and transient heat transfer of concrete at elevated temperatures." Nuclear Engineering and Design, 212(1-3), 233-241.

261
Sorathia, U., Dapp, T., and Beck, C. (1992). "Fire performance of composites." Material Engineering, 109(9), 10-12.
Tadeu, A. J. B., and Branco, F. J. F. G. (2000). "Shear Test of Steel Plates Epoxy-Bonded to Concrete Under Temperatures." Journal of Materials in Civil Engineering, 12(1), 74-80.
Takeda, K., Mitsui, Y., Murakami, K., Sakai, H., and Nakamura, M. (1996). "Flexural behaviour of Reinforced Concrete Beams Strengthened with Carbon Fiber Sheets." Composites Part (A), 27 A, 981-987.
Tanaka, T. (1996). "Shear resisting mechanism of reinforced concrete beams with CFS as shear reinforcement." Graduation Thesis, Hokkaido University, Japan.
Teng, J. G., Chen, J. F., Smith, S. T., and Lam, L. (2002). FRP-strengthened RC structures, John Wiley & Sons Inc.
Teng, J. G., Lam, L., and Chen, J. F. (2004). "Shear strengthening of RC beams with FRP composites." Progress in Structural Engineering and Materials, 6(3), 173-184.
Toutanji, H. A., and Gomez, W. (1997). "Durability characteristics of concrete beams externally bonded with FRP composite sheets." Cement and Concrete Composites, 19(4), 351-358.
Toutanji, H. A., and Gomez, W. (1997). "Durability characteristics of concrete beams externally bonded with FRP composite sheets." Cement and Concrete Composites, 19(4), 351-358.
Triantafillou, T. C. (1998). "Strengthening of structures with advanced FRPs." Progress in Structural Engineering and Materials, 1(2), 126-134.
Uomoto, T., Mutsuyoshi, H., Katsuki, F., and Misra, S. (2002). "Use of fiber reinforced polymer composites as reinforcing material for concrete." Journal of Materials in Civil Engineering, 14, 191.
Van Geem, M. G., Gajda, J., and Dombrowski, K. (1997). "Thermal Properties of Commercially Available High-Strength Concretes." Cement Concrete and Aggregates, 19, 38-54.
Waldron, P., Byars, E. A., and Dejke, V. (2001). "Durability of FRP in Concrete: A State of the Art." Proceedings of the International Workshop on Composites in Construction: A Reality, 92-101.

262
Wang, Y. C., and Hsu, K. (2009). "Design recommendations for the strengthening of reinforced concrete beams with externally bonded composite plates." Composite Structures, 88(2), 323-332.
William, B., and Richard, D. (1990). A first course in the finite element method, Irwin, Inc., Boston, MA.
Williams, B. K. (2004). "Fire performance of FRP-strengthened reinforced concrete flexural members," Doctoral Thesis, Queen’s University, Kingston, Canada.
Williams, B., Bisby, L., Kodur, V. K. R., Green, M., and Chowdhury, E. (2006). "Fire insulation schemes for FRP-strengthened concrete slabs." Composites Part A, 37(8), 1151-1160.
Williams, B., Kodur, V. K. R., Green, M. F., and Bisby, L. (2008). "Fire endurance of fiber-reinforced polymer strengthened concrete T-Beams." ACI Structural Journal, 105(1), 60-67.
Wu, Z. S., Iwashita, K., Yagashiro, S., Ishikawa, T., and Hamaguchi, Y. (2004). "Temperature Effect on Bonding and debonding Behaviour Between FRP sheets and Concrete." FRP Composites in Civil Engineering (CICE), 905-912.
Yang, X., and Nanni, A. (2002). "Lap Splice Length and Fatigue Performance of FRP Laminates." ACI Materials Journal, 99(4), 386-392.
Yuan, H., and Wu, Z. (1999). "Interfacial fracture theory in structures strengthened with
composite of continuous fiber." Proceedings of the Symposium of China and Japan, Science and Technology of the 21st Century, Tokyo, Japan, 142–155.
Yuan, H., Wu, Z., and Yoshizawa, H. (2001). "Theoretical solutions on interfacial stress transfer of externally bonded steel/composite laminates." Structural Earthquake Engineering, 18(1), 27-40.
Zhang, Z., Hsu, C. T. T., and Moren, J. (2004). "Shear strengthening of reinforced concrete deep beams using carbon fiber reinforced polymer laminates." Journal of Composites for Construction, 8, 403.


![Strengthening Defected Dam Gates under Cavitation ...journals.modares.ac.ir/article-15-25449-fa.pdf · bonded FRP [7] Failure mode analyses of reinforced concrete beams strengthened](https://img.dokumen.tips/doc/110x75/5fb90acd0c818f6d767fedcb/strengthening-defected-dam-gates-under-cavitation-bonded-frp-7-failure-mode.jpg)