Embed Size (px)
Citation preview

BEFORE TIlE WYOMING PUBLIC SERVICE COMMISSION
IN TI-IS MATTER OF TIlE APPLICATION OFMONTANA-DAKOTA UTILITIES CO,. ADIVISION OF MDU RESOURCES GROUP. INC., ) DOCKET NO. 300 13-297-GR-I4FOR AUTHORITY TO ESTAI3]JSII A TOTAL ) (1UCORD NO. l39)2)ANNUAL INCREASE IN DISTRIBUTIONREVENUES OF $788,160 OR 4.13 PERCENT )
DIRECT TESTIMONY OF
I3rycc J. Freeman
On behalf of the Wyoming 0111cc of Consumer Advocate
Filed March 2, 2015Hearing May 19, 2015
0CA66

i INTRODUCTION AND QUALIFICATIONS
2 Q. PLEASE STATE YOUR NAME, ADDRESS AND OCCUPATION.
3 A. My name is I3ryce J. Freeman. My business address is 2515 WalTen Avenue, Suite 304,
4 Cheyenne, WY, 82002. I am the Administrator of the Wyoming Office of Consumer
5 Advocate (OCA). The OCA is an independent consumer advocacy agency that was
6 created by an act of the legislature in the 2003 general session.
7 Q. WhAT IS TIlE FUNCTION OF TilE OCA?
.s A. Pursuant to W.S. § 37-2401,
9 The office of consumer advocate shall represent the interests of Wyoming
10 citizens and all classes of utility customers in matters involving public
ii utilities. In the exercise of its powers the office of the consumer advocate
12 shall consider all relevant factors, including, hut not limited to, the
13 provision of safe, efficient and reliable utility services at just and
14 reasonable prices.
:5 Q. ARE TIlE ANALYSES AND RECOMMENDATIONS OF TIlE OCA, IN THIS OR
16 ANY OTHER CASE BEFORE THE COMMISSION, INFLUENCED OR
17 DIRECTED BY TIlE COMMISSION?
is A. No. Although thc OCA is a division within the Commission according to W.S. § 37-2-
19 401, it is a separate division with no reporting or supervisory links to the Commission. The
20 OCA has the right under W.S. § 37—2—402(u) to appeal decisions of the Commission that it
21 does not find in the public interest. The only link between the OCA and the Public Service
22 Commission is the source of common funding provided by the assessment on gross utility
23 operating revenues; this assessment funds both the Conmiission and the OCA.
24 Additionally, as Administrator of the OCA, I report directly to the Governor of Wyoming.
llryce J. Freeman 1 Docket Number 30013-297-GR-14
0CA67

1 Q. PLEASE DESCRIBE YOUR EDUCATIONAL BACKGROUND AND
2 OCCUIATIONAL EXPERIENCE.
3 A. I received a Bachelor of Science degree in business administration from Uc University of
4 Wyoming in 1982. The arca of concentration in my undergraduate work was statistics.
5 After graduating from the University of Wyoming, I was employed for three years by the
6 Laramie County Treasurer as Deputy Treasurer, and then for six years by the Wyoming
7 Department of Revenue as a Principal Appraiser dealing primarily with utility valuation
8 and capital cost issues. I came to the Wyoming Public Service Commission in April of
9 1994, in the capacity of Senior Economist, serving in that position for approximately two
10 years. In 1996 I accepted a position as Lead Rate Analyst in the rates and pricing section
ii on the Commission Staff, and in May of 2003 I was appointed Administrator of the OCA.
12 In July of 2004, I was appointed to a two-year term of service on the board of the Wyoming
13 Infrastructure Authority (WIA). In July of 2006, I was reappointed to a four year term and
14 in 2010, 1 was appointed to a second four year term on the WIA Board. In March of 2014,
15 after ten years of service as Secretary of the WIA Board, I rotated off of the WIA Board.
16 Also in 2004, 1 was elected to the position of Secretary ofthc National Association of State
17 Utility Consumer Advocates (NASUCA), which isa national trade association composed
IS primarily of state chartered consumer advocate offices throughout the country. In
19 November of 2010, 1 stepped down as NASUCA Secretary and currently serve on the
20 NASUCA Executive Committee. My present and past participation in both of these
21 organizations provides me with unique knowledge and experience upon which I can draw
22 in lbrmulating advocacy positions on behalf of Wyoming utility consumers.
23 In 2010, 1 was appointed by the Board of Directors of the Western Electricity Coordinating
24 Council (WECC) to serve as a consumer representative on the Scenario Planning Steering
25 Group (SPSG). The SPSG was created to facilitate the development of a Regional
26 Transmission Expansion Plan (RTEP) pursuant to a contract that WECC entered into with
27 the U.S. Department of Energy (DOE). Funding for the RTEP project was provided by
28 DOE under the terms of the American Recovery and Reinvestment Act (ARL4).
29 Additionally, in Mvember of 2011, I was appointed by the WECC Board of Directors to
30 serve on the WECC Transmission Expansion Policy Planning Committee (TEP.PC), a
Biyce J. Freeman 2 Docket Number 30013-297-GR-14
0CA68
I WFCC i3oard committee, My participation in WECC and in the RTEP project is another
2 source of unique and valuable insight into regional electricity issues that assist me in
3 advocating for the interests of Wyoming consumers.
4 Finally, in December of 201 1, 1 was elected to serve on the Advisory Council of the Center
5 for Public Utilities at New Mexico State University. The Center for Public Utilities (CPU)
6 provides training programs and current policy issues conferences to meet the needs of
7 professionals employed at federal and state commissions, utility companies, and other
8 stakeholders in the electricity, natural gas distribution, interstate pipeline,
9 telecommunications and water utility industries.
10 Q. hAVE YOU TESTIFIED BEFORE TH IS COMMISSION IN PREVIOUS
I I PROCEEDINGS?
12 A. Yes. Ihave detailed the cases in which I have testified before this Commission in Appendix
13 A, attached to my testimony. I have also offered testimony before the Federal
14 Communications Commission, the Federal Energy Regulaton’ Commission and the United
15 States Congress.
lü Q. ON WhOSE BEHALF DO YOU APPEAR HERE TODAY?
17 A. I appear here today on behalf of the OCA. As I indicated previously, the OCA is an
18 independent party in this proceeding, separate and apart from the Commission or its
19 advisory staff.
20 Q. AS A MEMBER OF THE OCA, DO YOU ADVOCATE TIlE INTERESTS OF
21 CERTAIN GROUPS OF CONSUMERS OVER OTHERS?
22 A. No. As a member of the OCA, it is my statutory obligation to advocate the best interest
23 of all citizens in the state. Specifically, W.S. § 37-2-401 states that the OCA “shall
24 represent the interests of Wyoming citizens and all classes of utility customers in matters
25 involving public utilities.[emphasis added]” This public interest standard requires the
26 OCA to represent the broadest possible utility consumer constituency, even though some
27 of those consumers may also be represented independently as parties in this case. The
28 OCA is responsible for balancing the positions and recommendations of the Company,
Riyce J. Freeman 3 Docket Number 3001 3-297-GR-14
0CA69

and of other parties, to arrive at a set of recornnwndations that serve the overall long tern
public interest.
3 Q. ARK YOU SPONSORING ANY CXIIIBITS IN TillS PROCEEDING?
4 A. Yes, I am sponsorinu OCA Exhibits 202.1 through 202.5. 1 will idcntif and describe these
5 exhibits later in my testimony.
6 Q. IN TIlE COURSE OF YOUR REVIEW OF TIllS MATTER, DID YOU USE
7 INFORMATION ThAT TIlE COMPANY DEEMED CONFIDENTIAL?
a A. No.
9 Q. DOES YOUR TESTIMONY AND/OR EXHIBITS CONTAIN INFORMATION
10 TIE AT THE COMPANY tEAS DEEMED CONFIDENTIAL?
ii A. No.
12 PURPOSE
t: Q. WhAT IS TIlE PURPOSE OF YOUR TESTIMONY IN TillS PROCEEDING?
14 A. The puqiose of my testimony in this proceeding is to support the OCA’s overall
15 recommended revenue increase in this proceeding. More particularly, my testimony will
In address the appropriate rate of return to be allowed on Montana Dakota Utility Company’s
17 (MDU or Company) invested capitol, the OCA’s recommended proportion of debt and
IS equity capital to be included in MDU’s capital stmcWre, and the OCA’s recommended
19 overall weighted average cost of capital (WACC). OCA witness Anthony Ornelas wifl
20 address the balance of the issues in the case including revenue requirement, cost of service
21 and rate design. In my testimony I will provide a detailed description of the data and
22 methods that I used to derive my recommendations in this proceeding. I will discuss the
23 function of capital cost in setting rates for regulated public utilities such as MDU, general
24 factors that influence the cost of capital required by investors to finance utility investments
25 and market benchmarks that provide some insight into the range of returns currently being
26 demanded by investors in competitive capital markets. I will also provide a current cost of
27 equity analysis for MDU, which 1 have developed independently, that shows that the returnBryce J. Freeman 4 Docket Number 30013-297-GR-14
oCA7O

on equity (ROE) being requested by MDU in this proceeding is excessive and should be
2 reduced to a level more consistent with cunent capital market dynamics. I will combine
3 my ROE recommendation with recommendations on the apnropnate cost of debt and
4 capital structure to arrive at a recommended overall weighted average cost of capital
5 (WACC). Throughout lily testimony I will reference the testimony of Company witness 3.
6 Stephen Gaske who sponsors MDU’s recommended ROE, noting some areas where lie and
7 I agree and many areas where we disagree, and the reasons thcrefbre.
My testimony iii this proceeding is offered in conjunction with that of Mr. Omclas. The
9 analysis and recommendations of the OCA in this proceeding are offered as a package by
10 the OCA and are intended to provide the Commission with a basis upon which to make a
II determination consistent with the public interest in this case.
12 Q. AS A PRELIMINARY MATTER, WHAT RETRUN IS MDU SEEKING IN TillS
13 PROCEEDING?
14 A. MDU is seeking an overall WACC of 7.859% as noted in the testimony of Mr. Garret
15 Scngcr.’ MDU’s proposed capital structure consists of 42.435% long term debt, 4.564%
short term debt, l.4Q9% preFerred stock and 51.502% common equity.2 MDU requests
17 that the Commission approve a cost of long tenn debt of 6.092%, a cost ofshoft term debt
of 1.209%, a return on preflwred stock of 4.577%, and a return on common equity of
19 10.00%. Combining the relative proportions for each of the sources of capital with MDU’s
20 proposed cost, as described above, yields a proposed WACC of 7.659%.’
21 COST OF CAPITAL - BACKGROUND
22 Q. WHAT IS THE FUNCTION OF THE COST OF CAPITAL IN THE CONTEXT OF
23 RATEMAMNG?
Direci Testimony of Garret Scngcr, page 4.2 Direct Testimony of J. Stephen Ciaske. page 4.‘ibid.
Bryce J. Freeman 5 Docket Number 30013-297-GR-14
OCA71

1 A. For ratemaking purposes, the cost of capital is the amount of profit, or return that a
2 regulated utility is allowed to earn on the capital, both debt and equity, that it has invested
.3 in the utility enterprise. The utility must acquire this capital from private investors in
4 competitive securities markets. Those investors have a wide variety of choices regarding
5 where and when to invest their dollars, ranging from mutual hinds to investments in
6 individual stocks or bonds. Private investors are driven by a desire to maximize their
7 returns while minimizing their risks.
8 For private companies not subject to rate regulation, the amount ofreturn that can he earned
9 is limited only by the demand lbr a company’s product or service, the company’s ability to
10 supply that demand and the ability of management to acquire capital and manage costs.
11 For regulated utilities, on the other hand, the judgment of the regulator supplants the
12 operation of the competitive market in detennining what level of return is sufficient to
13 induce investors to provide scarce capital dollars. In either case, however, the investor
14 makes his decision based on the expected return relative to the perceived risk of the
15 investment.
IC, From this perspective setting the appropriate authorized return for regulated utilities is
17 exceedingLy important. It the regulator sets the rate of return too low in companson to
IN investors’ perceived risk, then investors will price shares of the utility lower, increasing
19 the yield to a level that reflects investors’ market return expectations. Under these
20 circumstances the utility will find it difficult to attract and maintain capital investments.
21 Conversely, if the return is set too high, investors will price the shares higher, reducing the
22 yield to a level consistent with investors’ perceived risk. In this way the market is self-
23 coneeting. hut in the latter situation ratepayers would be needlessly burdened with higher
24 rates that are not necessary to attract and maintain capital investment. This fundamental
25 risk return relationship applies to every market security as shown in the classic Security
26 Market Line (SML):
Bryce J. Freeman 6 Docket Number 300 13-297-GR-14
0CA72

The figure above graphically depicts the relationship between risk and return from a market
view point. Securities that have less perceived risk, such as U.S. Government debt
obligations also have a lower return and tend to cluster in thc lower left of the graph. As
the perception of risk increases so does the market return demanded by investors. Moving
up the XML we find the returns for the corporate debt of large investment grade companies
and fiwther up still are the returns lhr the common equity of those same eompames.
Although not shown in the figure, the returns for mid-size and smaller investment grade
companies would appear even further up the SML from large company stocks. Small cap
companies and non-investment grade securities would occupy the extreme upper right hand
eoiner of the graph. Theoretically, it one can accurately determine the difThrenee between
any two of the points on the XML, often releLTed to as the “Risk Premium,” then an estimate
of the market cost of capital can he made. The importance of this basic relationship
between risk and return will become even more apparent as I discuss the appropriate return
fbr MDU later in my testimony.
17 Q. HAS THIS RELATIONSHIP BETWEEN RISK AND RETRUN BEEN ADOPTED
is AS A LEGAL STANDARD IN RATEMAKING PROCEEDINGS?
Bryce J. Freeman 7 Docket Number 300 13-297-GR-14
Retain
SecLirily Market Line
I quny l{,k Prcininiii
Coiporile Bond Rik
I ‘rd iii ti iii
Stock Yield
Coipunile Bond Yield
Risk‘3
3
4
‘I
6
7
S
Jo
II
12
13
14
is
16
0CA73

I A. Yes, the critical importance of this relationship in determining an allowed rate of return
2 has been recognized by the U.S. Supreme Court when it established the capital attraction
3 and maintenance standard. This standard was established in two precedent setting cases;
4 Federal Power Commission v. I lope NaturLd Gas Co., 320 U.S. 59! (1944), and lllueficld
5 262 U.S. 679 (1923). These cases are often
6 referred to collectively as the “Hope and Bluetield” standard. In Bluelield the Court found
7 that:
8 A public utility is citlitled to such rates as will permit itto earn a return on the value of the
9 properly which it employs for the convenience of the public equal to that generally being
10 made at the same time and in the same general part of’ the country on investments in other
11 business umfcnakings which are attended by corresponding, risks and uncertainties
12 In flqpc the Court confirmed its finding in Bluefleld (hat utility shareholders must be
13 adequately compensated fbr the risk assumed in utility investments when it ibund that:
14 the return IC) the equity owner should be commensurate with returns on
15 investments in other enterprises having corresponding risks....
16 The return should be reasonably sufficient to assure confidence in the financial
17 soundness of the utility, and should he adequate, under etticient and econoin ical
IS management, to maintain and support its credit and enable it ID raise the money
19 necessary Thr the proper discharge of its public duties.
20 The Court also found, titter alto, that regulation is not a guarantee of profitability, that the
21 property being earned on must be devoted to public service, and that the appropriate return
22 to be granted depends on the Ihets and circumstances at the time the deteminaiion is made
23 and may change from time to time owing to changes “affecting opportunities for
24 investment, the immey market, and business conditions generally”.
25 MARKET RISK DYNAMICS
26 Q. WHAT ARE THE GENERAL FACTORS THAT INFLUENCE RISK IN
27 FINANCIAL SECURITIES?
28 A. There are a wide variety of factors that influence risk in financial securities as perceived
29 by investors. Risk that cannot be diversified away by holding a large portfolio of
Bmyce J. Freeman S Docket Number 30013-297-GR-14
0CA74

diversified securities is often referred to as systematic or market risk. Market risk includes
2 such factors as expected levels of interest rates and inflation, monetary and fiscal policies,
3 and the general level of economic growth and activity anticipated by investors when an
4 investment decision is made. To one degree or another systematic risk affects the value of
5 all market securities and cannot be diversified away by holding a large portfolio of
6 securities.
7 Non-systematic, or business risk embodies the risk of holding a particular security and
6 includes factors such as the characteristics of the particular market and industry in which
the company issuing the security operates, the ability of management to generate revenue
10 and control costs, and the ability ofIlw company to attract capital on reasonable terms. For
ii rcgmlated utilities, business risk also includes regulatory risk or the risk that the regulator
12 will set rates for utility services at a level that fails to produce the return expected by the
13 investor when the investment was made.
14 Investors consider all of these risk factors when making investment decisions. The essence
15 of risk relative to the financial markets is the probability that realized returns will he lower,
due to the risk factors cited above, than the return anticipated by the investor when the
17 investment was nmde, The higher the probability of lower realized returns the higher the
16 initial return demanded by the investor. Put another way, the higher the perceived risk that
19 actual Thture returns will be lower than anticipated, the lower the present value, orprice, of
20 the security.
21 Q. WHAT IS YOUR ASSESSMENT OF TIlE CURRENT MARKET RISKS FACING
22 MDU?
23 A. There arc certainly risks associated with holding the debt and equity securities of private
24 companies in today’s market place. The general level of expected economic activity is an
25 important driver in the growth, or decline as the case may be, in demand for utility services.
26 Economic activity can be measured broadly by examining the factors that drive economic
27 activity such as unemployment levels, wage and compensation levels, labor productivity,
28 interest rates, monetary policy, and economic output as measured by Gross Domestic
29 Product (GDP).
Bryce J. Freeman 9 Docket Number 30013-297-GR-14
OCA7S

As the Commission is ‘el1 aware the nation’s economy is continuing to slowly recover
2 from a severe recession that began in 2008 and lasted for about two years. Since the end
3 of the recession, national unemployment has declined horn a high of 1 O% in 2009 to its
4 present level of5.7%4. However, the labor force participation rate has remained stubbornly
5 low over that same period, declining from about 66% in 200% to around 63% currently5.
6 Year over year growth in wages for the year ending December 2014 was 2.l%6 while
7 inflation increased at •%%7 over that same period which indicates modest growth in
8 disposable income. It should be noted, however, that most of the decline in the overall rate
of inflation is due to the declining price of crude oil over the Last six months. The decline
10 in crude oil is partially offset by a sharp rise in the price of food. Excluding the two volatile
ii categories of food and energy, the inflation rate was 1.6% in 201 4. Generally, consumers
12 are hesitant to make long term spending commitments based on price reductions in these
13 two volatile commodity categories. Since consumer spending drives about 70% of
14 economic activity in the U.S. economy, the level of unemployment and the growth in wage
15 compensation are important factors contributing the consumption of goods and services
16 measured by GDP.
37 Growth in GDP has similarly been laclclustcr since the recovery began in 2010. During the
period 2010 to 2014 the annual average rate of growth in real GD? (not adjusted for
19 inflation) has been 2.l2% which compares to a long tenn average growth in real GDI of
20 3.3%. The Congi-essional Budget Office (CR0) expects the growth in real GDP over the
21 period to 2024 to average 2.3%10, consistent with projections of the U.S. Department of
U.S. Department of Labor. Bureau of Labor Statistics, littp:h data.bls.gov/rimeseries/LNS 14000000.U.S. Department of Labor, Bureau of Labor Statistics. http:tidata.bls.gov/timeseñes/LNSI 1300000.U.s. Department of Labor, Bureau of Labor Statistics. Iittp://www.bls.gov/web/eci/ecicois.pdfU.S. Department of Labor, Bureau of Labor Statistics, http://www.hls.gov/newsselease/pdf’cpi.pdf.
8 Ibid.U.S. Department of Agriculture. lit(p:J/www.ers.usd&gov/data-products/intemational-itiacroceonomic-dataset ,aspx.
Congressional I3udgct Office. THE BUDGET AN]) ECONOMIC OUTLOOK: 2014 TO 2024.http://w’ww.cho.gov/sitcs/deFaulUfi]es/cbofilcs/attachments/45010-OutIook2OI4Feb.pdf
I3ryce J. Freeman 10 Docket Number 30013-297-GR-14
0CA76

I Agriculture which projects real (IDP growth of 2.6%’ over the period to 2030. Both of
2 these projections are significantly lower than the historic rate of growth in real GDI.
3 According to the US. Bureau of Labor Statistics (IlLS), labor three productivity gains
4 since the end of the recession have been essentially in line with average productivity gains
5 realized over the period from 1987 through 2013. The 13LS reports that during the period
6 2010 through 2013 average annual growth in productivity was 2.95% while the average
7 over the period 1987 through 2013 was 2.9%.l2 Productivity gains in this range are
S consistent with the slow economic growth that has occurred since the end of the recession
9 and is expected to continue over the long term as cited above.
10 U.s. monetary and fiscal policy is equally uncertain. In response to the to the financial
11 crisis that developed in late 2008, and which precipitated the ensuing recession, the U.S.
12 Federal Reserve Bank (Fed) quickly reduced its short term lending rates to near zero in
13 order to stimulate economic growth. It also created a number of lending facilities and loan
14 purchase programs to increase the liquidity of the U.S. credit market. Further, it initiated
15 three rounds of “quantitative easing” or the purchase of long dated U.S. Treasury debt
designed to reduce the cost of long term borrowing and spur capital investment. At the
17 same time the U.S. Congress appropriated approximately $787 billion under the American
IS Recovery and Reinvestment Act (ARRA) iii order provide immediate economic stimulus
31) in the tbrm of funding for infrastructure investments as well as temporary relief fhr
20 dislocated workers.
21 As the economy has continued on its slow trajectory ofrecoveiy, many of the extraordinary
22 measures undertaken by the Fed to increase liquidity and provide shod term economic
23 stimulus by casing credit have ended. The grants and loans authorized under ARRA. have
24 long since been disbursed. But, the Fed is continuing to keep short term interest rates only
25 marginally ahove zero although it has indicated that it may begin raising interest rates
26 sometime later this year. Presumably these actions would precipitate an increase in long
U.S. Dcpaflrnen( of Agriculture. hItp:/!www.ers.usda.gov/data-producL.aspx.12 U.S. Department of Labor, Bureau of Labor Statistics, http:Hwww.bls.govhnfp/mprdload.htm.
Bryce J. Freeman 11 Docket Number 300 13-297-GR-14
0CA77

term interest rates, the interest that is paid on long dated bonds and other securities used by
2 utilities and industrial companies to finance large capital investments. However, no such
3 market effect has been observed. In hict, as the Fed has continued to prepare the market
4 for increasing interest rates, interest rates on corporate debt have actually declined
5 significantly as shown in the chart below’3:
FRED — 30-Year Treasury Constant Maturity Rate— Moody’s Seasoned Aaa Corporate Bond YieId©— Moody’s Seasoned Baa Corporate Bond Yield®
Jan 2013 May 2013 Sep 2013 Jan 2014 May 2014 Sep 2014
Shaded areas indicate US recessions - 2015 research.stiouisled.org
7 Rates on long term corporate and government debt are now about at the same level they
8 were during the period olaggressive monetary intervention by the Fed, although they have
9 recently ticked up slightly, as shown in the graph below’4:
Federal Reserve Bank oF St. Lrnis, FRED Economic Data,http;//research.sdouistbd.org/fred2/graplv?id—WGS30YR.
‘ Ibid.
Bryce J. Freeman 12 Docket Number 3001 3-297-GR-14
OCA7S

Cw
0)a
1 Shaded areas indicate US recessions - 2015 resear&.st$ouisIed.org
2 Q. WHAT DOES ALL OF TillS PORTEND FOR TIlE FUTURE OF THE UTILITY
3 INDUSTRY?
4 A. Based on the inthrmation discussed above, it certainly appears that the U.S. economy cmi
5 expect an extended period of slow economic growth. Since energy is a basic input into the
6 production of goods mid services, the fortunes of the utility industry arc tied quite closely
7 to the health of the overall economy mid it is likely that utilities will see subdued growth
8 quite similar to that of the overall economy. Electric load growth, for example, is likely to
9 he flat or declining fbr an extended period of time lessening the need for utilities to finance
10 large capital investments in new generation mid transmission infrastructure. In turn this
1] will lessen the construction and fnancing risk that utilities, including MDU, would
12 otherwise thee if demand were increasing.
Investors choose to hold equity shares for a number of reasons but, a relatively important
element of an investor’s decision to invest in a particular share is the growth in dividends
and share price appreciation expected to be derived from owning the share. This is
particularly true for utility companies which typically pay out a greater proportion of their
earnings in the fonTi of dividends than the average publicly traded company. Since a
Bryce J. Freeman 13 Docket Number 30013-297-GR-14
FRED — 30-Year Treasury Constant Maturity Rate— Moodys Seasoned Ma Corporate Bond VIeW®
Macdye Seasoned Baa Corporate Bond YIeId©
9
8
7
6
5
4
3
2Jan 2009 Jan 2010 Jan 2011 Jan 2012 Jan 2013 Jan 2014
13
11
15
16
17
OCA7B

utility’s ability to grow dividends is directly correlated with its ability to grow earnings it
2 is the potential growth in earnings that is of interest to investors. Generally speaking there
3 are two ways to grow earnings; increase revenue or cut cost. In today’s economic
4 environment, with flat to declining loads and diminished need tbr large capital investments
5 it will be difficult kw utilities to grow earnings. Cost containment can be an effective way
6 to increase earnings in the short term but there is a limit to how much costs can be cut
7 before service quality and reliability suffer. Prospective growth, both for privately held
S companies, including utility companies, as well as the overall economy, is likely to be quite
9 low for the foreseeable future. Investors recognize this and have priced shares accordingly.
io Q. IS THERE EVIDENCE THAT WE CAN OBSERVE IN THE MARIT ThAT
it SUPPORTS TILLS IIYPOTIIISIS?
12 A. Yes, a simple examination of market dividend yields supporis this hypothesis in general
ii terms. The dividend yield is simply the ratio of expected dividends in the next period to
14 the current stock price. The current dividend yield on the dividend paying stocks included
IS in the S&P 500 stock index is currently l.87%’ while the yield on the Dow Jones Utilities
Index is 3.1 5%)h This strongly suggests that utility equity investors understand that
17 prospects for growth in the utility industry arc limited in comparison to the broader market,
is thus they demand more of their return upfront in the form of dividend yield in order to
19 balance the value of utility shares against the value of alternative equity investment
20 opportunities that may have lower expected dividends but higher potential for growth. It
21 should he noted, however, that the dividend yield for the comparable utility shares tracked
22 by the Value Line Investment Survey exceeded 5% at the time of MDU’s 2008 rate case.
23 So, even though utility dividend yields are much higher than those of the broader market,
24 they have in fact declined, consistent with declining yields in the broadermarket, indicating
25 a general decrease in investors’ perceived risk.
‘ MuIpl.com, S&P 500 Dividend Yield, http://www.mullpI.com/s-p-500-dividend-yieJd/.16 Dow Jones Utility Average Fact Sheet,
http://nw.djindexcs.cuinlmdsidx/downloads/factinfo/l)ow_Joncs_UtilityAveragc _Fuct_Sheetpdf
Hiyce J. Freeman 14 Docket Number 30013-297-GR-14
OCA8O
i BUSINESS RISK
2 Q. WhAT ARE THE RISKS PECULIAR TO TIlE GAS UTILITY INDUSTRY OR
MDU ITSELF THAT ARE NOT REFLECTED iN TIlE RISK FACTORS THAT
4 YOU IIAVE ALREADY DISCUSSED?
5 A. In addition to the market risk factors discussed above. MDU is also subject to certain
6 discrete risk factors that do not factor into overall market risk. As I discussed earlier in my
7 testimony, business risk is attributable to such fhctors as the particular industry and market
S in which a company operates, the ability of the company and its management to grow
9 earnings, and the degree to which the company’s financial policies either enhancc or
10 degrade its prospects to grow earnings in the future.
Ii For example, a company that operates in a relatively small geographic area, such as MDU’s
12 nawral gas service territory, can expect to be dependent to a greater degree on the health
13 of the local economy than a company that operates in a larger territory within a state or in
14 multiple states. Source Gas, for instance, which operates in many states, is able to diversify
15 the risk of a cyclical economic downturn in any particular service area in which it operates
16 since it is likely that some or all of its other service areas would experience a
7 contemporaneous counter—cyclical upturn. In both cases, however, utility shareholders
28 would benefit from the Ihet that MDU and Source Gas are both afforded the protection of
19 the regulatory compact that does not inure to non-regulated companies.
20 Similarly, from a business risk perspective, MDU benefits from its association with MDU
21 Resources, a very large and diversified holding company. Being a part of the MDU
22 Resources corporate family in effect allows MDU Utilities to diversi1’ away a large part
23 of the shareholder risk that would otherwise he present if MDU Utilities were a stand-alone
24 company.
25 Q. DO YOU AGREE WITH DR. GASIC’S ASSERTION THAT THE SMALL SIZE
26 OF MDU’S WYOMING UTILITY OPERATIONS WARRANT A LARGE RISK
27 PREMIUM IN COMPARISON TO OTHER UTILITIES?
Bryce 3. Freeman 15 Docket Number 300 IJ-297-GR-14
0CAS1

I A. Absolutely not. Dr. Gaske argues that based on lbbot.son Associates data, unregulated
2 firms that are similar in size to MDU’s Wyoming natural gas distribution operations enjoy
3 a size premium of 1,460 basis points over the average return on long term corporate bonds
4 and that his recommended ROE is low in comparison. 17 Dr. Gaske frirther argues that a
5 size premium adjustment ofat least 100 basis po nts over the return required by the typical
6 [natural gas] proxy company is warranted. IS
7 What Dr. Gaske fills to recognize is that MDU is not a small cap company comparable to
8 those referenced in the Tbbotson publication. Investors cannot purchase a share of equity
9 in MDU Resources that represents only the Wyoming gas utility operations. Rather, when
10 investors purchase an equity share of MDU Resources they are purchasing the right to
ii receive dividends derived from the earnings of all of MDU Resource’s operations. MDU
12 Resources is a large diversified holding company with a market capitalization of
13 approximately $5 billion which Value Line classifies as a “large cap” company.
14 If Dr. Gaske wishes to estimate the required return for only the Wyoming gas distribution
Is operations of MDU Resources there are other, more accurate ways to do so. For example,
Dr. Gaske could have performed what is commonly called a divisional cost of capital
17 analysis. Dr. Roger Morin devotes an entire chapter in his hook “New Regulatory Finance”
18 to the topic of “Divisional Cost of Capital and CAPM Applications”.’0 As discussed by
Dr. Morin there arc many techniques that can he used to estimate the required return on
20 discrete assets or operations of larger companies. Most of these techniques revolve around
21 attempting to measure the difference in risk, primarily on a subjective basis, between the
22 assets or operations held as part of a larger corporate thmily and the estimated risk if they
23 arc assumed to he held and operated as a stand-alone enterprise. The most common
24 measure of risk in a divisional cost of capital analysis is beta which is a statistical measure
25 of the price volatility of equity shares in comparison to the overall market. I will describe
Direct Testimony ofJ. Stephen Caske, page 26.Direct Testimony nfl. Stephen (iaske, page 29.New Regulatory Finance. Dr. Roger Mona, Chapler 7.
Biyce J. Freeman 16 Docket Number 3001 3-297-GR- 14
0CA52

the application ofbeta as measure of rislc in more detail later in my testimony. But for now,
2 this brief description provides a convenient segway into my next point regarding Dr.
3 Gaske’s flawed logic on the subject of size premia.
4 As correctly pointed out by Dr. Gaske, nearly all of the companies tracked by Ibbotson in
5 its size premia deciles are unregulated companies and not comparable to utility companies
6 generally or MDU utilities specifically. This is obvious when one observes the average
7 betas associated with each of the deciles taken from the Duff & Phelps Cost of Capital
8 I-Iandbook2° whose size premia data are based on data provided by Jbbotson Associates.
9 For example, Duff & Phelps calculates the average beta for companies included in the
10 smallest sized market capitalization decile, where MDU’s gas utility operations would fall
ii if viewed on a stand-alone basis, to be 1.40. The resulting size premium for companies in
12 tIns decile, as recommended by Duff& Phelps, is 5.99%, or 599 basis points, not the 1,460
13 basis points suggested by Dr. Gaske.
14 We can see from the average beta, however, that even this size premium adjustment is
15 inconsistent with any measure of comparable risk. Companies comprising this decile are
16 the smallest of the small, almost entirely unregulated companies, and as such exhibit betas
17 that are wholly incomparable to that of regulated utilities. For instance, the average beta
1% for the natural gas distribution and eomhinatum electric and gas companies followed by
19 Value Line is .77. The market is assumed to have a beta of 1.0 implying that the Value
20 Line gas and combination utilities are, on average 23% less risky than the market. With a
21 beta of 1.40, Dr. Gaske would have us believe that MDU’s Wyoming gas operations are
22 40% more risky than the market overall, simply due to its small size. By contrast, my
23 proxy group of comparable companies, the derivation of which I will describe later in my
24 testimony, have an average heta of .75. These are highly regulated companies that derive
25 a majority of their revenue from natural gas and electric utility operations and are far more
202014 Cost of Capital Handbook; Guide to Cost of Equity, Duff& Phclps, LLC.
Ntyee J. Freeman 17 Docket Number 3001 3-297-GR-14
OCAB3

I comparable than the unregulated companies contained iii the smallest market cap size
2 decile published by Duff & Phelps.
3 To put an even finer point on this argument. the companies that comprise the top decile of
4 capitalization, the largest of the large, have an average beta of .91 considerably higher than
5 the average for the Value Line gas and electric companies. Duff & Phelps suggests that
6 the size premium for these companies should actually he negative at -.3H% meaning that
7 the market risk premium should he adjusted downward for companies of this size and risk.
8 Assuming an average beta more consistent with that of the regulated utilities followed by
9 Value Line would suggest that the size premium advocated by Dr. Gaske should, in fact,
10 be negative.
Ii I3ascd on the forgoing discussion, it is my opinion that attempting to make a size premium
12 adjustment based on published size premium data for regulated utilities in general, and
13 specifleally for MDU in this proceeding, is inappropriate and will lead to a ross
14 overstatement of the required market equity return lbr MDU in this case. Importantly, one
15 of the methods for properly assessing the required return on equity fbr an operating division
In ofa larger diversified company, as discussed by Dr. Mona in his book, is the “Pure Play”
17 method. In this method the analyst seeks to estimate ROE using financial and market data
IS fiom proxy companies that are as nearly comparable as possible to the subject operating
19 division. As I will describe later in my testimony that is essentially the method that I have
20 used to arrive at my recommended ROE in this proceeding.
21 Q. 110W 511010 INVESTMENT RISK BE ACCOUNTED FOR IN A COST OF
22 EQUITY ANALYSIS?
23 A. In the development of my recommendations on cost of capital I assess the risk faced by the
24 utility in the same manor that investors assess risk, on a relative basis. It is a relatively
25 simple matter to identify individual factors that might influence the risk faced by a subject
26 utility. The question then becomes; are those risks extraordinary or in addition to the risks
27 being faced by similarly situated companies. Going back to the tenants of the Hope and
28 Bluefield decisions, a utility return should be comparable to those of similar companies
29 attendcd by similar risk. I can find no rational basis upon which to attribute greater risk to
Bryce J. Freeman 18 Docket Number 30013-297-GR-14
OCAB4

MDU than the companies in my proxy group and therefore recommend an ROE that is
2 consistent with the expected returns for my proxy group.
3 COMPARABLE COMPANIES
4 Q. IN LIGhT OF TILE FOREGOING DISCUSSION OF RISK, 110W DID YOU
5 BEGIN YOUR ANALYSIS OF THE APPL{OPRIATE ROE FOR MDU?
6 A. I began my analysis in this proceeding, as I customarily do, by gathering data from the
7 Value Line Investment Survey (Value Line) on the folly one companies classitied by Value
8 Line as natural gas distribution or combination natural gas and electric utility companies.
9 Unlike Dr. Gaske who included only natural gas distribution companies in his proxy, I
10 included combination natural gas and electric utilities in my proxy group since MDU is a
ii combination natural gas and electric utility. Excluding combination utilities which are
12 comparable in practice to MDU would umiccessarily limit the sample size of comparable
13 companies (Value Line lists only 12 natural gas distribution companies) increasing the
14 probability that the data will not be random and fttily representative oCMDU.
15 The object of this exercise is to gather publicly available financial information for
16 companies that are as comparable to MDU as possible so that information can he used to
17 generate a cost of equity estimate. As outlined in the Hope and Bluefield cases discussed
18 earlier, MDU is entitled to a return on its investment in plant and fitcilities devoted to public
utility service that is commensurate with returns being earned by comparable companies
20 with similar risk. The sample group of companies, after incomparable companies are
21 eliminated, will become the basis of the comparative analysis required under I-lope and
22 Bluefield.
23 From Value Line I gathered such infhnnation as capital structure, growth in earnings,
24 dividends and book value, estimated dividends, estimated return on equity and estimated
25 earnings per share. I supplemented the Value Line information with information from AUS
26 Utility Reports which reports bond ratings and the relative percentage of regulated
27 revenues for the companies in Value Line, I obtained share price information from the
28 Wall Street Journal Online Edition and, in addition to Value Line, I took analyst’s earnings
Hxyce J. Freeman 19 Docket Number 3001 3-297-GR-14
OCAS5

I growth forecasts from Yahoo Finance and Zacks Investment Research both of which are
2 available on ii ne.
3 Afler gathering this data on the forty one companies [bilowed by Value Line I screened the
4 companies to assure comparability with MDL. First. I eliminated companies for which 1
5 could not obtain complete and use[bl financial information from Value Line. _Additionallv,
6 since MDU Resource’s (MDU’s parent company) bond rating is BBB+ from S&P (MDU
7 is not rated by Moody’s Investor Service), I restricted the companies in my sample group
8 to those with a bond rating of at least 131311 from S&P. I also eliminated companies with
9 unstable financial histories and fOr which dividends and earnings are not expected to grow
10 in the future. I also required each of the proxy companies to derive at least 70% of their
11 total revenue from regulated utility operations.
12 Finally, I also eliminated companies that are currently engaged in merger or acquisition
13 activities. Such activity tends to skew the price that investors are willing to pay fOr a share
14 of the utility based on anticipated gains or losses resulting from the merger or acquisition
15 rendering any comparison made against that company unreliable. The resulting set of
thirteen companies shown in OCA Exhibit 202.1 are highly comparable to MDU. Dr.
17 Gaske’s ROE estimate relies on eight proxy companies, only two of which are included in
18 my proxy group.
19 CONSTANT GROWTH DCF MODEL
20 Q. WHAT WAS THE NEXT STEP IN YOUR ANALYSIS?
21 A. following my selection of a suitable group of sample companies I calculated various
22 indicators of the cost of equity capital for each, including the basic Constant Growth
23 Discounted Cash Flow (DCF) model, three versions of the multi-stage DCF model, and a
24 Capital Asset Pricing Model (CAPM) indicator. I also calculated a quarterly compounding
25 version of the DCF model. However, my quarterly DCF model is substantially different
26 than that of Dr. Gaske. I will describe the theoretical underpinnings, data requirements,
27 assumptions used and results of each of these indicators in my testimony below.
Biycci. Freeman 20 Docket Number 300 t3-297-GR-14
OCAS6

I Q. PLEASE DESCRIBE THE CONSTANT GROWTH DCF MODEL AND ITS
2 RKSULTS.
3 A. Certainly. The Premise of the DCF model is that investors make their decision to invest in
4 the equity shares ofa company based on the present value of the future cash flows expected
5 to he derived from the investment. Reducing the future cash flows to a present value
enables investors to easily compare available investment opportunities. Notationally, the
7 classic DCF formulation is expressed as fifilows:
8
9 D1 + D2 Dn(1-g) 1po= + + x
1(1 1 +K (1 ÷K)2 (1 i-K)’’ K—q (1 i-K)
II
12 Where: Kr= Cost of Equity
13 = Dividend in Period 1
14 = Current Stock Price
15 g = expected growth in dividends
1 ‘ The DCF model noted above can he simplified and expressed in the form traditionally used
17 by investors to ascribe a price to a share of stock which embodies all of the liflure cash
is flows that the owner expects to receive as a result of the ownership of that share. The
19 traditional share valuation model is expressed as fbllows:
20 n
131 +9P0 (K)t
23 Where: All variables arc as previously listed
24 As can be seen from this derivation, the investor is interested in ascertaining the price that
25 should he paid for a share given that the investor already knows what rate he or she will
26 usc to discount the future revenue stream and what growth rate can he expected in the form
27 of growth in dividends and share price appreciation. The regulator, however, is interested
28 in determining the implicit discount rate and rate of growth given the observable price that
Bryce J. Freeman 21 Docket Number 3001 3-297-GR-14
0CA87
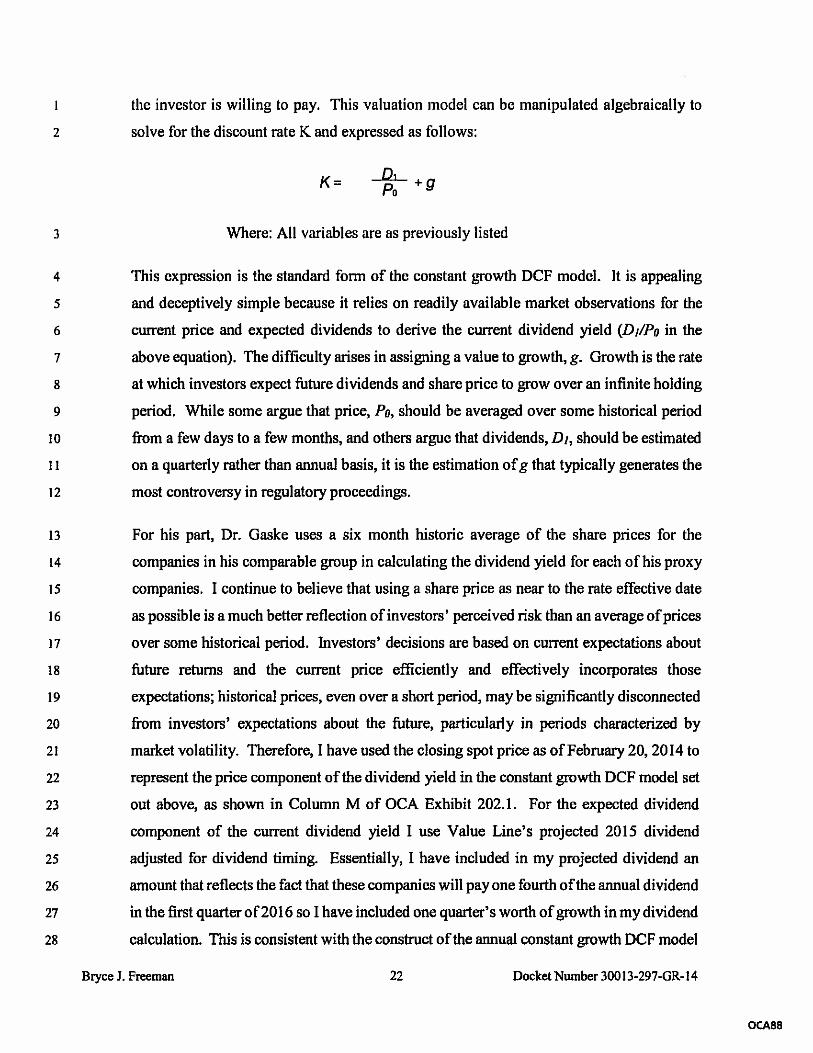
the investor is willing to pay. This valuation model can be manipulated algebraically to
solve for the discount rate K and expressed as follows:
K=
3 Where: All variables are as previously listed
4 This expression is the standard fonTl of the constant growth DCF model. It is appealing
5 and deceptively simple because it relies on readily available market observations for the
6 current price and expected dividends to derive the current dividend yield Wi/Fo in the
7 above equation). The difficulty arises in assigning a value to growth, g. Growth is the rate
8 at which investors expect future dividends and share price to grow over an infinite holding
9 period. While some argue that price, Fg, should be averaged over some historical period
Jo from a few days to a few months, and others argue that dividends, Di, should be estimated
11 on a quarterly rather than annual basis, it is the estimation ofg that typically generates the
12 most controversy in regulatory proceedings.
13 For his part, Dr. Gaske uses a six month historic average of the share prices for the
14 companies iii his comparable group in calculating the dividend yield for each of Ins proxy
15 companies. I continue to believe that using a share price as near to the rate effective date
16 as possible is a much better reflection of investors’ perceived risk than an average ofprices
J7 over some historical period. Investors’ decisions are based on current expectations about
18 future returns and the current. price efficiently and efThctively incorporates those
19 expectations; historical prices, even over a short period, may he significantly disconnected
20 from investors’ expectations about the future, particularly in periods characterized by
21 market volatility. Therefore, I have used the closing spot price as of February 20, 2014 to
22 represent the price component of the dividend yield in the constant growth DCF model set
23 out above, as shown in Column M of OCA Exhibit 202.1. For the expected dividend
24 component of the current dividend yield I use Value Line’s projected 2015 dividend
25 adjusted lbr dividend timing. Essentially, I have included in my projected dividend an
26 amount that reflects the fact that these companies will pay one fourth of the annual dividend
27 in the first quarter of 2016 so I have included one quarter’s worth of growth in my dividend
28 calculation. This is consistent with the construct of the annual constant growth DCF model
Biyce J. Freeman 22 DocketNumber 30013-297-GR-14
OCAB8

I which culls for expected dividends in the next period (year), The calculated dividend yield
2 for each company is shown in Column N of that same exhibit.
3 As shown in Column 0 of that exhibit, I also made an adjustment to the dividend yield of
4 each company to reflect the costs associated with issuing equity. Similar to the issuance
5 oF utility debt securities there is a cost associated with issuing equity. for example, legal,
underwriting and marketing expenses. For debt instruments these fees are customarily
7 included in the cost of debt and amortized over the life of the security. For equity however,
8 there is no obligatory schedule of dividend payments and thereffire it is necessary to adjust
9 the dividend yield in order to properly reflect the fact that expenses are incurred in the
10 issuance of equity. Ignoring those costs deprives the utility of earning a full return on its
II outstanding equity, if only by a very small amount.
12 In developing my floatation cost adjustment I relied on the data provided in Dr. Gaske’s
13 Exhibit JSG 2, Schedule 2, which is a computation of the actual floatation costs associated
14 with equity issuances by natural gas distribution companies over the period 2000 to 2014.
15 The approximate average of the floatation costs, 4%, associated with these issuances is
16 reasonably consistent with floatation costs estimates that I have seen in the past and I have
17 no reason to question their validity. I do object, however, to the way in which Dr. Gaske
18 incorporates his fioatation cost estimate into his DCF analysis.
19 Dr. (iaske mistakenly multiplies the end result of his basic DCI? calculation by 1.04 to
20 account 11w floatation costs, effectively increasing his estimated ROE by as much as 50
21 basis points. The appropriate method to account for fioutation costs, on the other hand, is
22 to adjust the dividend yield in the DCF model to account for floatation costs as follows:2’
23 rDIP(l—f)+g
1E New Regulatory Finance, Dr. Roger Modn, page 328.
Biyce J. Freeman 23 Docket Number 30013-297-GR-14
OCAB9

The difference between the standard DCF model and the floatation adjusted model is that
2 the dividend yield, Di/P, is divided by 1- f (floatation cost estimate). This is because the
3 cost of issuing equity reduces investors’ yield but does not impact the future growth
4 expected by those same investors, The treatment of growth between the two models is
5 identical. The example in the table below show’s the magnitude of Dr. Gaske’s mistake,
6 assuming a dividend yield ol’3%, floatation costs of4% and growth of %:
(;askeFloatatitniAtbustnwia”
r=D1/P —g rDi/I’(I —o Eg r(Di/P -g)x(1 —0
.03 I .05 .08 8% (.031%) * .05 = .08125 = 6.125% (.03 + .05) x 1.04 = .0832 832%
7
S My flotation cost adjustment effectively adjusts the estimated cost of equity upward by
9 increasing the dividend yield by an average of approximately 15 basis points.
10 Q. WHAT ESTIMATE OF GROWTH HAVE YOU USED IN CALCULATING THE
11 CONSTANT GROWTH DCF MODEL?
12 A. There are several methods that an equity analyst can use to estimate the growth component
13 required in the constant growth DCF model. I’ll begin with earnings growth estimates
14 provided by professional equity market analysis. Prolbssional equity market analysts
15 Ibliow the shares of many publicly traded companies. By analyzing the underlying
16 pedbmiance of the issuing company, equity analysts project future pedbrnianee according
17 to such metrics as revenues, returns, earnings mid dividends per share, price earnings ratio,
Is and others. These analysts routinely publish their projections iii the trade press and those
19 projections are widely relied upon by investors when formulating their investment
20 decisions. They are also a widely used source of information for Commissions in making
21 return determinations in cases such as the instant ease.
22 1 have used three separate sources of analysts’ growth estimates in my constant growth
23 DCF model; Value Line, Yahoo Finance and Zacks Investment Research. The five year
24 earnings growth estimate, which is the longest projection made by analysts, is shown in
25 Columns P, S and T of OCA Exhibit 202.1. I rely exclusively on earnings growth estimates
Bryce J. Freeman 24 Docket Number 30013-297-GR-14
ocAgo

in my analysis because earnings growth provides the cash with which dividends arc paid
2 and because Value Line is the only estimating service that provides dividend growth
3 estimates; Yahoo and Zacks provide only earnings growth estimates. In theory, assuming
4 a constant dividend payout ratio, earnings and dividends would grow at the same rate in
5 any event.
6 1 weighted the growth estimates from each reporting source equally in my calculation of
7 the constant annual growth DCF model. The results ofmy constant growth DCF indicator
8 using analysts’ projections of growth, and adjusting for floatation costs, are shown in
q Column AF of OCA Exhibit 202.1. The median constant growth DCF indicator for the
10 proxy group is 8.93%
11 Q. D[D YOU CONSIDER OTJIER METhODS OF ESTIMATING GROWTH IN
12 YOUR ANALYSIS AS WELL?
13 A. Yes. I also incorporated a long term projection of GDP growth based on both historic and
14 estimated growth in GDP into the various versions of my constant growth DCF model. In
15 addition, I also included an estimate of sustainable growth in one version of my constant
16 growth DCF model. I will describe all of these indicators more fully below.
17 Incorporating growth in long term GDP as a proxy for growth in the DCF model is based
Is on the premise that over the very long term a company’s earnings growth cannot he
19 sustained at a level higher than that of the overall economy. During shorter periods
20 earnings may grow laster or slower than GDJ but over the long term earnings will revert
21 to the mean level of growth tin the economy as a whole. From a theoretical perspective
22 the theory is sound. But, in practice it has precisely the same short-corning as that of other
23 methods of projecting growth; specifically, estimating the rate of future GDP growth.
24 Historic GDP growth is well documented and widely available in the public domain. For
25 example, the Federal Reserve Bank of St. Louis provides information on both nominal and
Hiyce J. Freernan 25 Docket Number 30013-297-GR-14
OCA91

I real GDP growth from I 947 to the present.2— During this period GDP growth averaged
2 6.6%, ranging from a high of 14.5% in 1973 to a low of-l% in 2007. Between 1990 and
3 2007 nominal (iDI growth ranged generally between approximately 4% and 6%. The
4 graph below shows nominal GDP growth over the period 947 to present as well as
5 projected GDP to 2024;
Nominal GDP Growth16.0%
14.0% -—- - — -—
12.0% - —
________________ ___________________________
10.0% -
____________ _____________________________________________
‘C
8.0% - —
________________ _____________________________
0
CD6.0%----—
CD
4.0%----
2.0% - —________________________________ ——
____
0.0%--- ————— —______________
m in Q’ r-4 Lu co v-I N 0 m tO Ci r’J In CO — 0 rO to Q’ nJin in in to to to N- N- N CO CO CO CO Cl Cl Cl 0 0 .-l — — flJ
Cl O Ql Cl Cl Cl Cl Cl Cl Cl Cl Cl Cl Cl Cl Cl 0 0 0 0 0 0 0 0-2.0% r — - — — —- - —- v4 rt — - - .—L .—f nS. NJ -NJ _nj NA- NJ-_NA_NJ-
6
7 As I have done in past cases in which I have testified before the Commission, I have relied
8 upon the historic nominal GDP growth rate data provided by the Federal reserve bank of
9 St. Louis for the period 1953 to present, weighted to more recent years, in formulating my
10 estimate of future GDP growth based on historic GDP growth.
11 In my analysis I have weighted each observation according to its chronological place in the
12 data set. For instance, the observation for 1953 gets only one sixtieth of the weight of the
13 observation fOr 2013 in my analysis. My method considers all observations in the data set
22 Federal Resent Bank i,JSt. Louis, http://research.stlouisfed.nrgffred2/eategoriesilO6.
Hiyce J. Freeman 26 Docket Number 3001 3-297-GR-14
0CA92

1 but gives proportionally more weight to more recent GDP growth rates. My analysis results
2 in an estimated GD1 growth rate of3% based on weighted historic nominal growth in CDI’
over the period 1953 to present. Incorporating this estimate of growth into my constant
4 growth DCF model results in a median estimated cost of equity of 6.88% Ibr my sample
5 group of companies as shown in CoLumn AG of OCA Exhibit 202.1.
6 Q. DO YOU BELIEVE ThAT TillS A REASONABLE ESTIMATION OF LONG
7 TERM CDP CR0WTII IN TIlE FUTURE?
8 A. None of us knows with any degree of certainty how GDP will grow in the flflurc,
9 particularly over the type of infinite time horizon assumed in the DCF model. Therefore,
10 we are required to make some assumptions and judgments to arrive at a growth rate that
11 reasonably represents a plausible future growth rate. After all, we are hying to measure
12 investors’ expectations about the future since the exercise of measuring capital cost is
13 meant to support the capital attraction and maintenance standard established in the Hope
14 and Bluefield cases. It is not unreasonable to assume that future growth, both for individual
15 companies and the economy in general, will follow the same broad patterns that it has in
the past. From that perspective, my estimate of GDP growth based on historic observation
17 is plausible, but there are certainly other estimates of future GDP growth that may be a
18 more accurate representation of investors’ tbture expectations for growth. In weighing this
particular indicator I give it no weight in my final estimation of ROE for MDL
20 Q. WHAT OTHER ESTIMATES OF GDP GROWTH IfAVE YOU CONSIDERED IN
2! YOUR DCF ANALYSIS?
22 A. Although there are many sources of GDP growth estimates, some public and some private,
23 1 have used the estimates provided by the Congressional Budget Office (CBO) in its
24 publication: The Budget and Economic Outlook: 2015 to 2025. The CBO is a non-partisan
25 organization that provides budget, monetary, economic and policy analysis to the U.S.
26 Congress. Its analysis and estimates are widely relied on by Congress, Federal Agencies
27 and the private sector in formulating spending and investment decisions. The CBO’s
28 analytical methods are as credible as any other available source. The CBO estimates that
29 U.S. GDP ‘viii grow at an annual average rate of 4.3% over the period 2014 through 2025
Byce J. Freeman 27 Docket Number 30013-297-C R.-14
OCA9J

with real GDP growth averaging 2.3%. This implies an annual average rate of inflation of
2 2%.
3 I also looked at GDI’ growth estimates developed the USDA as reibreneed earlier in my
4 testimony.23 In its analysis the USDA estimates that real GDP will grow at an average rate
5 of approximately 2.6% over the period to 2024. The USDA’S analysis is based on
6 information from the World Bank. the International Monetary Fund, Il-IS Global Insights
7 and Oxford Economics, among others. If inflation continues to average 2% over that same
S period then nominal GDP growth will average about 4.6% to 2024, consistent with the
9 estimates provided in the CBO publication discussed above. Although both the CBO and
10 USDA expect GDP growth to increase slightly in 2015 and 2016, both organizations expect
ii GDP growth to fall back in the later years of the forecast period. Incorporating the CBO’s
12 estimate of annual average nominal GDP growth into my constant growth DCF model
13 results in a median estimated cost of equity of 8.18% as shown in Co]umn AH of OCA
14 Exhibit BJF 202.1.
IS Q. IS TIlE CBO ESTIMATE OF FUTURE GDP GROWTH CREDIBLE AND
lo REASONABLE IN YOUR OPINION?
7 A. Absolutely. As I indicated earlier, the CBO’s economic and budget projections are widely
is used and relied upon by both government and private entities. Some market analysts argue
10 that some government firecasts for lower GDP growth are biased downward since they are
20 based on an assumption of permanently low inflation of around 2%. In fact, Dr. Gaske
21 suggests that inflation will increase substantially in the future and by extension long term
22 interest rates will rise as well.24 However, a 2% annual inflation rate is widely recognized
23 as the inflation rate that the Federal Reserve Bank’s Federal Open Market Committee
24 (FOMC) is targeting with its monetary policy tools. It is also identical to the inflation rate
25 of 2.0% implicitly incorporated into the CRO’s GDP growth projections.
23 Un;ed States Department of Agriculture, Economic Research Service.products/intemational-macroeconomic-data-set.aspx.
24 Direct testimony of J. Stephen (iaske, page 12.
Hiyce 3. 1-reeman 2.5 Docket Number 30013-297-GR-14
0CA94

As further support for the efficacy of a long term inflation rate in the range of 2% we need
2 only observe in the market what actual investors expect inflation to be over the long term.
3 The LS. Treasury issues 30 year Treasury Bonds which are currently yielding 2.72% (as
4 oflebruary 20, 2015). It also issues 30 ycarTreasury Inflation Protected Securities (TIPS)
5 which are currently yielding .7%. Purchasers of 30 year Treasury l3onds, if held to
maturity, will earn the coupon rate on the face of the bond. Purchasers of TIPS earn a
7 return that is indexed to the rate of inflation. The difference between the yield on a 30 year
a bond and a TIPS is the implicit rate of inflation expected by real investors investing real
9 dollars in Treasury securities. The current diflbrenee, 2.02% (272% - .7% 2.02%),
10 representing investors’ expected inflation rate, is entirely consistent with the inflation rate
1 assumed by the CR0 in its long term GDP projections and the Federal Reserve Bank’s
12 target inflation rate. In my view, the GDP growth projections made by the CBO are hoth
II reasonable and credible.
14 Q. DID YOU CONSIDER ANY OTHER CROWTH PROJECTIONS LN YOUR
15 CONSTANT GROWTh DCF ANALYSIS?
lo A. Yes, I also looked at a projected rate of growth based on the sustainable growth rate
17 approach similar to that provided by Dr. Gaske. Sustainable growth is based on the premise
is that future growth in dividends (which are derived from earnings) can only occur if a
portion of the earnings that would otherwise he paid out in dividends is reinvested in the
20 company.25 The level of sustainable growth (aka the retention ratio growth method) is
2! expressed as:
22 ghxr
23 where “b” is the fraction of earnings retained and “r” is the expected return on the book
24 value of equity. Value Line publishes expected earnings and dividends per share from
25 which a retention ratio (h in the above equation) can be derived, as well as the expected
25 New Regulatory Finance Dr. Rogcr Mohn, page 303.
Bryce 3. Freeman 29 Docket Number 30013-297-(IR-14
0CA95
I return on equity. These calculations are shown in Columns U through Y of’ Exhibit OCA
2 202.1. The resulting median sustainable growth rate of 4.19% is shown in Column Y of
3 that exhibit. Combining the sustainable growth rate with the floatation adjusted dividend
4 yield for each company in my sample group produces an cstimate of the cost of equity for
5 MDU of 7.91% as shown in Column AF ofOCA Exhibit 202.1.
6 Q. IS TillS A RELIABLE METhOD OF PROJECTING GROWTh?
7 A. It can be. But, just like all other methods and sources, it has its short comings. The
S information that I have used from Value Line to calculate sustainable growth is projected
9 information. There is always an element of uncertainty associated with projections.
10 Additionally, the Value Line projections are the work of a single analyst rather than a
11 consensus of many analysts, making those projections less reliable than, for example, the
12 multiple analysts’ opinions I include in the analysts’ growth rate threcast that I described
13 earlier. Finally, analysts are predicting earnings growth in the range of 5% and the CHO
14 is predicting GDP growth in the range of 4.3%. At 4.19% the sustainable growth rate is in
is the range of both analysts’ and government fOrecasts for growth. I should also note that
lo Dr. Gaske recommends a much higher retention growth rate, approximately 5%26, than I
17 do.
1$ Since Dr. (Jaske and I both use the same methodology and Value Line source data to
N compute our respective sustainable growth rate estimates, it appears that the difference in
20 the two estimates is related primarily to the proxy groups that we are using. Dr. Gaske
21 limits his proxy group of comparable companies to natural gas distribution companies and
22 consequently his sample group is much smaller than mine. For the reasons discussed
23 earlier in my testimony I also include combination electric and gas utilities in my proxy
24 group. There also may he some minor differences in our sustainable growth estimates due
Direct Testimony of J. Stephen Gaske, Exhibit JSG 2, Schedule 4. page 3.
Bryce J. Freeman 30 Docket Number 30013-297-GR-14
0CA96

to the lhct that I used the most current edition ofValue Line to make my sustainable growth
2 estimate.
3 NON-CONSTANT GROWTH DCF MODEL
4 Q. DID YOU ALSO CONDUCT DCF ANALYSES BASED ON TILE PREMISE THAT
5 GROWTH IS NOT CONSTANT INTO PERPETUITY?
6 A. Yes. I computed three versions of the non-constant growth DCF model incorporating
7 different combinations of the various growth rates discussed previously. The non-constant
x growth DCF (NCDCF) model is predicated on the assumption that dividends will grow at
9 some constant rate in the near term and a constant hut different rate thereafter. For this
10 analysis I have assumed that analysts’ growth rate projections are the most reliable
1 I estimation of growth over the next five years and that after the initial five year period
12 growth will revert to the long term mean growth rate of GDP, either based on historical
13 observations or based on the estimates provided by the CBO as discussed earlier. I also
14 developed an NCDCF estimate based on my sustainable growth estimate.
15 Essentially, my NCDCF model is an Internal Rate of Return (IRR) calculation that projects
the cash flows associated with owning a share of the equity of each of the companies in my
17 sample group over the next 150 years. This is technically not an infinite time period hut is
is certainly longer than the useful life of utility assets or the investment time horizon of the
19 typical utility equity investor. Notationaily, the internal rate of return is given by rin the
20 following equation:
NPV=Z =°(1 + r)’
21 ii=t)
22
23 Where: NPV = net present value
24 n=periodn
25 N total number of periods26 C,1 = cash flow in period n
27 The IRR Thnction iteratively solves the above equation for r, or the discount rate that
28 equivocates all future cash flows to the NPV or the current share price, expressed as a
Bn’ce J. Freeman 31 Docket Number 30013-297-GR-14
0CA97

negative cash flow, The results of my NCDCF calculations are shown in Exhibits OCA
2 BJF 202.2. 202.3 and 202.4. finch ofthese exhibits begins with the Live year analyst growth
.1 forecast described earlier and substitutes the C130 estimated GOP growth rate, the long
4 term historic GDP growth i-ate, and the sustainable growth rate, respectively, for the second
5 stage or long term growth rate. As shown on the exhibits, the results of my NCDCF
6 analyses range from 8.73% to 10.59%.
7 Q. DID YOU ALSO CONDUCT A QUARTERLY DCF ANALYSIS?
x A. Yes, as I mentioned earlier in my testimony, I also conducted a quarterly DCF analysis.
The quarterly DCF model is a slightly modified version of the basic constant growth DCF
10 model discussed extensively above. In the quarterly DCF model the fact that public
11 companies typically pay dividends on a quarterly basis is accounted for in calculating the
12 dividend yield. Therefore, the quarterly DCF model takes the form27:
[<1i(l+K) + d2(1+Kr + d3( I +K)’ ±
K= P0 +g
13 Where: K = Cost of Equity
4 d = Dividends in Quarters 1 —4
15 Po = Current Share Price
16 g = Growth
17 The essence of the quarterly compounding DCF model is that since dividends are paid on
lx a quarterly basis they are available to be reinvested, also on a quarterly basis, thus
10 compounding their value to the shareholder. This concept is not unlike what is experienced
20 when on places money in an interest bearing account that pays compound interest. For
21 example, most pass-book savings accounts pay interest on the amount in the account at the
22 end of the period, including any interest payments paid in previous periods. In this way
23 the account pays interest not only on the original principal sum invested (simple interest)
27 New Regulatory Finance, Dr. Roger Morin, page 344.
Brycej. Freeman 32 Docket Number 30013-297-GR-14
0CA98

I but on the accumulated interest as well (compound interest). The quarterly compounding
2 DCF model is based on exactly the same premise.
3 The quarterly DCF model is solved iteratively, which is made much easier iismg a
4 computer spreadsheet application. Fssentiall’, one substitutes values for K on the right
5 side of the equation until those values exactly equal K on the left hand side of the equation.
6 In OCA Exhibit BJF 2.5, Columns Al through AL, I show the results of my quarterly DCE
7 analysis, again showing results based on the four different growth estimates discussed
8 earlier in my testimony. I should also note that I have again adjusted the yield in my
9 quarterly DCF model to reflect floatation costs. The results of my quarterly DCF analysis
10 range from 6.98% to 9.06%.
II Q. DO YOU hAVE ANY OBSERVATIONS REGARDING DR. GASKE’S
12 QUARTERLY DCF ANALYSIS?
13 A. My understanding of Dr. Gaske’s quarterly DCF analysis is that it is actually not a quarterly
14 compounding DCF model at all. Rather, Dr. (Iaske assumes that the next dividend to he
15 received by investors will he received between one and three months hence and simply
If, assumes that his estimate of growth will apply to dividends paid after that time. In effect,
17 Dr. Gaske is merely adjusting the dividend to reflect an arbitrary point during the next
is period (year) when dividends will grow. This in no way accounts for the compounding
effect that would occur ifone assumes that dividends are reinvested on a quarterly basis.
20 To be sure, if dividends are expected to grow during the period (year) then the growth in
21 dividends should be accounted for as well. But, that is an entirely separate matter from the
22 compounding that results from quarterly dividend reinvestment. In my analysis I account
23 for the expected growth in dividends over the next year, as I discussed earlier in my
24 testimony, by including one quarter’s worth of growth from 2016. As a practical matter,
25 privately held companies, including those in my proxy group, typically make dividend
26 distribution decisions on an annual basis (usually in the first quarter ot the calendar year),
27 even though those dividends are generally paid on a quarterly basis. In this context it is
28 inappropriate to assume that dividends will grow within the next three months when we
29 know that the next annual dividend distribution decision will not occur for at least another
130cc). Freeman 33 Docket Number 30013-297-GR-14
0CA99

I nine months. And, again, the growth in the projected dividend has nothing to do with the
2 compounding that results lirm quarterly dividend reinvestment.
3 CAPITAL ASSET PRICING MODEL
4 Q. WhAT OTHER INDICATORS OF TIlE COST OF EQUITY CAPITAL IIAVE
5 YOU COMPUTED IN YOUR ANALYSIS IN TEllS CASE?
6 A. I have also calculated a Capital Asset Pricing Model (CAPM) indicator othe cost of equity
7 capital for MDU. The CAPM isa discrete version of the more general risk premium model.
8 As I discussed earlier in my testimony, the premise of the security market line is that
9 investors are willing to assume additional increments of risk only in return thr the
10 opportunity to earn additional returns. The risk premium is the quantity of additional return
11 demanded by investors in return for the additional risk assumption. Using this relationship
12 an estimate of the cost of equity capital can he made using the following equation:
13K= Rc + B (RM-RF)
14 Where: K= Cost of Equity15 Rr Risk Free Rate16 RM Market Risk i’itiujurn17 Bl3eta
18 In theory, if the risk premium for a specific security can be estimated, in comparison to an
19 alternative security, that risk premium can he combined with the present return for the
20 comparative security to derive an estimate of the market cost ofcapital. In practice, historic
21 risk premiums are compiled and published by a number ofprivate and public sources. Duff
22 & Phelps, in its Valuation Handbook, publishes various risk premia inlormation based on
23 data compiled by Ibbolson Associates (Ibbolson’s) over the pcriod 1926 to present. The
24 2015 Duff& Phelps Valuation Handbook is not yet available so my analysis relies on the
25 2014 edition of that publication. Although the infomiation published by Duff & Phelps is
26 similar to that previously published by Ibbotson’s, it is not exactly the same as I will
27 describe later in my testimony.
25 Nevertheless. Duff & Phelps does provide a historic risk premium that measures the
29 differential return between the stock market and long tenn government bonds over the
l3ryee J. Freeman 34 Docket Number 3001 3-297-GR-14
0 CA 100

I period 1926 to present (other periods are provided but not used in my analysis), According
2 to Duff & Phelps, the incremental return or risk premium of stocks over long term
3 government bonds demanded by investors over that X year period averaged 6.96%. Thus
4 one measure of the current cost of capital, based on the current return of long tenu
5 government bonds oF 2.72% would be 9.68% (2.72% ± 6.96% = 9.68%) for the average
6 equity’ share.
7 The above calculation, however, is only a gcncralizcd estimation of the cost of equity
S capital. It is widely recognized that shares of stock are characterized by substantially
9 different levels of risk. In order for the risk premium to be useful for our purposes we need
10 a way to more definitively measure the risk associated with the shares of utility companies,
ii and even more specifically, the risk associated with the shares of the companies in my
12 sample group.
13 The CAPM measures this share specific risk by measuring the share price volatility of the
14 subject shares in comparison to the overall market. In theory. shares that arc affected with
is less risk will exhibit lower share price volatility over time than riskier shares. This share
16 price volatility measure is known as beta and is denoted by IS in the above equation. The
17 overall market is assumed to have a beta of 1. Beta is a measure of the covadance of
15 individual shares with the overall market. For example, shares with a beta of I would have
that vary precisely in tandem with the market and thus in theory would have the
20 same level of risk as a widely diversified portfblio of stocks. Shares with a beta greater
21 than one exhibit share price volatility greater than that of the market in general and are said
22 to he riskier than the overall market. Conversely, share priee volatility less than I indicates
23 that a particular share possesses less risk than the overall market.
24 Incorporating beta, which I have taken from the data published in Value Line, into the
25 above equation, we see that utility stocks have demonstrably lower risk than the overall
26 market; the median beta for the companies in my sample group is .75 or 25% less than the
2S 2014 Cost of Capital Handbook; Guide to Cost of Equity, DuiT& Phelps. LLC. Chapter 3, page 14.
Hiyce 3. Freeman 35 Docket Number 300 13-297-GR-14
OCA 101
I overall market. The median beta for the companies contained in Dr. Gaske’s PrOXY group
2 is .80 or 20% less than the overall market. Combining beta with the currant risk free rate
3 of 2.72% and the market expected equity risk premium of 6.96%, pursuant to the above
4 equation, yields an estimate of the cost of equity for each of the companies in my sample
5 group. As shown iii Column AK of OCA Exhibit 202.1, the resulting median cost of equity
6 capital is 7.94%.
7 Q. DO YOU HAVE ANY OBSERVATIONS REGARDING DR. GASKE’S RISK
s PREMIUM ANALYSIS?
9 A. Yes. As I explained earlier in my testimony, Dr. Gaske’s risk premium analysis, wherein
10 he compares the historic returns of small company stocks to the historic returns on
ii corporate bonds is meaningless in the context of setting rates in this proceeding. Dr. Gaske
12 does not present this risk premium analysis as an indicator of the cost of equity for MDU,
13 but rather as a benchmark, presumably to underscore the reasonableness of’ his final
14 recommended ROE.
15 In his risk premium analysis Dr. Gaske erroneously concludes that the small company
stocks Ibliowed by Ibbotson’s are a good proxy for MDU. As I demonstrated earlier, those
17 small company stocks are not even slightly comparable to MDU and any incremental size
is premium derived therefrom is highly inappropriate. Dr. Gaske’s two additional risk
19 premium benchmarks suffer from the same basic defect, specifically, they are based on the
20 returns of companies that are not even remotely comparable to that of a regulated utility.
21 For his large company risk premium calculation Dr. Gaske relies on the large company
22 stocks fOllowed by Value Line. Duff& Phelps lists the ten largest of those companies by
23 decile in its 2014 Valuation Handbook.29 According to the Valuation Handbook, the
24 largest company in decile I is Apple, Inc., the computer, sofiware and cell phone giant.
2014 Cost of Capital Jjandbook; Guide to Cost of Equity, DuIT& Phelps, LLC, Chapter 7, page 9
Biyce J. Freeman 36 Docket Number 30013-297-Ga- 14
OCA 102

Aside from [lie fact that Apple has a total market capitalization of $662 billion while MDU
2 Resources, MDU Utility’s parent company, has a total market capitalization of$5 billion,
3 there is no comparison between the lines of liusiness of Apple and MDU, either at the
4 parent level or at the utility level. luither, Apple is not a rate of return regulated utility.
5 Any attempt to compare the required return on equity for MDU to that of Apple, or any
6 other non—comparable company br that matter, is fruitless in this proceeding. The
7 Commission should reject Dr. Gaske’s attempt at comparing MDU to private, unregulated
s companies that are in no way comparable to the regulated utility operations of MDU.
9 The same is true for Dr. Gaske’s attempt to compare MDU’s utility operations to the
10 broader market as represented by the S&P 500. Again, while there may be some utility
II companies represented in the S&P 500, the vast majority of the companies in the S&P 500
12 are not regulated utilities, do not have business operations or services Ihat even remotely
ii resemble the utility operations of MDU, and are otherwise not directly comparable to
14 MDU’s utility operations.
is One final point regarding Dr. Gaske’s risk premium analysis. Dr. Gaske develops his risk
premium benchmarks by comparing the incremental difibrence in the historic returns of
17 stocks (large and small) over the historic returns of long term corporate l,onds. ‘While in
is theory a valid risk premium can he developed based on this information, there are some
19 practical problems that Dr. (laske ignores in his analysis.
20 First, leading authorities on cost of capital estimation, including Ibbotson’s, Duff& Phelps
21 and Dr. Morn, advocate that risk premiums be based on a risk free security. The most
22 common risk free rates used in equity cost estimation in rate setting proceedings are those
23 of U.S. government bonds. These are the only securities that have no risk of default and
24 match the investment horizon of most utility assets. Corporate bonds, even those that are
25 highly rated, possess some degree of default risk.
26 Secondly, those same authorities advocate that the proper return to use is the income return
27 since this is the return that the investor expected to earn when the investment was made.
28 Historic corporate bond returns, such as those published by ifiboLson’s and Duff& Phelps,
29 contain not only the income return hut the appreciation of the bond as well. In order to
30 properly develop an accurate risk prcmium based on these corporate bonds the price
llryce J. Freeman 37 Docket Nuniber 300 13-297-GR-14
OCA 103

I appreciation element must be removed IItm the total return. Neither Ibbotson’s nor Duff
2 & Phelps removes the price appreciation element from their indexes of historic returns for
corporate bonds and Dr. Gaske made no attempt to do so either. Consequently, Dr. Gaske’s
4 risk premium benchmarks are overstated, notwithstanding the other substantial concerns I
5 have with his risk premium analysis.
c, ROE BENCHMARKS
7 Q. WHAT IS THE RANGE OF EQUITY COST ESTIMATES INCLUDED IN YOUR
8 ANALYSIS?
9 A. My analysis shows that the appropriate cost of equity for MDU at this time Ihils somewhere
10 in a range of reasonableness between 6.88% and 10.59% with the mid-point of the range
11 being 8.24%. Of course, all of these equity cost indicators have their own individual
12 theoretical and practical strengths and weaknesses. History may or may not repeat itself
13 and can be considered only a rough guide of what may happen in the future. Likewise,
14 projections, particularly those made over the time horizon required by the DCF model,
is while informed by various sources of data, have a speculative element to them that should
16 not he understated.
17 Q. ARE THERE ANY HENCIIMARKS THAT YOU CAN OFFER THE
1% COMMISSION TO ASSIST IN NARROWING TIlE RANGE OF REASONBLNESS
19 FOR TILE COST OF EQUITY IN TillS CASE?
20 A. There are a couple of benchmarks that I believe the Commission can rely upon in helping
21 it to narrow the range of reasonable equity cost estimates in this proceeding. Importantly,
22 1 am not recommending that the Commission use these benchmarks in place of its own
23 sound decision making process or its informed judgment based on the evidence in this
24 proceeding. Rather, I am suggesting that these benchmarks may be useful to the
25 Commission in calibrating its compass with regard to the range of reasonable alternatives.
26 First, in the Duff& Phelps Handbook discussed earlier, the authors find that:
27 For the conditional ERP [expected risk premium] as of December 31, 2013,
28 we conclude 5.0%, matched with a normalized yield on 20-year U.S.
Bryce J. Freeman 3% Docket Number 30013-297-GR-14
OCA 104

government bonds equal to 4.0%, implying a 9.0% base cost of equity
2 capital in the United States as of year-end 2013.
3 Such an Expected Risk Premium (LRP) would apply to all market equities i.r()1 Toys R
4 Us to Boeing Aerospace. Certainly, the Commission would want to rely on a much deeper
5 analysis in making a determination in this proceeding. But, it is informative to understand
o that in the view ofDuff& Phelps a 9.0% base cost of equity forms a point estimate around
7 which a range of returns might be considered reasonable. That is quite a different
8 proposition than a point estimate of 7% or 8%, or even 10% or 11% for the base cost of
9 equity, particularly considering the widely recognized lower risk of utility equities.
10 Another source of information on the general level ERPs is published by Dr. Aswath
ii Damodaran who is a Professor of Finance at the Stern School of Business at New York
12 University. In fact, Dr. Damodanm’s work is cited extensively and relied upon by Duff&
13 Phelps in fbnnulating its ERP.3° According to data compiled by Dr. Damodaran, the
14 historic risk premium between the S&P 500 and the 10 year T-Bond has averaged 6.29%
15 over the period 1928 to present.3 The current yield on the 10 year T-Bond is 2.12% (as of
in February 20, 2015). Combining the current yield with the historic risk premium results in
17 an estimated ERP of 8.41%. However, an ER]’ based on 10 year T—Bond yields is not
1% consistent with my calculation of the traditional CAPM and DCF models since those
19 models are based on 30 year T-Bond yields. Based on data maintained by the Federal
20 Reserve Bank of St. Louis, the average historic spread between 10 Year T-Bonds and 30
21 year T-Bonds is 31 basis points. If one assumes that the historic yield spread between 10
22 year T-Bonds and 30 year T-Bonds of3 I basis points holds in this instance as well, then
23 the implied ERP would he 8.72% ((2.12% + .31%) + 6.29% = 8.72%).
24 These benchmark studies lead me to conclude that the appropriate range of reasonableness
25 in which to look tar a cost of equity capital for MDU is in the range of 9.0%. Importantly,
° 2014 Valuation Handbook, Duff& Phelps, pages 3-21 and 3-22.Dr. Aswath Damodaran, historical Returns on Stccks. Boij4 ills - United Saws,http://pages.stern.nyu.edu/—adamodar/New_Home_Page/datahtnl.
Bryce J. Freeman 39 Docket Number 300 13-297-GR-14
OCA 105

both of these estimates cover the wide spectrum of equities included in the S&P 500 and
2 neither estimate is adjusted tbr the known lower risk of utility shares in comparison to the
3 larger market. Accordingly, it is crucial to account •for that lower risk in a detailed analysis
4 such as the one I have conducted in this proceeding.
5 RECOMMENDED ROE
a Q. WhAT DO YOU CONCLUDE IS A REASONABLE ESTIMATE OF TIlE COST
7 OF EQUITY CAPITAL FOR MDU?
8 A. Based on my analysis in this case, as well as the general economic and market risk
9 information discussed in the first portion of my testimony, together with the benchmark
10 inlbmiation provided by Duff& Phelps and Dr. Damodaran, I have concluded that a 9.0%
11 cost of equity will balance the interests of customers in just and reasonable rates and the
12 interest of the utility in supporting its ability to attract and maintain capital. Although I
13 have calculated a number olindicators of the market cost of equity for MDU, all have their
14 own strengths and weaknesses. In the final analysis, I have relied more heavily on the
traditional indicators, the constant growth DCF model, the long term CAPM, non—constant
16 growth DCP model and the quarterly DCF model, with primary reliance on those indicators
17 that incorporate analyst’s forecasts to estimate growth.
ix I am cognizant of the läct that popular opinion seems to support rising interest rates.
19 However, given that markets are very efficient, and investors are, on average, very capable
20 of rapidly assimilating market information, my belief is that the prospect for rising interest
21 rates in the future has largely already been priced into securities by investors. If investors
22 know, for example, that an increase in market interest rates is imminent, they would pay a
23 smaller price tbr lower returns today and fOrego the opportunity for greater returns when
24 interest rates rise. This, in turn, drives up the yield of securities in the current market.
25 Given my range of preferred estimates, which range from 7.94% (CAPM) to 9.78°/a
26 (NCDCF), and in consideration of my overall range which would certainly support a lower
27 recommended ROE, I find that a 9.0% ROE for MDU is reasonable. My recommended
28 ROE also falls in reasonable proximity to the range specified by both Duff & Phelps and
29 Dr. Drnuodaran. In contrast to my recommendation, Dr. Gaske recommends an ROE of
Bryce 3. Freeman 40 Docket Number 300 13-297-GR-14
0 CA 106

10.0% selected from his identified range that runs from 7.23% to 10.53%. So, while our
2 ranges are similar, Dr. Gaske selects an ROE at the very top of his range. The mid—point
1 of Dr. Gaske’s range would be KSS%, quite close to my recommended ROE of 90%t
4 RECOMMENDED COST OF DEBT AND PREFERRED STOCK
5 Q. HAVING RECOMMENDED AN APPROPRIATE ROE, WHAT IS YOUR
6 RECOMMENDATION AS TO TIlE OThER ELEMENTS OF CAPITAL AND
7 FOR TIlE COMPANY’S CAPITAL STRUCTURE?
8 A. Although the cost of debt and preferred stock is discussed hyboth Dr. Gaske and Mr. Garret
9 Senger on behalf of MDU, it is Mr. Senger who presents evidence in support of MDU’s
U) proposed capital structure, cost of debt, both long term and short term, and the cost of
ii preferred stock. According to Mr. Senger’s testimony, and Statement F attached to the
12 application, MDU is proposing a profonima cost of capital based on a test year ending
13 December 3 1, 2014. Accordingly, Mr. Senger’s proposed capital ratios and costs reflect
14 those that the Company expects to be outstanding at year end 2014.
15 MDU’s proposed proforma capital structure is as ibliows:
Long Term Debt 42.435%
Short Term Debt 4.564%
Prelèned Stock 1.499%
Common Equity 51.502%
in The actual capital structure, on an average basis, of the companies represented in my proxy
17 group is as follows:
32 Direct Testimony ofF. Stephen Gaske, page 34.
Btyce J. Freeman 41 Docket Number 300 13-297-GR-14
OCA 107

Long Term Debt 48.00%
Preferred Stock 0.00%
Common Equity 52.00%
I The long term and short term debt proposed by MDU, in combination, represent 46.999%
2 of invested capital while common equity represents 51.502% of invested capital, both
:3 remarkably close to the median capital ratios lbr those capital elements in my proxy group
4 of companies. Since preferred equity is debt like in as much as the dividend payments on
5 preferred stock are contractual obligations for MDU, the preferred stock can be combined
6 with debt ibr purposes ofcornparison to the proxy coup. Combining the debt and preferred
7 stock results in a debt ratio to total capitalization of 48.498%, nearly identical to that of my
6 proxy group. Because MDU’s proposed proforma capital structure is so similar to that of
9 my proxy group of companies, I am recommending that the Commission adopt that
10 proposed capital structure tbr rate setting purposes in this case and I have used it in deriving
11 myWACC.
12 Regarding the cost of the various capital components, I have already provided my
13 independent analysis supporting a cost of equity of 9.0%. 1 have reviewed the material
14 provided by MDU supporting its cost of both long term and short term debt and find the
15 cost of each to be reasonable. The calculation of the protbrma cost of long term debt of
16 6.092% is shown Statement F, Schedule F-I, page 1 of 5 and the calculation of the cost of
17 short term debt is shown on Statement F, Schedule F-I, page 5 of 5. Although it is
18 somewhat unique in my experience thr a utilityto break out short term debt separately from
19 hrng term debt, I do not take exception to this approach in this case.
20 Q. MDU’S EMBEDDED PROFORMA COST OF DEBT APPEARS TO BE HIGHER
21 THAN CURRENT MARKET DEBT COSTS FOR SIMILARLY RATED
22 COMPMJIES. WHY ARE YOU NOT RECOMMENDING AN ADJUSTMENT TO
23 REDUCE MDU’S DEBT COSTS?
24 A. Statement F, Schedule F-l, page 3-5, shows the derivation of MDU’s proposed embedded
25 protbrma cost of debt. As can he seen on this schedule MDU has $430 million of long
Biyce 3. Freeman 42 Docket Number 30013-297-GR-14
OCA 108

term debt outstanding at the end of the proforma test year at interest rates ranging from
2 5.18% to 6.61%. Importantly, MDU issued SI 50 million of debt in 2014 at rates ranging
3 from 5.18% in March of 2014 to 4.34% in July of 2014. This indicates to me that MDU
4 has tracked the favorable interest rate environment with its most recent issuances. The
5 highest rate issue outstanding at 6.66% was issued in 2009 at the height of the financial
a crisis when market liquidity and credit availability was particularly low. In his testimony
7 Mr. Senger indicates that since 2006 MDV has refinanced essentially all of its debt and has
8 lowered its embedded cost ofdebt from 5.794% to 6.092%,
While it would be nice if the Company were able to refinance its higher cost issues and
10 bring its debt cost down even further, it would be inappropriate to assume, for the purpose
it of setting rates in this case, that MDV has acted inappropriately by not doing so. Managing
12 capital contributions is much more complicated than simply issuing new debt or stock to
13 fund capital expansion or relinance existing capital outlays. New issues of stock and debt
14 have a cost associated with them, as I discussed earlier in my testimony. Additionally,
15 existing debt may have redemption limitations or unamortized costs associated with them.
to Company’s must constantly review these factors to determine whether it is more beneficial
17 to refinance existing debt at a lower rate, given the costs involved, or simply continue to
18 pay the higher rate of the existing debt until such time as refinancing becomes economic.
19 There is no indication in the information provided by MDV in this proceeding that it has
20 acted imprudently in acquiring debt financing lhr its utility operations. I am confident that
21 MDU will continue to manage its debt cost through refinancing as those opportunities
22 become available in the market so as to minimize the cost of debt. For these reasons I do
23 not object to MDU’s proposed cost of debt and have included it in my calculation of the
24 WACC in this ease.
Direct Testimony of (lane! Senger, page 6.
Brycei. Freeman 43 Docket Number 30013-297-GR-14
OCA 109

I RECOMMENDED WACC
2 Q. WhAT IS YOUR RECOMMENDED WEIGHTED AVERAGE COST OF
3 CAPITAL FOR MDU IN THIS CASE?
4 A. My recommended WACC for MDU in this case is shown in the table below:
% ofTotal Weighted
Component Capital Cost CostLT Debt 42.4350% 6.09200/i, 2.5851%ST Debt 4.5640% 1.2090% 0.0552%Preferred 1.4990% 4.5770% 0.0686%Equity 51.5020% 9.0000% 4.6352%Total 100.00%
WACC 7.3441%5
6 SUMMARY
7 Q. PLEASE SUMMARIZE YOUR TESTIMONY IN THIS PROCEEDING.
8 A. Certainly. My testimony in this proceeding provides an independent analysis of the current
market cost of’ capital that I recommend he used in setting MDU’s rates fbr natural gas
10 distribution service in the Company’s Sheridan, Wyoming service teHtoiy. Anthony
ii Ornelas of the OCA incorporates my recommended WACC in deriving his recommended
12 revenue requirement in this proceeding. Mr. Ornelas also provides testimony and
13 recommendations regarding MDU’s cost of service and rate design proposals.
14 Tn my analysis I take no exception to MDU’s proposed capital structure, cost of debt or
Is cost of prefbrred stock. I am, however, recommending a return on equity of 9.0%, 100
16 basis points less than that recommended by Dr. Gaske on behalf of the Company. in
17 förnmlating my recommended ROE I have relied on several well vetted and widely used
18 equity cost estimation models incorporating multiple sources of financial and market data.
19 These are the standard tools and methods that I have presented to the Commission in many
20 previous cases. It is my belief that a 9.0% ROE will appropriately balance the interests of
Htyce J. Freeman 44 Docket Number 3001 3-297-GR-14
OCA1 10

customers in reasonable rates and the interests of the Company iii accessing capital on
reasonable terms, as required by the Hope and Bluetield standard.
In reviewing the testimony of Dr. (laske on behalf of the Company I have noted several
4 areas of disagreement between he and 1, as well as mistakes made by Dr. Ciaske in
5 lbrmulating his ROE recommendation. It is interesting to note that it one dismisses the
6 floatation cost adjustment erroneously applied by Dr. Gaske in his DCF analysis, his
7 median range of equity cost estimates for MDU is very similar to mine. Dr. Gaske,
s however, chooses to recommend an ROE at the very upper end of his nrngc, a range that
also includes his erroneous floatation cost adjustment. And, although Dr. Gaske’s presents
10 three risk premium analyses in his testimony, they are meaningless in the context of this
11 rate proceeding.
12 Q. DOES THAT CONCLUDE YOUR TESTIMONY IN TillS PROCEEDING?
13 A. Yes, it does.
Biyce J. Freeman 45 Docket Number 3001 3-297-GR- 14
OCAI 11

BEFORE TIlE PUBLIC SERVICE COMMISSION OF VYOMJNC
IN TITh MAilER OF THE APPLICATIONOF MONTANA-DAKOTA UTILITIES CO., ) DOCKET NO. 3001 3-297-GR-l4A DIVISION OF MDL RISOURCES ) (RECORD NO. 13992)GROUP. INC.. FOR AUTI TORITY TOLSTABLISI-I A TOTAL ANNUALINCRIASI3 IN DISTRIBUTIONREVLNUES OF $768.1 60 OR 4.13PERCENT
AFFIDAVIT, OATh AND VERIFICATION
liryce J. Freeman (Afliant) being of lawful age and being Iirst duly sworn, hereby deposes andsays Ihat:
Affiant is the Administrator of the Office of Consumer Advocate which is a partyintervenor in this matter pursuant to its Notice of Intervention fled on November 3, 2014.
Afliant prepared and caused to be filed the Ibregoing testimony. Afliant has, by allnecessary action, been duly authorized to file this testimony and make this Oath andVenlication,
Affiant hereby verifies that, based on Affiant’s knowledge, all statements and informationcontained within the testimony and all of its attached schedules are tme and complete andconstitute the recommendations of the Alliant in his official capacity as Administrator ofthe Wyoming Office of Consumer Advocate.
Further Affiant Sayeth Not.
Dated this 2nd day of Maith, 2015.
Bryce7 Frel4n, AdministratorWyoming ONice of Consumer Advocate2515 Warren Avenue, Suite 304Cheyemw, WY 82002(30?) 777-5742
STATE OF WYOMNO
) 55:COUNTY OF LARAMIE )
OCA 112

The foregoing was acknowledged before me by Bryce J. Freeman on this 2nd day ofMarch, 2015. Witness my hand and official seal.
‘CflAYBLICMy Commission Expires
& COUNTYOFLARAMIE WYOMING
LISSIOQ$JUN.24,flj
OCAI 13

Page o12
APPENDIX A
CASES IN WHICH BRYCE FREEMAN hAS PRESENTED TESTIMONY BEFORE THE
WYOMING PUBLIC SERVICE COMMISSION AS OF 312/2015
Subject
Ilcaring OfDocket N Limber Corn pa ny Date Testi inony
3001 6—U R—94—8 Pinedale Nan ni Gas Company 10/26/1994 ROR70006-’l’R-94-l4 Silver Star Telephone Company, Inc. 12/6/1994 ROR20002—ER—95—48 Black Hills Power & Light 8/14/1995 ROR, IRP, DSM, A14)R70000-TR-95-236 U S WEST Communications, Inc. 10/2/1995 TSLRIC
General Order No.73 Commission Rule Making 4/11/1996 TSLRIC20000-ER-95-99 PaciflCorp, Inc. 6/17/1996 ROR, AFOR, P11k7ooo7m-95-I 5 Dubois l’elephonc Company 8/5/1996 ROR, TSLRIC3001 2—GR—96—33 Wyin Industrial Gas Company 10/16/1996 ROR70007-TR-95-15 Pacific Telecommunications, Inc. 12/10/1996 TSLRIC
70000—fl’—96—301 U S West Communications, Inc. 1/10/1997 AFOR, Jurisdiction70007-TR-95-15 US West Communications, Inc. 1/28/1997 TSLRIC, RATE DESIGN
70000-TR-96-323 U S West Communications, Inc. 5/26/1997 h’SLRIC, Imputation30005-GR-97-51 Cheyenne Light, Fuel & Power, Inc. 8/25/1997 ROR70011 -TR-97-15 ‘Fri-County Telephone Association, Inc. 3/31/199% TSLRIC700I4-TR-97-7 TO’ West, Inc. 3/31/199% TSLRIC80007-WR-98-6 Vista West Water Company 8/31/1998 Cost of Service
20000-EA-9%-l41 l’acifiCorp, Inc. 7/6/1999 Merger3001 0-GR-99-47 Questar Gas Company 10128/1999 ROR, Revenue Requirement20003-I:R-99-54 Cheyenne Light, Fuel & Power, Inc. 1/18/2000 ROR, Rate Design30005-CR-99-53 Cheyenne Light, Fuel & Power, Inc. 1/18/2000 ROR, Rate Design20000-ER-99-145 PacitiCorp, Inc. 1/26/2000 ROR, Rate Design80007-WR-99-8 Vista West Water Company 3/22/2000 Rate Design
30010-GA-Ol-56 , . ‘
l00 I 2GA—0 I 43Questar (jas Company/Wyoming Industrial (jas 6/12/2001 Merger/Acquisition
20000—ER—0—1 62 PacihICorp, Inc. 7/9/2001 Rate Design70000-TA-99-482 Qwest Communications 9/6/2001 FSLRIC
70000-TA-0 1-700 Qwest Communications 3/I 5/2002 TELRIC70013-TR-02-17 All West Communications, Inc. 10/28/2002 TSLRIC
70006-yr-oo-43 Silver Star Telephone Company, Inc., Teton12/17/2002 TSLRIC
7001 6-TA-02-2 I Telecom20000-ER-02-I 84 I’acifiCorp, Inc. 1/7/2003 Power Cost
30022-G1-02-3 Kinder Morgan, Inc. 2/3/2003 Choice Gas20000-ER-02- 196 Paci tiCorp, Inc. 1/16/2004 Power Cost20000-EA-05-226 MEl fC/PaciflCorp 12/15/2005 Merger/Acquisition
30022-73-GR-06 Kinder Morgan, Inc. 9/16/2006 ROR20000-250-I3A-06 Rocky Mountain Power 1/10/2007 Avoided Costs
30022-84-GA-06 Source Gas/Kinder Morgan/KMRUII; Knight2/1 8/2007 Sale/Acquisition/Reorganization
30085-65-GA-06 I IoIdCo LLC, Knight Acquisition Co.
300I6-41-GR-06 Pinedale Natural Gas Company 3/21/2007 General Rate Case/ROR
1001 6-47-CR-06 WYRULEC 7/2/2007 General Rate Case
305H’O{07Cheyenne Light, Fuel & Power, Inc. 10/22/2007 General Rate Case/WYGEN II Prudence
70009-294-TT-07 Embarq Communications 11/2/2007 Access Charges/USF
10016-47-CR-06 WYRULEC 12/10/2007 Amended General Rate Case
20000-277-ER-07 Rocky Mountain Power 3/3/2008 General Rate Case/ROR
20000-264-EA-06 Rocky Mountain Power 5/27/2008 Amended DSM Application
0CM 14

l’age 2 of 2
APPENDIX A
CASES IN WHICh BRYCE FREEMAN HAS PRESENTEF) TESTIMONY BEFORE TIlE
WYOMING PUBLIC SERVICE COMMISSION AS OF 3/2/2015
SubjectHearing Of
Docket Number Company Date Testimony
70005-24—TR-O8 Chut&witer Telephone Company 8/21/200% General Rate Case
70000-333-ER-UK Rocky Mountain Power 3/23/2009 General Rate Case/ROR3001 O-GR-94-U8 Questar Gas Company 4/1/2009 General Rate Case/ROR
20004-75-ER-OR Mont;ina/Dakota Utilities 4/7/2009 General Rate Case/RC)R
300009-48-l•:R-08 Wyoming Gas Company 5/I 8/2009 General Rate Case/ROR
20000-342-EA-09 Rocky Mountain Power 9/1/2009 Avoided Costs
20000-352-lR-09 Rocky Mountain Power 4/16/2010 ROR
20002-75-IR-09 Black I [ills Power, Inc. 5./ 10/2010 ROR
30022- 48-OR-lU Source Gas Distribution LLC 7/19/2010 Energy Efficiency/Decoupling
20003-lOS-LA-b30005140EA10
Cheyenne Light, Fuel & Power, Inc. 1/27/2011 DSM
20000-383-l:A-l0 Rocky Mountain Power 5/11/2011 DSM
20000-384-ER-b Rocky Mountain Power 6/20/2011 General Rate Case/ROR
20000-388-ER-b Rocky Mountain Power 8/1/2011 Avoided Costs
20000—100-ER-b Rocky Mountain Power 3/19/2012 CPCN
20003-114-ER-Il Cheyenne Light, Fuel & Power, Inc. 6/18/2012 General Rate Case/ROR- Electric
30005-157-CR-Il Cheyenne Light, Fuel & Power, Inc. 6/18/2012 General Rate Case/ROR - Gas
20000-ER-405-b I Rocky Mountain Power 7/2/2012 General Rate Case/ROR/Prudence
20002-8I-EA-l I Cheyenne Light, Fuel & Power, Inc. 7/11/1019 C1’CN20003—1 1 3—EA— I I Black I Tills Power
20000-41 6-EA-12 Rocky Mountain Power 3/26/20 13 CPCN
30010-123-GA-]2 Que.tar Gas Company 4/11/2013 Wexpro II Agreement
80007-33-WI’-!] Vista West Water Company 8/19/2013 Pass-On/Commodity Cost
30016-72-OP-I] Pinedale Natural Gas Company 1/29/2014 Pass-On/Commodity Cost
300 I0-34-GA-l3 Quesiar (his Company 1/27/2014 Wexpro II Agreement
30022-2] 9-GA-I 3 Source Gas I)istrthution LLC’ 3126/2014 CPCN
70000-] 601-CA- 14 Qwest Corp.. dba CenturyLink QC 9/I 612014 Competitive Designation
20000-446-ER-l4 Rocky Mountain Power 10/13/2014 General Rate Case/RORJI’njdence
60007-36-WR-14 Vista West Water Company 112812015 General Rate Cas&RRJCOS/Rate Design
3001 3—297-C k—I 4 Montana/Dakota Utilities 1/I 0/2015 ROR
RO!t RKri (ti RIFtIRN, 1k!’ = TNrI:da&Amo RESOURCE ‘LANNINC;;
ttSM I )I/MANI) SIDE MANA( WMFN I15 RIC --TOIAIS!RVICE lONG <tIN TN(’RF’M!’,NTALC(LST;
PBR P1• RH IRMANCI IIASII) RATE MAKINGAItmALnRNA’rIvI: FORM 01 REOtILVIION
(PCN Ccli lkatc ol Politic Convenience and Nccciaity
OCA1 15

(WA
Exhibit
L02.I
Page1
of5
(A)
(B)
(D)
(E)
(F)
Tick
er
Sym
bol
(G)
(II)
AU
S%
AU
S%
Reg
ulated
Reg
ulated
Com
pany&
%0
1%
01%
Of
AU
SE
lectricG
as
Nam
eE
xchangeD
ebtP
relerrcdC
ur;m
on
Category
Rev
enu
eR
even
ue
Alliant
En
ey
Co
rpo
tion
NY
SE-LNT
46.0%2.5%
515
AC
omb
81%A
mcren
Corp
orw
nn
NY
SE-AEE
46.0%1.0%
53.0%C
omb
81%19%
CentorP
ointE
nergyN
YSE-C
NP
58.0%0.0%
42.0%C
omb
32%38%
CMS
Energy
Corporation
NY
SE-CM
S625%
0.5%37.0%
Com
b62%
33%C
onsolidatedF:dison,
Inc
NY
SEE
D49.0%
0.0%51.0%
Com
b70%
15%E
ntergyC
orporationN
YSK
-ETR54.5%
1.5%44.0%
Com
b77%
1%N
iSource,Inc.
NY
SE-NI
605%
0.0%39.5%
Com
b26%
62%SC
AN
AC
orporationN
YSE-SC
G53.5%
0.0%46.5%
Com
b53%
21%TEC
OE
tircvInc.
NY
SE-TE3
73
%0.0%
425%
Com
b73%
14%X
celE
nc:,
Inc.N
YSE-X
EL52.0%
0.0%48.0%
Com
bB
i%18%
Northew
estN
aturalG
asC
o.N
YSE-N
WN
46.0%0.0%
54.0%G
as0%
97%P
iejmontN
aturalC
asco.
NY
SE-PNY
46.0%0.0%
54.0%G
as0%
100Q
uestarC
orp
urato
nN
YSE-STR
48
3%
0.0%31.5%
Gas
0%95%
Average
51.31%0.42%
47.27%4
911%
Median
52.00%0.00%
48.00%72%
19%M
inimum
46.00%0.00%
37.00%26%
1%M
ux:iium62.50%
2.50%54,00%
81%62%

Value
Line
Pro
jected2015
(N)
(0)
OC
AE
xhibit:12.1
Pag
eof
5(I’)
(Q
Flo
ataiton
Value
Line
Valu
eJo
e
Calcu
latedA
dju
stedE
arnin
gs
Divid.’
:tds
(A]
(ii(K
)II)
AU
S%
(U)
(M)
Com
pan
y
Nam
e
Reg
ulated
Com
mon
Sto
ck
Rev
enue
Bond
Rating
Dividends
Price
S&pM
oo
dy
sP
erS
hare
Dividend
2/2
0/2
015
Dividend
Yield
Grow
thG
row
th
Rate
Rate
Alliant
Energy
Corporation
96%A
-A
2/A3
$2.24$64.61
3.4&%
361%
6.0%4
5,
Am
erenCorporation
100%B
BH
i-/BB
BB
aaI$1.66
$42.973.86%
1.02%4.S%
2.0
CenterP
ointEnergy
70%A
-/BB
Bt
A3/B
aal$1.05
$21.734.82%
5.02%i0’%
8.9C
MS
Energy
Corporation
950/sB
B8/B
88
A3/B
aal$1.15
$35.583.24%
3.38%6.5%
60
’C
onsolidatedE
dison,Inc.
85%A
-/SB
B.
A3
$2.59$63.75
4.06%4.23%
2.0%2.0
EntergyC
orporaPon
78%888÷
/EB
BB
aa2/Baa
$3.35579.32
4.22%4.40%
-1.S%
2.5N
iSource.Inc.
88%888-
Raal/B
aa2$1.07
543.622.45%
235
105%SC
AN
AC
orporation74%
888+B
aai/Baa2
$2.17$58.30
3.73%3.88%
-5.0%
TECO
Energy,
Inc.87%
888+/E
BB
AS
SO89
$19.994
44%
4.62%4.0%
XceI
Energy,
Inc.99%
A-A
3$1.27
$35.923.54%
3.69%5.5%
5.0’N
orthewcst
Natural
Gas
Co.
97%A
A-
A1/A
2$1.88
$47.9
39
3%
4.09%6.5%
2.P
iedmont
Natural
Gas
Co.100%
AA
2$1.32
$37.833.48%
3.63%5.0%
30
.Q
uestarC
orporation96%
A/A
-A
2$0.80
$24.113.32%
146%
6.5%60
Average
80,6%$1.65
$44.283.74%
3.89%5.3%
39
C.6
\ktn
aii95.0%
$1.32$42.07
3.73%3.88%
5.0%M
inimum
70.0%$0.80
$19.002.45%
255%
15%
NThxim
um1
00
.0*
$3.35$79.32
4.82%5.02%
105%
8.0%

Value
Line
OC
AE
xhibit2
J2.II’agc
3o15
(A)
(R)
(5)(T
)(U
)(V
)
Book
Value
Yahoo
(W)
(XI
Com
panyG
rowth
Grow
thG
rowth
Zachs
Value
Line
(Y)
(‘1)
Ilistoii:
Non
iini
Pro
jecte
dllto
19
Su
stainab
leG
DP
Earn
ings
Div
iden
ds
Reten
do
nV
alueL
ineN
ame
Rate
Rate
Rate
Per
Share
Per
Share
Raflo
RO
EG
rowth
Rate
Grow
thR
are\L
fttE
nergyC
orporation4.0V
4.90%4.90%
$410
$2.803L
71%2
.00%
380%
3.00°!o1’r:n
Corp
oratio
:1.5’½
8.90%8.40%
$3.00$1.80
40.00%¶1.50X
:3.80%
3.00%C
enterPoint
Energy
2.5%3.49%
4.80%$1.75
$130
25.71%15.00%
186%
3.0
0*
CM
SE
nergyC
orporation6.0%
6.64%6.10%
52.2551.33
40.00%13
30%
5.40%3.00%
Consolidated
Edison.
inc.3.5%
2.36%3.00%
$4.25$2.75
35.29%9.00%
3.18%3.00%
EntergyC
orporation4.0%
0.34%3.00%
56.75$3.80
43.70%10.50%
1.59%3.00%
NiSource,
Inc4.5%
10.40%5.50%
$2.4051.20
50.00%12.50%
6.25%3.00%
SCA
NA
Corporation
5.5%5.35%
4.90%$4.25
$2.3544.71%
10.00%4.47%
3,0
0*
—
TECO
Energy,
Inc.2.0%
6.43%6.50%
$1.40$1.00
28.57%11.50%
3.29%3
.o0
xX
ceIE
nergy,Inc.
4.5%4.46%
4.20%$2.50
$i.s
42.00%10.00%
4.20%3.00+
Northew
estN
aturalG
asCo.
4.0%4.00%
4.00%$3.30
$2.1036.36%
9.50%3,45%
3.00SfP
iedm
ontN
aruralG
asCa
5.0%5.00%
5.00%$2.25
$1.4336.44%
11.50%4.19%
3.00%Q
uestarC
orp
orad
on
7.0%4.40%
4.80%$Z
7550.95
45.71%19.00%
8.69%3.00%
Avurage
4.2%5.13%
5.01%38.48%
11.81%4.55%
Median
1.0%4.90%
4.90%40.00%
11.50%4.19%
‘.‘nru
urr
LS
%0.34V
:3.00%
25.71%9.00%
3.18%M
aximum
7.0%10.40%
8.40%50.00%
19.00%8.69%

(WA
}xfiihit:02.1
Page4
ot’5(AG)
(A)
(AA
)(A
R)
(AC
)(A
D)
(MI
Value
Line
(AF)
Disco
un
tedD
iscounted
Disco
unted
Pro
jectedN
ominal
Annual
Cash
Flow
Cash
Flow
Com
panyG
UP
Value
Line’
Total
Value
Line
With
Cash
Flow
With
With
Historic
Curren
tS
ustain
able
Nom
inalC
UP
Nam
eG
rowth
Rate
Beta
IR
eturn
Yield
Grow
thA
nalysts’G
rowth
Grow
thA
lliantE
nergyC
orp
orao
n4.30%
0.807.0%
3.2%7.41%
8.87%6.61%
Anicren
Corporation
4.30%0.75
6.5%3.8%
7.82%11.29%
7.02%C
enterPoint
Energy
4.30%0.75
8.0%4.4%
8.88%9.45%
8,02%C
MS
Energy
Corporation
4.30%0.70
6.5%3.4%
8.78%9.79%
6.38%C
onsolidatedE
dison,Inc.
4.30%0.60
5.5%4.1%
74
1%
6.69%7.23%
Entergy
Corporation
1.30%0.70
6.0%4.0%
8.99%6.01%
7.40%N
iSource,Inc.
4.30%0.85
6,5%2.5%
8.80%11.35%
5.55%SC
AN
AC
orporation4.30%
0.756.0%
3.8%8.35%
R96%
6.88%TEC
OE
nergy.Inc.
4.300/)0.85
6.5%4.5%
7.91%0
27.77.62%
XceI
Energy,
Inc.4.30%
0.706.0%
—3.9%
7.89%8
lIlt6.69%
Northew
estN
aturalG
asC
o.4.30%
0.706.5%
4.0%7.55%
8.93%7.09%
Piedm
ontN
aturalG
asCo.
4.30%0.80
8.00/,3.4%
7.82%8.63%
6.63%Q
ucstarCorporaU
on4.30%
0.8010.5%
3.2%12.14%
8.69%6.46%
Average
inim
u1:
ix
ItflUn:
075
0.750.üÜ
6.9%6.5%5.5%
3.7%3.8%2.5%
8.44%7.91%7.41%
9.03%8.9
36.01%
6.89%6.88%5.55%8.02%
0.8510.5%
45%
12.14%11.35
/1

C)(,,\!:xhW
it202.I
.4crageM
edian
Vad
muni
(A)
(All)
8.19%8.18%
93
2%
(Al)
(Aj)
(AK
)
7.94%2
.94
,/I
6.90%R
64%
l’agc5
of5
Disco
unled
Long
Term
Long
Term
Cash
Flow
With
Com
panyP
rojected
Risk
Free
Equity
Risk
Long
Term
Nom
inalG
OP
Nam
eG
rowth
Rate
Prem
ium
CA
PM
Alliant Energy
Corporation
7.91%2.720%
6.96%8.29%
Am
erenC
oiporation8.32%
2.720%6.96%
7.94%
CenterP
ointE
nergy9.32%
2.720%6.96%
7.94%
CM
SL
nergyC
orporation7.68%
2.720%6.96%
7,S9%
Consolidated
Edison,
Inc8.53%
2.720%6.96%
6.90%E
ntergyC
orporation8.70%
2.720%6.96%
7.59%
NiSource,
Inc.6.85%
2.720%6.96%
8.64%
ScA
NA
Corportion
8.18%2.720%
6.96%7.94%
TECO
Energy,
Inc.8.92%
2.720%6.96%
8.64%
Xcel
Energy,
Inc.7.99%
2.720%6.96%
7.59%
Northew
estN
awra[
Gas
Co.
8.39%2.720%
696%
7.59%
Piedm
ontN
aturalG
asC
o.7.93%
2.720%6.96%
8.29%Q
uestarC
orporation7.76%
2.720%6.96%
8.29%
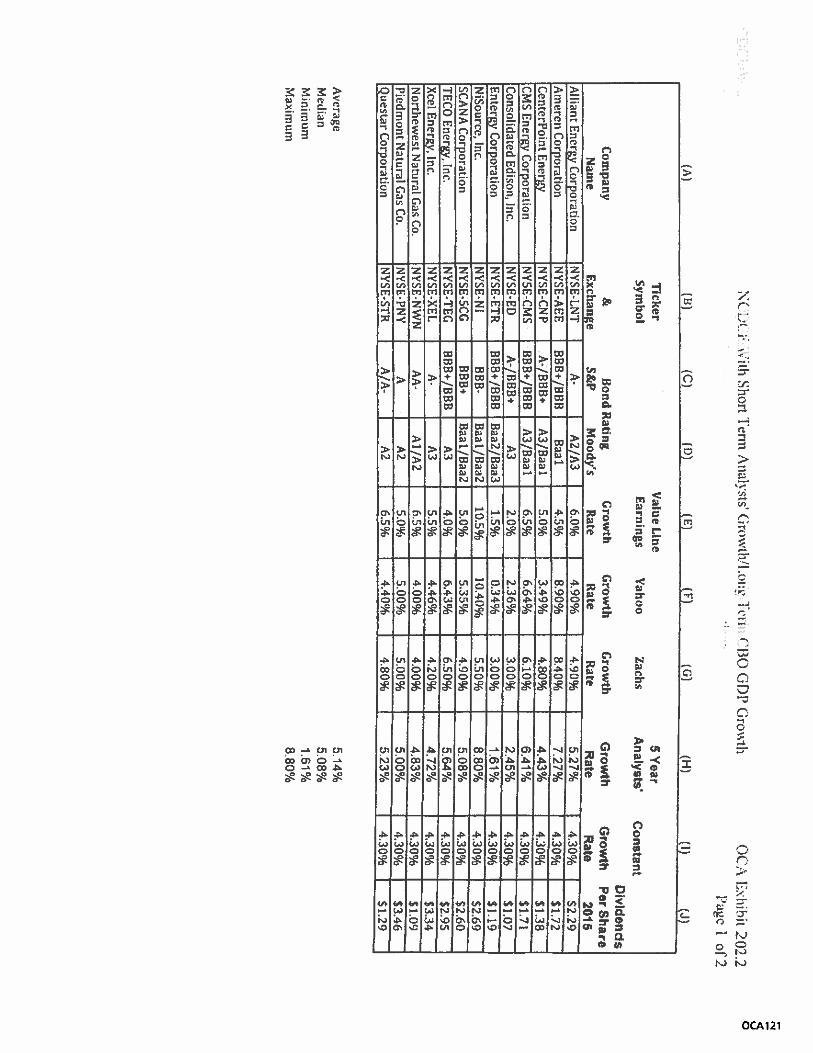
i)CiW
iihShort
lermA
naly
sts(Irow
th/i.ni:i’Tc’
iflU
GD
P(;ro
ihX
AL
xhhit:0
2.2
UC
A\crag
cM
ed.anFT
Uri
Maxim
um
514%
508%
I61%
880%
i’agCI
of2
(Al
(H)
(C)
(I))(E
)(F)
(G)
(H(I)
(J
Tick
erV
alueL
ine5
Year
Sym
bolE
arnin
gs
Yahoo
Lath
sA
naly
stsC
onstan
tD
F”id
ends
Com
pany&
Bond
Rating
Grow
thG
rowth
Grow
thG
row
thG
rowth
PerS
ha-eN
ame
Fxch
ange
S&P
Moody’s
Rate
Rate
Rate
Rate
Rate
2015A
lkantE
neitv(T
hrp
orji:,::
NY
SE-L
NT
A-A
2/A3
6.0%4.90%
4.90%5.27%
4.30%52.2
Am
crenC
orp
IFhr*
NY
SE-AR
EB
flB÷/H
BH
Baal
4.5%8.90%
840%
7.27%4.30%
St.72
Ctc
:Po
intE
ri:::N
YSE-C
NP
A/B
HB
+A
3/Baal
50
3.49%4.80%
4.43%4.30%
$1.3B—
CMS
Energy
Corporation
NY
SE-CM
SB
UH
÷/RB
8A
3/Baal
6.5%6.64%
6.10%6.41%
4.30%$1.71
Consolidated
Edison,
Inc.N
YSE-ED
A-/B
RB
+A
32.0%
2.36%3.00%
2.45%4.30%
$1.07E
ntergyCorporation
NY
SE-R
TR
BB
B÷/B
BB
Baa2/B
aa31.5%
0.34%3.00%
1.61%4.30%
$1.19N
iSource,
Inc.N
YSE-N
IBO
B-B
aal/Raa2
10.5%10.40%
5.50%8.80%
4.30%52.69
SCA
NA
Corporation
NY
SE-SCG
888i
Baal/H
aa25.0%
5.35%1.90%
5.08%4.30%
$2.60—
TUC
OF.
Inc.N
YSE-TEG
HB
R+
/888A
34.0%
6.4
3%
6.50%5.64%
4.30%$2.95
Xcc
Engv,
Inc.N
YSE-X
ELA-
A3
5.5%4.46%
4.20%4.72%
4.30%$3.3-I
Nortliew
estN
aturalG
asC
o.N
YSE
-NW
NA
A-
A1/A
26.5%
4.00%4.00%
4.83%4.30%
$1.09P
ietl:noutN
aturalG
asC
o.N
YSE-PN
YA
AZ
5.0
%5.00%
5.00%500%
4.30%Q
uesiarC
orporationN
YSE-STR
A/A
-A
Z6.5%
4.40%4.80%
523%
4.30%S1.29

N(:D
CF
With
SEm
i‘fecm
Aiiv
sts’G
row
th/L
ong
Fcrni
(7130C
DI’
Grovih1343%
978S
5.38%20.46%
,itE
xhib
it:0
2.2
I’agc.:.o
12
(A)
(K)
(L)(M
)(N
)(O
(P)
(0)
(R)
Curren
t
Com
panyS
tock
Price
Nam
c2J2012015
20162017
20182019
20202021
IRR
Allian
tEnerg
yco
rnoratio
n($61.61)
$2.41$2.54
$2.87$2.81
$2.96$3.09
8.14%A
nierenCorporation
($42.97)$1.84
$1.98$2.12
$2.28$2.44
$2.559.04%
CenterP
ointEnergy
[$21.73)51.44
$1.50$1.57
31
64
$1.71$1.78
10.94%C
MS
Energy
Corporation
($35.58)$1.82
S1.93
$2.06$219
$2.33$2.43
9.78%C
onsolidatedE
dison,Inc
(S63.75)$1.10
$1.13$1.15
Si18
$1.21$1.26
5.68%E
ntergycorporation($79.32)
$1.21$1.23
$1.25$1.27
$1.29$1.34
5.38%N
iSource,Inc.
($4362)$2.92
$3.18$3.46
$3.77$4.10
$4.2712.03%
SCAN
AC
orporation($58.30)
$2.74$2.88
$3.02$3.18
$3.34$3.48
9.12%TEC
OE
nergy.Inc.
($19.99)$3.11
$3.29$3.48
$3.67$3.88
$4.0520.46%
Xcel
Energy.
Inc.($35.92)
$3.50$3.67
$3.8454.02
54.21$4.39
14.17%N
orthewest
Natural
Gas
Co.
($47.94)$1
15$1.20
$1.26$1.32
$1.38$1.44
6.65%P
iedmont
Natural
Gas
Co.
($37.83)$3.63
33.81$4.00
$4.20$4.41
$4.6014,11%
QuestarC
orporation($24.11:
$136
51.43$1.51
$1.58$1.67
$1.7410i1
%
Average
Mt’an
NU
nirnumM
aximum

NC
I)(’F\V
ithSiorL
ci :‘nA
nalsts’
(jrovth.’l.ongIC
mI
FiiS
h,ricC;D
I’G
rowth
Average
M’d:an
etirn
urnM
.i’.imurn
5.14%5.08%1.6
1%8,80%
OL
A.02.3
Page
Io
f2
(A[8)
(C)
(D)
(E)(F)
(G)
(H)
(J)
Tick
erV
alueL
ine5
Year
Sym
bolE
arnin
gs
Yahoo
Zaclis
An
alysts’
Co
nstan
t
Div
ideiw
sC
ompany
&B
ondR
atingG
rowth
Gro
wth
Grow
thG
row
thG
row
thP
erS
hare
Nam
ex
rh’g
vS&
PM
oody’sR
ateR
ateR
ateR
ateR
ate201$
Alliant
Energy
(:orporation\iE
l.\TA
-A
2/A3
6.0%4.90%
4.90%5.27%
3.0
0$2.29
Am
erenC
orporationN
YSE-A
ES888
÷1
86
8B
asI4.5%
8.90%8.40%
727%
3.0
Ot
$1.72C
enierPoin!
En
er’
NY
SE-CN
PA
-fBB
B+
A3/B
aal5.0%
3.49%4.80%
443%
3.00%$1.38
CM
SI..vC
orporationN
YSE-C
MS
BB
B+/B
B8
A3fB
aaI.6.5%
6.64%6.10%
6,41%3.00%
$1.71C
onsolidatedE
dison.Inc.
NY
SE-SDA
-/BB
B’
A3
2.0%2.36%
3.00%2.45%
3.00%si.o1
EntergyC
orporat:onN
YS
E-T
RR
88+/B
BB
Haa2/B
aa31.5%
0.34%3.00%
1.61%3.00%
NiS
surce.Inc.
NY
SE-N
I888-
Baal/B
aa210.5%
10,40%5.50%
8.80%3.00%
$2.69S
CA
NA
corporationN
YSE-SC
(;888+
Baal/B
aa25.0%
5.35%4.90%
5.08%3.00%
$2.60TEC
OE
nergy.Inc.
NY
SE-m
GB
BB
+/8811A
34.0%
6.43%6.50%
5.64%30
0%
$2.95X
ceIE
nergy,Inc.
NY
SE-XEL
A-
A3
5.5%4.46%
4.20%4.72%
3.00%$3.34
Northew
estN
aturalG
asC
o.N
YSE
-NW
NA
A-
A1/A
26.5%
4.00%4.00%
4.83%3.00%
Si09
Piedm
ontN
aturalG
asCo.
NY
SE-PNY
AA
25.0%
5.00%5.00%
S.00%
3.00%s:
46Q
uestarC
orporationN
YSE-STR
A/i\-
A2
6.5%4.40r./,
4.80%5.23%
00%H
.29

NC
DC
I-W
ithShun
IermA
nalysts(jro
\thJ[.n;111‘Ierm
IIistoritG
DP
Grov.ih
OC
A202.3
Aveiago
Mcd
anM
inimum
M,ixjm
um
940%
8.73%4.18%19.73%
I’agc2
ol’2
(A)
(KCL)
[M)
..__U’4)(0)
(P)(0)
(R)
Cu
rrent
Com
panyS
tock
Price
Nam
e2/2012015
20162017
20182019
20202021
IRR
AlliantE
nergyCorporation
(Sfi4.61
$2.41$2.54
$2.67$2.81
S2.96
$3.057.03%
Am
erenC
orporation($42.97)
$1.84$1.98
$2.12$2.28
$2.44$2.51
7.96%C
enterPointE
nergy($21.73)
S1.44
$1.50$1.57
$1.64$1.71
$1.769.93%
CM
SE
nergyCorporation
($35.5S)$1.82
$1.93$2.06
$2.19$2.33
$2.408.73%
Consolidated
Edison,
Inc.($63.75)
$1.10$1.13
$1.15$1.18
$1.21$1.25
4,49%F
nrg
vC
orporation($79.32)
$1.21$1.23
$1.25$1.27
$1.29$1.33
4.18%N
iSource,Inc.
($43.62)$2.92
$3.18$3.46
53.7754.10
$4
22
11.06%SCA
NA
Corporation
($58.30)$2.74
$2.88$3.02
$3.1853.34
$3.448.04%
TECO
Energy
Inc.($19.99)
$3.11$3.29
$3.48$3.67
$3.88$4.00
19,73%X
ceIE
nergy,Inc.
($35.92)$3.50
$367
S3.84
$4.02$4.21
$4.3413.28%
Northew
estN
aturalG
asC
o.($47.94)
$1.15$1.20
61.26$1.32
$1.38$1.43
5.48%P
iedmont
Natural
Gas
Co.($37.83)
$3.63$3.81
$4.00$4.20
$4.41$4.55
13.21%Q
uestarC
orporation($24.11)
$1.36$1.43
$1.51$1
58]$1.67
$1.729.07%

Average
Median
Minim
umM
aximum
—Short
1 errrA
nalysts’(irok
1W!.o
ng
1nu
Sustainuble(irow
th
5.14%5.08%1
61%
8.80%
()c/\:;)2.1
Page1
oR
Ci
(Lj
(E(1)
Tick
erV
alueL
ine5
Year
Sym
bolE
arningsY
ahoo‘L
athsA
naly
stsC
on
stant
Dividen
tisC
ompany
&B
ondR
ating
Grow
thG
rowth
Grow
thG
row
thG
row
thP
ersh
a-e
Nam
exchange
S&P
Moody’s
Rate
Rate
Rate
Rate
Rate
2015A
lliantE
nergyC
orporationN
YSE
-LN
TA
-A
2/A3
6.0%4.90%
4.90%5.27%
3.80%$2.29
—
Am
erenC
orporationN
YSE-A
EER
ER
+/BB
BB
ual4.5%
8.90%8.40%
7.27%3,80%
$1.72—
Centerl’oint
Energy
NY
SE-C
M’
A-/B
8B÷
A3/B
aal5.0%
3.49%4.80%
4.43%3.86%
Si.3fl
CM
SE
nergyCorporation
NY
SE-CM
SB
BB
+/BB
HA
3/B
aal6.5%
6.64%6.10%
6.41%540%
$1.71C
onsolidatedE
dison,Inc.
NY
SE-EDA
-fBB
B+
A3
2.0%2.36%
3.00%2.45%
3.18%$1.07
Entergy
Corporation
NY
SE-E
TR
BB
B÷/B
KB
Baa2/B
aa313%
0.34%3.00%
1.61%4.59%
$1.1
9N
iSource.Inc.
NY
SE-NI
EBB
-R
aal/Eaa2
10.5%10.40%
5.5004,8.80%
6.25%$2.69
SCA
NA
Corporation
NY
SE-SCO
BB
B+
Baal/B
aa25.0%
5.35%4.90%
5.08%4.47%
$2.60TEC
OE
nergy,Inc
NY
SE-T
hG81311÷/EB
BA
34.0%
6.43%6.50%
5.64%3.29%
$2.95X
tcIE
nergyInc.
NY
SE-XE!.
AA
35.5%
11
4.20%4.72%
4.209453.34
—
Northew
estN
aturalG
asC
o.N
YSE
-NW
NM
-A
l/AZ
6.5%4.005e
4.00%4.8
3%
3.45%sL
dR
ermo
nt
Natural
Gas
Co.
NY
SE-PNY
AA
25.0%
5.0
0,
5.00%5.00%
4.19%$3.46
Questar
Corporation
NY
SE-STRA
/A-
AZ
6.5%t
4.40%4.80%
5.23%8.6
9%
$1-n
—

\CD
CF
—S
hrt
Icrn
A;
atsts’
(iro;
(li/Iong
termSustainable
ircnvih
Avcrage
Median
Minim
uniM
aximum
10.64%10.59%4.65%19.89%
QU
Afl2
.4Pagc
of2
(A)
(K)
CL)(M
(N)
(0)(P
)(Q
)(R
)
Curren
t
Com
panyS
tock
Price
Nam
e212012015
20162017
20182019
20202021
IRR
Alliant
Energy
Corporation
($64.61)$2.41
$2.54$2.67
$281
$296
S307
7.72%A
merenC
orporation($42.97)
$1.84$1.98
$2.12$2.28
$2.44$2.53
8.62%C
enrerPointE
nergy($21.73)
$1.44S
1.50$1.57
$1.64$1.71
$1.7710.59%
CM
SE
nergyC
orporation($35.58)
$1.8251.93
32.06$2.19
$2.33$2.46
10.68%C
onsolidatedE
dison,lnc.($63.75)
$1.10$1.13
$1.15$1.18
$1.21$1.25
4.65%E
ntergyCorporation
($79.32)$1.21
$1.23$1.25
$1.27$1.29
$1.355.64%
NiSo,rc@
.!nc.
($43.62)$2.92
$3.18$3.46
$3.77$
41
034.35
13,52%S
CA
NA
Corporation
($58.30)$2.74
$288
$3.02$3.18
$334
$3
49
9.26%TEC
OE
nergy,Inc.
($19.99)$3.11
$3.29$3.48
$3.67$3.88
$4.0119.89%
XceI
Energy.
Inc.($35.92)
$3.50$3.67
$3.84$4.02
$4.21$4.39
14.11%N
oith
ewcstN
atural
Gas
Co.(S
47.94)$1.15
$1.20$1.26
$132
$1.38$1.43
5.89%P
iedmont
Natural
Gas
Co.($37.83)
$3.63$3.81
$4.00$4.20
$4.41$4.60
1403%
QuestarC
orporation($24.11)
$1.36$1.43
$1.51$1.58
$1.67$1.81
1371%

Otiartertv
DU
EA
naly
sisO
C\
Exhibit
2J:.5
Iof
5(A
)(B
)IC
)(0
)(F
)(F
)(G
)(H
Tick
erA
(JS%
AIlS0!0
Sym
bol
Reg
ulated
Reg
ulated
Co
mp
any
&%
01%
Of
¾01
AU
SE
lectricG
as
Nam
eE
xch
ange
Deb
tP
referredC
om
mo
nC
atego
ryR
even
ue
Rev
enue
Alliant
Energy
Co
rp
oratio
nN
YSE
-l.NT
46.0%2.5%
51.5%C
omb
81%15%
Am
erenC
orporaUon
NY
SE-A
EE
46.0%1.0%
53.0%C
omb
81%10%
CenterP
ointE
nerg
yN
YS
EC
NP
58.0%0.0%
42.0%C
omb
32%38%
CM
SE
nergyC
orporationN
YSE-C
NIS
625%
0.5%37.0%
Com
b62%
133%
Consolidated
Edison,
Inc.N
YSE
-ED
49.0%0.0%
51.0%C
omb
70%I5
.E
nterg
yC
orp
oratio
nN
YSF.-ETR
54.5%1.3%
44.0%C
omb
77%N
isource,Inc.
NY
SE-N
I60.5%
0.0%39.5%
Com
b26%
62%SC
AN
AC
orporationN
YSE
-SCG
53
5%
0.0%4
ft5%
Com
b53%
21%T
EC
OE
nergy,Inc.
NY
SE-T
EG
37.3%0.0%
42.5%C
omb
73%14%
Xcel
Energy.
Inc.N
YSE
-XE
I.52.0%
CC
X,
48.0%I
Com
b81%
18%N
orth
ewest
Naniral
Gas
CoN
YSE
-NW
N46.0%
0.0%54.0%
Gas
0%97%
Piedm
ontN
aturalG
asC
o.N
YSE
-PNY
46.0%0.0
%54.0%
Gas
0%100%
QuesrarC
orpor-ationN
YSE
.STR
48.5%0.0%
51
5G
as0%
96%
Average
52.31%0.42%
47.27%40%
41%M
ecian52.0
0/.
0.00%48.00%
62%21%
Mininn:n:
46.00%0.00%
37.00%0%
1%M
aximum
62.50%2.50%
54.00%81%
100%

Quarterly
EX
tA
naly
sis
(rU(I)
(I)(K
)IL)
(34)
AIlS
%
Value
Line
Pro
jected
(N)
Valu
elin
e
Pro
jected2n
d
Value
l.ine
Pro
jected1st
OC
AE
xhib
it1
02
.5
Page
2o15
(0)
Value
Line
Pro
Jected3rd
Quarter
Com
panyR
egulated
Bond
Rating
Annual
Dividend
Dividend
Quarter
Dividend
Quarter
Div
iden
d
Nam
eR
even
ue
S&P
Moodys
Pe:
Share
Per
Sh
areP
erS
hare
Per
Share
Alliant
Energy
Corporation
96%A
-A
2/A3
$224
$0.55$0.55
$0.55A
rnerenC
orporation100%
BB
B./81113
Raal
$1.66$0.41
$0.41$0.41
CenterP
ointE
nergy70%
A-/H
88+A
3/Raa
$1.05$026
$0.26$0.26
CM
SE
nergyCorporation
95%8
88
+1
88
8A
3/R
aal$1.15
S0.29$0.29
$0.29C
onsolidatedE
dison.Inc
85%A
-/88B+
A3
$2.59$0.6S
$0.65$0.65
EntergyC
orporahon78%
8BB
+/BB
BB
aaZ/B
aa3$3.35
$0.83$0.83
$0.83N
iSourcc,Inc.
88%81313-
Baal/B
aa2$1.07
$0.27$0.27
$0.27SC
AN
AC
orporation74%
BU
Rt
Baal/B
aa2$2.17
$05.1$0.54
$0.54TEC
OE
nergy,Inc
87%8884
/8118A
3$0.89
$0.22$0.22
$0.22X
ceIE
nergy,Inc.
99%A
-A
3$1.27
—$032
$0.32$032
Noithew
estN
aturalG
asC
o.97%
AA
-A
1/A2
$1.88$0.47
50’17$0.47
Piedm
ontN
aturalG
asC
o.100%
AA
2$1.32
S0.33SO
33—
Qu
estarcorp
oratio
r‘16%
A/A
-A
2£0.80
$0.20$020
$0.20
Average
90%$1.63
Median
$32
Minim
um70%
$0.80N
laximw
n100%
$335

Qi
:ncrls’JX
TA
nalysis
Projected
4th
Stock
Calcu
latedA
djste
dE
arnin
gs
Dividends
Book
Value
Yahoo
(A)
(P)(QJ
(RJ
(5)
Vain
cL
ineC
omm
on
F)
Coin
parly
(U)
(V)
OC
AIN
hibit:0
2.5
Pauc
3o15(W
)
Quarter
Dividend
Flo
atalton
Value
Line
Value
Line
Value
Line
Price
Divide
ridD
ividendG
rowth
Grow
thG
rowth
Grow
th
Nam
eP
erS
hare
2/2
0/2
01
5Y
ieldY
ieldR
ateR
ateR
ateR
ateA
lliantEnergyC
orporation$0.59
$64.613.46%
3,61%0.0%
45
V4.0%
4,90%A
nierenC
orporation$0.42
$42.973.86’Y
o4,02%
4.5%2.0%
j.5%8.00%
CenterP
ointE
nergy$0.27
$21.734.92%
S.02%
5.0%8.0%
2.5%3.49%
CM
SE
ner’
Corporation
$0.30$35.58
3.24%3.38%
6.5%6.0%
6.0%6.64%
Consoildated
Edison,
Inc.$0.66
$63.754,06%
4.23%2.0%
2.0%3.5%
2.36%E
rflergyC
orporation$0.86
$79.324.22%
4.40%1.5%
2.5%4.0%
0.34%N
iSource,Inc.
$0.27$43.62
2.45%2.55%
10.5%4.0%
45%
10.40%SC
AN
AC
orporation$0.55
S58.30
3.73%3.88%
5.0%3.0%
5.5%5,35%
TECO
Energy,
Inc.$0.23
$19.994.44%
4.62%4.0%
2.5%2.0%
6.43%X
rcIEnergy,
Inc.$0.33
$35.923.54%
3.69%5.5%
5.0%4.5%
446%
North
ewest
Natural
Gas
Co.
$0.48$47.94
3.93%4.09%
6.5%2.5%
4.0%4.00%
Piedm
ontN
aturalG
asC
o.$0.34
$37.833.48%
3.63%5.0%
3.0%5.0%
5.00%Q
uesar
Corporation
$0.21$24.11
3.32%3.46%
6.5%6.0%
7.0%4.40°A
Average
4.2
83.74%
3.89%.3
%39%
4.2%5.13%
Median
$42.973.73%
3.88%.0
%3.0%
4.0%100%
Minim
um$19.99
2.45%’
2.55%1.5%
2(1%1.5%
0.34%M
aximum
S9.%
24.82%
5.02%10.5%
8.0%7.0%
10.40%

Quarterly
[Xl•
Analy
sisO
CA
lxT
uhit23
2.5
Histo
ricN
ominal
Su
stainab
leG
DP
Pro
jectedN
ominal
GD
PV
alueL
ine
38.48%:1.81%
40.00%11.50%
25.71%9.00%
50.00%19.00%
4.55%4.19%3.18%8.69%
O.7E
0.750.600.85
(A)
(XI
(Y)
(Z)
(M)
(AR
)
Zachs
(AC
)(A
l))
Com
panyG
rowth
-
Pag
e—
o15
(AE
)(A
l
Value
Line
Pro
jected‘17
to19
Earn
ings
Div
iden
ds
Reten
tion
Value
Line
Nam
eR
ateP
erS
hare
Per
Share
Ratio
RO
EG
row
thR
ateG
rowth
Rate
Grow
thR
ateB
etaA
lliantE
nergyC
orporation4.90%
$4.10$2.80
31.71%12.00%
3.80%3.00%
4.30%A
meren
Corporation
8.40%$3.00
$1.8040.00%
9.50%3.80%
100
%4.30%
0.75C
enterPointE
nergy4.80%
$1.75$1.30
25.71%15.00%
3.86%3.00%
4.30%0
.75
CM
SE
ner’
Corporation
6.10%$2.25
$1.3540.00%
13.50%5.40%
3.00%4.30%
Consolidated
Edison,
Inc.3.00%
$4.25$2.75
35.29%9,00%
3.18%3.00%
4.30%E
ntergyC
orporation3.00%
$6.7553.60
43.70%-
10.50%4.59%
3.00%4.30%
0.70N
iSource.Inc
5.50%$2.40
$1.2050.00%
12.50%6.25%
3.00%4.30%
0.83SC
AN
AC
orporation4.90%
$4.2552.35
44.71%10.00%
4.47%3.00%
4.30%0.75
TE
CO
Eneriy,
Inc.6.50%
$1.4051.00
28.57%11.50%
3.29%3.00%
4.30%0.83
XceI
Energy.
Inc.4.20%
$2.50$1.45
42.00%10.00%
4.20%3.00%
43
0%
0.70N
orihewest
Natural
Gas
Cu.4.00%
$3.30$2.10
36.36%9.50%
3.45%3.00%
4.30%0.70
Piedm
ontN
aturalG
asC
o.5.00%
$2.2551.43
36
44
%11.50%
4.19%3.00%
4.30%0.80
QuestarC
orporation4.80%
$1.755005
45.71%19.00%
8.69%3.00%
4.30%0.80
Average
frd:a
nNIin
nun
Niaxiinum
501%
4.90%3
00%h
40%

(.)uarterivI)C
F.\rav
sjs
Quarterly
Quarterly
OC
AE
xhibit:02.5
PageSot’
5(A
)(A
G)
(All)
(Al)
Value
Line
(AK
)(A
L)(A
J)
Quarterly
Disco
un
ted
Quarterly
Disco
un
tedD
kco
uuted
Disco
unted
Cash
Flow
Annual
Cash
Flow
Cash
Flow
With
Com
panyT
otalV
alueL
ineW
ithC
ashF
lowW
ithW
ithH
istoric
Pro
jectedC
urren
tA
nalysts’N
ominal
GD
PN
ominal
GD
PN
ame
Retu
rnY
ieldG
rowth
Su
stainab
leG
row
thG
rowth
Grow
thA
lliantE
nergyC
orporation7.0%
3.2%8.99%
7.51%—
6.70%8.01%
Am
erenC
orporation6.5%
3.8%1146%
7.94%7-13%
8.45%C
enterPoint
Energy
8.0%4.4%
9.62%9.04%
8.17%9.49%
CM
SE
nergy:orporation
6.5%3.4%
9.91%8.89%
6.46%7,77%
Consolidated
Edison.
Inc.5.5%
4.1%6.79%
7.53%7.35%
8.67%E
ntergyCorporation
6.0%4.0%
6.11%9.13%
7.52%8.84%
NiSource,
Inc6.5%
2.5%11.46%
8.89%5.60%
6.92%SC
AN
AC
orporation6.0%
3.8%9.09%
8.47%6.98%
8.30%TEC
OE
nergy.Inc.
6.5%4.5%
10.44%8.05%
7.76%9.08%
Xcel
EncrE
v,Inc.
6.0%3.9%
8.52%8.00%
(.78%8.lO
y.N
orthewest
Natural
Gas
Co.6.5%
4.0%9.06%
7.66%7.20%
8,52%P
iedmont
Natural
Gas
Co.8.0%
3.4%8.74%
7.92%6.72%
8.03%Q
uestarCorporation
10,5%32%
8.80%12:10%
6.54%7.86%
Average
6.94:3.7%
9.15%2.56%
6,99%8.31%
Meojan
6.5%3.13%
0.06%8.05%
6.98%8.30%
l:nrn
um
5.5%2.5%
6.11%7.51%
5.60%6.92%
Max
imu
m10.5%
4.5%11.46%
12.30%8
17%9.49%