Embed Size (px)
Citation preview
BEFORE THE SECRETARY OF THE INTERIOR
PETITION TO UPDATE THE BUREAU OF LAND MANAGEMENT’S REGULATIONS, NOTICES, AND ORDERS
TO REDUCE EMISSIONS OF NATURAL GAS FROM OIL AND GAS OPERATIONS
Photo courtesy of Bruce Gordon and EcoFlight
Petitioners:
Center for Biological Diversity
Clean Air Task Force
Western Environmental Law Center
September 11, 2012

PETITION TO REDUCE EMISSIONS OF NATURAL GAS FROM OIL AND GAS OPERATIONS Page i
EXECUTIVE SUMMARY
Pursuant to the Administrative Procedure Act (APA), 5 U.S.C. § 551 et seq., the Mineral Leasing Act (“MLA”), 30 U.S.C. § 181 et seq., the Federal Land Policy and Management Act (“FLPMA”), 43 U.S.C. § 1701 et seq., and 43 C.F.R. § 14.2, Petitioners Center for Biological Diversity, Clean Air Task Force, and Western Environmental Law Center hereby request that the Secretary of the Department of the Interior (“Secretary”) and the Bureau of Land Management (collectively, “BLM”) update BLM regulations, notices to lessees (NTLs), and orders governing oil and natural gas leases on federal leases to minimize the significant leakage of methane that currently occurs during oil and natural gas activities on federal oil and gas leases. These activities vent or leak extremely large quantities of natural gas containing methane and other harmful pollutants, and also flare the gas, which results in emissions of carbon dioxide and toxic substances. Thus, due to these emissions, oil and gas activities drive climate change, harm human and environmental health, and rob the United States of royalties on recovered gas.
The MLA imposes on BLM a simple, indisputable mandate: that the agency require
operators to take all reasonable actions to prevent the waste of oil and gas. FLPMA complements the MLA, mandating that the BLM prevent the unnecessary or undue degradation of public lands as well as protect the ecological, environmental, air, atmospheric, and other values of those lands. Yet despite these requirements, oil and gas operations on BLM lands currently result in the waste and leakage of significant volumes of natural gas. Petitioners thus request that the BLM update its regulations and guidance documents in order to implement the many measures available today to stop the unnecessary emission of natural gas. Petitioners also ask that BLM prioritize this update given the significant push for domestic oil and gas development and the urgent need to rapidly eliminate greenhouse gas pollution.
Natural gas emissions from oil and gas operations drive climate change and harm public
health because the primary component of natural gas is methane—a global warming pollutant many times more powerful than carbon dioxide. Scientists estimate that methane is 105 times more powerful than carbon dioxide at warming the atmosphere over a 20-year period, and 33 times more powerful over a 100-year period. Methane is also an ozone precursor and methane pollution increases ground-level ozone pollution that is extremely damaging to human health.1
Methane emissions from oil and gas operations on BLM leases are significant. Federal
leases account for about 11% of U.S. natural gas production and 5% of U.S. oil production.2 In a 2010 report, the Government Accountability Office (“GAO”) compiled data from various sources and estimated the amount of vented and flared gas from federal leases at 126 billion cubic feet (Bcf) per year, which is equivalent to the natural gas needed to heat 1.7 million homes
1 Environmental Protection Agency, Regulatory Impact Analysis Proposed New Source Performance Standards and Amendments to the National Emissions Standards for Hazardous Air Pollutants for the Oil and Natural Gas Industry (July 2011), http://www.epa.gov/ttnecas1/regdata/RIAs/oilnaturalgasfinalria.pdf, at 4-27. 2 Bureau of Land Management, Oil and Gas, http://www.blm.gov/wo/st/en/prog/energy/oil_and_gas.html (last visited September 9, 2012).

PETITION TO REDUCE EMISSIONS OF NATURAL GAS FROM OIL AND GAS OPERATIONS Page ii
for one year.3 The oil and gas industry overall produced 26,000 billion cubic feet (“Bcf”) of natural gas in 2009 from both private and public lands, with an estimated 623 Bcf leaked to the atmosphere, though this is almost certainly an underestimate of the actual leakage rate.4 The oil and gas sector accounts for approximately 37 percent of all U.S. methane emissions based on this leakage estimate.5
Methane emissions from oil and gas operations on BLM leases can and must be cut. The
United States Environmental Protection Agency (“EPA”) estimates that available and cost-effective technologies and practices could eliminate 40 percent of gas emitted from federal oil and gas leases, generating significant reductions in greenhouse gas pollution and an additional $23 million in royalty revenue for the United States.6 Further, these figures may be overly conservative. Evidence indicates that oil and gas operations leakage rates are greater than EPA estimates, meaning there are additional opportunities to eliminate leaks. One report concludes that operators can economically capture approximately 80 percent of leaked gas from the oil and gas industry overall (production, processing, transmission, and distribution).
In order to fulfill the MLA’s and FLPMA’s mandates to prevent the waste of natural gas, BLM must revise its regulations and rules to ensure that operators capture the maximum feasible amount of methane. This Petition requests revisions that would accomplish this by strengthening emission control requirements and providing clarity to BLM’s rules. In particular, three changes would greatly reduce emissions. First, BLM should require that operators employ best available technology, defined as the use of the best technologies and techniques currently in use, as well as future technologies and techniques that become available in the future, to dramatically cut natural gas emissions. Second, BLM should incorporate a natural gas leakage performance standard to complement the best available technology requirement. Third, to help ensure compliance with these rules, BLM should update its enforcement rules. Current penalties are far too low to deter violations, and should be increased.
The petitioned changes under the MLA and FLPMA supplement other recent actions and
ongoing processes undertaken by BLM and other agencies. Other actions include BLM’s proposed rule to regulate hydraulic fracturing on public land and Indian land;7 BLM’s announced plan to promulgate a new Onshore Oil and Gas Order #9, which BLM states will “establish standards to limit the waste of vented and flared gas and to define the appropriate use of oil and gas for beneficial use”;8 and EPA’s Clean Air Act New Source Performance Standards for the oil
3 U.S. Gov’t Accountability Off., Federal Oil and Gas Leases: Opportunities Exist to Capture Vented and Flared Natural Gas, Which Would Increase Royalty Payments and Reduce Greenhouse Gases 6 (Oct. 2010) (“GAO Report 2010”), http://www.gao.gov/new.items/d1134.pdf.at 12. This data is from 2008. 4 Natural Resources Defense Council, Leaking Profits: The U.S. Oil and Gas Industry Can Reduce Pollution, Conserve Resources, and Make Money by Preventing Methane Waste, (2012), available at http://www.nrdc.org/energy/files/Leaking-Profits-Report.pdf (“NRDC Leaking Profits”) at 4. 5 Id. 6 GAO Report 2010 at 20. 7 U.S. Environmental Protection Agency, Oil and Gas; Well Stimulation, Including Hydraulic Fracturing, on Federal and Indian Lands; Proposed Rule, 77 Fed. Reg. 27,691 (May 11, 2012) (“USEPA Well Stimulation”). 8 Federal Register, Onshore Oil and Gas Order 9: Waste Prevention and Use of Produced Oil and Gas for Beneficial Purposes, Unified Agenda 1004-AE14, https://www.federalregister.gov/regulations/1004-AE14/onshore-oil-and-
PETITION TO REDUCE EMISSIONS OF NATURAL GAS FROM OIL AND GAS OPERATIONS Page iii
and natural gas industry.9 While each action may reduce methane emissions or address related impacts from oil and gas development, the petitioned changes are in most instances additive to these other limited requirements, and, moreover, independently required by law.
The changes Petitioners seek will ensure compliance with the MLA and FLPMA—thus
ensuring that specific activities do not violate those statutes—while directly benefiting human health, addressing climate change, and resulting in greater royalty payments. The changes would also have significant additional co-benefits, including preventing the emission of volatile organic compounds (“VOCs”), which make up about 3.5 percent of the volume of natural gas emissions,10 and include the particularly harmful BTEX compounds—benzene, toluene, ethyl benzene, and xylene.11 VOCs cause a wide range of harms, including damage to the brain and nervous system.12 Thus, the petitioned changes can provide substantial environmental, health, and economic benefits and BLM should not delay in implementing them.
gas-order-9-waste-prevention-and-use-of-produced-oil-and-gas-for-beneficial-purposes (last visited Sept. 7, 2012) (“Federal Register on BLM Onshore Oil and Gas Order 9”). 9 U.S. Environmental Protection Agency, Oil and Natural Gas Sector: New Source Performance Standards and National Emission Standards for Hazardous Air Pollutants Reviews Final Rule, 77 Fed. Reg. 49490 (August 16, 2012) (“77 Fed. Reg. 49490”) at 49513. 10 Brown, Heather, Memorandum to Bruce Moore, U.S.EPA/OAQPS/SPPD re Composition of Natural Gas for use in the Oil and Natural Gas Sector Rulemaking, July 28, 2011 (“Brown Memo”) at 3. 11 Colborn, Theo et al., Natural gas operations from a public health perspective, 17 Hum. & Ecol. Risk Assessment 1039 (2011). 12 Id.
PETITION TO REDUCE EMISSIONS OF NATURAL GAS FROM OIL AND GAS OPERATIONS Page iv
PETITIONERS
The Center for Biological Diversity (“the Center”) is a non-profit environmental organization dedicated to the protection of native species and their habitats through science, policy, and environmental law. The Center also works to reduce greenhouse gas emissions and other air pollution to protect biological diversity, our environment, and public health. The Center has over 38,000 members, including many who live in the areas affected by oil and gas development on BLM-managed lands. Center members have visited these public lands for recreational, scientific, educational, and other pursuits and intend to continue to do so in the future, and are particularly interested in protecting the many native, imperiled, and sensitive species and their habitats that may be affected by oil and gas development, and in protecting the quality of the air we breathe.
The Western Environmental Law Center is a non-profit public interest law firm. Since
1993, the Western Environmental Law Center has used the power of the law to defend and protect the American West’s treasured landscapes, iconic wildlife, and rural communities. WELC combines legal advocacy with sound conservation biology and environmental science to address major environmental issues in the West through sustained strategic advocacy campaigns and projects. WELC also integrates national policy strategies and regional perspective with the local knowledge of our 120+ partner groups to implement smart and appropriate place-based actions. WELC’s Climate & Energy Program highlights the most pressing issue of our time: climate change. This program is focused on three objectives: (1) reducing greenhouse gas pollution from the production and combustion of fossil fuels; (2) facilitating the transition to the efficient and responsible use of clean, renewable, carbon-free energy; and (3) protecting and restoring the resiliency of the wildlands and communities to withstand the impacts of a warming plant.
Clean Air Task Force (“CATF”) is a nonprofit organization dedicated to reducing
atmospheric pollution through research, advocacy and private sector collaboration, and is actively involved in state and federal efforts to reduce the environmental and climate impacts from oil and gas operations.
PETITION TO REDUCE EMISSIONS OF NATURAL GAS FROM OIL AND GAS OPERATIONS Page v
TABLE OF CONTENTS
I. INTRODUCTION.................................................................................................................... 1
II. STATUTORY BACKGROUND ........................................................................................... 1
A. The Mineral Leasing Act Requires the BLM to Use All Reasonable Precautions to Prevent Waste of Gas on Federal Leases................................................................................ 1
B. The Federal Land Policy and Management Act Requires the BLM to Take Any Action Necessary to Prevent Unnecessary or Undue Degradation of Public Lands............... 2
III. FACTUAL BACKGROUND ............................................................................................... 3
A. Relationship of This Petition to Other Agency Actions.................................................... 3
B. Deep and Rapid Methane Reductions are Urgently Needed To Prevent Unlawful Waste and Unnecessary and Undue Degradation of Public Lands...................................... 5
C. Natural Gas Operations are the Largest Source of U.S. Methane Emissions ................ 7
D. Oil and Gas Operations Emit Other Harmful Air Pollutants ......................................... 8
E. Methane Emissions from Federal Gas Leases Could Be Easily and Affordably Reduced Through Better Application of Currently Available Technology ........................ 9
IV. DESCRIPTION OF PROPOSED CHANGES ................................................................. 10
A. BLM Should Update its Regulations................................................................................ 11
B. BLM’s New Onshore Oil & Gas Order # 9 Should Direct Owners and Operators to Minimize the Loss of Natural Gas......................................................................................... 17
C. BLM Should Update Its NTLs.......................................................................................... 18
1. BLM Should Update NTL-3A in Order to Minimize Unnecessary or Accidental Greenhouse Gas Emissions ............................................................................................ 19
2. BLM Should Update NTL-4A to Require the Best Available Technology for Capture of Lost Gas........................................................................................................ 20
V. CONCLUSION...................................................................................................................... 26
LIST OF REFERENCES CITED AND ATTACHED............................................................ 28
APPENDIX A: SUMMARY OF TECHNOLOGIES AND TECHNIQUES TO REDUCE METHANE EMISSIONS FROM OIL AND GAS OPERATIONS....................................... 33

PETITION TO REDUCE EMISSIONS OF NATURAL GAS FROM OIL AND GAS OPERATIONS Page vi
APPENDIX B: CLIMATE CHANGE SCIENCE SUMMARY, JUNE 2012........................ 41

PETITION TO REDUCE EMISSIONS OF NATURAL GAS FROM OIL AND GAS OPERATIONS Page 1
I. INTRODUCTION
Pursuant to the Administrative Procedure Act (APA), 5 U.S.C. § 551 et seq., and 43 C.F.R. § 14.2, Petitioners Center for Biological Diversity, Clean Air Task Force, and Western Environmental Law Center hereby request that the Secretary of the Department of the Interior and Bureau of Land Management (collectively, “BLM”) update BLM regulations and notices to lessees (“NTLs”) governing oil and natural gas leases on federal leases in order to minimize the significant leakage of methane that currently occurs during oil and natural gas activities on federal oil and gas leases.13
Oil and gas operations leak very large amounts of natural gas. Natural gas is made up primarily of the powerful greenhouse gas methane and also contains toxic volatile organic compounds like benzene, toluene, ethylbenzene, and xylenes. Available evidence demonstrates that operators can substantially and economically reduce these emissions. The Mineral Leasing Act (“MLA”) mandates that the BLM require operators to take all reasonable actions to prevent the waste of oil and gas.14 The Federal Land Policy and Management Act (“FLPMA”) mandates that the agency prevent the unnecessary or undue degradation of public lands, including through the emission of air pollutants, and contains additional, complementary directives that BLM manage public lands in a manner that protects ecological, environmental, air and atmosphere, and water resource values.15 Petitioners request changes to BLM’s regulations, orders, and notices to lessees that will substantially reduce natural gas emissions.
This Petition is divided into three main sections. The statutory background section
explains how the MLA and FLPMA require that BLM take action to reduce natural gas emissions from oil and gas operations on federal leases. The factual background section describes the urgent need for methane emission reductions and the techniques and technologies currently available that can cut natural gas emissions substantially and economically. Finally, the recommendations section describes changes BLM should make to its regulations, orders, and notices to lessees to achieve these reductions.
II. STATUTORY BACKGROUND
A. The Mineral Leasing Act Requires the BLM to Use All Reasonable Precautions to Prevent Waste of Gas on Federal Leases
Under the MLA,16 BLM grants leases for the development of gas, oil, coal, and a number of other leasable minerals on public lands. The MLA establishes the qualifications, limits, and
13 Petitioners gratefully acknowledge the assistance of Amanda Prentice and David McGrath, students at the UCLA School of Law Frank Wells Environmental Clinic and Cara Horowitz, clinical instructor and Andrew Sabin Family Foundation Executive Director of the Emmett Center on Climate Change and the Environment, for their assistance with this Petition. 14 30 U.S.C. § 181 et. seq. (2010). 15 See 43 U.S.C. § 1701(a)(8), (9); 1702(c); see also id. § 1740 (requiring “the promulgation of rules and regulations to carry out” these purposes). 16 30 U.S.C. § 181 et. seq. (2010).
PETITION TO REDUCE EMISSIONS OF NATURAL GAS FROM OIL AND GAS OPERATIONS Page 2
payment process required for such leases on federal lands and other private lands where the government has retained mineral rights. The MLA requires the BLM to prevent the waste of gas on federal leases.
Specific language in the MLA demonstrates that Congress charged the BLM with
minimizing waste of natural gas on federal leases. Section 225 of the MLA provides:
All leases of lands containing oil or gas, made or issued under the provisions of this chapter, shall be subject to the condition that the lessee will, in conducting his explorations and mining operations, use all reasonable precautions to prevent waste of oil or gas developed in the land . . . . Violations of the provisions of this section shall constitute grounds for the forfeiture of the lease, to be enforced as provided in this chapter.17
This language makes clear that the BLM must require that firms produce oil and gas in a manner that utilizes all reasonable measures to prevent waste. This statutory mandate is unambiguous and BLM must enforce it.18
Although this mandate plainly requires that BLM prevent the waste of natural gas, the legislative history and BLM’s own regulations further detail this bar on waste. The legislative history shows Congress’s deep concern with the waste of oil and gas, and its desire for the agency to require operational controls to prevent it. Congress enacted the law in large part as a response to a perceived waste of petroleum resources that the nation would need in the future.19 Indeed, Congress was so concerned with this issue that “[c]onservation through control was the dominant theme of the debates.”20 BLM regulations interpret the statute to require that operations “protect[] other natural resources and the environmental quality, protect[] life and property and result[] in the maximum ultimate recovery of oil and gas with minimum waste and with minimum adverse effect on the ultimate recovery of other mineral resources.”21 But these rules are significantly out of date. B. The Federal Land Policy and Management Act Requires the BLM to Take Any Action Necessary to Prevent Unnecessary or Undue Degradation of Public Lands
Pursuant to the Federal Land Policy and Management Act (“FLPMA”),22 BLM must take any action necessary to prevent unnecessary or undue degradation of public lands and must minimize adverse impacts to public lands and the environment.23 FLPMA includes numerous
17 30 U.S.C. § 225 (2010); see also 30 U.S.C. § 189. 18 Tenn. Valley Auth. v. Hill, 437 U.S. 153, 184 n.29 (1978) (stating that “[w]hen confronted with a statute which is plain and unambiguous on its face,” “it is not necessary to look beyond the words of the statute.”). 19 Boesche v. Udall, 373 U.S. 472, 481 (1963). 20 Id. (citing H.R. Rep. No. 398, 66th Cong., 1st Sess. 12-13; H.R. Rep. No. 1138, 65th Cong., 3d Sess. 19.). 21 43 C.F.R. § 3161.2. 22 43 U.S.C. § 1701 et seq. 23 Further, Secretarial Order 3226 (January 19, 2001) (“Order”) commits the Department of the Interior to addressing climate change through its planning and decision-making processes. The Order provides that “climate change is impacting natural resources that the Department of the Interior (Department) has the responsibility to
PETITION TO REDUCE EMISSIONS OF NATURAL GAS FROM OIL AND GAS OPERATIONS Page 3
provisions protecting public lands and the environment. In particular, the statute requires the agency to “take any action necessary to prevent unnecessary or undue degradation of the lands.”24 Written in the disjunctive, this provision requires both that BLM must prevent degradation that is “unnecessary” as well as degradation that is “undue.”25 This protective mandate applies to BLM’s planning and management decisions.26
Further, the statute requires that: [T]he public lands be managed in a manner that will protect the quality of the scientific, scenic, historical, ecological, environmental, air and atmospheric, water resource, and archeological values; that, where appropriate, will preserve and protect certain public lands in their natural condition; that will provide food and habitat for fish and wildlife and domestic animals; and that will provide for outdoor recreation and human occupancy and use.27 Thus, FLMPA’s strong public lands and environmental protections plainly bar oil and gas
operations that waste natural gas. Wasted gas drives climate change, harms public health and federal economic interests, and is uneconomical. Thus, such waste violates FLPMA because harming the environment and human health is both “undue” and “unnecessary,” and is inconsistent with BLM’s duty to manage public lands in a way that protects the environment and minimizes harm to natural resources.
III. FACTUAL BACKGROUND
A. Relationship of This Petition to Other Agency Actions
BLM should implement the changes requested in this petition in addition to other actions BLM and other agencies have issued or proposed. Other actions include: BLM’s proposed rule to regulate hydraulic fracturing on public land and Indian land;28 BLM’s announced plan to promulgate a new Onshore Oil and Gas Order #9, which BLM indicates will “establish standards to limit the waste of vented and flared gas and to define the appropriate use of oil and gas for beneficial use”;29 and EPA’s new source performance standards for sources in the oil and natural
manage and protect.” Sec. Or. 3226, § 1. The Order also “ensures that climate change impacts are taken into account in connection with Department planning and decision making.” Id. “Departmental activities covered by this Order” include “management plans and activities developed for public lands” and “planning and management activities associated with oil, gas and mineral development on public lands.” Id. (emphasis added). This Order, notably, was reaffirmed by Secretary Salazar in a subsequent order. See Sec. Or. 3289 (Sept. 14, 2009). 24 43 U.S.C. § 1732(b). 25 Mineral Policy Ctr. v. Norton, 292 F.Supp.2d 30, 41-43 (D. D.C. 2003). 26 See Utah Shared Access Alliance v. Carpenter, 463 F.3d 1125, 1136 (10th Cir. 2006) (finding that BLM’s authority to prevent degradation is not limited to the RMP planning process). 27 43 U.S.C. § 1701(a)(8). 28 USEPA Well Stimulation 29 Federal Register on BLM Onshore Oil and Gas Order 9.

PETITION TO REDUCE EMISSIONS OF NATURAL GAS FROM OIL AND GAS OPERATIONS Page 4
gas industry.30 While each of these actions may provide some reduction of methane emissions from oil and gas operations or address related impacts from oil and gas development, BLM must also implement the actions this petition requests in order to comply with its duties with respect to federal lands and resources, pursuant to the MLA and FLPMA.
BLM has proposed new regulations for oil and gas well stimulation, including hydraulic
fracturing on public lands, Indian lands, and private lands containing federal mineral resources.31 The proposed regulations, while long-overdue and certainly welcome, are aimed at water quality protection, disclosure of chemicals used in fracking fluid, and well integrity, and do not in fact add any direct controls for methane emissions.32 Thus, the proposed regulations do not address one of the principle dangers of fracking. The petitioned regulatory changes could help fill this void, or if BLM correctly determines that the proposed fracking regulations should regulate air pollution as well, could complement other these other regulations.
BLM has also announced an upcoming effort to promulgate a new Onshore Oil and Gas
Order #9, which BLM indicates will “establish standards to limit the waste of vented and flared gas and to define the appropriate use of oil and gas for beneficial use.”33 It appears that BLM intends to issue a Notice of Proposed Rulemaking in November 2012. We agree that a new Onshore Oil and Gas Order #9 addressing the waste of methane gas is appropriate. In this petition we request a number of coordinated changes to the regulations and existing notices to lessees in order to eliminate the waste of methane gas that are entirely consistent with promulgation of a new Onshore Oil and Gas Order #9 to achieve the same or similar ends. BLM can and should take all necessary action to end the waste of methane gas.
EPA’s recently promulgated New Source Performance Standards (“NSPS”) for oil and
gas operations place limits on some air pollutants from oil and gas wells. EPA asserts that under this rule, required controls for VOC emissions will result in reductions of approximately one million metric tons of methane in 2015 as a co-benefit. However, entirely distinct from EPA’s duty to protect air quality, the MLA and FLPMA require that BLM prevent waste of natural gas and minimize adverse effects to public lands. This separate obligation requires that BLM demand even greater reductions than EPA expects the NSPS to achieve. Industry can easily attain these deeper reductions. The NSPS do not specifically target or include enforceable limits for methane emissions.34 Moreover, the NSPS require only a limited number of controls for a small number of oil and gas activities,35 even though a much broader range of activities emit methane and many more controls are available to halt those emissions. Thus, the NSPS will reduce methane
30 U.S. Environmental Protection Agency, Oil and Natural Gas Sector; New Source Performance Standards and National Emission Standards for Hazardous Air Pollutants Reviews; Final Rule, 77 Fed. Reg. 49490 (August 16, 2012) (“77 Fed. Reg. 49490”) at 49513. 31 77 Fed. Reg. 27691. 32 See 77 Fed. Reg. 27691at 27709-27711. 33 Federal Register on BLM Onshore Oil and Gas Order 9 ; see also GAO Report 2010 at 46 (“The BLM will develop new standards to require use of new technologies that can economically capture vented and flared natural gas used in lease operations The new standards will be incorporated in the new proposed Onshore Order on waste prevention and beneficial use.”) 34 77 Fed. Reg. 49490 at 49513. 35 See 77 Fed. Reg. 49490 at 49,497.
PETITION TO REDUCE EMISSIONS OF NATURAL GAS FROM OIL AND GAS OPERATIONS Page 5
emissions by less than 10 percent,36 even though available technologies could cut emissions by more than 80 percent.37 This leaves plenty of room for BLM to create additional protections. Finally, some of the NSPS’s measures promising the largest reductions do not take effect until 2015, and it is possible the effective date could be pushed back if industry were to successfully challenge the standard, for example. In sum, BLM must act immediately to comply with its own mandate to prevent the release of methane. B. Deep and Rapid Methane Reductions are Urgently Needed To Prevent Unlawful Waste and Unnecessary and Undue Degradation of Public Lands Deep cuts in methane emissions from oil and gas operations are not only required under the MLA, but also are necessary to prevent unnecessary and undue degradation of public lands as required by FLPMA. The need for deep and rapid greenhouse emissions reductions to prevent harmful climate change has been explicated in numerous synthesis documents by the nation’s and the world’s leading scientific institutions, including, inter alia, the Intergovernmental Panel on Climate Change (IPCC) Fourth Assessment Report,38 the Global Change Research Program’s National Assessment of Climate Change Impacts in the United States,39 and the EPA’s Clean Air Act Section 202 Endangerment Finding.40 Attached as Appendix B is a summary, by Dr. Shaye Wolf, of the current scientific understanding of climate change. This summary describes the scientific consensus that climate change is here, that it is already resulting in severe effects worldwide, and that the negative impacts will worsen if the world does not take urgent action to reduce greenhouse gas emissions.
While carbon dioxide warms the atmosphere over long periods of time, methane
emissions are especially powerful over the short-term. Indeed, methane is 33 times more potent than carbon dioxide in warming the globe over a one-hundred-year period, and 105 times as potent as carbon dioxide over a twenty-year period.41 Methane is already the most abundant greenhouse pollutant in the atmosphere today other than carbon dioxide,42 and atmospheric
36 U.S. Environmental Protection Agency, Regulatory Impact Analysis - Final New Source Performance Standards and Amendments to the National Emissions Standards for Hazardous Air Pollutants for the Oil and Natural Gas Industry, Office of Air Quality Planning and Standards (April 2012), http://www.epa.gov/ttn/ecas/regdata/RIAs/oil_natural_gas_final_neshap_nsps_ria.pdf, at 4-29. 37 Natural Resources Defense Council, Leaking Profits: The U.S. Oil and Gas Industry Can Reduce Pollution, Conserve Resources, and Make Money by Preventing Methane Waste, (2012), available at http://www.nrdc.org/energy/files/Leaking-Profits-Report.pdf (“NRDC Leaking Profits”) at 3. 38 Intergovernmental Panel on Climate Change, Climate Change 2007: Synthesis Report. An Assessment of the Intergovernmental Panel on Climate Change (2007), available at www.ipcc.ch. 39 United States Global Change Research Program, National Assessment of Climate Change Impacts in the United States (2009). 40 U.S. Environmental Protection Agency, Endangerment and Cause or Contribute Findings for Greenhouse Gases Under Section 202(a) of the Clean Air Act; Final Rule, 74 Fed. Reg. 66,496 (Dec. 15, 2009). 41 Shindell, Drew T. et al, Improving Attribution of Climate Forcing to Emissions, 326 Science 716, 717 (Oct. 30, 2009) (text of figure 2); GAO Report 2010. 42 S.A. Montzka et al., Non-CO2 Greenhouse Gases and Climate Change, 476 Nature 43 (2011) (“Montzka 2011”); National Research Council, Climate Stabilization Targets: Emissions, Concentrations, and Impacts over Decades to Millennia (2010).
PETITION TO REDUCE EMISSIONS OF NATURAL GAS FROM OIL AND GAS OPERATIONS Page 6
methane concentrations are increasing, with a particularly sharp increase occurring since 2007. 43 Levels are now approximately 150 percent above concentrations at the start of the industrial revolution,44 and records show that they are higher than at any other point during the past 800,000 years.45
Methane is also an ozone precursor, meaning that once in the atmosphere, methane
contributes to the formation of ozone.46 In addition to its numerous negative health impacts, ozone causes damage to crops and other vegetation, and ozone also is itself a greenhouse gas that is particularly effective at warming the Arctic in the spring.47 Reducing methane will thus have the additional benefit of reducing ozone concentrations and ozone-related warming.
Thus, reducing anthropogenic methane emissions from federal oil and gas leases is
incredibly important to halting global warming, to preventing unnecessary and undue degradation of public lands, and to protecting the ecological, environmental, air, atmospheric, water, and other resources of the public lands as FLPMA requires. Climate change threatens to cause and is already causing numerous harmful impacts to public lands. Climate change causes drought, increasing drinking and irrigation water scarcity, causing conflict between uses and potentially hard choices regarding which use receives preference.48 Indeed, in some areas, like Texas, water is already disappearing as a result of extreme droughts that the head of the National Oceanic and Atmospheric Administration’s climate office says cannot be explained by natural variability alone.49 Paradoxically, the warmer climate and intensified water cycle will also increase the risk of flooding in some locations, which can harm people, lands, wildlife, and infrastructure.50
Landscapes also are being transformed as a result of increased temperatures, droughts,
wildfires, and invasive species. Also, climate change is reducing snow accumulation in the winter, and along with the snow, winter activities, such as skiing.51 For example, California’s
43 Forster, Piers et al., Changes in Atmospheric Constituents and in Radiative Forcing in Climate Change 2007: The Physical Science Basis - Contribution of Working Group I to the Fourth Assessment Report of the IPCC (Susan Solomon et al., eds. 2007) (“Forster 2007”); Montzka 2011. 44 Forster 2007; Montzka 2011. 45 Forster 2007; Montzka 2011. 46 Environmental Protection Agency, Regulatory Impact Analysis Proposed New Source Performance Standards and Amendments to the National Emissions Standards for Hazardous Air Pollutants for the Oil and Natural Gas Industry (July 2011), http://www.epa.gov/ttnecas1/regdata/RIAs/oilnaturalgasfinalria.pdf, at 4-27. 47 Shindell, D. et al, Simultaneously Mitigating Near-Term Climate Change and Improving Human Health and Food Security, 335 Science 183 (Jan. 13, 2012) (“Shindell 2012”); West, J. J. et al, Global Health Benefits of Mitigating Ozone Pollution with Methane Emission Controls, 103 PNAS 3988 (Jan. 11, 2006). 48 United States Global Change Research Program, Global Climate Change Impacts in the United States (2009) (“USGCRP 2009”) at 129. 49 Andrews, Wyatt, NOAA links extreme weather to climate change, CBS News (July 10, 2012) http://www.cbsnews.com/8301-18563_162-57469878/noaa-links-extreme-weather-to-climate-change?tag=currentVideoInfo;videoMetaInfo. 50 USGCRP 2009 at 132. 51 USGCRP 2009 at 133.
PETITION TO REDUCE EMISSIONS OF NATURAL GAS FROM OIL AND GAS OPERATIONS Page 7
Sierra Nevada Mountains are expected to lose 70 to 90 percent of its snowpack by 2100.52 Further, the warming and changing climate will have a profound effect on ecosystems.
An additional concern associated with methane emissions is the potential for those
emissions to push the climate past a tipping point, committing us to catastrophic and irreversible warming. For example, in the Arctic, an ice-albedo feedback loop is already well underway, with the loss of highly reflective sea ice due to warming increasing solar absorption, making the Arctic more vulnerable to future warming and ice loss.53 Methane emissions are a major contributor to the ice loss, and methane mitigation is urgently needed to slow the Arctic melt.54 The warming of the Arctic and loss of Arctic ice is itself contributing to extreme whether events in the continental United States.55 Thus, methane emissions from oil and gas development are clearly causing and contributing to the unnecessary and undue degradation of public lands and their ecological, environmental, air, atmospheric, and water resources. C. Natural Gas Operations are the Largest Source of U.S. Methane Emissions
Development of federal oil and gas leases produces substantial amounts of air pollution. In particular, these operations emit large amounts of natural gas, which consists primarily of methane. Natural gas and petroleum systems are substantial sources of anthropogenic natural gas and methane emissions, with natural gas systems in particular being the largest single source. The U.S. oil and gas industry produced 26,000 billion cubic feet (“Bcf”) of gas in 2009 from both private and public lands. According to a very conservative estimate that very likely underestimates emissions rates, 623 Bcf of this was lost to the atmosphere. These emissions account for approximately 37 percent of all U.S. methane emissions.56 Emissions from federal leases account for about 11% of U.S. gas production and about 5% of U.S. oil production.57 In a 2010 report, the Government Accountability Office (“GAO”) compiled data from various sources and estimated the amount of vented and flared gas from federal leases at 126 Bcf per year, which is the equivalent to the natural gas needed to heat 1.7 million homes in one year.58
Methane emissions occur across all phases of the natural gas production cycle (i.e.,
development, production, processing, transmission, and distribution). Emissions are both intentional and unintentional, and occur during normal operations, as well as a result of leaks and system upsets. While significant uncertainty exists regarding emission rates, production likely produces the most emissions from natural gas systems by a large margin. More specifically, substantial sources of emissions are compressors (accounting for an estimated 15 percent of emissions); wellhead facilities, including well clean ups (33 percent) and well completions and
52 California Climate Change Center, Our Changing Climate, Assessing the Risks to California at 6 (2006), http://meteora.ucsd.edu/cap/pdffiles/CA_climate_Scenarios.pdf. 53 Watts, Susan, Arctic ice melt 'like adding 20 years of CO2 emissions', BBC News (Sept. 6, 2012), http://www.bbc.co.uk/news/science-environment-19496674. 54 Hansen, James et al., Climate change and trace gases, 365 Phil. Trans. R. Soc. A 1925 (2007). 55 Francis, J. and Stephen Vavrus, Evidence linking Arctic amplification to extreme weather in mid-latitudes, 39 Geophys. Res. Lett L06801 (2012). 56 NRDC Leaking Profits at 4. 57 http://www.blm.gov/wo/st/en/prog/energy/oil_and_gas.html. 58 GAO Report at 12. This data is from 2008.

PETITION TO REDUCE EMISSIONS OF NATURAL GAS FROM OIL AND GAS OPERATIONS Page 8
workovers (9 percent); fugitive emissions (15 percent); dehydrator vents (1 percent); pneumatic controllers (11 percent); pipeline emissions (3 percent); and tank venting (1 percent).59
While most emissions come from natural gas operations, oil operations are also significant emissions sources. One report states that 12 percent of methane emissions from U.S. oil and gas operations come from liquid petroleum systems.60 The primary sources from oil activities are field production, oil storage tanks, and production-related equipment. Specifically, sources of emissions are fugitive emissions (49 percent), pneumatic controllers (29 percent), tank venting (14 percent), combustion and process upsets (6 percent), and refining (2 percent). D. Oil and Gas Operations Emit Other Harmful Air Pollutants In addition to methane emissions, oil and gas operations’ leakage and disposal of natural gas causes other air pollution emissions that are harmful to the climate, public health, and the environment. While natural gas is primarily methane, it is also approximately 3.5 percent volatile organic compounds (“VOCs”) by volume.61 The VOCs emitted include the harmful BTEX compounds—benzene, toluene, ethyl benzene, and xylene—which Congress listed as Hazardous Air Pollutants under the Clean Air Act.62 There is substantial evidence of harm from the VOCs oil and gas operations emit. For instance, one analysis found that 37 percent of the chemicals used during natural gas drilling, fracturing, and production were volatile and able to become airborne. Further, this study found that the volatile chemicals were likely to be very harmful, stating that of the VOCs reviewed “(81%) can cause harm to the brain and nervous system. Seventy one percent of the volatile chemicals can harm the cardiovascular system and blood, and 66% can harm the kidneys.”63 Also, as discussed directly below, VOC emissions contribute to smog. The flaring (combustion) of natural gas also causes harmful air pollution. The complete combustion of the gas results in the emission of carbon dioxide and water. Carbon dioxide is a greenhouse gas and the principle driver of climate change, so flaring still contributes to global warming, albeit at a lesser rate than simply venting or leaking the methane. However, flaring results in other emissions as well, since combustion during flaring is rarely complete. Other harmful pollutants emitted during flaring include nitrogen oxides (“NOX”), particulate matter, and VOCs. NOX and VOCs are ozone precursors, meaning they contribute to ground level ozone (smog) formation. Ozone has serious health effects. It can irritate the respiratory system, reduce lung function, aggravate asthma, and inflame and damage the lining of the lungs, and may aggravate chronic lung disease.64 Smog has become a serious problem in a number of rural areas where oil and gas activities are occurring. For instance, in 2009, the governor of Wyoming
59 NRDC Leaking Profits at 10. 60 Id. at 4. 61 Brown Memo at 3. 62 Colborn, Theo et al., Natural gas operations from a public health perspective, 17 Hum. & Ecol. Risk Assessment 1039 (2011). 63 Id. 64 AirNow, Smog-Who does it hurt?, http://www.airnow.gov/index.cfm?action=smog.page1#3 (last visited September 10, 2012).

PETITION TO REDUCE EMISSIONS OF NATURAL GAS FROM OIL AND GAS OPERATIONS Page 9
recommended that the state designate Wyoming’s Upper Green River Basin as an ozone nonattainment area.65 Also, in 2011 alone, the residents of Sublette County had thirteen “unhealthy” ozone days, under EPA’s current air-quality index, including days when the ozone pollution levels exceeded the worst days of smog pollution in Los Angeles.66
Particulate matter consisting of tiny particles suspended in the air also results from flaring activity. These particles include “inhalable coarse particles,” which are smaller than ten micrometers in diameter (PM10), and fine particulate matter, which are particles less than 2.5 micrometers in diameter (PM2.5). PM10 is formed by, among other things, motor vehicles driving on dirt roads; PM2.5 is primarily formed by incomplete combustion of fuels, as occurs with flaring.67 Some of the health effects associated with particulate matter exposure are “premature mortality, increased hospital admissions and emergency department visits, and development of chronic respiratory disease.”68 Sensitive populations, include the elderly, children, and people with existing heart or lung problems, are most at risk from particulate matter pollution.69 E. Methane Emissions from Federal Gas Leases Could Be Easily and Affordably Reduced Through Better Application of Currently Available Technology
A number of affordable technologies exist which can greatly reduce the amount of pollution oil and gas operations emit. Numerous studies and articles, including a 2010 Government Accountability Office (GAO) Report to Congress, identify many different technologies that are available to reduce methane leakage at various stages of oil and gas operations.70 According to EPA data, 40 percent of vented and flared gas from federal leases could be feasibly captured, representing an additional $23 million in royalty revenue for the U.S. government.71 Moreover, according to industry and EPA officials, the cost of implementing these technologies is recovered quickly as newly captured gas is sold,72 and as EPA’s Natural
65 See Letter from Wyoming Governor Dave Freudenthal to Carol Rushin, Acting Regional Administrator, U.S.EPA Region 8, (Mar. 12, 2009); Wyoming Department of Environmental Quality, Technical Support Document I for Recommended 8-hour Ozone Designation of the Upper Green River Basin (March 26, 2009). 66 U.S. Environmental Protection Agency, Daily Ozone AQI Levels in 2011 for Sublette County, Wyoming; see also Wendy Koch, USA Today, Wyoming's Smog Exceeds Los Angeles' Due to Gas Drilling, (Mar 9, 2011); Craft, Elena, Environmental Defense Fund, Do Shale Gas Activities Play a Role in Rising Ozone Levels? (2012), http://blogs.edf.org/texascleanairmatters/2012/07/10/do-shale-gas-activities-play-a-role-in-rising-ozone-levels/ 67 U.S. Environmental Protection Agency , Technology Transfer Network - PM10 NAAQS Implementation, http://www.epa.gov/ttn/naaqs/pm/pm10_index.html; Bay Area Air Quality Management District, Health Impact Analysis of Fine Particulate Matter in the San Francisco Bay Area at 1 (Sep. 2011) http://www.baaqmd.gov/~/media/Files/Planning%20and%20Research/Research%20and%20Modeling/Cost%20analysis%20of%20fine%20particulate%20matter%20in%20the%20Bay%20Area.ashx 68 U.S. Environmental Protection Agency, National Ambient Air Quality Standards for Particulate Matter Proposed Rule, 77 Federal Register 38890 (June 29, 2012). 69 World Health Organization, Health Aspects of Air Pollution with Partiuclate Matter, Ozone, and Nitrogen Dioxide (2003) at 17, http://www.euro.who.int/__data/assets/pdf_file/0005/112199/E79097.pdf. 70 GAO Report at 7-10; Megan Williams & Cindy Copeland, Methane Controls for the Oil and Gas Production Sector (Nov. 23, 2010) at 11. 71 GAO Report at 20. 72 Id. at 21.

PETITION TO REDUCE EMISSIONS OF NATURAL GAS FROM OIL AND GAS OPERATIONS Page 10
Gas STAR program demonstrates, in most cases, the cost of implementing these control technologies can be recovered in less than one year.73
Appendix A contains a summary of some of the controls available and their effectiveness.
Examples of effective technologies include:
green completions, also known as reduced emissions completions, that capture liquids and gases coming out of the well during “completions” using equipment brought to a well site. The equipment routes fluids and gases to a tank for separation to enable sale of gas and condensate;
liquids unloading systems, which are systems installed to lift accumulated liquids in the wellbore to the surface, allowing the capture and sale, rather than venting, of methane gas;
TEG dehydrator emission controls or desiccant dehydrators that capture methane gas while the gas is being dehydrated;
dry seal systems that reduce emissions from centrifugal compressors that often leak from the seals in centrifugal compressors and the rod packing mechanisms in reciprocating compressors; and
leak monitoring and repair.
One recent report found that the implementation of technologies and practices to prevent wasteful emissions of natural gas could reduce methane emissions from the oil and gas industry overall by 80 percent and generate more than $2 billion in revenue annually.74 Also, the elimination of natural gas emissions would have the added benefit of reducing VOC emissions significantly, since natural gas is usually about 3.5 percent VOCs by volume. Further, the use of these techniques and technologies would help eliminate the need for flaring, which would eliminate harmful NOX, PM, and VOC emissions.
IV. DESCRIPTION OF PROPOSED CHANGES
The MLA specifically requires BLM to prevent the waste of gas on federal leases, while
FLPMA requires, inter alia, that BLM prevent unnecessary or undue degradation of public lands. However, BLM’s 30-year-old regulations fail to prevent such waste and degradation. Significantly, the regulations leave many essential regulatory terms ambiguous or wholly undefined. The BLM must update its regulations and NTLs as described below in order to improve its management of our public lands and to ensure compliance with its statutory duties. New standards will benefit owners and operators, as well as the public and the government. Many existing technologies can greatly reduce emissions of methane into the ambient air, and are so cost effective that their implementation cost can be recovered in a short period of time. Further, by recovering additional salable gas, these technologies can generate additional revenue for the government.
73 Id. 74 NRDC Leaking Profits at 5.
PETITION TO REDUCE EMISSIONS OF NATURAL GAS FROM OIL AND GAS OPERATIONS Page 11
A. BLM Should Update its Regulations
Petitioners request that BLM impose a consistent obligation on operators and lessees to
employ the best available technology and to comply with a performance standard creating a ceiling leakage rate that operators cannot exceed to prevent and minimize natural gas leakages during all oil and gas activities on federal leases and land. To do so, Petitioners suggest changes to a set of interlocking regulations that impose a general obligation to minimize waste, define when operators are required to pay royalties for lost gas, and establish penalties and other enforcement provisions.
Specifically, Petitioners first request a set of changes that clarify and ensure compliance
with the underlying obligation of all lessees to minimize waste of natural gas. These changes primarily affect the regulation at 43 C.F.R. § 3162.1 and its underlying definitions.
BLM should modify 43 C.F.R. § 3162.1(a) to clarify that operators must operate in a
manner that protects the environment and conserves mineral resources as follows:
The operating rights owner or operator, as appropriate, shall comply with applicable laws and regulations; with the lease terms, Onshore Oil and Gas Orders, NTL’s; and with other orders and instructions of the authorized officer. These include, but are not limited to, conducting all operations in a manner which ensures the proper handling, measurement, disposition, and site security of leasehold production; which protects other natural resources and environmental quality; and which protects life and property.; The operating rights owner or operator shall conduct all operations in a manner and which, as a first priority, protects the environment and public health including by minimizing waste and which also results in maximum ultimate economic recovery of oil and gas and, as a second priority, results in with minimum waste and with minimum adverse effect on ultimate recovery of other mineral resources.
BLM should add a definition of “best available technology for oil and gas operations” at 43 C.F.R. § 3160.0-5 as follows:
Best Available Technology means the following: (1) Best Available Technology shall result in an emission rate that does not exceed the natural gas emissions performance standard. (2) Best Available Technology at a minimum includes the use of the following controls:
Recovery and Storage—All recovered liquids must be routed into storage vessels and all recovered gases must be routed into a gas gathering line or collection system.
PETITION TO REDUCE EMISSIONS OF NATURAL GAS FROM OIL AND GAS OPERATIONS Page 12
Compressors—Operators shall implement a maintenance program for compressors that is in line with best industry practices. Operators shall also employ tandem dry seals for all centrifugal compressors used in the production and transmission of natural gas. Wellhead Facilities—Operators shall employ at wellhead facilities:
reduced emission completions equipment to eliminate emissions from wells at all times following perforation of the well casing until flowback has ceased;
and a plunger lift system or similar system with an equal or greater methane capture rate to remove accumulated fluids from wells.
Vapor Recovery Units—Operators shall employ vapor recovery units with all storage tanks that recover, at minimum, 99 percent of all vapors. Recovered vapors shall not be leaked to the ambient air. Dehydrators—In removing water from produced gas prior to transmitting the gas, Operators shall dehydrate the gas using technology that results in no emissions to the ambient air. Pneumatic Devices—For all pneumatic devices, Operators must employ no-bleed controllers. If Operators are able to demonstrate to the satisfaction of BLM that the use of a no-bleed controller is impossible, the Operators may use a low-bleed controller. High bleed pneumatic devices are prohibited in all circumstances. Pipelines—All pipelines shall be constructed using plastic pipe. If Operators are able to demonstrate to the satisfaction of BLM that the use of plastic pipe is infeasible, Operators shall employ plastic insert liners to reduce gas leakage. Excess flow valves shall be installed in all pipelines. Inspection and Maintenance—Facilities shall employ best industry practices for inspection and maintenance.
(3) Best Available Technology shall also include any measures, technologies, or processes that become available after the effective date of these regulations that allow for recovery of additional natural gas, unless the Operators have demonstrated to the satisfaction of BLM that such technologies are not technically feasible or pose a significant, elevated health or safety risk.
BLM should add the following definition of “natural gas emissions performance
standard” at 43 C.F.R. § 3160.0-5:
Natural gas emissions performance standard means a natural gas emission rate for which the loss of natural gas produced from a unitized or communitized field, or

PETITION TO REDUCE EMISSIONS OF NATURAL GAS FROM OIL AND GAS OPERATIONS Page 13
from an individual lease if not contained in a unitized or communitized field, throughout the lifecycles of all contained wells and due to all activities involved in such onshore oil and gas exploration, development, and production—including all leaking, venting, or flaring of gas and all fugitive emissions—are equal to or less than [X percent]75 of all natural gas produced from the activities.
This addition defines the emissions included under the natural gas emissions performance standard broadly. It includes all emissions of natural gas produced from a well due to the exploration, development, and production of oil and gas deposits. Because the flaring of gas is harmful and wasteful and should be eliminated in virtually all instances in the future, the definition includes any flared gas as leakage. Setting such a performance standard is an appropriate way of meeting BLM’s statutory obligations. As mentioned above, one report has shown that cutting more than 80 percent of methane emissions from all phases of oil and gas operations is possible.76
To integrate these new definitions properly, BLM also must amend its definition of “waste” to state that it is wasteful for an operator to fail to employ best available technology or to emit natural gas in excess of the performance standard. Also, in order to ensure the consistent national regulation of gas leases to prevent waste, BLM should remove from this definition the grant of discretion now afforded to authorized officers to determine whether a lease operator has wasted gas. Thus, the improved definition would read:
Waste of oil or gas occurs where (1) the loss of oil or gas results from the operator’s negligence or failure to employ the standard of care of a reasonably prudent operator; (2) an act or failure to act by the operator allows the loss of oil or gas and best available technology has not been implemented; (3) or the loss of gas results in an exceedance of the natural gas emissions performance standard means any act or failure to act by the operator that is not sanctioned by the authorized officer as necessary for proper development and production and which results in: (1) A reduction in the quantity or quality of oil or gas ultimately produceable from a reservoir under prudent and proper operations; or (2) avoidable surface loss of oil or gas. Second, BLM should enhance its definition of “maximum ultimate economic recovery”
by inserting the requirement that a gas lease operator use the “best available technology” and meet the “natural gas emissions performance standard” across its entire range of operations, from exploration to transmission and storage. The expanded definition would read:
75 The performance standard should be the rate of emissions achieved through the application of the best available technologies and techniques at the time of the rulemaking. While absolute precision may be difficult to achieve based on current uncertainties in leakage rates, BLM should use the best available information at the time of the rulemaking to set the standard, including but not limited to information available from the EPA, leak minimization equipment manufacturers, and oil and gas operators. Petitioners believe that currently the performance standard should be approximately 1% of gas produced, but will submit additional information on the precise number during the rulemaking. 76 NRDC Leaking Profits at 3.
PETITION TO REDUCE EMISSIONS OF NATURAL GAS FROM OIL AND GAS OPERATIONS Page 14
Maximum ultimate economic recovery means (1) the recovery of oil and gas from leased lands which a prudent operator could be expected to make from that field or reservoir given existing knowledge of reservoir and other pertinent facts and utilizing feasible common industry practices for primary, secondary or tertiary recovery operations; and (2) the recovery of gas from leased lands which a prudent operator could be expected to make from that field or reservoir given existing knowledge of reservoir and other pertinent facts while utilizing the best available technology for primary, secondary and tertiary recovery operations and not exceeding the natural gas emissions performance standard.
BLM should also clarify the circumstances in which lost gas is considered “avoidably
lost” to account for the best available technology standard and natural gas emissions performance standard. Because the updated regulations would place a hard ceiling on the rate of natural gas emissions, BLM should update the definition of avoidably lost so that natural gas emitted in excess of the emissions performance standard is avoidably lost. Also, the current definition allows the authorized officer to use his or her discretion when determining whether oil or gas has been avoidably lost. BLM should eliminate this provision. Instead, BLM should apply a consistent standard nationally, and should provide clear guidance to field staff. The revised standard should read:
Avoidably lost means the leaking, venting, or flaring of produced gas under the following circumstanceswithout the prior authorization, approval, ratification or acceptance of the authorized officer and the loss of produced oil or gas when the authorized officer determines that such loss occurred as a result of: (1) The operator acts negligently Negligence on the part of the operator; or (2) The operator fails The failure of the operator to take all reasonable measures to prevent and/or control the loss; or (3) The operator fails The failure of the operator to comply fully with the applicable lease terms and regulations, applicable orders and notices, or the written orders of the authorized officer; or (4) The operator causes emissions to exceed the natural gas emissions performance standard; or (5)(4) Any combination of the foregoing.
BLM should also insert a definition of “reasonable measures” into 43 C.F.R. § 3160.0-5.
This term is critical to the operation of the definition of “avoidably lost,” but is not now defined in the regulations.77 BLM should define “reasonable measures” to incorporate the new “best available technology” standard, such that reasonable measures are those that incorporate best available technology in all oil and gas activities under BLM’s jurisdiction. Thus, the definition should read:
77 43 C.F.R. § 3160.0-5 (2010).

PETITION TO REDUCE EMISSIONS OF NATURAL GAS FROM OIL AND GAS OPERATIONS Page 15
“reasonable measures” means the use of the best available technology to maximize production and to minimize waste during all operations.
Additionally, BLM should amend 43 C.F.R. § 3161.2 to employ the resource
management planning process, 43 C.F.R. § 1610, as a tool to prevent the waste of natural gas. Specifically, 43 C.F.R. § 3161.2 should establish that in identifying issues, developing planning criteria, formulating alternatives, selecting alternatives, and undertaking any other procedures that 43 C.F.R. § 1610 requires as part of resource management planning for oil and gas activities, BLM should ensure that all activities authorized by the resource management plan—either individually, or as a whole—will not result in emissions that exceed the natural gas emissions performance standard. Thus, the revised 43 C.F.R. § 3161.2 should read as follows:
The authorized officer is authorized and directed . . . ; and to require that all operations be conducted in a manner which protects other natural resources and the environmental quality, protects life and property and results in the maximum ultimate recovery of oil and gas with minimum waste and with minimum adverse effect on the ultimate recovery of other mineral resources; and to ensure that in preparing resource management plans pursuant to 43 C.F.R. § 1610, the planning process shall analyze the potential for gas emissions and ensure that any final plan will not result in covered activities, either individually or as a whole, exceed the natural gas emissions performance standard. The authorized officer may issue written or oral orders to govern specific lease operations. Any such oral orders shall be confirmed in writing by the authorized officer within 10 working days from issuance thereof. Before approving operations on leasehold, the authorized officer shall determine that the lease is in effect, that acceptable bond coverage has been provided and that the proposed plan of operations is sound both from a technical and environmental standpoint.
Further, to help ensure that operators comply with best available technology and
performance standard requirements, BLM should amend 43 C.F.R. § 3162.1 to require that before approving any activity that could result in the emission of produced gas, BLM must order the operator to demonstrate both (a) that it will employ best available technology, and (b) the technical and economic feasibility of undertaking an activity without violating the performance standard. The subsection should read:
(d) As part of the permitting process for any activity that could result in the emission of produced gas, an operator must demonstrate to BLM that (1) operations will employ best available technology to reduce methane emissions, and (2) it is technically and economically feasible for the operator to complete the proposed activity without violating the natural gas emissions performance standard.
Also, BLM should add a penalty for owners or operators who fail to take “reasonable
measures” to avoid natural gas leakage. Failure to comply with “reasonable measures” should constitute a major violation as defined in 43 C.F.R. § 3160.0-5. “Major violation” is currently defined as “noncompliance that causes or threatens immediate, substantial, and adverse impacts

PETITION TO REDUCE EMISSIONS OF NATURAL GAS FROM OIL AND GAS OPERATIONS Page 16
on public health and safety, the environment, production accountability, or royalty income.”78 An operator’s unnecessary methane emissions must be included within the ambit of noncompliance which causes or threatens immediate, substantial and adverse impacts on the environment, as well as lost royalty revenue. Thus, failure to use “reasonable measures” would subject the operator or owner to penalties. The new subsection should read:
Failure to comply with the reasonable measures defined in section 3160.0-5 of these regulations designed to prevent avoidable leakage, venting or flaring of gas shall constitute a major violation as defined in 43 C.F.R. 3160.0-5. Owners or operators who violate these standards shall be given 90 days upon issuance of this regulation to comply with the reasonable measures as set forth in 43 C.F.R. 3160.0-5. If the owner or operator is not in compliance after this time, he or she shall be subject to the Assessments and Penalties set forth in 43 C.F.R. subpart 3163.
Further, BLM should revise its regulations to require royalty payments on all leaked,
vented, or flared gas. The loss of this gas constitutes the loss of a valuable public resource. If the emission or flaring of some of this gas is unavoidable, the loss of that gas is a cost of business that the Operator or Lessee, not the public, should bear. Thus, BLM should amend 43 C.F.R. § 3162.7(d) as follows:
The operator shall conduct operations in such a manner as to prevent avoidable loss of oil and gas. An operator shall be liable for royalty payments on oil or gas lost or wasted from a lease site, or allocated to a lease site, when such loss or waste is due to negligence on the part of the operator of such lease, or due to the failure of the operator to comply with any regulation, order or citation issued pursuant to this part. An operator shall be liable for royalty payments on all leaked, vented, or flared natural gas. Finally, BLM should amend the reporting and penalty provisions contained in 43 C.F.R.
§ 3163.1 and 3163.2. First, both the “remedies” and “civil penalties” provisions now confer on authorized officers considerable discretion as to whether and under which circumstances penalties shall be assessed. BLM should provide consistent guidance to authorized officers in assessing penalties for noncompliance to ensure that the statutory and regulatory requirements are met. In addition, the paltry penalties currently prescribed by sections 3163.1 and 3163.2 will not deter violation of the rules. BLM must adjust the penalties so that they contribute to meeting the statutory standards and goals. Also, BLM should provide a mechanism that will adjust these penalties for inflation,79 and add an additional penalty for an owner or operator’s noncompliance with the proposed “reasonable measures” definition. BLM should amend 43 C.F.R. § 3163.1 as follows:
78 43 C.F.R. § 3160.0-5 (2010). 79 US Bureau of Labor Statistics, Overview of BLS Statistics on Inflation and Prices, Consumer Price Index Calculator, U.S. Department of Labor, http://www.bls.gov/data/inflation_calculator.htm (last modified May 28, 2010).
PETITION TO REDUCE EMISSIONS OF NATURAL GAS FROM OIL AND GAS OPERATIONS Page 17
(a) Whenever an operating rights owner or operator fails or refuses to comply with the regulations in this part, the terms of any lease or permit, or the requirements of any notice or order, the authorized officer shall notify the operating rights owner or operator, as appropriate, in writing of the violation or default. Such notice shall also set forth a reasonable abatement period: (1) If the violation or default is not corrected within the time allowed, the authorized officer may subject the operating rights owner or operator, as appropriate, to an assessment of not more than $10,000$500 per violation for each day nonabatement continues where the violation or default is deemed a major violation; (2) Where noncompliance involves a minor violation, the authorized officer may subject the operating rights owner or operator, as appropriate, to an assessment of $2,000$250 for failure to abate the violation or correct the default within the time allowed; . . . (b) Certain instances of noncompliance are violations of such a serious nature as to warrant the imposition of immediate assessments upon discovery. Upon discovery the following violations shall result in immediate assessments, which may be retroactive, in the following specified amounts per violation: (1) For failure to install blowout preventer or other equivalent well control equipment, as required by the approved drilling plan, $10,000$500 per day for each day that the violation existed, including days the violation existed prior to discovery, not to exceed $500,000$5,000; (2) For drilling without approval or for causing surface disturbance on Federal or Indian surface preliminary to drilling without approval, $10,000$500 per day for each day that the violation existed, including days the violation existed prior to discovery, not to exceed $500,000$5,000; (3) For failure to obtain approval of a plan for well abandonment prior to commencement of such operations, $10,000$500. (c) Assessments under paragraph (a)(1) of this section shall not exceed $50,000$1,000 per day, per operating rights owner or operator, per lease. Assessments under paragraph (a)(2) of this section shall not exceed a total of $25,000$500 per operating rights owner or operator, per lease, per inspection. (d) Continued noncompliance shall subject the operating rights owner or operator, as appropriate, to penalties described in § 3163.2 of this title. (e) On a case-by-case basis, the State Director may compromise or reduce assessments under this section. In compromising or reducing the amount of the assessment, the State Director shall state in the record the reasons for such determination.
B. BLM’s New Onshore Oil & Gas Order # 9 Should Direct Owners and Operators to Minimize the Loss of Natural Gas
PETITION TO REDUCE EMISSIONS OF NATURAL GAS FROM OIL AND GAS OPERATIONS Page 18
BLM may issue national onshore orders to “implement and supplement” BLM regulations in 43 C.F.R., part 3160.80 According to BLM’s website, BLM is currently engaged in drafting a new onshore order addressing avoidable gas leakage.81 In particular, BLM has announced it intends to promulgate Onshore Oil & Gas Order Number 9 for Waste Prevention and Use of Produced Oil and Gas for Beneficial Purposes.82 BLM states:
This new Order would establish standards to limit the waste of vented and flared gas and to define the appropriate use of oil and gas for beneficial use. This Order would, among other things, delineate which activities qualify for beneficial use, minimize the amount of venting and flaring that takes place on oil and gas production facilities on Federal and Indian lands, and establish standards for determining avoidable versus unavoidable losses.83
In limiting natural gas emissions under this new Order, BLM should include the relevant
standards Petitioners outlined above. For example, in establishing standards for avoidable versus unavoidable loss, BLM should incorporate the proposed definition of what gas is avoidably lost, including the requirement that all gas emitted that results in an exceedance of the emissions performance standard is avoidably lost. Along these lines, BLM should limit not only vented and flared gas, but also leaked gas. Additionally, BLM should include the requirements that operators protect the environment, conserve natural gas, and employ best available technology.
The new Order should explicate the principles and details of the regulations to such a degree that owners and operators can easily understand the requirements. This will create regulatory predictability and prevent excess waste and generate maximum revenue. BLM should indicate a time-frame in which operators must implement best available technologies and meet the natural gas emissions performance standard. These regulations would go into effect immediately for new leases, and BLM should require operators to ensure compliance on existing leases within no more than 6 months.
C. BLM Should Update Its NTLs
Because onshore orders and regulations require a greater amount of time to promulgate
than NTLs, BLM should update its NTLs while promulgating Order 9. BLM may issue NTLs “when necessary to implement the onshore oil and gas orders and the regulations in [C.F.R. § 3160].”84 NTLs are issued after notice and a 30-day comment period;85 however, instead of
80 43 C.F.R. § 3164.1(a) (2010); U.S. Environmental Protection Agency, Onshore Oil and Gas Operations; Federal and Indian Oil and Gas Leases; Onshore Oil and Gas Order Number 1, Approval of Operations Joint Final Rule, 72 Fed. Reg. 10308, 10,308 (Mar. 7, 2007). The U.S. Forest Service has parallel authority to issue onshore orders or to co-sign with BLM on its orders. See 36 C.F.R. § 228.105 (2010). 81 Bureau of Land Management, Oil and Gas Operations, http://www.blm.gov/wy/st/en/programs/energy/Oil_and_Gas/Onshore_Operations.html (last updated Oct. 18, 2010) (“BLM Onshore Oil and Gas Operations”). 82 Federal Register on BLM Onshore Oil and Gas Order 9. 83 Id. 84 43 C.F.R. § 3164.2(a) (2010).
PETITION TO REDUCE EMISSIONS OF NATURAL GAS FROM OIL AND GAS OPERATIONS Page 19
mandatory publication in the Federal Register,86 BLM indicates it may publish notice in less formal ways, such as in newspapers and on the agency’s website, and by sending letters to affected operators.87 NTLs remain in effect until they are terminated or superseded by an onshore order.88 NTLs may include revisions of previously administered NTLs, and are applied retroactively to all leases within their jurisdiction.89
1. BLM Should Update NTL-3A in Order to Minimize Unnecessary or Accidental Greenhouse Gas Emissions
NTL-3A dictates when oil and gas operators should report “undesirable events,” including gas leaks, to BLM officials.90 BLM must update NTL-3A because the NTL is out of date and does not reflect the current understanding of the health, environmental, and climate effects of air pollution or the availability of new air pollution controls.
NTL-3A allows operators to leak substantial amounts of gas without reporting the event
quickly to BLM. Currently, NTL-3A requires operators to report “major undesirable events” within 24 hours,91 and to submit a written report within 15 days. NTL-3A lists the things that qualify as major undesirable events at sections I.A. through I.F. Such events include “[e]quipment failures or other accidents that result in the venting of 500 or more MCF of gas,” and “[e]very blowout . . . that occurs.”92 Additionally, NTL-3A lists other events that an operator does not need to report within 24 hours, but that require the submission of a written report within 15 days. These events include “[e]quipment failures or other accidents that result in the venting of at least 50 but less than 500 MCF of gas in non-sensitive areas.”93
BLM should decrease the volume of vented or leaked gas an operator must report in a
Major Undesirable Event in Part I of NTL-3A. Currently, an operator must immediately notify BLM of the venting of 500 Mcf of gas or more. Further, BLM should more specifically indicate that the leaking of gas triggers notification requirements. BLM should decrease this volume to no more than 100 Mcf:
85 43 C.F.R. § 3164.2(a) (2010); Bureau of Land Mgmt., Public Notice and Comment Procedures for EFC NTL (2006), available at http://www.blm.gov/pgdata/etc/medialib/blm/wo/Information_Resources_Management/policy/im_attachments/2006.Par.25099.File.dat/im2006-233attach3.pdf. 86 Id. 87 Id. 88 43 C.F.R. § 3164.2(b) (2010). 89 See US Dept. of Interior, Notice to Lessees & Operators of Onshore Federal & Indian Oil & Gas Leases (NTL-4A), Part III, p. 1 (Jan. 1, 1980) (“DOI, NTL-4A”), available at http://www.blm.gov/pgdata/etc/medialib/blm/co/programs/oil_and_gas.Par.81095.File.dat/ntl4a.pdf; ; US Dept. of Interior, Notice to Lessees & Operators of Onshore Federal & Indian Oil & Gas Leases (NTL-3A) (Mar. 1, 1979) (“DOI, NTL-3A”),, available at http://www.blm.gov/pgdata/etc/medialib/blm/co/programs/oil_and_gas.Par.49503.File.dat/ntl3a.pdf. 90 BLM Onshore Oil and Gas Operations. 91 DOI, NTL-3A at pt. I. 92 Id. at Part I.B. & I.F. 93 Id. at Part III.B.

PETITION TO REDUCE EMISSIONS OF NATURAL GAS FROM OIL AND GAS OPERATIONS Page 20
I. Major Undesirable Events Requiring Immediate Notification Major undesirable events are defined as those incidents listed below in subsections A through F. These incidents, when occurring on a lease supervised by the GS, must be reported to the appropriate District Engineer as soon as practical but within a maximum of 24 hours:
B. Equipment failures or other accidents which result in the venting or leaking of 100500 or more MCF of gas;
Part III lists events that are “Other-Than-Major Undesirable Events” for which an
operator must submit a written report within 15 days. Currently, qualifying events include “[e]quipment failures or other accidents which result in the venting of at least 50 but less than 500 MCF of gas in nonsensitive areas.” Also, an operator does not need to mention “[s]pills or discharges in nonsensitive areas involving less than . . . 50 Mcf of gas,” except in standard monthly reports. BLM should adjust the range requiring a written report within 15 days to between 20 and 100 Mcf. Thus, the revised section should read:
III. Other-Than-Major Undesirable Events Other-than-major undesirable events, as identified below in subsections A through D, do not have to be reported orally within 24 hours; however, a written report, as required for major undesirable events in Section II of this Notice, must be provided for the following incidents:
. . . B. Equipment failures or other accidents which result in the venting or leaking of at least 2050 but less than 100500 MCF of gas in nonsensitive areas; . . . D. Each accident involving a major or life threatening injury. Spills or discharges in nonsensitive areas involving less than 4 barrels of liquid or 20 50 Mcf of gas do not require an oral or written report; however, the volumes discharged, or vented, or leaked as a result of all such minor incidents must be reported in accordance with Section V hereof.
By strengthening reporting requirements and lowering the minimum volume of vented or leaked gas for which an operator must report to BLM, BLM will be better equipped to carry out its statutory mandates to avoid waste and maximize revenue.
2. BLM Should Update NTL-4A to Require the Best Available Technology for Capture of Lost Gas
In order to help reduce natural gas emissions, BLM should update NTL-4A. NTL-4A, which originally became effective in 1980, specifies when oil and gas operators owe the
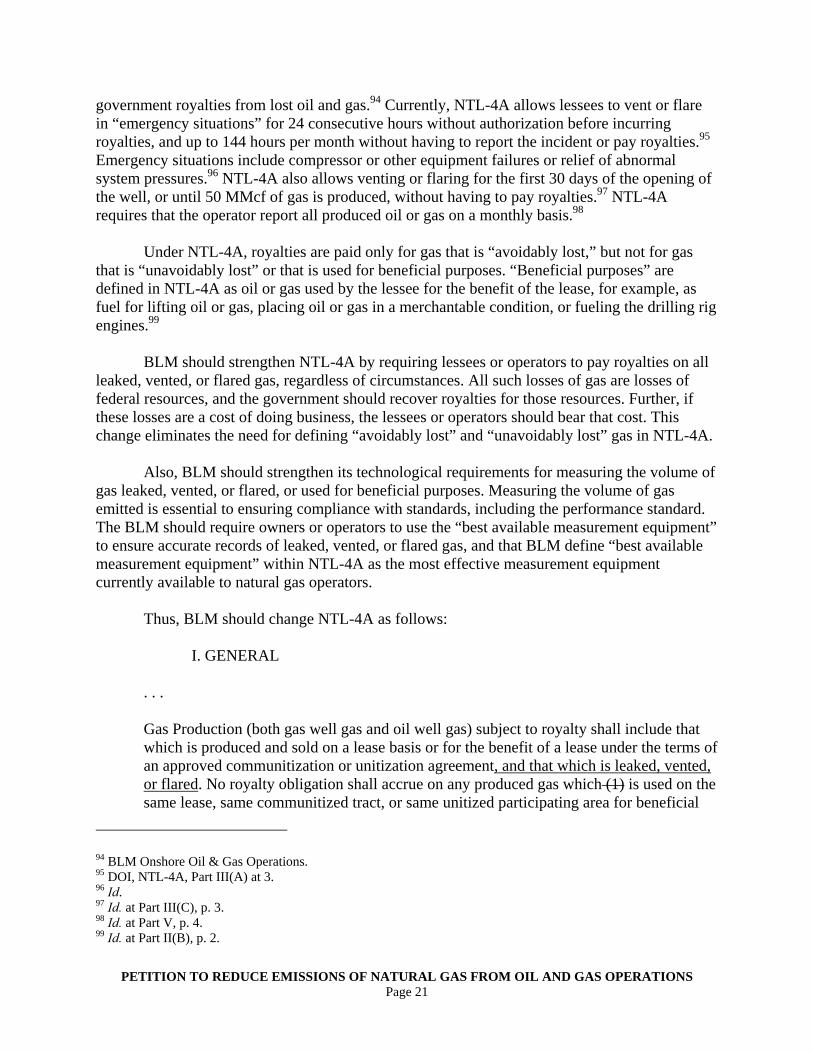
PETITION TO REDUCE EMISSIONS OF NATURAL GAS FROM OIL AND GAS OPERATIONS Page 21
government royalties from lost oil and gas.94 Currently, NTL-4A allows lessees to vent or flare in “emergency situations” for 24 consecutive hours without authorization before incurring royalties, and up to 144 hours per month without having to report the incident or pay royalties.95 Emergency situations include compressor or other equipment failures or relief of abnormal system pressures.96 NTL-4A also allows venting or flaring for the first 30 days of the opening of the well, or until 50 MMcf of gas is produced, without having to pay royalties.97 NTL-4A requires that the operator report all produced oil or gas on a monthly basis.98
Under NTL-4A, royalties are paid only for gas that is “avoidably lost,” but not for gas
that is “unavoidably lost” or that is used for beneficial purposes. “Beneficial purposes” are defined in NTL-4A as oil or gas used by the lessee for the benefit of the lease, for example, as fuel for lifting oil or gas, placing oil or gas in a merchantable condition, or fueling the drilling rig engines.99
BLM should strengthen NTL-4A by requiring lessees or operators to pay royalties on all
leaked, vented, or flared gas, regardless of circumstances. All such losses of gas are losses of federal resources, and the government should recover royalties for those resources. Further, if these losses are a cost of doing business, the lessees or operators should bear that cost. This change eliminates the need for defining “avoidably lost” and “unavoidably lost” gas in NTL-4A.
Also, BLM should strengthen its technological requirements for measuring the volume of
gas leaked, vented, or flared, or used for beneficial purposes. Measuring the volume of gas emitted is essential to ensuring compliance with standards, including the performance standard. The BLM should require owners or operators to use the “best available measurement equipment” to ensure accurate records of leaked, vented, or flared gas, and that BLM define “best available measurement equipment” within NTL-4A as the most effective measurement equipment currently available to natural gas operators.
Thus, BLM should change NTL-4A as follows:
I. GENERAL
. . .
Gas Production (both gas well gas and oil well gas) subject to royalty shall include that which is produced and sold on a lease basis or for the benefit of a lease under the terms of an approved communitization or unitization agreement, and that which is leaked, vented, or flared. No royalty obligation shall accrue on any produced gas which (1) is used on the same lease, same communitized tract, or same unitized participating area for beneficial
94 BLM Onshore Oil & Gas Operations. 95 DOI, NTL-4A, Part III(A) at 3. 96 Id. 97 Id. at Part III(C), p. 3. 98 Id. at Part V, p. 4. 99 Id. at Part II(B), p. 2.
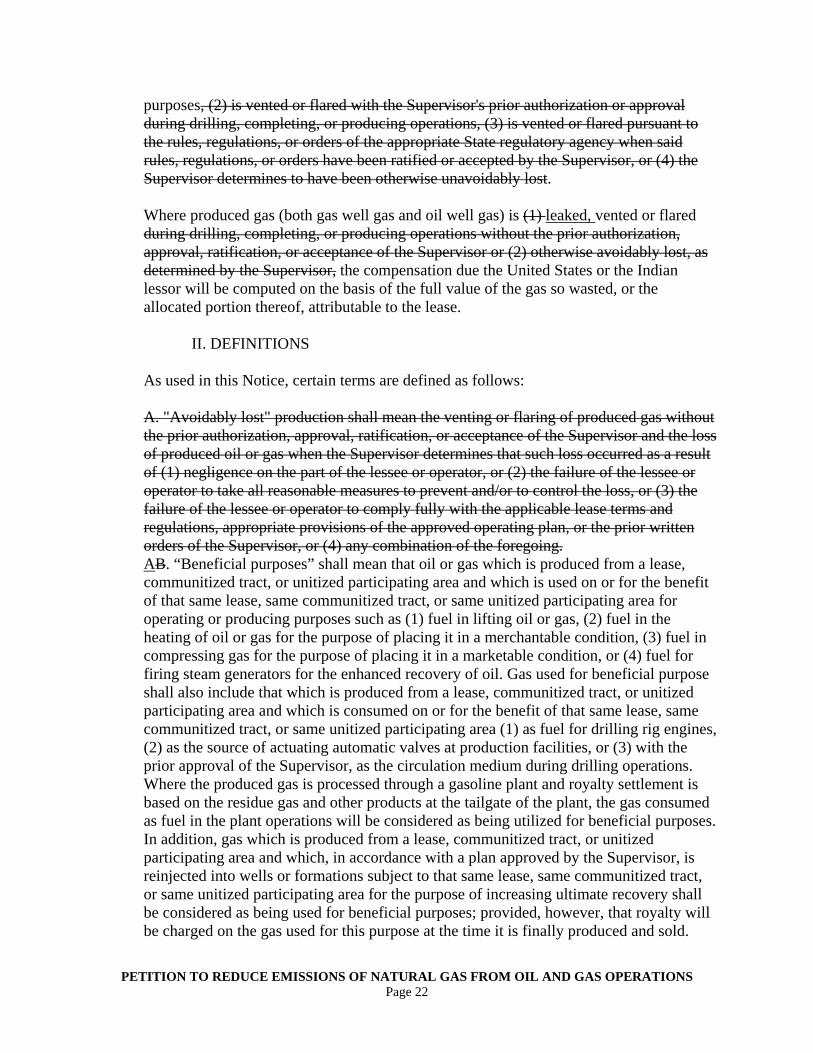
PETITION TO REDUCE EMISSIONS OF NATURAL GAS FROM OIL AND GAS OPERATIONS Page 22
purposes, (2) is vented or flared with the Supervisor's prior authorization or approval during drilling, completing, or producing operations, (3) is vented or flared pursuant to the rules, regulations, or orders of the appropriate State regulatory agency when said rules, regulations, or orders have been ratified or accepted by the Supervisor, or (4) the Supervisor determines to have been otherwise unavoidably lost.
Where produced gas (both gas well gas and oil well gas) is (1) leaked, vented or flared during drilling, completing, or producing operations without the prior authorization, approval, ratification, or acceptance of the Supervisor or (2) otherwise avoidably lost, as determined by the Supervisor, the compensation due the United States or the Indian lessor will be computed on the basis of the full value of the gas so wasted, or the allocated portion thereof, attributable to the lease.
II. DEFINITIONS
As used in this Notice, certain terms are defined as follows:
A. "Avoidably lost" production shall mean the venting or flaring of produced gas without the prior authorization, approval, ratification, or acceptance of the Supervisor and the loss of produced oil or gas when the Supervisor determines that such loss occurred as a result of (1) negligence on the part of the lessee or operator, or (2) the failure of the lessee or operator to take all reasonable measures to prevent and/or to control the loss, or (3) the failure of the lessee or operator to comply fully with the applicable lease terms and regulations, appropriate provisions of the approved operating plan, or the prior written orders of the Supervisor, or (4) any combination of the foregoing. AB. “Beneficial purposes” shall mean that oil or gas which is produced from a lease, communitized tract, or unitized participating area and which is used on or for the benefit of that same lease, same communitized tract, or same unitized participating area for operating or producing purposes such as (1) fuel in lifting oil or gas, (2) fuel in the heating of oil or gas for the purpose of placing it in a merchantable condition, (3) fuel in compressing gas for the purpose of placing it in a marketable condition, or (4) fuel for firing steam generators for the enhanced recovery of oil. Gas used for beneficial purpose shall also include that which is produced from a lease, communitized tract, or unitized participating area and which is consumed on or for the benefit of that same lease, same communitized tract, or same unitized participating area (1) as fuel for drilling rig engines, (2) as the source of actuating automatic valves at production facilities, or (3) with the prior approval of the Supervisor, as the circulation medium during drilling operations. Where the produced gas is processed through a gasoline plant and royalty settlement is based on the residue gas and other products at the tailgate of the plant, the gas consumed as fuel in the plant operations will be considered as being utilized for beneficial purposes. In addition, gas which is produced from a lease, communitized tract, or unitized participating area and which, in accordance with a plan approved by the Supervisor, is reinjected into wells or formations subject to that same lease, same communitized tract, or same unitized participating area for the purpose of increasing ultimate recovery shall be considered as being used for beneficial purposes; provided, however, that royalty will be charged on the gas used for this purpose at the time it is finally produced and sold.

PETITION TO REDUCE EMISSIONS OF NATURAL GAS FROM OIL AND GAS OPERATIONS Page 23
Oil or gas used for beneficial purposes shall be subject to the same reasonable measures requirements applicable to normal operations, which include the use of best available technology to capture the maximum amount of methane and other greenhouse gases possible and compliance with the natural gas emissions performance standard.C. "Unavoidably lost" production shall mean (1) those gas vapors which are released from storage tanks or other low-pressure production vessels unless the Supervisor determines that the recovery of such vapors would be warranted, (2) that oil or gas which is lost because of line failures, equipment malfunctions, blowouts, fires, or otherwise except where the Supervisor determines that said loss resulted from the neglið gence or the failure of the lessee or operator to take all reasonable measures to prevent and/or control the loss, and (3) the venting or flaring of gas in accordance with Section III hereof. B. “Best available measurement equipment” shall mean the most effective measurement equipment currently available to Lessees or Operators.
III. AUTHORIZED VENTING AND FLARING OF GAS Lessees or operators are hereby authorized to vent or flare gas on a short-term basis without incurring a royalty obligation in the following circumstances:
A. Emergencies. During temporary emergency situations, such as compressor or other equipment failures, relief of abnormal system pressures, or other conditions which result in the unavoidable short-term venting or flaring of gas. However, this authorization to vent or flare gas in such circumstances without incurring a royalty obligation is limited to 24 hours per incident and to 144 hours cumulative for the lease during any calendar month, except with the prior authorization, approval, ratification, or acceptance of the Supervisor. B. Well Purging and Evaluation Tests. During the unloading or cleaning up of a well during drillstem, producing, routine purging, or evaluation tests, not exceeding a period of 24 hours.
C. Initial Production Tests. During initial well evaluation tests, not exceeding a period of 30 days or the production of 50 MMcf of gas, whichever occurs first, unless a longer test period has been authorized by the appropriate State regulatory agency and ratified or accepted by the Supervisor. D. Routine or Special Well Tests. During routine or special well tests, other than those cited in III.B and C above, only after approval by the Supervisor.
IV. OTHER VENTING OR FLARING
A. Gas Well Gas. Except as provided in II.C and III above, Ggas well gas may not be leaked, flared, or vented. For the purposes of this Notice, a gas well will be construed as a well from which the energy equivalent of the gas produced, including its entrained liquid hydrocarbons, exceeds the energy equivalent of the oil produced.
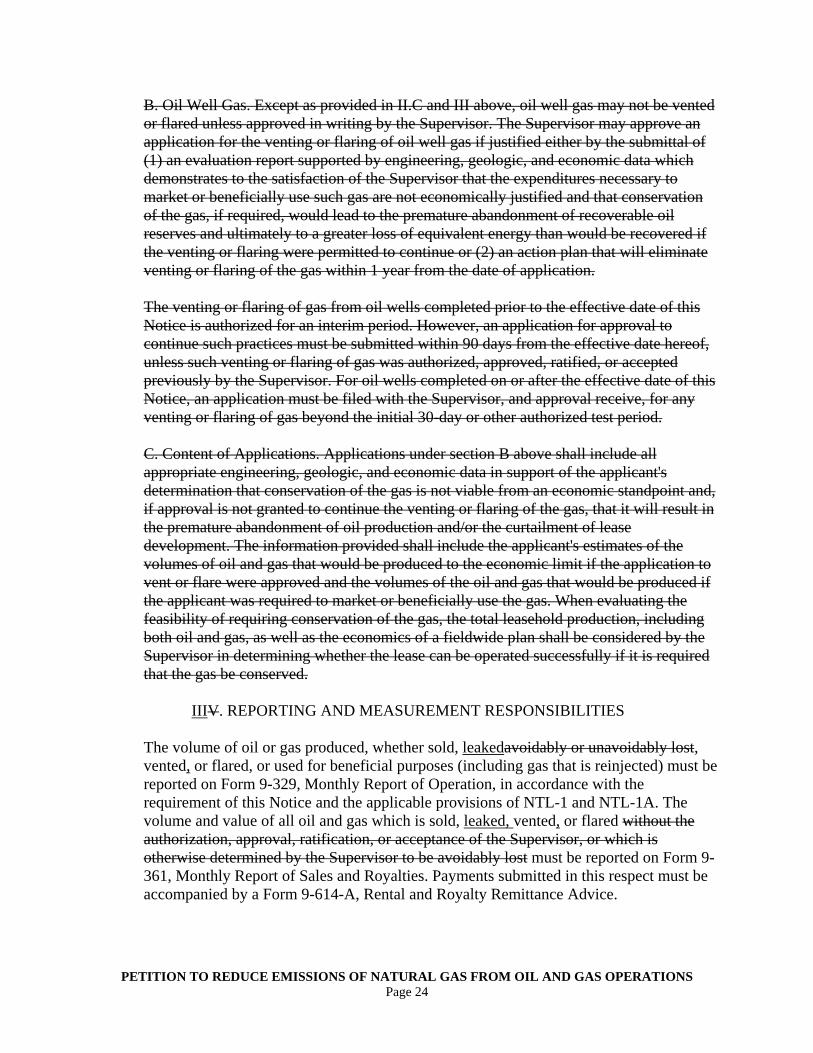
PETITION TO REDUCE EMISSIONS OF NATURAL GAS FROM OIL AND GAS OPERATIONS Page 24
B. Oil Well Gas. Except as provided in II.C and III above, oil well gas may not be vented or flared unless approved in writing by the Supervisor. The Supervisor may approve an application for the venting or flaring of oil well gas if justified either by the submittal of (1) an evaluation report supported by engineering, geologic, and economic data which demonstrates to the satisfaction of the Supervisor that the expenditures necessary to market or beneficially use such gas are not economically justified and that conservation of the gas, if required, would lead to the premature abandonment of recoverable oil reserves and ultimately to a greater loss of equivalent energy than would be recovered if the venting or flaring were permitted to continue or (2) an action plan that will eliminate venting or flaring of the gas within 1 year from the date of application. The venting or flaring of gas from oil wells completed prior to the effective date of this Notice is authorized for an interim period. However, an application for approval to continue such practices must be submitted within 90 days from the effective date hereof, unless such venting or flaring of gas was authorized, approved, ratified, or accepted previously by the Supervisor. For oil wells completed on or after the effective date of this Notice, an application must be filed with the Supervisor, and approval receive, for any venting or flaring of gas beyond the initial 30-day or other authorized test period.
C. Content of Applications. Applications under section B above shall include all appropriate engineering, geologic, and economic data in support of the applicant's determination that conservation of the gas is not viable from an economic standpoint and, if approval is not granted to continue the venting or flaring of the gas, that it will result in the premature abandonment of oil production and/or the curtailment of lease development. The information provided shall include the applicant's estimates of the volumes of oil and gas that would be produced to the economic limit if the application to vent or flare were approved and the volumes of the oil and gas that would be produced if the applicant was required to market or beneficially use the gas. When evaluating the feasibility of requiring conservation of the gas, the total leasehold production, including both oil and gas, as well as the economics of a fieldwide plan shall be considered by the Supervisor in determining whether the lease can be operated successfully if it is required that the gas be conserved.
IIIV. REPORTING AND MEASUREMENT RESPONSIBILITIES
The volume of oil or gas produced, whether sold, leakedavoidably or unavoidably lost, vented, or flared, or used for beneficial purposes (including gas that is reinjected) must be reported on Form 9-329, Monthly Report of Operation, in accordance with the requirement of this Notice and the applicable provisions of NTL-1 and NTL-1A. The volume and value of all oil and gas which is sold, leaked, vented, or flared without the authorization, approval, ratification, or acceptance of the Supervisor, or which is otherwise determined by the Supervisor to be avoidably lost must be reported on Form 9-361, Monthly Report of Sales and Royalties. Payments submitted in this respect must be accompanied by a Form 9-614-A, Rental and Royalty Remittance Advice.
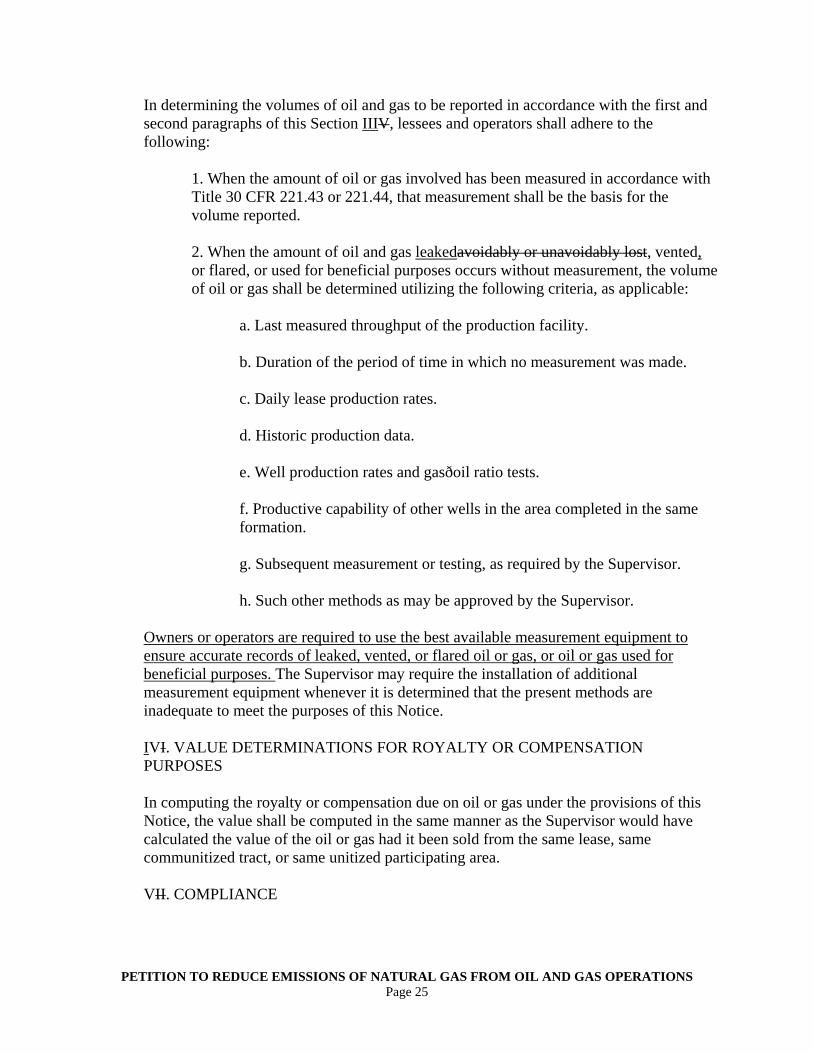
PETITION TO REDUCE EMISSIONS OF NATURAL GAS FROM OIL AND GAS OPERATIONS Page 25
In determining the volumes of oil and gas to be reported in accordance with the first and second paragraphs of this Section IIIV, lessees and operators shall adhere to the following:
1. When the amount of oil or gas involved has been measured in accordance with Title 30 CFR 221.43 or 221.44, that measurement shall be the basis for the volume reported. 2. When the amount of oil and gas leakedavoidably or unavoidably lost, vented, or flared, or used for beneficial purposes occurs without measurement, the volume of oil or gas shall be determined utilizing the following criteria, as applicable:
a. Last measured throughput of the production facility. b. Duration of the period of time in which no measurement was made. c. Daily lease production rates. d. Historic production data. e. Well production rates and gasðoil ratio tests. f. Productive capability of other wells in the area completed in the same formation. g. Subsequent measurement or testing, as required by the Supervisor. h. Such other methods as may be approved by the Supervisor.
Owners or operators are required to use the best available measurement equipment to ensure accurate records of leaked, vented, or flared oil or gas, or oil or gas used for beneficial purposes. The Supervisor may require the installation of additional measurement equipment whenever it is determined that the present methods are inadequate to meet the purposes of this Notice. IVI. VALUE DETERMINATIONS FOR ROYALTY OR COMPENSATION PURPOSES
In computing the royalty or compensation due on oil or gas under the provisions of this Notice, the value shall be computed in the same manner as the Supervisor would have calculated the value of the oil or gas had it been sold from the same lease, same communitized tract, or same unitized participating area.
VII. COMPLIANCE
PETITION TO REDUCE EMISSIONS OF NATURAL GAS FROM OIL AND GAS OPERATIONS Page 26
The failure to comply with the requirements of this Notice will result in compliance being secured by such actions as are provided by law and regulation.
V. CONCLUSION
Natural gas leakage from oil and gas operations on federal land is a significant source of
methane that directly harms human health and contributes to climate change. The waste of natural gas also represents lost income for the federal government. Petitioners request that the BLM update its regulations, orders, and NTLs in the ways suggested in order to decrease the volume of methane leakage that occurs as a result of natural gas exploration, production, and storage.
BLM’s current regulations do not effectively minimize the loss of gas as the MLA and
FLPMA require. Presently, operators are ignoring not only environmental protection and conservation as primary goals, but even controls that would provide them an economic benefit. This is due to insufficiently strict standards that serve to merely reinforce bad practices and a system of ad hoc enforcement by authorized officers. Further, BLM’s current system does not sufficiently take advantage of the resource management planning process to ensure that the agency considers cumulative effects.
This inadequate implementation of the MLA and FLPMA requirements endangers the
climate, environment, and public health, and robs the federal government of royalty payments. The BLM must update its regulations, orders, and NTLs to ensure the maximum recovery of methane from oil and gas operations on federal lands. In particular, BLM should employ two mechanisms to increase recovery and reduce waste: a best available technology standard and a performance standard to serve as an overall cap on the rate of natural gas loss. The best available technology standard would ensure that industry is employing modern technologies, techniques, and process to reduce emissions. It would require operators to employ particular technologies that are known presently to effectively and economically reduce natural gas emissions, and it would also require the updating and continual improvement of technological requirements as new, better controls become available, as recommended by the International Energy Agency.100 The natural gas emissions performance standard would complement the best available technology standard and serve as a backstop to ensure against backsliding. BLM would check compliance with this requirement during its planning, leasing, and permitting processes to ensure that unexpectedly high rates of emissions would not occur.
Eliminating waste from oil and gas operations will increase federal royalties. The production of natural gas on federal leases generates substantial revenue for the federal government, and continues to serve as a significant source of non-tax federal government revenue. For example, in 2011 alone, onshore Federal oil and gas leases produced approximately $2.7 billion in royalties.101 These royalty payments would be even larger if BLM required operators to limit natural gas leakage through the use of the most effective and economic
100 International Energy Agency, Golden Rules for a Golden Age of Gas (2012) at 48. 101 77 Fed. Reg. 27691 at 27, 699 (May 11, 2012)

PETITION TO REDUCE EMISSIONS OF NATURAL GAS FROM OIL AND GAS OPERATIONS Page 27
controls presently available. In fact, the GAO, relying upon data demonstrating that operators could economically capture about 40 percent of lost gas, found that federal royalty payments on gas could increase by approximately $23 million annually if available technologies were implemented into current natural gas production.102
Also, conserving natural gas could reduce levels of gas exploration, development, and
production in the United States and prevent the environmental and human health harms that would result from those activities. By reducing methane leakages, BLM can help bring additional natural gas to market to satisfy demand, and therefore displace some demand for oil and gas activities that have negative environmental effects.
Thus, Petitioners request that the BLM update its regulations, orders, and NTLs in the
ways described above in order to decrease natural gas emissions and associated air pollution. We request a response within six months of receipt of this petition.
Respectfully submitted this 11th day of September, 2012. David R. Hobstetter Center for Biological Diversity Climate Law Institute Staff Attorney 351 California Street, Suite 600 San Francisco, CA 94104 Phone (415) 436-9682 x321 Fax (415) 436-9683 [email protected]
Ann Brewster Weeks Darin Schroeder Clean Air Task Force 18 Tremont St., Suite 530 Boston, MA 02108 (617) 624-0234 [email protected]
Erik Schlenker-Goodrich Interim Executive Director Western Environmental Law Center 208 Paseo del Pueblo Sur, Unit 602 Taos, New Mexico 87571 (p) 575.613.4197 (f) 575.751.1775 www.westernlaw.org
Encs: LIST OF REFERENCES CITED AND ATTACHED
APPENDIX A: SUMMARY OF TECHNOLOGIES AND TECHNIQUES TO REDUCE METHANE EMISSIONS FROM OIL AND GAS OPERATIONS
APPENDIX B: CLIMATE CHANGE SCIENCE SUMMARY, JUNE 2012
102 GAO Report at 1.
PETITION TO REDUCE EMISSIONS OF NATURAL GAS FROM OIL AND GAS OPERATIONS Page 28
LIST OF REFERENCES CITED AND ATTACHED
AirNow.gov, Smog - Who does it hurt?, http://www.airnow.gov/index.cfm?action=smog.page1#3 (last visited September 10, 2012).
Andrews, Wyatt, NOAA links extreme weather to climate change, CBS News (July 10, 2012) http://www.cbsnews.com/8301-18563_162-57469878/noaa-links-extreme-weather-to-climate-change?tag=currentVideoInfo;videoMetaInfo.
Bay Area Air Quality Management District, Health Impact Analysis of Fine Particulate Matter in the San Francisco Bay Area (Sep. 2011)
Bonner, Jessie, Crews battle dozens of wildfieres across West, Huffington Post (August 15, 2012), http://www.huffingtonpost.com/huff-wires/20120815/us-western-wildfires/
Brown, Heather, Memorandum to Bruce Moore, U.S.EPA/OAQPS/SPPD re Composition of Natural Gas for use in the Oil and Natural Gas Sector Rulemaking, July 28, 2011 (“Brown Memo”)
Bureau of Land Management, Oil and Gas, http://www.blm.gov/wo/st/en/prog/energy/oil_and_gas.html (last visited September 9, 2012).
Bureau of Land Management, Public Notice and Comment Procedures for EFC NTL (2006).
Bureau of Land Management, RIN Data: RIN 1004-AE14 Onshore Oil and Gas Order 9: Waste Prevention and use of produced oil and gas for beneficial purposes, http://www.reginfo.gov/public/do/eAgendaViewRule?pubId=201110&RIN=1004-AE14 (last visited Sept. 7, 2012).
Bureau of Land Management, Oil and Gas Operations, http://www.blm.gov/wy/st/en/programs/energy/Oil_and_Gas/Onshore_Operations.html (last updated Oct. 18, 2010).
California Climate Change Center, Our Changing Climate: Assessing the Risks to California (2006).
Colborn, Theo et al., Natural gas operations from a public health perspective, 17 Hum. & Ecol. Risk Assessment 1039 (2011).
Colorado Department of Public Health and Environment, Air Quality Control Commission, Regulation Number 7, XVIII.C (2011).
Craft, Elena, Environmental Defense Fund, Do Shale Gas Activities Play a Role in Rising Ozone Levels? (2012).
PETITION TO REDUCE EMISSIONS OF NATURAL GAS FROM OIL AND GAS OPERATIONS Page 29
Federal Register, Onshore Oil and Gas Order 9: Waste Prevention and Use of Produced Oil and Gas for Beneficial Purposes, Unified Agenda 1004-AE14, https://www.federalregister.gov/regulations/1004-AE14/onshore-oil-and-gas-order-9-waste-prevention-and-use-of-produced-oil-and-gas-for-beneficial-purposes
Forster, Piers et al., Changes in Atmospheric Constituents and in Radiative Forcing in Climate Change 2007: The Physical Science Basis. Contribution of Working Group I to the Fourth Assessment Report of the Intergovernmental Panel on Climate Change 500 (Susan Solomon et al. eds. 2007).
Francis, Jennifer and Stephen Vavrus, Evidence linking Arctic amplification to extreme weather in mid-latitudes, 39 Geophys. Res. Lett L06801 (2012).
Letter from Wyoming Governor Dave Freudenthal to Carol Rushin, Acting Regional Administrator, U.S.EPA Region 8, (Mar. 12, 2009).
Hansen, James et al., Climate Change and trace gases, 365 Phil. Trans. R. Soc. A 1925 (2007).
Intergovernmental Panel on Climate Change, Climate Change 2007: Synthesis Report. An Assessment of the Intergovernmental Panel on Climate Change (2007) available at www.ipcc.ch.
International Energy Agency, Golden Rules for a Golden Age of Gas (2012).
Koch, Wendy, USA Today, Wyoming's Smog Exceeds Los Angeles' Due to Gas Drilling, (Mar 9, 2011).
Montzka, S.A. et al., Non-CO2 Greenhouse Gases and Climate Change, 476 Nature 43 (2011).
National Research Council Climate Stabilization Targets: Emissions, Concentrations, and Impacts over Decades to Millennia (2010).
NaturalGas.org, The Transportation of Natural Gas (2012).
Natural Resources Defense Council, Leaking Profits: The U.S. Oil and Gas Industry Can Reduce Pollution, Conserve Resources, and Make Money by Preventing Methane Waste, (2012), available at http://www.nrdc.org/energy/files/Leaking-Profits-Report.pdf
Shindell, Drew T. et al., Improved Attribution of Climate Forcing to Emissions, 326 Science 716 (2009).
Shindell, Drew T. et al., Simultaneously Mitigating Near-term Climate Change and Improving Human Health and Food Security, 335 Science 183 (2012).
PETITION TO REDUCE EMISSIONS OF NATURAL GAS FROM OIL AND GAS OPERATIONS Page 30
United States Global Change Research Program, Global Climate Change Impacts in the United States (2009).
U.S. Bureau of Labor Statistics, Overview of BLS Statistics on Inflation and Prices, Consumer Price Index Calculator, U.S. Department of Labor, http://www.bls.gov/data/inflation_calculator.htm (last modified May 28, 2010).
U.S. Dept. of Interior, Notice to Lessees & Operators of Onshore Federal & Indian Oil & Gas Leases (NTL-4A), Part III, p. 1 (Jan. 1, 1980).
U.S. Dept. of Interior, Notice to Lessees & Operators of Onshore Federal & Indian Oil & Gas Leases (NTL-3A) (Mar. 1, 1979).
U.S. Environmental Protection Agency, Daily Ozone AQI Levels in 2011 for Sublette County, Wyoming
U.S. Environmental Protection Agency, Endangerment and Cause or Contribute Findings for Greenhouse Gases Under Section 202(a) of the Clean Air Act; Final Rule, 74 Fed. Reg. 66,496 (Dec. 15, 2009).
U.S. Environmental Protection Agency, Executive Summary: Inventory of U.S. Greenhouse Gas Emissions and Sinks: 1990 – 2010, Apr. 15, 2012, http://www.epa.gov/climatechange/emissions/downloads12/US-GHG-Inventory-2012-Main-Text.pdf.
U.S. Environmental Protection Agency, Greenhouse Gas Emissions Reporting from the Petroleum and Natural Gas Industry Background Technical Support Document, U.S. Environmental Protection Agency Climate Change Division Washington DC (2010).
U.S. Environmental Protection Agency, Inventory of U.S. Greenhouse Gas Emissions and Sinks: 1990 – 2010, Apr. 15, 2012, http://www.epa.gov/climatechange/emissions/downloads12/US-GHG-Inventory-2012-Main-Text.pdf.
U.S. Environmental Protection Agency, Oil and Gas; Well Stimulation, Including Hydraulic Fracturing, on Federal and Indian Lands; Proposed Rule, 77 Fed. Reg. 27691 (May 11, 2012).
U.S. Environmental Protection Agency, Oil and Natural Gas Sector; New Source Performance Standards and National Emission Standards for Hazardous Air Pollutants Reviews; Final Rule, 77 Fed. Reg. 49490 at 49513 (August 16, 2012).
U.S. Environmental Protection Agency, Onshore Oil and Gas Operations; Federal and Indian Oil and Gas Leases; Onshore Oil and Gas Order Number 1, Approval of Operations Joint Final Rule, 72 Fed. Reg. 10308, 10,308 (Mar. 7, 2007).

PETITION TO REDUCE EMISSIONS OF NATURAL GAS FROM OIL AND GAS OPERATIONS Page 31
U.S. Environmental Protection Agency, National Ambient Air Quality Standards for Particulate Matter Proposed Rule, 77 Federal Register 38890 (June 29, 2012).
U.S. Environmental Protection Agency, Natural Gas STAR Program, Annual Implementation Workshop, Reducing Methane Emissions During Completion Operations (October 24, 2006).
U.S. Environmental Protection Agency, Natural Gas STAR Program, Basic Information (2012).
U.S. Environmental Protection Agency, Natural Gas STAR Partners, Lessons Learned: Installing Plunger Lift Systems in Gas Wells (October 2006).
U.S. Environmental Protection Agency, Natural Gas STAR Program, Lessons Learned: Convert Pneumatics to Mechanical Controls (2004).
U.S. Environmental Protection Agency, Natural Gas STAR Program, Lessons Learned: Convert Pneumatics to Instrument Air (2006).
U.S. Environmental Protection Agency, Natural Gas STAR Program, Partner Reported Opportunities for Reducing Methane Emissions Fact Sheet No. 402: Insert Gas Main Flexible Liners (2012).
U.S. Environmental Protection Agency, Natural Gas STAR Partners, Lessons Learned: Directed Inspection and Maintenance at Gas Processing Plants and Booster Stations (2003)
U.S. Environmental Protection Agency, Natural Gas STAR Partners, Lessons Learned: Installing Vapor Recovery Units on Crude Oil Storage Tanks (October 2006).
U.S. Environmental Protection Agency, Natural Gas STAR Program, Lessons Learned: Reducing Methane Emissions from Compressor Rod Packing System (October 2006).
U.S. Environmental Protection Agency, Natural Gas STAR Program, Reducing Methane Emissions from Productions Wells: Reduced Emission Completions (May 11, 2010).
U.S. Environmental Protection Agency, Natural Gas STAR Program, Lessons Learned: Solar Power Applications for Methane Emissions Mitigation (2009).
U.S. Environmental Protection Agency, Natural Gas STAR Program, Partner Reported Opportunities for Reducing Methane Emissions Fact Sheet No. 103, Install Electric Compressors (2012).
U.S. Environmental Protection Agency, Natural Gas STAR Program, Partner Reported Opportunities for Reducing Methane Emissions Fact Sheet No. 105, Install Electric Motor Starters (2012).
PETITION TO REDUCE EMISSIONS OF NATURAL GAS FROM OIL AND GAS OPERATIONS Page 32
U.S. Environmental Protection Agency, Natural Gas STAR Program, Partner Reported Opportunities (PRO), PRO Fact Sheet No. 206: Zero Emissions Dehydrators (2011).
U.S. Environmental Protection Agency, Natural Gas STAR Program, Reducing Methane Emissions from Productions Wells: Reduced Emission Completions (May 11, 2010).
U.S. Environmental Protection Agency , Regulatory Impact Analysis - Proposed New Source Performance Standards and Amendments to the National Emissions Standards for Hazardous Air Pollutants for the Oil and Natural Gas Industry, Office of Air Quality Planning and Standards (July 2011).
U.S. Environmental Protection Agency, Regulatory Impact Analysis - Final New Source Performance Standards and Amendments to the National Emissions Standards for Hazardous Air Pollutants for the Oil and Natural Gas Industry, Office of Air Quality Planning and Standards (April 2012).
U.S. Environmental Protection Agency, Technology Transfer Network - PM10 NAAQS Implementation, http://www.epa.gov/ttn/naaqs/pm/pm10_index.html
U.S. Government Accountability Office, Federal Oil and Gas Leases, Opportunities Exist to Capture Vented and Flared Natural Gas, Which Would Increase Royalty Payments and Reduce Greenhouse Gases (2010)
Watts, Susan, Arctic ice melt 'like adding 20 years of CO2 emissions', BBC News (Sept. 6, 2012), http://www.bbc.co.uk/news/science-environment-19496674.
West, J. J. et al, Global Health Benefits of Mitigating Ozone Pollution with Methane Emission Controls, 103 PNAS 3988 (Jan. 11, 2006).
Williams Production RMT, Piceance Basin Operations, “Reducing Methane Emissions During Completion Operations,” 2006 Natural Gas STAR Annual Implementation Workshop, Houston, TX, October 24, 2006, http://www.epa.gov/gasstar/documents/vincent.pdf.
Williams, Megan & Cindy Copeland, Earthjustice, Methane Controls for the Oil and Gas Production Sector (2010).
World Health Organization, Health Aspects of Air Pollution with Partiuclate Matter, Ozone, and Nitrogen Dioxide (2003).
Wyoming Department of Environmental Quality, Technical Support Document I for Recommended 8-hour Ozone Designation of the Upper Green River Basin (March 26, 2009).
Wyoming DEQ, Oil and Gas Production Facilities Chapter 6, Section 2 Permitting Guidance (March 2010).

PETITION TO REDUCE EMISSIONS OF NATURAL GAS FROM OIL AND GAS OPERATIONS Page 33
APPENDIX A: SUMMARY OF TECHNOLOGIES AND TECHNIQUES TO REDUCE
METHANE EMISSIONS FROM OIL AND GAS OPERATIONS
Below is a summary of technologies available to operators to reduce methane emissions from oil and gas operations.103 1) Compressors
Fugitive natural gas emissions from compressors are a very large source of natural gas
sector methane emissions. “All told, methane emissions from compressors reportedly account for at least one fifth of all methane emission from oil and gas systems.”104 Compressor stations are used to transport gas through transmission lines throughout the United States. Natural gas is highly pressurized as it travels by pipeline. To ensure the pressurization of the gas flowing through a pipeline, compression of the natural gas is required periodically along the pipe. Compressor stations are usually placed at 40 to 100 mile intervals to accomplish this. The natural gas enters the compressor station, and is compressed by a turbine, motor, or engine.105
There are a number of methods of reducing emissions from compressors. First, operators
can cut leakage by implementing a proper schedule for replacing packing rings and piston rods and requiring state-of-the-art rod-packing technology.106 Operators can establish baseline leakage rates and corresponding replacement frequencies in order to minimize the uneconomical and environmentally harmful leakage of natural gas. Such a program will carry the added benefit of extending the life of other equipment.107 Also, operators should use advanced new technology that prevents leaks from compressors. For example, “[n]ew packing ring materials, types, and entirely new packing systems are available now and becoming more common” and “[t]here are many examples of companies that provide new low emission packing rings and packing case assemblies.”108 Estimates by EPA indicate that the use of these technologies could reduce methane emissions by very large amounts.109
Second, replacing wet seals used on the rotating shafts of compressors with dry seals can
achieve great reductions in methane emissions, and in fact, installing two or more dry seals in series is even more effective. According to EPA, multiple dry seals result in less than 1% of the leakage of a wet seal system and also cost considerably less to operate.
103 As discussed supra at 4-5, EPA has recently finalized its updated NSPS for the oil and gas industry. U.S. Environmental Protection Agency, Oil and Natural Gas Sector: New Source Performance Standards and National Emission Standards for Hazardous Air Pollutants Reviews Final Rule, 77 Fed. Reg. 49490 (August 16, 2012). 104 Williams, Megan & Cindy Copeland, Earthjustice, Methane Controls for the Oil and Gas Production Sector (2010) (“Williams & Copeland”) at 11. 105 NaturalGas.org, The Transportation of Natural Gas, http://www.naturalgas.org/naturalgas/transport.asp. 106 Williams & Copeland at 13. 107 Id. at 14. 108 Id. 109 Id.; U.S. Environmental Protection Agency, Natural Gas STAR Program, Lessons Learned: Reducing Methane Emissions from Compressor Rod Packing Systems, October 2006.

PETITION TO REDUCE EMISSIONS OF NATURAL GAS FROM OIL AND GAS OPERATIONS Page 34
Third, gas starters that use natural gas to run compressor starter motors release gas to the atmosphere, but starters that use compressed air or electricity do not generate methane emissions. EPA’s Natural Gas STAR program reports that the use of compressed air or electric starters is a cost-effective control technique.110
2) Wellhead Facilities
Well venting activities, including well completion, well blowdown, and well workover,
are significant sources of methane emissions. However, available technology can greatly reduce—or even eliminate—these emissions. One method of reducing methane emissions that the GAO identifies is the use of reduced emission completions (“RECs”) equipment, also known as “green completions,” during the natural gas drilling phase.111 This process separates the mud and debris to capture the gas or condensate, instead of venting or flaring the gas into the atmosphere.112 It can be highly effective. Indeed, EPA Natural Gas STAR partners report that RECs can recover up to 100% of completion gas.113
Further, this method of slashing emissions has been proven cost-effective by partners in
EPA’s Natural Gas STAR program for over five years.114 RECs produce additional revenue from the recovery of produced natural gas and gas liquids while resulting in less solid waste, less water pollution, and safer operating conditions. To illustrate cost-effectiveness, consider BP’s $1.2 million investment in reduced emission completions since 2000.115 This change not only prevented over 2,000 metric tons of methane and 100,000 of carbon dioxide from entering the atmosphere, it increased revenues by almost $5.8 million, according to company documents.116
Another significant source of methane emissions results from the venting of mature gas
wells to the atmosphere in order to remove accumulated fluids, also known as blowdown operations. The GAO states that the installation of plunger lift systems in gas wells will reduce methane emissions from these operations. During drilling, liquids collect in wells and slow or stop the flow of gas completely. Operators often re-establish flow by closing the well to build pressure and then opening the well to the atmosphere. This succeeds in removing the liquid, but it also vents the harmful gases. The best available technology to minimize this waste is a plunger
110 See U.S. Environmental Protection Agency, Natural Gas STAR Program, Partner Reported Opportunities for Reducing Methane Emissions Fact Sheet No. 103, Install Electric Compressors (2012) and U.S. Environmental Protection Agency, Natural Gas STAR Program, Partner Reported Opportunities for Reducing Methane Emissions Fact Sheet No. 105, Install Electric Motor Starters (2012). 111 GAO Report at 7. 112 Id. 113 See Williams Production RMT, Piceance Basin Operations, “Reducing Methane Emissions During Completion Operations,” 2006 Natural Gas STAR Annual Implementation Workshop, Houston, TX, October 24, 2006, http://www.epa.gov/gasstar/documents/vincent.pdf. 114 U.S. Environmental Protection Agency, Natural Gas STAR Program Annual Implementation Workshop, Reducing Methane Emissions During Completion Operations (October 24, 2006); U.S. Environmental Protection Agency, Natural Gas STAR Program, Reducing Methane Emissions from Productions Wells: Reduced Emission Completions (May 11, 2010). 115 GAO Report at 23. 116 Id.
PETITION TO REDUCE EMISSIONS OF NATURAL GAS FROM OIL AND GAS OPERATIONS Page 35
lift system.117 The system drops the plunger to the bottom of the well, creating a barrier between gas and liquid. When the built-up gas pressure pushes the plunger to the surface, the plunger brings liquids with it, allowing the operator to remove the liquids while efficiently routing the gas to the gas line rather than venting it to the ambient air. Plunger lift systems also use computerized timers to adjust the dropping of the plunger according to the rate of fluid accumulation, further reducing the venting of methane.118
Plunger lift systems are cost effective. According to the EPA, they “can significantly
reduce gas losses, eliminate or reduce the frequency of future well treatments, and improve well productivity.”119 For example, in analyzing a plunger lift installation program implemented by Amoco, the EPA found that “[f]or the first year of operation, the company realized an average annual savings of approximately $90,200 per well at 2006 prices. In addition the company realized approximately $41,500 per well from salvage of the beam lift equipment at 2006 costs.”120 Moreover, by allowing private companies to recover and sell more gas, the technology is an effective means of producing more federal royalty revenue.
3) Vapor Recovery Units
Storage tanks are another major source of methane emissions from natural gas production
operations. Methane emissions can occur several ways: losses resulting from the reduction of pressure in the tank; losses due to the filling and emptying of a tank; and losses caused by environmental conditions triggering tank gas expansion or contraction. Significantly, according to EPA, storage tank emissions are likely higher than currently reported in the U.S. GHG Inventory.121 Thus, substantial uncertainties regarding how much storage tanks may contribute to methane emissions warrant rigorous standards preventing storage tank emissions.
Vapor recovery units are an available technology that can cost effectively reduce methane
emissions from storage tanks.122 Instead of allowing the gas to vaporize from the tank into the atmosphere, the vapor recovery unit captures the gas and transmits it directly to the pipeline.123 The GAO recommends the installation of these vapor recovery units to capture the gas vapor from the condensate storage tanks and send it into the pipeline to maximize recovery. EPA agrees with the GAO that “vapor recovery can provide generous returns to the relatively low cost
117 Id. at 8. 118 Id. 119 U.S. Environmental Protection Agency, Natural Gas STAR Partners, Lessons Learned: Installing Plunger Lift Systems in Gas Wells (October 2006), http://www.epa.gov/gasstar/documents/ll_plungerlift.pdf (last visited Apr. 19, 2011). 120 Id. at 11. 121 U.S. Environmental Protection Agency, Greenhouse Gas Emissions Reporting from the Petroleum and Natural Gas Industry Background Technical Support Document, U.S. Environmental Protection Agency Climate Change Division Washington DC (2010). 122 U.S. Environmental Protection Agency, Natural Gas STAR Partners, Lessons Learned: Installing Vapor Recovery Units on Crude Oil Storage Tanks (October 2006), http://www.epa.gov/gasstar/documents/ll_final_vap.pdf (last visited Apr. 19, 2011). 123 Id. at 9.
PETITION TO REDUCE EMISSIONS OF NATURAL GAS FROM OIL AND GAS OPERATIONS Page 36
of the technology,”124 providing both economic and environmental benefits. An added benefit of these systems is that in addition to capturing methane, they can also capture hazardous air pollutants.
Vapor recovery units are highly efficient at capturing gas, and recognizing this, states
have begun requiring that operators use units that capture a high proportion of emissions. For example, Wyoming requires 98% control for all new facilities or modified facilities with new and existing flashing emissions.125 Further, Colorado has proposed 98% control of vapors from dehydrator vapor recovery units, indicating that “many vapor recovery units and combustion devices already have control efficiencies of at least 98 percent.”
4) Dehydrators
Saturated water found in produced gas must be removed prior to transmitting the gas.
Glycol dehydrators are the most common technology used to remove this water from the gas. Normally a dehydrator circulates the chemical glycol to absorb moisture in the gas; unfortunately, this also absorbs small amounts of gas, which is later released into the atmosphere when water vapor is released from the glycol.126
These emissions can be greatly reduced through the use of zero emission dehydrators,
which combine several technologies to virtually eliminate methane emissions.127 Zero emissions dehydrators employ flash tanks, which capture methane that flashes or evaporates from water wet glycol in an energy-exchange pump, as well as electric pumps and electric control valves. “Zero emissions dehydrators are also designed to collect all condensable components from the still column vapor and use the remaining non-condensable still vapor (methane and ethane) as fuel for the glycol reboiler.”128 EPA findings show that due to gas savings, zero emission dehydrators can payback their implementation cost in under a year, making them economically efficient.
Another way to reduce methane emissions from glycol dehydrators is to optimize the
circulation rates of the glycol. Methane emissions from a glycol dehydrator are proportional to the amount of glycol circulated through the system. However, production rates at wells decrease over time and circulation rates designed for early production exceed the necessary circulation rates for a mature well. Thus, methane emissions can be reduced by optimizing circulation rates throughout a well’s period of production.
There are cases in which the use of zero emissions dehydrators or glycol dehydrators will
not be feasible. “Glycol dehydrators require electric utilities or an engine generator set to achieve
124 Id. at 6. 125 Wyoming DEQ, Oil and Gas Production Facilities Chapter 6, Section 2 Permitting Guidance (March 2010) (“Wyoming DEQ Permitting Guidance 2010”) at 5. 126 Id. 127 U.S. Environmental Protection Agency, Natural Gas STAR Program Partner Reported Opportunities (PRO), PRO Fact Sheet No. 206: Zero Emissions Dehydrators (2011). 128 Id.
PETITION TO REDUCE EMISSIONS OF NATURAL GAS FROM OIL AND GAS OPERATIONS Page 37
zero emissions”129 However, solid desiccant dehydrators reduce methane by 99% compared with glycol dehydrators and have lower operating and maintenance costs.130 Solid desiccant dehydrators are very simple devices with no moving parts and no external power supply needs, and are appropriate for use in a wide variety of applications.
5) Pneumatic Devices
Pneumatic devices utilized by the natural gas industry in all sectors of its business are
also substantial methane emissions sources. Pneumatic devices are tools and instruments that generate and utilize compressed air. Unfortunately, the natural gas industry’s pneumatic devices are typically powered by natural gas and vent large amounts of methane to the atmosphere as part of their normal operation. Some pneumatic devices bleed methane into the atmosphere continuously, while others release gas intermittently. By replacing the pneumatic devices that bleed gas at a high rate with more efficient devices that do not utilize natural gas (instrument air controls) or devices that bleed at a lower rate (low-bleed pneumatics), the natural gas industry can effectively capture additional natural gas, thus protecting the environment and producing additional revenue.131
Pneumatic controls that use instrument air rather than natural gas can achieve 100%
methane emission reductions. Instrument air technology can be used where electrical power is available, or instrument air devices can be converted to solar powered, battery operated devices. A number of Natural Gas STAR partners have had success employing solar power technology.132 Also, pneumatic controllers can use mechanical control, nitrogen gas, or electrical valve controllers. “The most common mechanical control device is a level controller, which translates the position of a liquid-level float to the drain valve position with mechanical linkages. There is no gas usage in either the process measurement or valve actuation, and reliability is very high.”133 The use of nitrogen gas or electric valve controllers is more limited, but could provide an effective, low-emission alternative for certain operations.134
Many Natural Gas STAR partners have realized significant economic benefits from
switching to instrument air and have had good success with this technology.135 One natural gas lease operator replaced and retrofitted 400 high-bleed pneumatics at a cost of more than $118,000, but found an annual savings in captured gas of nearly $149,000, for a payback on investment in less than one year.136 Technology improvements like this mean more revenue for the producer, more revenue for the government, and important reductions in the amount of
129 Id. 130 Williams & Copeland at 26-27. 131 Id. at 9-10. 132 U.S. Environmental Protection Agency, Natural Gas STAR Program, Lessons Learned: Solar Power Applications for Methane Emissions Mitigation (2009) (“USEPA Solar Power Apps”) at15-23. 133 U.S. Environmental Protection Agency, Natural Gas STAR Program, Lessons Learned: Convert Pneumatics to Mechanical Controls (2004) at 1- 2. 134 U.S. Environmental Protection Agency, Natural Gas STAR Program, Lessons Learned: Convert Pneumatics to Instrument Air (2006) at 15. 135 USEPA Solar Power Apps at 15-23. 136 GAO Report at 23.

PETITION TO REDUCE EMISSIONS OF NATURAL GAS FROM OIL AND GAS OPERATIONS Page 38
greenhouse gases released into the atmosphere. Switching to instrument air also improves safety, since flammable natural gas is no longer used in this process.137 This change, in addition to the other recommended technologies, will help prevent the release of methane into the atmosphere while producing greater revenue for both the federal government and natural gas producers.
If the use of non-gas powered devices that achieve 100% methane emission reduction is
not possible, low-bleed pneumonic devices should be used to effectively cut methane emissions. According to the EPA, the cost of switching from high-bleed to low-bleed pneumatic devices ranges from $700 to $3,000 per device, which can be recovered in two to eight months, on average.138 Switching to low-bleed devices involves replacing, retrofitting, and maintaining devices to achieve a substantially reduced emissions rate. This has the added benefit of increasing operational efficiencies by improving system performance and reliability, and monitoring of important parameters.
The use of low-bleed pneumonic devices should be required where 100% methane
reduction cannot be achieved because the use of low-bleed devices has been proven feasible. Colorado and Wyoming already have programs in place that require low-bleed pneumatic devices. With certain exceptions, Colorado requires that new pneumatic devices must be low-bleed—meaning that it emits 6 standard cubic feet per hour (scfh) of natural gas or less—and that existing devices that do not meet this standard must be retrofitted to meet it.139 Wyoming requires that new facilities with natural gas operated pneumatic controllers must not emit more than 6 scfh or the controller discharge system must be routed to a closed loop system.140
6) Pipelines
Operators transport natural gas from the gas fields through pressurized pipelines.
According to U.S. Greenhouse Gas Inventory data, pipeline leaks account for a large proportion—about 8 percent—of methane emissions from the transmission sector.141 An important factor in facilitating or limiting leakage is the material from which the pipeline is constructed. Cast iron and steel piping materials used in underground gas distribution systems tend to leak more than any other distribution piping materials.142 On the opposite end of the spectrum is plastic pipe, which EPA states has the lowest leakage rate.143 Further, while using plastic pipe is not always feasible, an operator should always be able to use plastic insert liners that have the potential to significantly reduce emissions.144
137 Id. at 5-6. 138 Id. at 21-22. 139 Colorado Department of Public Health and Environment, Air Quality Control Commission, Regulation Number 7, XVIII.C (2011). 140 Wyoming DEQ Permitting Guidance 2010 at 10, 19. 141 U. S. Environmental Protection Agency, Inventory of U.S. Greenhouse Gas Emissions and Sinks: 1990 – 2010 (Apr. 15, 2012), http://www.epa.gov/climatechange/emissions/downloads12/US-GHG-Inventory-2012-Main-Text.pdf. 142 See U.S. Environmental Protection Agency, Natural Gas STAR Program, Partner Reported Opportunities for Reducing Methane Emissions Fact Sheet No. 402: Insert Gas Main Flexible Liners (2012). 143 Id. 144 Williams & Copeland at 47.

PETITION TO REDUCE EMISSIONS OF NATURAL GAS FROM OIL AND GAS OPERATIONS Page 39
Additionally, substantial amounts of methane are leaked to the atmosphere during
pipeline maintenance and repair. A number of techniques can reduce emissions in these circumstances, including pump-down techniques to reduce the gas line pressure in the pipeline before venting or the use of an ejector or inert gases and pigs to purge pipelines.145 Also, hot tapping allows for a new pipeline connection while the pipeline is kept in service, avoiding product loss, methane emissions, and disruption of service to customers.146
Lastly, gas line breaks can result in unexpected emissions of methane gas into the
ambient air. These emissions can be avoided through the installation of excess flow valves that ensure an automated shutoff of a ruptured gas line.147
7) Direct Inspection and Maintenance
Gas plants annually lose more than 24 billion cubic feet of methane due to fugitive
emissions from leaking compressors and other equipment components such as valves, connectors, seals, and open-ended lines.148 The implementation of direct inspection and maintenance (DI&M) programs is a cost-effective method of detecting, measuring, prioritizing, and repairing equipment leaks to reduce methane emissions.149 In fact, Natural Gas STAR partners have shown that a DI&M program can eliminate 96% of gas losses and a corresponding 80% of methane emissions.150
There are numerous methods that are effective in detecting leaks. Soap bubble screening,
which involves spraying soap on a component, is a fast, easy, and low-cost technique.151 Electronic screening uses a small handheld gas detector to identify leaks, and is also fast and convenient.152 Organic Vapor Analyzers and Toxic Vapor Analyzers are portable hydrocarbon detectors that can be used to spot and quantify leaks.153 Devices are also available that spot leaks by detect the acoustic signature created by a gas leak.154 Infrared cameras are able to identify gas leaks because hydrocarbon emissions absorb infrared light of a certain wavelength. These cameras are particularly effective due their ability to screen hundreds of components per hour and to identify leaks from inaccessible equipment. They can even be used in aerial inspection to screen many miles of transmissions pipelines and dispersed equipment to detect plumes.155
145 Id. at 48. 146 Id. 147 Id. 148 U.S. Environmental Protection Agency, Natural Gas STAR Partners, Lessons Learned: Directed Inspection and Maintenance at Gas Processing Plants and Booster Stations (2003). 149 Id. 150 Id. 151 Id. 152 Id. 153 Id. 154 Id. 155 Id.

PETITION TO REDUCE EMISSIONS OF NATURAL GAS FROM OIL AND GAS OPERATIONS Page 40
The potential gas savings from implementing a DI&M program will depend on a number of factors, including the age, size, and operating characteristics of the facility. However, Natural Gas STAR partners have found the costs of a DI&M program are quickly recovered in gas savings.156
156 Id.

PETITION TO REDUCE EMISSIONS OF NATURAL GAS FROM OIL AND GAS OPERATIONS Page 41
APPENDIX B: CLIMATE CHANGE SCIENCE SUMMARY, JUNE 2012 Center for Biological Diversity
Climate Change Science Summary Shaye Wolf Ph.D.
June 2012
I. The International Scientific Consensus on Climate Change
There is a strong, international scientific consensus that climate change is occurring, is primarily human-induced, and threatens human society and natural systems. The Intergovernmental Panel on Climate Change (IPCC) in its 2007 Fourth Assessment Report expressed in the strongest language possible its finding that global warming is occurring: “Warming of the climate system is unequivocal, as is now evident from observations of increases in global average air and ocean temperatures, widespread melting of snow and ice, and rising global average sea level.”157 The IPCC concluded that most of the recent warming observed has been caused by human activities.158 In the United States, the U.S. Global Change Research Program in its 2009 report Climate Change Impacts in the United States stated that “global warming is unequivocal and primarily human-induced” and “widespread climate-related impacts are occurring now and are expected to increase,”159 and the U.S. National Research Council concluded that “[c]limate change is occurring, is caused largely by human activities, and poses significant risks for—and in many cases is already affecting—a broad range of human and natural systems.”160 Based on observed and expected harms from climate change, in 2009 the U.S. Environmental Protection Agency concluded that greenhouse gas pollution endangers the health and welfare of current and future generations.161
II. Climate Change is Already Resulting in Severe and Significant Impacts Worldwide, and These Impacts Will Worsen as Emissions Continue to Rise
A. Global greenhouse gas emissions are tracking the worst IPCC emissions scenario due to failures by the United States and other major emitters to adequately address climate change Due to US and global failures to address climate change, greenhouse gas emissions are
increasing at an accelerating pace. Carbon dioxide (CO2) is the dominant greenhouse gas driving the observed changes in the Earth’s climate and is expected to become even more dominant in
157Intergovernmental Panel on Climate Change, Climate Change 2007: Synthesis Report. An Assessment of the
Intergovernmental Panel on Climate Change, 30 (2007) available at www.ipcc.ch. 158 Intergovernmental Panel on Climate Change, Climate Change 2007: Synthesis Report. An Assessment of the Intergovernmental Panel on Climate Change (2007) available at www.ipcc.ch. 159 US Global Change Research Program, Global Climate Change Impacts in the United States, 12 (2009). 160 National Research Council, Advancing the Science of Climate Change (2010). available at www.nap.edu. 161 U.S. Environmental Protection Agency, Endangerment and Cause or Contribute Findings for Greenhouse Gases Under Section 202(a) of the Clean Air Act; Final Rule, 74 Federal Register 66496 (2009).

PETITION TO REDUCE EMISSIONS OF NATURAL GAS FROM OIL AND GAS OPERATIONS Page 42
the future.162 The atmospheric concentration of CO2 reached ~392 parts per million (ppm) in 2011163 compared to the pre-industrial concentration of ~280 ppm. The current CO2
concentration has not been exceeded during the past 800,000 years and likely not during the past 15 to 20 million years.164 Atmospheric CO2 emissions have risen particularly rapidly since the 2000s.165 The global fossil fuel CO2 emissions growth rate was 1.1% per year during 1990-1999 compared with 3.1% during 2000-2010, and since 2000, this growth rate has largely tracked or exceeded the most fossil-fuel intensive emissions scenario projected by the IPCC (A1FI).166 The CO2 emissions growth rate fell slightly in 2009 due largely to the global financial and economic crisis; however, the decrease was less than half of what was expected and was short-lived.167 Global CO2 emissions increased by 5.9% in 2010 resulting in a record 33 billion tons of CO2 emitted,168 and CO2 emissions reached another record high in 2011.169
Anthropogenic emissions of short-lived and long-lived non-CO2 greenhouse pollutants,
such as methane, black carbon, and ozone-depleting gases, also contribute significantly to warming, accounting for about 30 percent of the anthropogenic greenhouse gas effect.170
Methane is the most abundant non-CO2 greenhouse pollutant in the atmosphere today, and over a century’s time, methane will trap about 25 times more heat than an equal amount of CO2.
171 Atmospheric methane has increased by ~150% since the industrial revolution, surpassing levels recorded during the past 800,000 years, and experienced an abrupt increase beginning in 2007.172 Black carbon (soot) directly absorbs light and is deposited on snow and ice where it darkens the surface, reduces reflectivity, and significantly enhances solar absorption.173 Because it enhances
162 National Research Council, Climate Stabilization Targets: Emissions, Concentrations, and Impacts over Decades to Millennia (2010). 163 See National Oceanic and Atmospheric Administration, Trends in Atmospheric Carbon Dioxide, www.esrl.noaa.gov/gmd/ccgg/trends/global.html (last visited June 5, 2012). 164 Kenneth L. Denman et al., Couplings Between Changes in the Climate System and Biogeochemistry, in Climate Change 2007: The Physical Science Basis - Contribution of Working Group I to the Fourth Assessment Report of the Intergovernmental Panel on Climate Change 500 (Susan Solomon et al., eds. 2007); Aradhna K. Tripati et al., Coupling of CO2 and ice sheet stability over major climate transitions of the last 20 million years, 326 Science 1394 (2009). 165 Michael R. Raupach et al., Global and Regional Drivers of Accelerating CO2 Emissions, 104 Proc. of the Natl. Acad. of Sciences of the U.S. 10288 (2007); Pierre Friedlingstein et al., Update on CO2 Emissions, 3 Nature Geoscience 811 (2010); Global Carbon Project, Carbon Budget 2009 (2010). 166 Michael R. Raupach et al., Global and Regional Drivers of Accelerating CO2 Emissions, 104 Proc. of the Natl. Acad. of Sciences of the U.S. 10288 (2007); C. McMullen & J. Jabbour, UNEP, Climate Change Science Compendium 2009 (2009); Katherine Richardson et al., Synthesis Report from Climate Change: Global Risks, Challenges and Decisions (Copenhagen March 10-12, 2009), available at climatecongresss.ku.dk.; Global Carbon Project, Carbon Budget 2009 (2010); Global Carbon Project, Carbon Budget 2010 (2011). 167 Pierre Friedlingstein et al., Update on CO2 Emissions, 3 Nature Geoscience 811 (2010); Pierre Friedlingstein et al., Update on CO2 Emissions, 3 Nature Geoscience 811 (2010). 168 Jos G. J. Olivier et al., The Hague: PBL/JRC, Long-term trend in global CO2 emissions. 2011 report (2011), available at http://www.pbl.nl/en/publications/2011/long-term-trend-in-global-co2-emissions-2011-report; Global Carbon Project, Carbon Budget 2010 (2011). 169 See International Energy Agency, Global carbon-dioxide Emissions Increase by 1.0 Gt in 2011 to Record High, http://www.iea.org/newsroomandevents/news/2012/may (last visited June 5, 2012). 170 S.A. Montzka et al., Non-CO2 Greenhouse Gases and Climate Change, 476 Nature 43 (2011). 171 S.A. Montzka et al., Non-CO2 Greenhouse Gases and Climate Change, 476 Nature 43 (2011); National Research Council Climate Stabilization Targets: Emissions, Concentrations, and Impacts over Decades to Millennia (2010). 172 Piers Forster et al., Changes in Atmospheric Constituents and in Radiative Forcing in Climate Change 2007: The Physical Science Basis - Contribution of Working Group I to the Fourth Assessment Report of the IPCC (Susan Solomon et al., eds. 2007); S.A. Montzka et al., Non-CO2 Greenhouse Gases and Climate Change, 476 Nature 43 (2011). 173 V. Ramanathan & G. Carmichael, Global and regional climate changes due to black carbon, 1 Nature Geoscience 221 (2008).

PETITION TO REDUCE EMISSIONS OF NATURAL GAS FROM OIL AND GAS OPERATIONS Page 43
melting of snow and ice, black carbon is an important contributor to the retreat of Arctic sea ice.174 Because pollutants such as black carbon and methane have high global warming potentials but much shorter atmospheric lifetimes than CO2, immediately reducing these pollutants is important for slowing climate change in the next few decades, and provides the added benefits of improving human health and food security.175
B. Significant impacts of current and future greenhouse gas emissions Current atmospheric concentrations of greenhouse gases are already resulting in severe
and significant climate change impacts that are projected to worsen as emissions rise.176 Key changes include warming temperatures, the increasing frequency of extreme weather events, rapidly melting glaciers, ice sheets, and sea ice, rising sea levels, and a thirty percent increase in surface ocean acidity.177 Many climate change risks are substantially greater than assessed by the IPCC in 2007,178 and the rates of many negative changes are tracking the worst case scenarios projected by the IPCC.179 As summarized by Fussel (2009), “many risks are now assessed as stronger than in the AR4 [IPCC Fourth Assessment Report], including the risk of large sea-level rise already in the current century, the amplification of global warming due to biological and geological carbon-cycle feedbacks, a large magnitude of ‘committed warming’ currently concealed by a strong aerosol mask, substantial increases in climate variability and extreme weather events, and the risks to marine ecosystems from climate change and ocean acidification.” 180
The average global temperature has warmed by more than 0.8 degrees Celsius (1.4
degrees Fahrenheit) since the industrial revolution, most of which has occurred in the past three decades.181 In the United States, temperatures have warmed by more than 1.1°C (2ºF) over the past 50 years, with the greatest warming in Alaska.182 Globally, the decade from 2000 to 2010 was the warmest on record,183 and 2005 and 2010 tied for the hottest years on record.184 By the
174 P.K. Quinn et al., Arctic Haze: Current Trends and Knowledge Gaps, 59 Tellus Series B-Chemical and Physical Meteorology 99 (2007); M. Shekar Reddy & Olivier Boucher, Climate Impact of Black Carbon Emitted from Energy Consumption in the World’s Regions, 34 Geophysical Res. Letters L11802 (2007). 175 Mark Z. Jacobson, Short-term Effects of Controlling Fossil-fuel Soot, Biofuel Soot and Gases, and Methane on Climate, Arctic Ice, and Air Pollution Health, 115 J. of Geophysical Research D1420 (2010); S.A. Montzka et al., Non-CO2 Greenhouse Gases and Climate Change, 476 Nature 43 (2011); U.S. Environmental Protection Agency, Report to Congress on Black Carbon (2010); Drew Shindell et al., Simultaneously Mitigating Near-term Climate Change and Improving Human Health and Food Security, 335 Science 183 (2012). 176 U.S. Global Change Research Program, Global Climate Change Impacts in the United States (2009). 177 U.S. Global Change Research Program, Global Climate Change Impacts in the United States (2009). 178 Hans-Martin Fussel. An Updated Assessment of the Risks from Climate Change Based on Research Published Since the IPCC Fourth Assessment Report, 97 Climatic Change 469 (2009); Joel B. Smith et al., Assessing Dangerous Climate Change Through an Update of the Intergovernmental Panel on Climate Change (IPCC) “Reasons for Concern”, 106 Proc. of the Natl. Acad. of Sciences of the U.S. 4133 (2009). 179 A.D. Rogers & D. Laffoley, IPSO Oxford, International Earth system expert workshop on ocean stresses and impacts Summary Report (2011). 180 Hans-Martin Fussel. An Updated Assessment of the Risks from Climate Change Based on Research Published Since the IPCC Fourth Assessment Report, 97 Climatic Change 469 (2009). 181 Intergovernmental Panel on Climate Change, Climate Change 2007: Synthesis Report. An Assessment of the Intergovernmental Panel on Climate Change (2007) available at www.ipcc.ch. 182 U.S. Global Change Research Program, Global Climate Change Impacts in the United States (2009). 183 Press Release, National Aeronautic Space Association, NASA Research Finds Last Decade was Warmest on Record, 2009 One of the Warmest Years (Jan. 21, 2010), www.nasa.gov/home/hqnews/2010/jan/HQ_10-017_Warmest_temps.html.
PETITION TO REDUCE EMISSIONS OF NATURAL GAS FROM OIL AND GAS OPERATIONS Page 44
end of this century, the average temperature in the United States is expected to increase by 2.2 to 3.6°C (4 to 6.5°F) under a lower emissions scenario and by 3.9 to 6.1°C (7 to 11°F) under a higher emissions scenario.185
Extreme weather events are striking with increasing frequency, most notably heat waves
and rainfall extremes such as droughts and floods,186 with deadly consequences for people and wildlife. In the United States in 2011 alone, a record 14 weather and climate disasters occurred, including droughts, heat waves, and floods, that cost at least $US 1 billion each in damages and loss of human lives.187 Several studies predict that climate change will increase the frequency of high-severity hurricanes in the Atlantic,188 which would increase the economic damages by $25 billion by 2100 in the United States.189
The Arctic has experienced some of the most severe and rapid warming associated with
climate change, warming at twice the rate of the rest of the globe on average.190 Arctic summer sea ice extent and thickness have decreased to about half of what they were several decades ago,191 with an accompanying drastic reduction in volume,192 which is severely jeopardizing ice-dependent animals.193 Glaciers and ice sheets are rapidly melting, threatening water supplies in many regions and raising sea levels.194
Global average sea level rose by roughly eight inches (20 centimeters) over the past
century, and sea level rise is accelerating in pace.195 Although the IPCC Fourth Assessment Report projected a global mean sea-level rise in the 21st century of 18 to 59 centimeters (7 to 23
184 National Oceanic and Atmospheric Administration, NOAA: 2010 Tied for Warmest Year on Record, www.noaanews.noaa.gov/stories2011/20110112_globalstats.html (last visited on 3/30/12). 185 U.S. Global Change Research Program, Global Climate Change Impacts in the United States (2009). 186 Intergovernmental Panel on Climate Change (IPCC), Managing the Risks of Extreme Events and Disasters to Advance Climate Change Adaptation (SREX) (2012), http://ipcc-wg2.gov/SREX/; U.S. Global Change Research Program, Global Climate Change Impacts in the US: Global Climate Change (2009); Dim Coumou & Stefan Rahmstorf, A Decade of Weather Extremes, Nature Climate Change, doi: 10:1038/nclimate1452 (online publication Mar. 25, 2012).
187 National Oceanic and Atmospheric Administration, Extreme Weather 2011, http://www.noaa.gov/extreme2011/ (last visited April 2, 2012); World Meteorological Organization, Press Release - 2011: World’s 10th Warmest Year, Warmest Year with La Niňa on Record, Second-lowest Arctic Sea Ice Extent (2012), www.wmo.int/pages/mediacentre/press_releases/gcs_2011_en.html. 188 James B. Elsner et al., The Increasing Intensity of the Strongest Tropical Cyclones, 455 Nature 92 (2008); Morris A. Bender et al., Modeled Impact of Anthropogenic Warming on the Frequency of Intense Atlantic Hurricanes, 327 Science 454 (2010); C.M. Kishtawal et al., Tropical Cyclone Intensification Trends During Satellite Era (1986–2010), 39 Geophys. Research Letters L10810 (2012). 189 Robert K. Mendelsohn et al., The Impact of Climate Change on Global Tropical Cyclone Damage, 2 Nature Climate Change 205 (2012). 190 Kevin E.Trenberth et al., Observations: Surface and Atmospheric Climate Change in Climate Change 2007: The Physical Sciense Basis - Contribution of Working Group I to the Fourth Assessment Report of the IPCC (Susan Solomon et al., eds. 2007). 191 J. Stroeve et al., Arctic Sea Ice Extent Plummets in 2007, 89 EOS 2 (January 8, 2008); R. Kwok and D.A. Rothrock, Decline in Arctic sea ice thickness from submarine and ICESat records: 1958-2008, 36 Geophys. Research Letters L15501 (2009). 192 Polar Science Center, Arctic Sea Ice Volume Anomaly, version 2, http://psc.apl.washington.edu/wordpress/research/projects/arctic-sea-ice-volume-anomaly/ (last visited June 7, 2012). 193 Center for Biological Diversity and Care for the Wild International, Extinction: It’s Not Just for Polar Bears (2010). 194 Intergovernmental Panel on Climate Change (IPCC), Climate Change 2007: Synthesis Report (2007), http://www.ipcc.ch/publications_and_data/publications_ipcc_fourth_assessment_report_synthesis_report.htm, pp. 30, 49 of pdf. 195 U.S. Global Change Research Program, Global Climate Change Impacts in the United States (2009).
PETITION TO REDUCE EMISSIONS OF NATURAL GAS FROM OIL AND GAS OPERATIONS Page 45
inches), the IPCC acknowledged that this estimate did not represent a “best estimate” or “upper bound” for sea-level rise because it assumed a negligible contribution from the melting of the Greenland and west Antarctic ice sheets.196 Recent studies documenting the accelerating ice discharge from these ice sheets indicate that the IPCC projections are a substantial underestimate.197 Studies that have improved upon the IPCC estimates have found that a mean global sea-level rise of at least 1 to 2 meters is highly likely within this century,198 and larger rates of 2.4 to 4 meters per century are possible.199
C. Climate change impacts are delayed, long-lasting, and will be amplified by crossing tipping points and feedbacks The climate impacts from the greenhouse gases currently in the atmosphere have not
been fully realized, and many climate impacts will be very long-lasting. Due to thermal inertia in the climate system, there is a time lag between the emission of greenhouse gases and the full physical climate response to those emissions, called the “climate commitment.” If greenhouse gases were to be maintained near today’s levels, the Earth would be committed to additional warming estimated at 0.6°C to 1.6°C within this century, depending on the level of aerosol unmasking.200 Furthermore, due to the long atmospheric lifetime of CO2, climatic changes that are caused by CO2 emissions, such as surface warming, sea level rise, and ocean acidification are long-lasting and irreversible on human timescales.201 Even if all greenhouse emissions were to completely cease today, significant ongoing regional changes in temperature and precipitation would still occur,202 global average temperatures would not drop significantly for at least 1,000
196 Intergovernmental Panel on Climate Change (IPCC), Climate Change 2007: Synthesis Report (2007), http://www.ipcc.ch/publications_and_data/publications_ipcc_fourth_assessment_report_synthesis_report.htm, pp. 30, 49 of pdf. 197 James Hansen et al., Target atmospheric CO2: Where should humanity aim? 2 Open Atmospheric Science Journal 217 (2008); Harnish D Pritchard et al., Extensive Dynamic Thinning on the margins of the Greenland and Antarctic ice sheets, 461 Nature 971 (2009); E. Rignot et al., Acceleration of the contribution of the Greenland and Antarctic ice sheets to sea level rise, 38 Geophys. Research Letters L05503 (2011). 198 S. Rahmstorf et al., Recent climate observations compared to projections, 316 Science 709 (2007); W.T. Pfeffer et al., Kinematic Constraints on glacier contributions to 21st century sea-level rise, 321 Science 1340 (2008); Martin Vermeer & Stefan Rahmstorf, Global sea level linked to global temperature, 106 Proc. Natl. Acad. of Sciences 21527 (2009); Aslak Grinsted et al., Reconstructing sea level from paleo and projected temperatures 200 to 2100 AD, 34 Climate Dynamics 461 (2010); S. Jevrejeva et al., How will sea level respond to changes in natural and anthropogenic forcings by 2100?, 37 Geophys. Research Letters L07703 (2010). 199 Glenn A. Milne et al., Identifying the causes of sea-level change, 2 Nature Geoscience 471 (2009). 200 Aerosols are human-generated pollution particles like sulfates and nitrates that block solar radiation and produce a cooling effect that masks the full extent of global warming. When these particles are removed by air pollution control technologies, their cooling effect is reduced and warming is “unmasked.” G.A. Meehl, et al., Global Climate Projections in Climate Change 2007: The Physical Science Basis. Contribution of Working Group I to the Fourth Assessment Report of the IPCC (Susan Solomon et al., eds. 2007); V. Ramanathan & Y. Feng, On avoiding dangerous anthropogenic interference with the climate system: formidable challenges ahead, 105 Proc. Natl. Acad. of Sciences 14245 (2008).
201 David Archer & Victor Brovkin., The Millennial Atmospheric Lifetime of Anthropogenic CO2, 90 Climatic Change 283 (2008); Susan Solomon, et al., Irreversible Climate Change Due to Carbon Dioxide Emissions, 106 Proc. of the Natl. Acad. of Sciences of the U.S. 1704 (2009). www.climatecongresss.ku.dk. 202 Nathan P. Gillett et al., Ongoing Climate Change Following a Complete Cessation of Carbon Dioxide Emissions, 4 Nature Geoscience 83 (2011).
PETITION TO REDUCE EMISSIONS OF NATURAL GAS FROM OIL AND GAS OPERATIONS Page 46
years,203 ocean acidification would persist for hundreds of thousands to millions of years,204 and sea-level rise would continue for millennia.205 As summarized by one recent study, “It is sometimes imagined that slow processes such as climate changes pose small risks, on the basis of the assumption that a choice can always be made to quickly reduce emissions and thereby reverse any harm within a few years or decades. We have shown that this assumption is incorrect for carbon dioxide emissions, because of the longevity of the atmospheric CO2 perturbation and ocean warming. Irreversible climate changes due to carbon dioxide emissions have already taken place, and future carbon dioxide emissions would imply further irreversible effects on the planet, with attendant long legacies for choices made by contemporary society.”206 The U.S. National Research Council cautioned that “emission reduction choices made today matter in determining impacts that will be experienced not just over the next few decades, but also into the coming centuries and millennia.”207
Failure to reduce greenhouse gas emissions increases the risk of crossing tipping points
that could have severe consequences for life on earth. Growing emissions have the potential to trigger “tipping points,” critical points in the climate system where even small increases in climate forcing trigger a rapid switch to a qualitatively different state that can be irreversible for millennia.208 Several “tipping elements” in the climate system are thought to be close to their triggering points. For example, a 0.8 to 3.2°C temperature rise above pre-industrial has the potential to trigger irreversible melting of the Greenland ice sheet, resulting in an eventual seven meters of sea-level rise that would inundate small island nations and heavily populated coastal areas.209 Climate forcing from rising greenhouse gas emissions also reinforces positive feedback cycles that can further amplify warming. In the Arctic, the ice-albedo feedback loop is already occurring, where the loss of highly reflective sea ice due to warming increases solar absorption, making the Arctic more vulnerable to future warming and ice loss. Increasing temperatures are expected to trigger other feedbacks including the release of large stores of carbon and the potent greenhouse gas methane from melting Arctic permafrost.210
203 David Archer & Victor Brovkin., The Millennial Atmospheric Lifetime of Anthropogenic CO2, 90 Climatic Change 283 (2008); Susan Solomon, et al., Irreversible Climate Change Due to Carbon Dioxide Emissions, 106 Proc. of the Natl. Acad. of Sciences of the U.S. 1704, 22 (2009). www.climatecongresss.ku.dk. 204 Katherine Richardson et al., Synthesis Report from Climate Change: Global Risks, Challenges and Decisions (Copenhagen March 10-12, 2009), available at climatecongresss.ku.dk. 205 Susan Solomon, et al., Irreversible Climate Change Due to Carbon Dioxide Emissions, 106 Proc. of the Natl. Acad. of Sciences of the U.S. 1704, 22 (2009). www.climatecongresss.ku.dk. 206 Susan Solomon, et al., Irreversible Climate Change Due to Carbon Dioxide Emissions, 106 Proc. of the Natl. Acad. of Sciences of the U.S. 1704, 22 (2009). www.climatecongresss.ku.dk. 207 National Research Council, Warming World: Impacts by Degree, National Research Council, (2011), available at dels.nas.edu/materials/booklets/warming-world. 208 Timonthy M. Lenton et al., Tipping elements in the Earth's climate system, 105 Proc. Natl. Acad. of Sciences 1786 (2008); Mario Molina et al., Reducing abrupt climate change risk using the Montreal Protocol and other regulatory actions to complement cuts in CO2 emissions, 106 Proc. Natl. Acad. of Sciences 20616 (2009); Hans Joachim Schellenhuber, Tipping elements in the Earth System, 106 Proc. Natl. Acad. of Sciences 20561 (2009).
209 Alexander Robinson et al., Multistability and critical thresholds of the Greenland ice sheet, 2 Nature 429 (2012). 210 David Archer et al., The Millennial Atmospheric Lifetime of Anthropogenic CO2, 90 Climatic Change 283, 22 (2008); Charles D. Koven et al., Permafrost carbon-climate feedbacks accelerate global warming, 108 Proc. Natl. Acad. of Sciences 14769 (2011).

PETITION TO REDUCE EMISSIONS OF NATURAL GAS FROM OIL AND GAS OPERATIONS Page 47
D. Reducing atmospheric CO2 to 350 parts per million is needed to avoid many dangerous climatic changes Recent international agreements have focused on a goal of limiting global temperature
increase to 2°C above pre-industrial levels to “prevent dangerous anthropogenic interference with the climate system” as required by the United Nations Framework Convention on Climate Change.211 However, many studies demonstrate that a 2°C temperature increase above pre-industrial levels is well past the point where severe and irreversible impacts will occur.212 A 2°C temperature rise projected to result in significant risks to food and water security in many regions of the world, the disappearance of the Arctic summer sea ice which jeopardizes the Arctic sea-ice ecosystem and native communities, a high probability of triggering the irreversible melting of the Greenland ice sheet, an increased risk of extinction for 20-30% of species on Earth, the dieback of 30% of the Amazon rainforest, and “rapid and terminal” declines of coral reefs worldwide with serious consequences for the half billion people who depend on coral reefs directly for their livelihoods.213 As summarized by a recent study, the impacts associated with 2°C temperature rise have been “revised upwards, sufficiently so that 2°C now more appropriately represents the threshold between ‘dangerous’ and ‘extremely dangerous’ climate change.”214
Because a 2°C target would commit the world to serious harm, many climate scientists
and governments have urged a target of 1.5°C to avoid dangerous climate change, which roughly corresponds to limiting the atmospheric CO2 concentration to 350 ppm.215 Limiting warming to 1.5°C has been called for by the Alliance of Small Island States, the Least Developed Countries, and Executive Secretary of the United Nations Framework Convention on Climate Change Christiana Figueres. As climate scientist Dr. James Hansen and colleagues concluded, “if humanity wishes to preserve a planet similar to that on which civilization developed and to which life on Earth is adapted, paleoclimate evidence and ongoing climate change suggest that CO2 will need to be reduced from its current 385 ppm to at most 350 ppm [equivalent to ~1.5°C],
211 The non-legally binding Cancún Agreement of 2010 and Copenhagen Accord of 2009 recognize the objective of limiting warming to 2°C above pre-industrial (http://cancun.unfccc.int/cancun-agreements/main-objectives-of-the-agreements/#c33; unfccc.int/resource/docs/2009/cop15/eng/11a01.pdf).
212 J.B. Smith et al., Assessing dangerous climate change through an update of the Intergovernmental Panel on Climate Change (IPCC) "reasons for concern.” 106 Proc. Natl. Acad. of Sciences 4133 (2009).
213 B. Hare et al., Climate hotspots: key vulnerable regions, climate change and limits to warming, 11 Regional Environmental Change S1 (2011); C. Jones et al., Committed terrestrial ecosystem changes due to climate change, 2 Nature Geoscience 484 (2009); TEEB, The Economics of Ecosystems and Biodiversity, Climate Issues Update (September 2009); J.E.N. Veron et al., The coral reef crisis: The critical importance of <350 ppm CO2, 58 Marine Pollution Bulletin 1428 (2009); Rachel Warren et al., Increasing impacts of climate change upon ecosystems with increasing global mean temperature rise, 106 Climatic Change 141 (2011).
214 K. Anderson & A. Bows, Beyond ‘dangerous climate change’, Philosophical Transactions of the Royal Society A 369 (2010). 215 An analysis of low emissions pathways found that only those that approach 350 ppm by 2100 have a reasonable probability (40–60%) of limiting warming to 1.5°C. Hare, B. et al., UNFCCC AWG LCA, Low Mitigation Scenarios since the AR4--Global Emission Pathways and Climate Consequences (2009).
PETITION TO REDUCE EMISSIONS OF NATURAL GAS FROM OIL AND GAS OPERATIONS Page 48
but likely less than that.” 216 Further, a 350 ppm target must be achieved within decades to prevent dangerous tipping points and “the possibility of seeding irreversible catastrophic effects.”217
In order to preserve a likely chance of limiting overall temperature increases to 1.5° or
2°C above pre-industrial levels, recent scientific assessments have found that global emissions must peak within the next several years, decline very sharply thereafter, reach zero net emissions by mid-century, and become net-negative after 2050 (i.e. where more carbon is removed from the atmosphere than is produced).218 Scientists have estimated that cumulative CO2 emissions must not exceed 1000 GtCO2 (gigatonnes CO2) between 2000 and 2050 in order to have a 75% chance of staying below 2°C 219 and must not exceed 750 to 824 GtCO2 between 2000 and 2050 to meet a 350ppm CO2/1.5°C target.220 Because pathways for 1.5°C and 2°C require staying within a tight cumulative carbon budget, continuing increases in greenhouse gas emissions and corresponding delays in reaching a global emissions peak make it increasingly difficult to meet these targets. For example, global emissions from 2000 to 2010 accounted for roughly 360 GtCO2, which is a third of the allowed emissions until 2050 consistent with a 75% chance of staying within 2°C and nearly half of the allowed emissions until 2050 consistent with staying within 1.5°C.221 Thus, global emissions in the past decade have eliminated a large portion of the available carbon budget, and every year at current emissions (~33 GtCO2) consumes a significant share and makes meeting this budget less feasible. Every additional contribution to global greenhouse gas emissions, especially over the next few decades, means that meeting a 1.5°C or 2°C target becomes less likely and pushes the Earth further toward tipping points, enhances positive feedback loops that amplify warming, and increases the probability of dangerous climatic changes. III. Observed and Projected Climate Change Impacts in the United States
A. Water Resources
216 James Hansen et al., Target atmospheric CO2: Where should humanity aim? 2 Open Atmospheric Science Journal 217 (2008). 217 James Hansen et al., Target atmospheric CO2: Where should humanity aim? 2 Open Atmospheric Science Journal 217 (2008). 218 N. Höhne et al., Ecofys, Emission pathways towards 2°C (September 2009), www.ecofys.com; P. Baer et al., EcoEquity & SEI, A 350 ppm Emergency Pathway (2009)., http://gdrights.org; this pathway reaches 350 ppm CO2 by 2100; N. Höhne et al., Climate Analytics & Ecofys, Copenhagen Climate Deal—How to Close the Gap? Briefing Paper. (2009); United Nations Environment Programme (UNEP), The Emissions Gap Report: Are the Copenhagen Accord Pledges Sufficient to Limit Global Warming to 2C or 1.5C? (2010), www.unep.org.
219 Meinshausen, M. et al., Greenhouse-gas emission targets for limiting global warming to 2°C, 458 Nature 1158 (2009); National Academy of Sciences, Stabilization Targets for Atmospheric Greenhouse Gas Concentrations (2010), http://www.nap.edu/catalog/12877.html.
220 Frank Ackerman et al., Economics for Equity and Environment, The Economics of 350: The Benefits and Costs of Climate Stabilization (2009), www.e3network.org; P. Baer et al., EcoEquity & SEI, A 350 ppm Emergency Pathway (2009), http://gdrights.org.
221 N. Höhne et al., Ecofys, Emission pathways towards 2°C (September 2009), www.ecofys.com.

PETITION TO REDUCE EMISSIONS OF NATURAL GAS FROM OIL AND GAS OPERATIONS Page 49
Climate change is already altering the water supply in the United States, placing additional burdens on already stressed water systems.222 In the western US, mountain snowpack is declining 223 and snowmelt is shifting earlier, leading to even lower water supplies in late summer.224 In the southwestern US, precipitation has decreased during the summer and fall, and droughts are becoming more severe.225 In the Colorado River Basin, the biggest regional water reservoirs—Lake Powell and Lake Mead—declined from nearly full in 1999 to about 50% full in 2004 due to severe drought and reduced Colorado River flow, and they have not yet recovered, disrupting the region’s water supply system.226
Even a conservative level of warming of 1 to 2ºC by the middle of the century is
projected to result in a number of water-limiting effects across the country. Precipitation and runoff are likely to decrease in the West, especially the Southwest, in spring and summer.227 Reductions in western snowpack will create a shortfall in meeting current water demands in many areas, not to mention increased future demand resulting from population and economic growth.228 Dry events in the Southwest are expected to increase from a historic duration of 4 to 10 years to 12 years or more, and these severe future droughts will be aggravated by lower spring snowpack and soil moisture.229 By 2100, reductions in precipitation could result in decreases in water runoff in the Colorado River Basin of up to 20%.230
These predicted changes have effects that go beyond the diminished or unreliable availability of water. The intensity and frequency of floods and droughts is projected to increase, with rainfall becoming concentrated into fewer, heavier events.231 Increases and decreases in precipitation have the capacity to affect populations of fish and wildlife, surface water ecosystems and their ability to remove pollutants, hydroelectric generation, ground water supplies, water quality, and water demands.232 Changes in historical patterns of the water cycle
222 U.S. Global Change Research Program, Global Climate Change Impacts in the United States (2009). 223 Alan F. Hamlet et al., Effects of Temperature and Precipitation Variability on Snowpack Trends in the Western United States. 18 J. of Climate 4545 (2005); Philip W. Mote et al., Declining Mountain Snowpack in Western North America, American Meterological Society (2005); Philip W. Mote, Climate-driven Variability and Trends in Mountain Snowpack in Western North America, 19 J. of Climate 6209 (2006). 224 Iris T. Stewart et al., Changes in snowmelt runoff timing in Western North America under a 'business as usual' climate change scenario, 62 Climatic Change 217 (2004). 225 D. Cayan et al., Future Dryness in the Southwest US and the Hydrology of the Early 21st Century Drought, 107 Proc. Natl. Acad. of Sciences 50, 21271 (2010), available at http://www.pnas.org/content/early/2010/12/06/0912391107.abstract.; U.S. Global Change Research Program, Global Climate Change Impacts in the United States (2009). 226 J. Overpeck & B. Udall, Dry Times Ahead, 328 Science 1642 (2010).
227 U.S. Global Change Research Program, Global Climate Change Impacts in the United States (2009). 228 T. Barnett et al., The Effects of Climate Change on Water Resources in the West: Introduction and Overview, 62 Climactic Change 1 (2004). 229 Cayan, D. et al., Future Dryness in the Southwest US and the Hydrology of the Early 21st Century Drought, 107 Proc. Natl. Acad. of Sciences 50, 21271 (2010), available at http://www.pnas.org/content/early/2010/12/06/0912391107.abstract. 230 U. S. Geological Survey, Effects of Climate Change and Land Use on Water Resources in the Upper Colorado River Basin 2 (2011), available at http://pubs.usgs.gov/fs/2010/3123/.
231 U.S. Global Change Research Program, Global Climate Change Impacts in the United States (2009). 232 U.S. Global Change Research Program, Global Climate Change Impacts in the United States (2009).
PETITION TO REDUCE EMISSIONS OF NATURAL GAS FROM OIL AND GAS OPERATIONS Page 50
will increasingly compromise the national water supply in a way that threatens numerous sectors, from public health and energy, to agriculture and ecosystems.233
B. Food Security Climate change affects food security through a number of complex pathways, both direct
and indirect, including the reduced ability of crops to thrive, increased threats to livestock, climate-related contamination of food supplies, and an alteration in land use patterns and availability.
Higher levels of warming and extreme weather events such as droughts and flooding are
expected to negatively affect the growth and yields of many crops.234 Changes in winter chill conditions by the middle to end of the 21st century will no longer support some of the main tree crops currently grown in California.235 Warming will benefit weeds, diseases, and insect pests, increasing stress on crop plants and requiring more pest and weed control.236 Increasing CO2 concentrations are expected to lead to declines in forage quality in pastures and rangelands for livestock, while increased heat, disease, and weather extremes will increase livestock mortality.237
Temperature increases, changes in rainfall, and extreme weather events are expected to increase the incidence and intensity of food-borne diseases and food contamination, jeopardizing food security. 238 Ocean warming and ocean acidification are expected to threaten marine food resources by disrupting marine communities, promoting harmful algal blooms and the spread of some diseases, and increasing contaminants in fish and shellfish.239 Future ocean and weather patterns are likely to bring longer seasons of Harmful Algal Bloom outbreaks in Puget Sound, which could translate to longer fishery closures and threaten the state’s $108 million annual shellfish industry.240
C. Public Health
Climate change poses an increasing threat to human health, through increases in heat waves and other extreme weather events, aliments caused or exacerbated by air pollution and airborne allergens, and the increased occurrence of climate-sensitive infectious diseases.241
233 U.S. Global Change Research Program, Global Climate Change Impacts in the United States (2009). 234 U.S. Global Change Research Program, Global Climate Change Impacts in the United States (2009). 235 E. Luedeling et al., Climatic Changes Lead to Declining Winter Chill for Fruit and Nut Trees in California during 1950–2099, 4 PLOS ONE, July 2, 2009, available at http://www.plosone.org/article/info%3Adoi%2F10.1371%2Fjournal.pone.0006166. 236 U.S. Global Change Research Program, Global Climate Change Impacts in the United States (2009). 237 U.S. Global Change Research Program, Global Climate Change Impacts in the United States (2009). 238 M.C. Tirado et al., Climate Change and Food Safety: A Review, 43 Elsevier 1745 (2010), available at www.elsevier.com/locat/foodres. 239 M.C. Tirado et al., Climate Change and Food Safety: A Review, 43 Elsevier 1745-1765 (2010), available at www.elsevier.com/locat/foodres. 240 NOAA, Climate Change and Harmful Algal Blooms (2011), available at http://oceanservice.noaa.gov/news/weeklynews/mar11/ohh-climate.html (last visited June 11, 2012).
241 U.S. Global Change Research Program, Global Climate Change Impacts in the United States (2009).

PETITION TO REDUCE EMISSIONS OF NATURAL GAS FROM OIL AND GAS OPERATIONS Page 51
Certain groups such as children, the elderly, the poor, and minorities are particularly vulnerable to climate-related health effects.242
The number and intensity of extreme weather events are already increasing and are
projected to increase further in the future, leading to increases in associated injury, illness, emotional trauma, and death.243 Heat is already the leading cause of weather-related deaths in the United States, and a recent study estimated that more than 150,000 Americans may die by the end of the century due to excessive heat caused by climate change.244 Heat-wave related deaths in Chicago would more than double by 2050 under a lower emissions scenario and quadruple under a high emissions scenario, while in Los Angeles, annual heat-related deaths are projected to increase by two to three times by the end of the century under a lower emissions scenario and by five to seven times under a higher emissions scenario, compared to a 1990s baseline.245 Extreme precipitation, which has increased in the Midwest, South and other regions by 50% mostly over the last few decades,246 poses significant human health risks including contaminated drinking water leading to disease outbreaks, drowning, and mold-related illnesses.247An increase in the intensity of Atlantic hurricanes would also have severe health risks. More than 2,000 Americans were killed in the 2005 hurricane season, more than double the average number of lives lost to hurricanes in the United States over the previous 65 years.248
Air pollution components that trigger asthma attacks, specifically air particulates and
ozone, are expected to increase with climate change.249 Asthma remains a leading cause of morbidity and school absenteeism in the United States. Projected climate-related increases in ground-level ozone concentrations in 2020 could lead to an average of 2.8 million more occurrences of acute respiratory symptoms, 944,000 more missed school days, and over 5,000 more hospitalizations for respiratory-related problems.250 In 2020, the continental U.S. could pay an average of $5.4 billion (2008$) in health impact costs associated with the climate penalty on ozone, with California experiencing the greatest estimated impacts averaged at $729 million.251
Infectious diseases also pose an increased threat in a changing climate. There are an estimated 38 million cases of food and water-borne illness in the US each year, caused in part by an increasing number of pathogens in the wake of extreme weather events such as droughts,
242 U.S. Global Change Research Program, Global Climate Change Impacts in the United States (2009). 243 U.S. Global Change Research Program, Global Climate Change Impacts in the United States (2009). 244 Natural Resources Defense Council, Killer Summer Heat: Toll form Rising Temperatures in America due to Climate Change (2012). 245 U.S. Global Change Research Program, Global Climate Change Impacts in the United States (2009). 246 U.S. Global Change Research Program, Global Climate Change Impacts in the United States (2009). 247 Union of Concerned Scientists, After the Storm: The Hidden Health Risks of Flooding in a Warming World (2012), available at www.ucsusa.org/global_warming/science_and_impacts/impacts/global-warming-and-flooding.html. 248 U.S. Global Change Research Program, Global Climate Change Impacts in the United States (2009). 249 A. Bernstein & S.S. Myers, Climate Change and Children’s Health, 23 Current Opinion in Pediatrics 221 (2011), available at http://journals.lww.com/co-pediatrics/Fulltext/2011/04000/Climate_change_and_children_s_health.16.aspx#. 250 E. Perera & T. Sanford, Union of Concerned Scientists, Climate Change and Your Health: Rising Temperatures, Worsening Ozone Pollution, 2 (2011), available at www.ucsusa.org/assets/.../global..../climate-change-and-ozone-pollution.pdf.
251 E. Perera & T. Sanford, Union of Concerned Scientists, Climate Change and Your Health: Rising Temperatures, Worsening Ozone Pollution, 2 (2011), available at www.ucsusa.org/assets/.../global..../climate-change-and-ozone-pollution.pdf.
PETITION TO REDUCE EMISSIONS OF NATURAL GAS FROM OIL AND GAS OPERATIONS Page 52
flooding, and hurricanes.252 Meanwhile, warming climates favors the spread of some pathogen-carrying vectors. Lyme disease is the most common vector-borne disease in the United States, with 25,000–30,000 cases reported to the CDC per year, with the highest incidence among children between ages 5 and 9. 253 A recent study suggests that outbreaks of the vector-borne West Nile Virus are potentially related to higher summer temperatures and extreme variation in precipitation.254
D. Coastal Impacts of Sea-level Rise More than half (52%) of US residents live in coastal counties,255 while an estimated 40%
of US endangered species inhabit coastal ecosystems,256 highlighting the threats of sea-level rise to coastal communities. A nation-wide study estimated that approximately 3.7 million Americans live within one meter of high tide and are at extreme risk of flooding from sea-level rise in the next few decades, with Florida as the most vulnerable state followed by Louisiana, California, New York and New Jersey.257 In Louisiana, rising seas will lead to the permanent flooding of the Mississippi River delta and the loss of 10,000 to 13,500 km2 of coastal lands by 2100.258 In California, likely sea-level rise of 1.4 meters by 2100 would put 480,000 people and $100 billion worth of property at risk of flooding.259
E. Biodiversity
Climate change is already having significant impacts on species and ecosystems in all regions of the world, including changes in distribution, phenology, physiology, demographic rates, genetics and ecosystem services, as animals and plants lose their habitats and food sources, struggle to move poleward and upward to keep pace with climate change, and shift their timing of breeding and migration.260 Climate-vulnerable animals and plants including Arctic sea-ice
252 E. Maibach et al., Center for Climate Change Communication, Conveying the Human Implications of Climate Change, 10-11 (2011), available at http://www.climatehealthconnect.org/resource/conveying-human-implications-climate-change-climate-change-communication-primer-public-heal.
253 A. Bernstein & S.S. Myers, Climate Change and Children’s Health, 23 Current Opinion in Pediatrics 221 (2011), available at http://journals.lww.com/co-pediatrics/Fulltext/2011/04000/Climate_change_and_children_s_health.16.aspx#. 254 Shlomit Paz, West Nile Virus Eruptions in Summer 2010 – What Is the Possible Linkage with Climate Change?, Chapter 21 of National Security and Human Health Implications of Climate Change 253 – 260 (2012), available at http://www.springerlink.com/content/978-94-007-2430-3#section=1013683&page=2&locus=0. 255 Natl Ocean and Atmospheric Admin, State of the Coast, http://stateofthecoast.noaa.gov/population/welcome.html (last visited June 11, 2012). 256 O.E. LeDee et al., The challenge of threatened and endangered species management in coastal areas, 38 Coastal Management 337 (2010). 257 B.H. Strauss et al., Tidally Adjusted estimates of topographic vulnerability to sea level rise and flooding for the contiguous United States, 7 Environ. Res. Letters 014033 (2012). 258 M.D. Blum & H.H. Roberts, Drowning of the Mississippi Delta due to insufficient sediment supply and global sea-level rise, 2 Nature Geoscience 488 (2009). 259 M. Heberger et al., Potential impacts of increased coastal flooding in California due to sea-level rise, 109 Supplement 1 Climatic Change 229 (2011). 260 Camille Parmesan & Gary Yohe, A Globally Coherent Fingerprint of Climate Change Impacts Across Natural Systems, 421 Nature 37 (2003); Terry L. Root et al., Fingerprints of Global Warming on Wild Animals and Plants, 421 Nature 57 (2003); Camille Parmesan, Ecological and Evolutionary Responses to Recent Climate Change, 37 Annual Rev. of Ecology Evolution and Systematics 637 (2006); I-Ching Chen et al., Rapid Range Shifts of Species Associated with High Levels of Climate Warming, 333 Science 1024 (2011); Ilya M. D. Maclean & Robert J. Wilson, Recent Ecological Responses to Climate Change Support

PETITION TO REDUCE EMISSIONS OF NATURAL GAS FROM OIL AND GAS OPERATIONS Page 53
dependent species (e.g. polar bears, ringed seal), high-elevation species, amphibians, and corals are already experiencing climate-change-related population declines and extirpations.261
Because climate change is occurring at an unprecedented pace with multiple synergistic impacts, climate change is predicted to result in catastrophic species losses during this century. The IPCC concluded that 20% to 30% of plant and animal species will face an increased risk of extinction if global average temperature rise exceeds 1.5°C to 2.5°C relative to 1980-1999, with an increased risk of extinction for up to 70% of species worldwide if global average temperature exceeds 3.5°C relative to 1980-1999.262 Other studies have predicted that 15%-37% of species will be committed to extinction by 2050 under a mid-level emissions scenario,263 which the world has been exceeding,264 and that one in 10 species could face extinction by the year 2100 if current climate change continues unabated.265 The updated IPCC Reasons for Concern reflect that current warming is already at a point where significant risks to species and ecosystems are occurring, and that these risks will become “severe” at a ~1°C rise above pre-industrial levels.266 A comprehensive literature review found that significant species range losses and extinctions are predicted to occur globally for coral reef ecosystems and in several biodiversity hotspots at a global mean temperature rise below 2°; at 2°C temperature rise, projected impacts increase in magnitude, numbers, and geographic spread; and beyond a 2°C temperature rise, entire ecosystems may collapse and extinction risk accelerates and becomes widespread.267
F. Ocean Acidification The ocean’s absorption of anthropogenic CO2 has already resulted in more than a 30% increase in the acidity of ocean surface waters, at a rate likely faster than anything experienced in the past 300 million years, and ocean acidity could increase by 150% to 200% by the end of the century if CO2 emissions continue unabated.268 Ocean acidification negatively affects a wide
Predictions of High Extinction Risk, Proc.of the Natl. Acad. of Sciences of the U.S. Early edition, June 13, 2011, www.pnas.org/cgi/doi/10.1073/pnas.1017352108; Rachel Warren et al., Increasing Impacts of Climate Change upon Ecosystems with Increasing Global Mean Temperature rise, 141 Climatic Change 106 (2011). 261 Camille Parmesan, Ecological and Evolutionary Responses to Recent Climate Change, 37 Annual Rev. of Ecology Evolution and Systematics 637 (2006); Simon D. Donner et al., Model-based Assessment of the Role of Human-induced Climate Change in the 2005 Caribbean Coral Bleaching Event, 104 Proc. of the Nat'l Acad. of Sciences of the U.S. 5483 (2007); Ove Hoegh-Guldberg et al., Coral Reefs Under Rapid Climate Change and Ocean Acidification, 318 Science 1737 (2007); Eric Regehr et al., Effects of Earlier Sea Ice Breakup on Survival and Population Size of Polar Bears in Western Hudson Bay, 71 J. of Wildlife Mgmt. 2673 (2007); Erik A. Beever et al., Testing Alternative Models of Climate-Mediated Extirpations, 20 Ecological Applications 164 (2010). 262 Intergovernmental Panel on Climate Change, Climate Change 2007: Synthesis Report. An Assessment of the Intergovernmental Panel on Climate Change (2007) available at www.ipcc.ch. 263 Chris Thomas et al., Extinction Risk from Climate Change, 427 Nature 145 (2004). 264 Michael R. Raupach et al., Global and Regional Drivers of Accelerating CO2 Emissions, 104 Proc. of the Natl. Acad. of Sciences of the U.S. 10288 (2007); Global Carbon Project, Carbon Budget 2009 (2010). 265 Ilya M. D. Maclean & Robert J. Wilson, Recent Ecological Responses to Climate Change Support Predictions of High Extinction Risk, Proc.of the Natl. Acad. of Sciences of the U.S. (2011). 266 Joel B. Smith et al., Assessing Dangerous Climate Change Through an Update of the Intergovernmental Panel on Climate Change (IPCC) “Reasons for Concern”, 106 Proc. of the Natl. Acad. of Sciences of the U.S. 4133 (2009). 267 Rachel Warren et al., Increasing Impacts of Climate Change upon Ecosystems with Increasing Global Mean Temperature rise, 141 Climatic Change 106 (2011). 268 James C. Orr et al., Anthropogenic Ocean Acidification Over the Twenty-first Century and its Impact on Calcifying Organisms, 437 Nature 681 (2005); ); Richard A. Feely et al., Ocean Acidification: Present Conditions and Future Changes in a

PETITION TO REDUCE EMISSIONS OF NATURAL GAS FROM OIL AND GAS OPERATIONS Page 54
range of marine species by hindering the ability of calcifying marine creatures to build protective shells and skeletons and by disrupting metabolism and critical biological function.269 In the Pacific Northwest, the acidification of coastal waters has been linked to recent, massive die-offs of larval Pacific oysters.270 Numerous U.S. and international scientific and policy bodies have identified ocean acidification as an urgent threat to ocean ecosystems, food security, and society.271 The United Nations Environment Programme concluded that ocean acidification’s impact on marine organisms poses a threat to food security and the billions of people that rely on a marine-based diet.272 Moreover, a recent study estimated that the damage our oceans will face from emissions-related problems will amount to $428 billion a year by 2050 and nearly $2 trillion per year by the century’s end.273
Coral reef ecosystems, which are estimated to harbour one-third of marine species and which support the livelihoods of a half billion people, are particularly threatened by ocean acidification. Some corals are already experiencing reduced calcification,274 and all coral reefs could begin to dissolve at CO2 concentrations of 560 ppm275 which could occur by mid-century. Due to the synergistic impacts of ocean acidification, mass bleaching, and other stresses, reefs are projected to experience “rapid and terminal” declines worldwide at atmospheric CO2 concentrations of 450 ppm.276 Prominent coral scientists have called for reducing atmospheric CO2 to 350 ppm or less to protect coral reefs.277
High-CO2 World, 22 Oceanography 36 (2009); Bärbel Honisch et al., The Geological Record of Ocean Acidification, 335 Science 1058 (2012). 269 Victoria J. Fabry et al., Impacts of Ocean Acidification on Marine Fauna and Ecosystem Processes, 65 ICES J. Marine Sciences 414 (2008); Richard A. Feely et al., Ocean Acidification: Present Conditions and Future Changes in a High-CO2 World, 22 Oceanography 36 (2009); Kristy J. Kroeker et al., Meta-analysis Reveals Negative Yet Variable Effects of Ocean Acidification on Marine Organisms, 13 Ecology Letters 1419 (2010). 270 Alan Barton et al., The Pacific Oyster, Crassostrea Gigas, Shows Negative Correlation to Naturally Elevated Carbon Dioxide Levels: Implications for Near-term Ocean Acidification Effects, 57 Limnology and Oceanography 698 (2012). 271 United Nations Environment Programme, UNEP Emerging Issues: Environmental Consequences of Ocean Acidification: A Threat to Food Security (2010), available at www.unep.org/dewa/pdf/Environmental_Consequences_of_Ocean_Acidification.pdf; National Research Council, Ocean Acidification: A National Strategy to Meet the Challenges of a Changing Ocean, Prepublication copy. (2010), available at www. nap.edu/catalog.php?record_id=12904; A.D. Rogers & D. Laffoley, IPSO Oxford, International Earth system expert workshop on ocean stresses and impacts Summary Report (2011). 272 United Nations Environment Programme, UNEP Emerging Issues: Environmental Consequences of Ocean Acidification: A Threat to Food Security (2010), available at www.unep.org/dewa/pdf/Environmental_Consequences_of_Ocean_Acidification.pdf 273 Kevin Noone et al., Stockholm Environment Institute, Valuing the Ocean Draft Executive Summary (2012). 274 Glenn De’ath et al., Declining Coral Calcification on the Great Barrier Reef. 323 Science 116-119 (2009). 275 Jacob Silverman et al., Coral reefs may start dissolving when atmospheric CO2 doubles, 36 Geophys. Research Letters L05606 (2009). 276 J.E.N. Veron et al., The coral reef crisis: The critical importance of <350 ppm CO2, 58 Marine Pollution Bulletin 1428 (2009). 277 J.E.N. Veron et al., The coral reef crisis: The critical importance of <350 ppm CO2, 58 Marine Pollution Bulletin 1428 (2009).

PETITION TO REDUCE EMISSIONS OF NATURAL GAS FROM OIL AND GAS OPERATIONS Page 55
References Cited
FRANK ACKERMAN ET AL., ECONOMICS FOR EQUITY AND ENVIRONMENT, THE ECONOMICS OF 350: THE BENEFITS AND COSTS OF CLIMATE STABILIZATION (2009).
K. Anderson & A. Bows, Beyond ‘dangerous climate change’, PHILOSOPHICAL TRANSACTIONS
OF THE ROYAL SOCIETY A 369 (2010).
David Archer & Victor Brovkin., The Millennial Atmospheric Lifetime of Anthropogenic CO2, 90 CLIMATIC CHANGE 283 (2008).
P. BAER ET AL., ECOEQUITY & SEI, A 350 PPM EMERGENCY PATHWAY (2009).
T. Barnett et al., The Effects of Climate Change on Water Resources in the West: Introduction and Overview, 62 CLIMACTIC CHANGE 1 (2004).
Alan Barton et al., The Pacific Oyster, Crassostrea Gigas, Shows Negative Correlation to Naturally Elevated Carbon Dioxide Levels: Implications for Near-term Ocean Acidification Effects, 57 LIMNOLOGY AND OCEANOGRAPHY 698 (2012).
Erik A. Beever et al., Testing Alternative Models of Climate-Mediated Extirpations, 20 ECOLOGICAL APPLICATIONS 164 (2010).
Morris A. Bender et al., Modeled Impact of Anthropogenic Warming on the Frequency of Intense Atlantic Hurricanes, 327 SCIENCE 454 (2010).
A. Bernstein & S.S. Myers, Climate Change and Children’s Health, 23 CURRENT OPINION IN
PEDIATRICS, 221 (2011).
M.D. Blum & H.H. Roberts, Drowning of the Mississippi Delta Due to Insufficient Sediment Supply and Global Sea-level Rise, 2 NATURE GEOSCIENCE 488 (2009).
D. Cayan et al., Future Dryness in the Southwest US and the Hydrology of the Early 21st Century Drought, 107 PROC. NATL. ACAD. OF SCIENCES 50, 21271 (2010).
CENTER FOR BIOLOGICAL DIVERSITY & CARE FOR THE WILD INTERNATIONAL, EXTINCTION: IT’S
NOT JUST FOR POLAR BEARS (2010).
I-Ching Chen et al., Rapid Range Shifts of Species Associated with High Levels of Climate Warming, 333 SCIENCE 1024 (2011).
Dim Coumou & Stefan Rahmstorf, A Decade of Weather Extremes, NATURE CLIMATE CHANGE, doi: 10:1038/nclimate1452 (online publication March 25, 2012).
PETITION TO REDUCE EMISSIONS OF NATURAL GAS FROM OIL AND GAS OPERATIONS Page 56
Glenn De’ath et al., Declining Coral Calcification on the Great Barrier Reef. 323 SCIENCE 116-119 (2009).
Kenneth L. Denman et al., Couplings Between Changes in the Climate System and Biogeochemistry, in CLIMATE CHANGE 2007: THE PHYSICAL SCIENCE BASIS. CONTRIBUTION OF
WORKING GROUP I TO THE FOURTH ASSESSMENT REPORT OF THE INTERGOVERNMENTAL PANEL
ON CLIMATE CHANGE 500 (Susan Solomon et al. eds.2007).
Simon D. Donner et al., Model-based Assessment of the Role of Human-induced Climate Change in the 2005 Caribbean Coral Bleaching Event, 104 PROC. OF THE NAT'L ACAD. OF SCIENCES OF
THE U.S. 5483 (2007).
James B. Elsner et al., The Increasing Intensity of the Strongest Tropical Cyclones, 455 NATURE 92 (2008).
Victoria J. Fabry et al., Impacts of Ocean Acidification on Marine Fauna and Ecosystem Processes, 65 ICES J. MARINE SCIENCES 414 (2008).
Richard A. Feely et al., Ocean Acidification: Present Conditions and Future Changes in a High-CO2 World, 22 OCEANOGRAPHY 36 (2009).
PIERS FORSTER ET AL., CHANGES IN ATMOSPHERIC CONSTITUENTS AND IN RADIATIVE FORCING in CLIMATE CHANGE 2007: THE PHYSICAL SCIENCE BASIS. CONTRIBUTION OF WORKING GROUP I TO
THE FOURTH ASSESSMENT REPORT OF THE INTERGOVERNMENTAL PANEL ON CLIMATE CHANGE 500 (Susan Solomon et al. eds. 2007).
Pierre Friedlingstein et al., Update on CO2 Emissions, 3 NATURE GEOSCIENCE 811 (2010).
Hans-Martin Fussel. An Updated Assessment of the Risks from Climate Change Based on Research Published Since the IPCC Fourth Assessment Report, 97 CLIMATIC CHANGE 469 (2009).
Nathan P. Gillett et al., Ongoing Climate Change Following a Complete Cessation of Carbon Dioxide Emissions, 4 NATURE GEOSCIENCE 83 (2011).
GLOBAL CARBON PROJECT, CARBON BUDGET 2009 (2010).
GLOBAL CARBON PROJECT, CARBON BUDGET 2010 (2011).
Aslak Grinsted et al., Reconstructing Sea Llevel from Paleo and Projected Temperatures 200 to 2100 AD, 34 CLIMATE DYNAMICS 461 (2010).
Alan F. Hamlet et al., Effects of Temperature and Precipitation Variability on Snowpack Trends in the Western United States. 18 J. OF CLIMATE 4545 (2005).
PETITION TO REDUCE EMISSIONS OF NATURAL GAS FROM OIL AND GAS OPERATIONS Page 57
James Hansen et al., Target Atmospheric CO2: Where Should Humanity Aim? 2 OPEN
ATMOSPHERIC SCIENCE JOURNAL 217 (2008).
B. Hare et al., Climate hotspots: Key Vulnerable Regions, Climate Change and Limits to Warming, 11 REGIONAL ENVIRONMENTAL CHANGE S1 (2011).
B. HARE ET AL., UNFCCC AWG LCA, LOW MITIGATION SCENARIOS SINCE THE AR4--GLOBAL
EMISSION PATHWAYS AND CLIMATE CONSEQUENCES (2009).
M. Heberger et al., Potential Impacts of Increased Coastal Flooding in California due to Sea-level Rise, 109 SUPPLEMENT 1 CLIMATIC CHANGE 229 (2011).
Ove Hoegh-Guldberg et al., Coral Reefs Under Rapid Climate Change and Ocean Acidification, 318 SCIENCE 1737 (2007).
N. HÖHNE ET AL., ECOFYS, EMISSION PATHWAYS TOWARDS 2°C (September 2009).
N. HÖHNE ET AL., CLIMATE ANALYTICS & ECOFYS, COPENHAGEN CLIMATE DEAL—HOW TO
CLOSE THE GAP? BRIEFING PAPER (2009).
Bärbel Honisch et al., The Geological Record of Ocean Acidification, 335 SCIENCE1058 (2012).
INTERGOVERNMENTAL PANEL ON CLIMATE CHANGE, CLIMATE CHANGE 2007: SYNTHESIS
REPORT. AN ASSESSMENT OF THE INTERGOVERNMENTAL PANEL ON CLIMATE CHANGE (2007) available at www.ipcc.ch.
INTERGOVERNMENTAL PANEL ON CLIMATE CHANGE, MANAGING THE RISKS OF EXTREME EVENTS
AND DISASTERS TO ADVANCE CLIMATE CHANGE ADAPTATION: A SPECIAL REPORT OF WORKING
GROUPS I AND II OF THE INTERGOVERNMENTAL PANEL ON CLIMATE CHANGE (2012).
International Energy Agency, Global Carbon-dioxide Emissions Increase by 1.0 Gt in 2011 to Record High, http://www.iea.org/newsroomandevents/news/2012/may (last visited June 5, 2012).
Mark Z. Jacobson, Short-term Effects of Controlling Fossil-fuel Soot, Biofuel Soot and Gases, and Methane on Climate, Arctic Ice, and Air Pollution Health, 115 J. OF GEOPHYS. RES. D1420 (2010).
S. Jevrejeva et al., How will Sea Level Respond to Changes in Natural and Anthropogenic Forcings by 2100?, 37 GEOPHYS. RESEARCH LETTERS L07703 (2010).
C. Jones et al., Committed Terrestrial Ecosystem Changes Due to Climate Change, 2 NATURE
GEOSCIENCE 484 (2009).
C.M. Kishtawal et al., Tropical Cyclone Intensification Trends During Satellite Era (1986–2010), 39 GEOPHYS. RES. LETTERS L10810 (2012).

PETITION TO REDUCE EMISSIONS OF NATURAL GAS FROM OIL AND GAS OPERATIONS Page 58
Charles D. Koven et al., Permafrost Carbon-climate Feedbacks Accelerate Global Warming, 108 PROC. NATL. ACAD. OF SCIENCES 14769 (2011).
Kristy J. Kroeker et al., Meta-analysis Reveals Negative Yet Variable Effects of Ocean Acidification on Marine Organisms, 13 ECOLOGY LETTERS 1419 (2010).
R. Kwok & D.A. Rothrock, Decline in Arctic Sea Ice Thickness from Submarine and ICESat Records: 1958-2008, 36 GEOPHYS. RESEARCH LETTERS L15501 (2009).
O.E. LeDee et al., The Challenge of Threatened and Endangered Species Management in Coastal Areas, 38 Coastal Management 337 (2010).
Timonthy M. Lenton et al., Tipping Elements in the Earth's Climate System, 105 PROC. NATL. ACAD. OF SCIENCES 1786.
E. Luedeling et al., Climatic Changes Lead to Declining Winter Chill for Fruit and Nut Trees in California During 1950–2099, 4 PLOS ONE, July 2, 2009.
Ilya M. D. Maclean & Robert J. Wilson, Recent Ecological Responses to Climate Change Support Predictions of High Extinction Risk, PROC. OF THE NATL. ACAD. OF SCIENCES OF THE
U.S. Early edition, June 13, 2011, www.pnas.org/cgi/doi/10.1073/pnas.1017352108.
E. MAIBACH ET AL., CENTER FOR CLIMATE CHANGE COMMUNICATION, CONVEYING THE HUMAN
IMPLICATIONS OF CLIMATE CHANGE (2011).
CATHERINE P. MCMULLEN & JASON JABBOUR, UNITED NATIONS ENVIRONMENT PROGRAMME, CLIMATE CHANGE SCIENCE COMPENDIUM 2009 (2009).
G.A. MEEHL, ET AL., GLOBAL CLIMATE PROJECTIONS, in CLIMATE CHANGE 2007: THE PHYSICAL
SCIENCE BASIS. CONTRIBUTION OF WORKING GROUP I TO THE FOURTH ASSESSMENT REPORT OF
THE IPCC (Susan Solomon et al. eds. 2007).
Meinshausen, M. et al., Greenhouse-gas emission targets for limiting global warming to 2°C 458
NATURE 1158 (2009).
Robert K. Mendelsohn et al., The Impact of Climate Change on Global Tropical Cyclone Damage, 2 NATURE CLIMATE CHANGE 205 (2012).
Glenn A. Milne et al., Identifying the Causes of Sea-level Change, 2 NATURE GEOSCIENCE 471 (2009).
Mario Molina et al., Reducing Abrupt Climate Change Risk using the Montreal Protocol and other Regulatory Actions to Complement Cuts in CO2 Emissions, 106 PROC. NATL. ACAD. OF
SCIENCES 20616 (2009).
S.A. Montzka et al., Non-CO2 Greenhouse Gases and Climate Change, 476 NATURE 43 (2011).

PETITION TO REDUCE EMISSIONS OF NATURAL GAS FROM OIL AND GAS OPERATIONS Page 59
Philip W. Mote et al., Declining Mountain Snowpack in Western North America. AMERICAN
METEROLOGICAL SOCIETY (2005).
Philip W. Mote, Climate-driven Variability and Trends in Mountain Snowpack in Western North America, 19 J. OF CLIMATE 6209 (2006).
National Aeronautics and Space Administration, NASA Research Finds Last Decade was Warmest on Record, 2009 One of the Warmest Years, http://www.nasa.gov/home/hqnews/2010/jan/HQ_10-017_Warmest_temps.html (last visited June 8, 2012).
National Oceanic and Atmospheric Administration, Climate Change and Harmful Algal Blooms, http://oceanservice.noaa.gov/news/weeklynews/mar11/ohh-climate.html (last visited June 11, 2012).
National Oceanic and Atmospheric Administration, Extreme Weather 2011, http://www.noaa.gov/extreme2011/ (last visited April 2, 2012).
National Oceanic and Atmospheric Administration, State of the Coast, http://stateofthecoast.noaa.gov/population/welcome.html (last visited June 11, 2012).
National Oceanic and Atmospheric Administration, Trends in Atmospheric Carbon Dioxide, www.esrl.noaa.gov/gmd/ccgg/trends/global.html (last visited June 5, 2012).
NATIONAL RESEARCH COUNCIL, NATIONAL ACADEMIES PRESS, ADVANCING THE SCIENCE OF
CLIMATE CHANGE (2010).
NATIONAL RESEARCH COUNCIL, NATIONAL ACADEMIES PRESS, CLIMATE STABILIZATION
TARGETS: EMISSIONS, CONCENTRATIONS, AND IMPACTS OVER DECADES TO MILLENNIA (2010).
NATIONAL RESEARCH COUNCIL, NATIONAL ACADEMIES PRESS, OCEAN ACIDIFICATION: A
NATIONAL STRATEGY TO MEET THE CHALLENGES OF A CHANGING OCEAN, PREPUBLICATION
COPY. (2010).
NATIONAL RESEARCH COUNCIL, NATIONAL ACADEMIES PRESS, WARMING WORLD: IMPACTS BY
DEGREE, NATIONAL RESEARCH COUNCIL (2011).
NATURAL RESOURCES DEFENSE COUNCIL, KILLER SUMMER HEAT: TOLL FORM RISING
TEMPERATURES IN AMERICA DUE TO CLIMATE CHANGE (2012).
KEVIN NOONE ET AL., STOCKHOLM ENVIRONMENT INSTITUTE, VALUING THE OCEAN DRAFT
EXECUTIVE SUMMARY (2012).
JOS G. J. OLIVIER ET AL., THE HAGUE: PBL/JRC, LONG-TERM TREND IN GLOBAL CO2 EMISSIONS. 2011 REPORT (2011).

PETITION TO REDUCE EMISSIONS OF NATURAL GAS FROM OIL AND GAS OPERATIONS Page 60
James C. Orr et al., Anthropogenic Ocean Acidification Over the Twenty-first Century and its Impact on Calcifying Organisms, 437 NATURE 681 (2005).
J. Overpeck & B. Udall, Dry Times Ahead, 328 SCIENCE, 1642 (2010).
Camille Parmesan, Ecological and Evolutionary Responses to Recent Climate Change, 37
ANNUAL REV. OF ECOLOGY EVOLUTION AND SYSTEMATICS 637 (2006).
Camille Parmesan & Gary Yohe, A Globally Coherent Fingerprint of Climate Change Impacts Across Natural Systems, 421 NATURE 37 (2003).
Shlomit Paz, West Nile Virus Eruptions in Summer 2010 – What Is the Possible Linkage with Climate Change? in NATIONAL SECURITY AND HUMAN HEALTH IMPLICATIONS OF CLIMATE
CHANGE, 253 (2012), http://www.springerlink.com/content/j8g005165j342272/.
E. PERERA & T. SANFORD, UNION OF CONCERNED SCIENTISTS, CLIMATE CHANGE AND YOUR
HEALTH: RISING TEMPERATURES, WORSENING OZONE POLLUTION (2011).
W.T. Pfeffer et al., Kinematic Constraints on Glacier Contributions to 21st Century Sea-level Rise, 321 SCIENCE 1340 (2008).
Polar Science Center, Arctic Sea Ice Volume Anomaly, version 2, http://psc.apl.washington.edu/wordpress/research/projects/arctic-sea-ice-volume-anomaly/ (last visited June 7, 2012)
Harnish D Pritchard et al., Extensive Dynamic Thinning on the Margins of the Greenland and Antarctic ice sheets, 461 NATURE 971 (2009).
P.K. Quinn et al., Arctic Haze: Current Trends and Knowledge Gaps, 59 TELLUS SERIES B-CHEMICAL AND PHYSICAL METEOROLOGY 99 (2007).
Stefan Rahmstorf et al., Recent Climate Observations Compared to Projections, 316 SCIENCE 709 (2007).
V. Ramanathan & G. Carmichael, Global and Regional Climate Changes due to Black Carbon, 1 NATURE GEOSCIENCE 221 (2008).
V. Ramanathan & Y. Feng, On Avoiding Dangerous Anthropogenic Interference with the Climate System: Formidable Challenges Ahead, 105 PROC. NATL. ACAD. OF SCIENCES 14245 (2008).
Michael R. Raupach et al., Global and Regional Drivers of Accelerating CO2 Emissions, 104 PROC. OF THE NATL. ACAD. OF SCIENCES OF THE U.S. 10288 (2007).

PETITION TO REDUCE EMISSIONS OF NATURAL GAS FROM OIL AND GAS OPERATIONS Page 61
M. Shekar Reddy & Olivier Boucher, Climate Impact of Black Carbon Emitted from Energy Consumption in the World’s Regions, 34 GEOPHYSICAL RES. LETTERS L11802 (2007).
Eric Regehr et al., Effects of Earlier Sea Ice Breakup on Survival and Population Size of Polar Bears in Western Hudson Bay, 71 J. OF WILDLIFE MGMT. 2673 (2007).
KATHERINE RICHARDSON ET AL., SYNTHESIS REPORT FROM CLIMATE CHANGE: GLOBAL RISKS, CHALLENGES AND DECISIONS (Copenhagen March 10-12, 2009), available at climatecongresss.ku.dk.
E. Rignot et al., Acceleration of the contribution of the Greenland and Antarctic ice sheets to sea level rise, 38 GEOPHYSICAL RESEARCH LETTERS L05503 (2011).
Alexander Robinson et al., Multistability and Critical Thresholds of the Greenland Ice Sheet, 2 NATURE CLIMATE CHANGE 429 (2012).
A.D. ROGERS & D. LAFFOLEY, IPSO OXFORD, INTERNATIONAL EARTH SYSTEM EXPERT
WORKSHOP ON OCEAN STRESSES AND IMPACTS SUMMARY REPORT (2011).
Terry L. Root et al., Fingerprints of Global Warming on Wild Animals and Plants, 421 NATURE
57 (2003).
Hans Joachim Schellenhuber, Tipping elements in the Earth System,106 PROC. NATL. ACAD. OF
SCIENCES 20561 (2009).
Drew Shindell et al., Simultaneously Mitigating Near-term Climate Change and Improving Human Health and Food Security, 335 SCIENCE 183 (2012).
Jacob Silverman et al., Coral Reefs May Start Dissolving when Atmospheric CO2 Doubles, 36 GEOPHYS. RESEARCH LETTERS L05606 (2009).
Joel B. Smith et al., Assessing Dangerous Climate Change Through an Update of the Intergovernmental Panel on Climate Change (IPCC) “Reasons for Concern”, 106 PROC. OF THE
NATL. ACAD. OF SCIENCES OF THE U.S. 4133 (2009).
Susan Solomon, et al., Irreversible Climate Change Due to Carbon Dioxide Emissions, 106 PROC. OF THE NATL. ACAD. OF SCIENCES OF THE U.S. 1704 (2009).
Iris T. Stewart et al., Changes in Snowmelt Runoff Timing in Western North America under a 'Business as Usual' Climate Change Scenario, 62 CLIMATIC CHANGE 217 (2004).
B.H. Strauss et al., Tidally Adjusted Estimates of Topographic Vulnerability to Sea level Rise and Flooding for the Contiguous United States, 7 ENVIRON. RES. LETTERS 014033 (2012).

PETITION TO REDUCE EMISSIONS OF NATURAL GAS FROM OIL AND GAS OPERATIONS Page 62
J. Stroeve et al., Arctic Sea Ice Extent Plummets in 2007, 89 EOS 2 (January 8, 2008), http://www.agu.org/pubs/crossref/2008/2008EO020001.shtml, p. 13 of pdf;
TEEB, THE ECONOMICS OF ECOSYSTEMS AND BIODIVERSITY, CLIMATE ISSUES UPDATE (2009).
Chris Thomas et al., Extinction Risk from Climate Change, 427 NATURE 145 (2004).
M.C. Tirado et al., Climate Change and Food Safety: A Review, 43 ELSEVIER 1745 (2010).
KEVIN E.TRENBERTH ET AL., OBSERVATIONS: SURFACE AND ATMOSPHERIC CLIMATE CHANGE in
CLIMATE CHANGE 2007: THE PHYSICAL SCIENSE BASIS - FOURTH ASSESSMENT REPORT OF THE
IPCC ((SUSAN SOLOMON ET AL. EDS. 2007).
Aradhna K. Tripati et al., Coupling of CO2 and Ice Sheet Stability Over Major Climate Transitions of the Last 20 Million Years. 326 SCIENCE 1394 (2009).
UNION OF CONCERNED SCIENTISTS, AFTER THE STORM: THE HIDDEN HEALTH RISKS OF FLOODING
IN A WARMING WORLD (2012).
UNITED NATIONS ENVIRONMENT PROGRAMME, UNEP EMERGING ISSUES: ENVIRONMENTAL
CONSEQUENCES OF OCEAN ACIDIFICATION: A THREAT TO FOOD SECURITY (2010).
UNITED NATIONS ENVIRONMENT PROGRAMME (UNEP), THE EMISSIONS GAP REPORT: ARE THE
COPENHAGEN ACCORD PLEDGES SUFFICIENT TO LIMIT GLOBAL WARMING TO 2C OR 1.5C?
(2010).
U.S. Environmental Protection Agency, Endangerment and Cause or Contribute Findings for Greenhouse Gases Under Section 202(a) of the Clean Air Act; Final Rule, 74 Federal Register 66496 (2009).
UNITED STATES ENVIRONMENTAL PROTECTION AGENCY, REPORT TO CONGRESS ON BLACK
CARBON: EPA-450/R-12-001 (2012), available at http://www.epa.gov/blackcarbon.
UNITED STATES GEOLOGICAL SURVEY, EFFECTS OF CLIMATE CHANGE AND LAND USE ON WATER
RESOURCES IN THE UPPER COLORADO RIVER BASIN (2011).
UNITED STATES GLOBAL CHANGE RESEARCH PROGRAM, GLOBAL CLIMATE CHANGE IMPACTS IN
THE UNITED STATES (2009).
Martin Vermeer & Stefan Rahmstorf, Global Sea level Linked to Global Temperature, 106 PROC. OF NATL. ACADEMY OF SCIENCES 21527 (2009).
J.E.N. Veron et al., The Coral Reef Crisis: The Critical Importance of <350 ppm CO2, 58
MARINE POLLUTION BULLETIN 1428 (2009);
PETITION TO REDUCE EMISSIONS OF NATURAL GAS FROM OIL AND GAS OPERATIONS Page 63
Rachel Warren et al., Increasing Impacts of Climate Change upon Ecosystems with Increasing Global Mean Temperature rise, 141 CLIMATIC CHANGE 106 (2011).
World Meteorological Organization, Press Release - 2011: World’s 10th Warmest Year, Warmest Year with La Niňa on Record, Second-lowest Arctic Sea Ice Extent (2012), www.wmo.int/pages/mediacentre/press_releases/gcs_2011_en.html


![[PROPOSED] CONSENT DECREE - NRDC](https://img.dokumen.tips/doc/110x75/620cff0a282b357906659994/proposed-consent-decree-nrdc.jpg)