Embed Size (px)
Citation preview

BEFORE THE PUBLIC UTILITIES COMMISSION
OF THE STATE OF CALIFORNIA
Application of Calnev Pipe Line LLC (PLC-1) for ) authority pursuant to Public Utilities Code Section 455.3, ) to increase its rates for intrastate pipeline transportation ) Application No. __________ services. )
APPLICATION OF CALNEV PIPE LINE LLC
Date: July19, 2013
GOODIN, MACBRIDE, SQUERI, DAY & LAMPREY, LLP James D. Squeri 505 Sansome Street, Suite 900 San Francisco, CA 94111 Telephone: (415) 392-7900 Facsimile: (415) 398-4321 E-mail: [email protected]
Attorneys for Calnev Pipe Line LLC
A1307013
F I L E D07-19-1304:59 PM

BEFORE THE PUBLIC UTILITIES COMMISSION
OF THE STATE OF CALIFORNIA
Application of Calnev Pipe Line LLC (PLC-1) for ) authority pursuant to Public Utilities Code Section 454, ) to increase its rates for intrastate pipeline transportation ) Application No. ________ services. )
APPLICATION OF CALNEV PIPE LINE LLC
I. INTRODUCTION
Pursuant to Section 454 of the Public Utilities Code, and Rules 6(a) and 23 of the
Rules of Practice and Procedure of the California Public Utilities Commission (“Commission”),
Calnev Pipe Line LLC (“Calnev” or “Applicant”) submits its application requesting authority to
increase the rates that it charges for transportation by pipeline of refined petroleum products
within California.1 The requested rate increase, if authorized, will increase revenues by
$846,000 over projected revenue at rates currently in effect.2
Section 454 authorizes oil pipeline public utilities like Calnev to increase their
public utility pipeline transportation rates subject to a showing before the Commission and a
finding by the Commission that the proposed new rates are justified.
By this application, Calnev is requesting authority pursuant to Public Utilities
(“PU”) Code Section 454 to increase its rates for intrastate pipeline transportation services by
$846,000, to become effective upon approval by the Commission. In support of the requested
rate increase, Calnev provides relevant information as referenced below.
1 Unless otherwise noted, all statutory references are to the Public Utilities Code. 2 Calnev’s Test Year 2013 intrastate revenues at existing rates are estimated to be about $2.2 million; 2013 Test Year revenues at the proposed rates are approximately $3.0 million.

2
II. CORRESPONDENCE AND COMMUNICATIONS
All correspondence and communications with respect to this Application should be
addressed or directed as follows:
GOODIN, MACBRIDE, SQUERI, DAY & LAMPREY, LLP James D. Squeri 505 Sansome Street, Suite 900 San Francisco, CA 94111 Telephone: (415) 392-7900 Facsimile: (415) 398-4321 E-mail: [email protected]
Attorneys for Calnev Pipe Line LLC
III. CALNEV EXISTING AND PROPOSED RATES
Origin Destination Existing Rates
(effective 1/14/13) Proposed
RatePercentIncrease
Colton Adelanto $0.3702 $0.3702 0.00% Colton BNSF $0.4815 $0.7315 51.92% Colton SCIA $0.5445 $0.7945 45.91% Colton Barstow
Commercial $0.5565 $0.8065 44.92%
Colton Yermo $0.4961 $0.7461 50.39%
IV. JUSTIFICATION FOR REQUESTED RATE INCREASE AND PROPOSED RATE DESIGN
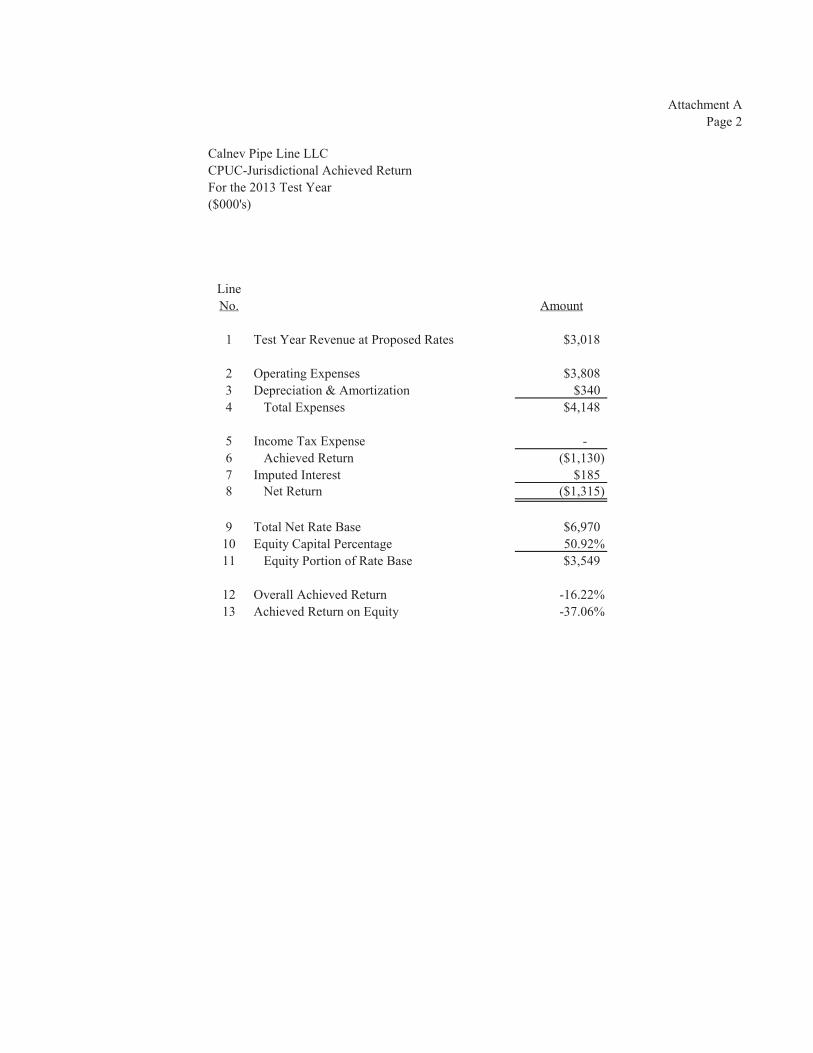
As set forth in Exhibit A hereto, Calnev presents its analysis of its achieved return
for Test Year 2013 assuming the proposed rate increase and related increase in revenue of
$846,000. The analysis of Calnev’s 2013 Test Year cost of service and revenues as set forth in
Exhibit A shows that Calnev’s overall achieved return is negative (-) 16.22%, with an achieved
return on equity of negative (-) 37.06%. Attachment A includes four pages: page 1 presents

3
Calnev’s 2013 Test Year cost of service; page 2 presents Calnev’s 2013 Test Year achieved
return; and pages 3 and 4 summarize Calnev’s 2013 Test Year rate base and operating expenses.3
The calculation of Calnev’s 2013 Test Year cost of service relies on Professor
James H. Vander Weide for cost of capital input values (i.e., cost of equity, cost of debt, and
capital structure), and incorporates 2013 Test Year volumes and revenues provided by Peter M.
Dito.4 With regard to development of Calnev’s 2013 Test Year cost of service, the base period
data for operating expenses is January 1, 2012 through December 31, 2012, and for all property
placed into service as of December 31, 2012.5
To separate costs at joint-use facilities that provide both intrastate and interstate
service, a “Volumetric Route Directory” was developed, using 2013 Test Year volumes provided
by Mr. Dito. Since there are no new projects on the horizon and no expected volume growth, the
volumes provided by Mr. Dito are the actuals for 2012, increased by 25 MB to reflect a full year
of Barstow military at 440 MBY. The Volumetric Route Directory calculates the percentage of
intrastate versus interstate destined volumes that are transported through or offloaded at each
delivery point along the joint-use facilities. These percentages are then applied to the investment
and operating expense costs of each respective facility.6
Development of rate base relies on the Depreciated Original Cost (“DOC”) rate
base methodology. Total DOC rate base consists of net book plant adjusted for an Allowance for
Funds Used During Construction (“AFUDC”) and working capital. In light of the Commission’s
determination in Decision No. 11-05-045 to deny inclusion of an income tax allowance in the
3 See Attachment B hereto; Declaration of Erik G. Wetmore at par. 4. 4 See Attachment B; Declaration of Erik G. Wetmore at par. 5. 5 See Attachment B hereto; Declaration of Erik G. Wetmore at par. 7. 6 Id. at par. 8.

4
cost of service for tax pass-through entities, there is no corresponding adjustment to Calnev’s
intrastate rate base for ADIT. Calnev’s rate base is summarized on page 3 of Attachment A.7
Development of Calnev’s CPUC-jurisdictional net book plant, which is comprised
of gross property less accumulated depreciation, is based on detailed data provided by Calnev
which listed total company historical gross property-related transactions through December 31,
2012 in an electronic database format. This property data represents the original cost of the
property when initially placed in service. Appropriate separation and allocation factors were
applied to these gross investment transactions to determine CPUC-jurisdictional investment.
Using Calnev’s book depreciation rates, accumulated depreciation and annual depreciation
expense on CPUC-jurisdictional original cost investment was calculated.8
AFUDC compensates investors for funds expended to construct or purchase
pipeline assets before the assets are placed in service. AFUDC was calculated based upon
Calnev’s annual additions of intrastate carrier property in service, assuming capital projects are
completed and placed in service evenly throughout the year. The cumulative balance of AFUDC
is depreciated based upon the company-wide composite depreciation rate. Additionally, all
capitalized interest during construction was excluded.9
Working capital consists of investments and prepayments required to support the
ongoing operation of a pipeline. Specifically, for oil pipelines, working capital reflects the sum
of the balances for oil inventory, materials and supplies, and prepayments. Calnev’s total
company working capital amounts were allocated to Calnev’s intrastate system based upon the
ratio of intrastate carrier property in service to total company property in service.10
7 See Attachment B; Declaration of Erik G. Wetmore at par.9. 8 See Attachment B; Declaration of Erik G. Wetmore at par. 10. 9 See Attachment B; Declaration of Erik G. Wetmore at par. 11. 10 Id. at par. 12.

5
For financial reporting purposes, Calnev uses the accrual method of accounting
mandated by the FERC’s Uniform System of Accounts (“USofA”) and Generally Accepted
Accounting Principles (“GAAP”). Therefore, to develop 2013 Test Year operating expenses, as
shown in Attachment A (page 4), it was necessary to make certain regulatory adjustments to
Calnev’s operating expenses recorded in the base period (January 1, 2012 through December 31,
2012).
Additionally, the amount of oil losses and shortages expense that Calnev incurs
may vary from year to year. Therefore, to assess the reasonableness of the amount to be
included in Calnev’s 2013 Test Year cost of service, it is appropriate to compare the amount of
oil losses and shortages expense incurred in 2012 to the average amount incurred for the five-
year period 2008 to 2012. This analysis showed that the amount incurred in 2012 is higher than
the average amount incurred for the five-year period 2008 through 2012. Therefore, instead of
using the amount of oil losses and shortages expense incurred in 2012, a normalized amount
based on the average amount incurred for the five-year period 2008 to 2012 was included.11
Based upon the foregoing, Calnev’s 2013 Test Year cost of service calculations
and results were developed. Specifically, page 1 of Attachment A presents the cost of service
results, while page 2 presents Calnev’s achieved return.
The cost of capital input values provided by Dr. Vander Weide are shown at the
bottom of page 1 of Attachment A, lines 14 through 17. Page 1, line 2 of Attachment A reflects
the weighted average cost-of-capital calculation. The cost of capital input values include three
elements: (1) cost of equity (12.5%) ; (2) cost of debt (5.4%) ; and (3) the percentages of debt
and equity in the capital structure 49.08%-50.92%). Because Calnev has no publicly traded
11 See Attachment B; Declaration of Erik G. Wetmore at par. 14.

6
stock or capital structure, these elements must be estimated from data for comparable-risk
publicly-traded companies. Calnev estimates the cost of equity component by applying the
Discounted Cash Flow (“DCF”) model to three groups of publicly-traded oil pipeline companies.
The weighted average cost of capital is then estimated by combining the cost of equity for the
proxy group with the average cost of debt and capital structure for the proxy group or with the
cost of debt and capital structure of Kinder Morgan Energy Partners (“KMEP”). The cost of
equity estimates use data as of the end of May 2013. Cost of debt and capital structure data are as
of the end of the first quarter 2013. The three estimates of the weighted average cost of capital
are 9.02 percent, 9.03 percent, and 9.11 percent. Calnev conservatively chose to use the lowest
estimate, 9.02 percent, as the cost of capital input in its cost of service study.12
The 9.02 percent cost of capital estimate is based on the average DCF result for a
proxy group of five publicly-traded oil pipeline companies with investment-grade bond ratings
and representative equity ratios. The 12.5 percent average DCF result for this group of five
companies combined with the 5.40 percent average cost of debt and the average 49.08 percent
debt/50.92 percent equity capital structure for this group of companies produces a weighted
average cost of capital equal to 9.02 percent.13
The 9.03 percent cost of capital estimate is based on the average DCF result for a
proxy group of seven investment-grade publicly-traded oil pipeline companies with sufficient
information to calculate a DCF result. The 13.3 percent average DCF result for this group of
seven companies combined with KMEP’s 5.94 percent cost of debt and 58.06 percent
12 See Attachment B; Declaration of Erik G. Wetmore at par. 18. 13 See Attachment B; Declaration of Erik G. Wetmore at par.17.

7
debt/41.94 percent equity capital structure produces a weighted average cost of capital equal to
9.03 percent.14
The 9.11 percent cost of capital estimate is based on the average DCF result for a
proxy group of nine publicly-traded oil pipeline companies with sufficient information to
calculate a DCF result. The 13.5 percent average DCF result for this group of nine companies
combined with KMEP’s 5.94 percent cost of debt and 58.06 percent debt/41.94 percent equity
capital structure produces a weighted average cost of capital equal to 9.11 percent.15
Assuming no tariff rate change, Calnev’s 2013 Test Year revenues using current
rates as calculated by Mr. Dito are approximately $2.2 million. Using the proposed tariff rate
changes, Calnev’s 2013 Test Year revenues as calculated by Mr. Dito are approximately $3.0
million.16
As page 1 of Attachment A shows, Calnev’s 2013 Test Year cost of service is
approximately $4.8 million. This exceeds Calnev’s 2013 Test Year revenues, assuming the
proposed tariff rate increase, by $1.8 million. As page 2 of Attachment A reflects, Calnev’s
overall achieved rate of return for the 2013 Test Year is -16.22%, and Calnev’s achieved rate of
return on equity for the 2013 Test Year is -37.06%.17
With respect to the increased rates that are the subject of this application, Calnev
will realize a negative return on equity rate base and will continue to substantially underearn any
reasonably derived cost of service related to its intrastate pipeline transportation services. 18
Specifically, the requested rate increase of $846, 000 will only result in changing Calnev’s
14 Id. at par. 18. 15 Id. at par. 19. 16 Id. at par. 20. 17 Id. at. par. 21 and par. 22. 18 The referenced calculations reflect the ratemaking methodology and certain assumptions set forth in Commission Decision No. 11-05-045 issued May 26, 2011, including rejection of an income tax
(footnote continued)

8
achieved return from -28.35% to -16.22%. The fact that Calnev, even assuming an increase of
$846,000, cannot, under any reasonable assessment of its utility cost of service, possibly earn
any return on its utility investment, much less a reasonable return, is per se justification of the
reasonableness of the subject rate increase. Furthermore, as shown in Exhibit A hereto, even
assuming the subject rate increase, Calnev projected revenues ($3,018,000) will recover less
than three-fourths of Calnev’s projected annual operating expenses ($4,148,000).
With regard to rate design, the rates reflecting the proposed increase of $846,000,
as set forth in Section III above, have been derived by increasing each of the current commercial
rates by 25 cents per barrel, based on recommendations from the Calnev marketing group.
Calnev is faced with the difficult position of working to maintain business at its intrastate
locations while trying to increase its revenue to reduce its existing negative return on investment.
The requested increase represents a step in achieving a balance between such competing goals.
Exhibit C hereto sets forth the Calnev tariff sheets reflecting increased rates as set forth in
Section III above.
V. INFORMATION REQUIRED BY RULE 3.2
Calnev is a Delaware limited liability company.19 Kinder Morgan Energy
Partners, L.P. (“KMEP”), a publicly traded partnership which, along with its affiliates, owns and
exercises control of Calnev, as authorized by the Commission in D. 01-03-074 issued March 27,
2001.
allowance. 19 As permitted by Rule 2.2. of the Commission’s Rules of Practice and Procedure, Calnev informs the Commission that Calnev’s Certificate of Formation and Good Standing (Delaware) as well as its Certificate of Good Standing/Foreign Limited Partnership (California) have previously been filed with the Commission as Exhibit B to A. 06-09-016.

9
Calnev is a 550-mile refined products pipeline system that spans from Colton,
California, to Las Vegas, including a 55-mile, non-jurisdictional military delivery pipeline
serving Edwards Air Force Base. It can transport over 150,000 barrels of gasoline, diesel and jet
fuel per day. The Calnev system consists of two pipelines, an 8-inch and a 14-inch line, that
operate around the clock to provide California and Las Vegas consumers approximately 40
million barrels of petroleum products per year, 10% of which is delivered to California
destinations. The intrastate portions of the Calnev pipeline system that are subject to the
Commission’s jurisdiction serve origin and destination points in San Bernardino County. The
Calnev system connects in Colton with SFPP.
The address of Calnev is 1100 Town & Country Road, Orange, CA 92868; their
telephone number for this proceeding is (714) 560-4780. Communications to Calnev concerning
this application should be addressed to James Squeri, counsel for Calnev, at the address set forth
herein.
Exhibit D includes the most recently available financial statements for Calnev,
consisting of balance sheet and income statement information submitted in conjunction with
Calnev’s individual, 2012 FERC Form 6 filings.
Exhibit E is notice of the proposed rate increase provided by Calnev to its
shippers as well as a list of the tariff subscribers to whom the notice was sent.
VI. INFORMATION REQUIRED FOR RULE 2.1(c) and RULE 7 COMPLIANCE
The subject application seeks authorization, pursuant to Section 454 of the Public
Utilities Code, for Calnev to increase the rates it charges for intrastate public utility pipeline
services by $846,000.

10
1. Proposed Category: Calnev proposes that the application be treated as a
“ratesetting” proceeding.
2. Need for Hearing: Given the per se reasonableness of the requested rate
increase of $846,000, Calnev does not believe that there are any disputed factual issues that
would otherwise require a hearing.
3. Issues Requiring Consideration: The sole issue raised by this
application is whether Calnev’s proposal to increase its rates by $846,000 is reasonable.
4. Proposed Schedule: Calnev proposes the following schedule:
Application Filed July 19, 2013
Notice in Daily Calendar TBD by CPUC Docket Office
Protests Due 30 Days After Daily Calendar Notice
ALJ Draft Decision November, 2013
Commission Decision January, 2014
VII. EXHIBITS
As required by Commission Rules 15, 16, and 23, Calnev provides the following
information and exhibits:
Exhibit A Analyses of Calnev’s Achieved Return
Exhibit B
Exhibit C
Declaration of Erik G. Wetmore
Calnev Proposed Tariffs
Exhibit D Calnev Financial Statements
Exhibit E Form of Shipper Notice
VIII. CONCLUSION
WHEREFORE, Calnev requests:
1. That the Commission issue an opinion and order approving the requested

11
increase in Calnev’s intrastate tariff rates as quickly as is practicable; and
2. That the Commission grant such other and further relief as shall be just
and proper.
Respectfully submitted this 19th day of July, 2013 at San Francisco, California.
GOODIN, MACBRIDE, SQUERI, DAY & LAMPREY, LLP James D. Squeri 505 Sansome Street, Suite 900 San Francisco, CA 94111 Telephone: (415) 392-7900 Facsimile: (415) 398-4321 E-mail: [email protected]
By /s/ James D. Squeri James D. Squeri
Attorneys for Calnev Pipe Line LLC
2539/001/X153683.v1

VERIFICATION OF COUNSEL
I, James D. Squeri, declare:
I am an attorney at law duly admitted and licensed to practice before all
courts of this State and I have my professional office at Goodin, MacBride, Squeri, Day
& Lamprey, LLC, 505 Sansome Street, Suite 900, San Francisco, California 94111.
I am an attorney for Applicant, Calnev Pipe Line LLC, in the above-
entitled matter.
No officer of Calnev Pipe Line LLC. is present in the county in which I
have my office and for that reason I am making this verification on behalf of Calnev Pipe
Line LLC.
I have read the foregoing Application and know the contents thereof.
I am informed and believe that the matters stated therein are true and, on
that ground, I allege that the matters stated therein are true.
I declare under penalty of perjury under the laws of the State of California
that the foregoing is true and correct.
Executed at San Francisco, California on this 19th day of July, 2013.
/s/ James D. Squeri James D. Squeri

EXHIBIT A
Analyses of Calnev’s Achieved Return

Attachment APage 1
Calnev Pipe Line LLCCPUC-Jurisdictional Cost of ServiceFor the 2013 Test Year($000's)
LineNo. Description Amount
1 Total Rate Base $6,9702 Weighted Cost of Capital 9.02%3 Total Return on Rate Base $628
4 Income Tax Allowance -
5 Operating Expenses $3,8086 Depreciation Expense $3347 Amortization of AFUDC $68 Total Operating Expenses $4,148
9 Total Cost of Service $4,776
10 Test Year Revenue at Current Rates $2,172
11 Revenue Deficiency - Before Proposed Tariff Change ($2,604)
12 Test Year Revenue at Proposed Rates $3,018
13 Revenue Deficiency - After Proposed Tariff Change ($1,759)
Cost of Capital Components14 Equity Capital Percentage 50.92%15 Debt Capital Percentage 49.08%16 Cost of Debt 5.40%17 Equity Rate of Return (Nominal) 12.50%
Attachment APage 2
Calnev Pipe Line LLCCPUC-Jurisdictional Achieved ReturnFor the 2013 Test Year($000's)
LineNo. Amount
1 Test Year Revenue at Proposed Rates $3,018
2 Operating Expenses $3,8083 Depreciation & Amortization $3404 Total Expenses $4,148
5 Income Tax Expense -6 Achieved Return ($1,130)7 Imputed Interest $1858 Net Return ($1,315)
9 Total Net Rate Base $6,97010 Equity Capital Percentage 50.92%11 Equity Portion of Rate Base $3,549
12 Overall Achieved Return -16.22%13 Achieved Return on Equity -37.06%

Attachment APage 3
Calnev Pipe Line LLCCPUC-Jurisdictional Original Cost Rate BaseFor the 2013 Test Year($000's)
LineNo. Description Amount
1 Carrier Property in Service $11,3492 AFUDC $4103 Subtotal $11,759
4 Accrued Depreciation ($4,582)5 Accumulated Amortization of AFUDC ($215)6 Subtotal ($4,797)
7 Net Book Plant $6,962
8 Working Capital $89 Accumulated Deferred Income Taxes $0
10 Original Cost Rate Base $6,970

Attachment APage 4
Calnev Pipe Line LLCSummary of California Intrastate Operating Expenses, by FERC AccountFor the 2013 Test Year($000's)
LineNo. Amount
OPERATIONS AND MAINTENANCE1 300 Salaries and Wages $7452 310 Materials and Supplies $1863 320 Outside Services $6364 330 Operating Fuel and Power $4055 340 Oil Losses and Shortages $1156 350 Rentals $107 390 Other Expenses $618 Total Operations Expense $2,158
GENERAL9 500 Salaries and Wages $617
10 510 Materials and Supplies $1411 520 Outside Services $25412 530 Rentals $1313 550 Employee Benefits $47814 560 Insurance $015 580 Pipeline Taxes $22016 590 Other Expenses $5417 Total General Expense $1,65018 Total Operating Expenses $3,808
Description

EXHIBIT B
Declaration of Erik G. Wetmore

DECLARATION OF ERIK G. WETMORE
I, Erik G. Wetmore, declare as follows:
1. I am a Principal of Turner Wetmore Collins, LLC, a firm that provides consulting
services to the regulated sector of the energy transportation industry.
2. I have 24 years of professional experience, primarily in advising regulated energy
transportation companies on ratemaking, accounting, and business strategy issues. My
experience includes providing testimony in oil pipeline rate proceedings before this
Commission, the Federal Energy Regulatory Commission (“FERC”), and the Regulatory
Commission of Alaska. I have also directed project teams in rate proceedings both
before the FERC and state regulatory commissions, participated as an accounting and
ratemaking advisor in rate proceeding settlement negotiations, and advised oil pipeline
carriers and industry groups with respect to regulatory accounting requirements. I
received an M.B.A., with concentrations in Finance and Economics, from the University
of Chicago Booth School of Business, and a B.A. in Mathematics and Economics from
the University of California at Santa Barbara. I also earned a Certified Public
Accountant license in the State of California.
3. I have provided testimony on behalf of Calnev Pipe Line LLC (“Calnev”) both before
this Commission and before the FERC.
4. Calnev requested that I calculate its 2013 Test Year cost of service, and the results of the
requested analysis are set forth on Attachment A to my declaration. Attachment A
includes four pages: page 1 presents Calnev’s 2013 Test Year cost of service; page 2
presents Calnev’s 2013 Test Year achieved return; and pages 3 and 4 summarize
Calnev’s 2013 Test Year rate base and operating expenses.

5. To calculate Calnev’s 2013 Test Year cost of service, I relied on Professor James H.
Vander Weide for cost of capital input values (i.e., cost of equity, cost of debt, and capital
structure). I also relied on Peter M. Dito for 2013 Test Year volumes and revenues.
6. My declaration addresses the development of Calnev’s 2013 Test Year cost of service.
First, I describe how costs incurred at certain Calnev facilities that provide both CPUC
intrastate and FERC interstate transportation services are separated between the two
jurisdictions. Second, I describe the development of Calnev’s 2013 Test Year rate base.
Third, I describe the development of Calnev’s 2013 Test Year operating expenses.
Finally, I present Calnev’s 2013 Test Year cost of service results.
7. In developing Calnev’s 2013 Test Year cost of service, the base period data for operating
expenses is January 1, 2012 through December 31, 2012, and for all property placed into
service as of December 31, 2012.
8. To separate costs at joint-use facilities that provide both intrastate and interstate service, I
developed a “Volumetric Route Directory” using 2013 Test Year volumes developed by
Mr. Dito. The Volumetric Route Directory calculates the percentage of intrastate versus
interstate destined volumes that are transported through or offloaded at each delivery
point along the joint-use facilities. These percentages are then applied to the investment
and operating expense costs of each respective facility.
9. To develop rate base, I utilized the Depreciated Original Cost (“DOC”) rate base
methodology. Total DOC rate base consists of net book plant adjusted for an Allowance
for Funds Used During Construction (“AFUDC”) and working capital. In light of the
Commission’s determination in Decision No. 11-05-045 to deny inclusion of an income
tax allowance in the cost of service for tax pass-through entities, I have correspondingly
not adjusted Calnev’s intrastate rate base for ADIT. Calnev’s rate base is summarized on
page 3 of Attachment A.
10. To develop Calnev’s CPUC-jurisdictional net book plant, which is comprised of gross
property less accumulated depreciation, I relied on detailed data provided by Calnev
which listed total company historical gross property-related transactions through
December 31, 2012 in an electronic database format. This property data represents the
original cost of the property when initially placed in service. I applied separation and
allocation factors to these gross investment transactions to determine CPUC-
jurisdictional investment. Using Calnev’s book depreciation rates, I then calculated
accumulated depreciation and annual depreciation expense on CPUC-jurisdictional
original cost investment.
11. AFUDC compensates investors for funds expended to construct or purchase pipeline
assets before the assets are placed in service. I calculated AFUDC based upon Calnev’s
annual additions of intrastate carrier property in service, assuming capital projects are
completed and placed in service evenly throughout the year. The cumulative balance of
AFUDC is depreciated based upon a company-wide composite depreciation rate.
Additionally, I removed any capitalized interest during construction.
12. Working capital consists of investments and prepayments required to support the ongoing
operation of a pipeline. Specifically, for oil pipelines, working capital reflects the sum of
the balances for oil inventory, materials and supplies, and prepayments. I allocated
Calnev’s total company working capital amounts to its intrastate system based upon the
ratio of intrastate carrier property in service to total company property in service.

13. For financial reporting purposes, Calnev uses the accrual method of accounting mandated
by the FERC’s Uniform System of Accounts (“USofA”) and Generally Accepted
Accounting Principles (“GAAP”). Therefore, to develop 2013 Test Year operating
expenses, as shown in Attachment A (page 4), it was necessary to make certain
regulatory adjustments to Calnev’s operating expenses recorded in the base period
(January 1, 2012 through December 31, 2012).
14. Additionally, the amount of oil losses and shortages expense that Calnev incurs may vary
from year to year. Therefore, to assess the reasonableness of the amount to be included
in Calnev’s 2013 Test Year cost of service, I compared the amount of oil losses and
shortages expense incurred in 2012 to the average amount incurred for the five-year
period 2008 to 2012. This analysis showed that the amount incurred in 2012 is higher
than the average amount incurred for the five-year period 2008 through 2012. Therefore,
instead of using the amount of oil losses and shortages expense incurred in 2012, I
instead include a normalized amount based on the average amount incurred for the five-
year period 2008 to 2012.
15. I now present Calnev’s 2013 Test Year cost of service calculations and results.
Specifically, page 1 of Attachment A presents the cost of service results, while page 2
presents Calnev’s achieved return.
16. The cost of capital input values provided by Dr. Vander Weide are shown at the bottom
of page 1 of Attachment A, lines 14 through 17. Page 1, line 2 of Attachment A reflects
the weighted average cost-of-capital calculation. The cost of capital input values include
three elements: (1) cost of equity; (2) cost of debt; and (3) the percentages of debt and
equity in the capital structure. Because Calnev has no publicly traded stock or capital

structure, these elements must be estimated from data for comparable-risk publicly-traded
companies. The Company estimates the cost of equity component by applying the
Discounted Cash Flow (“DCF”) model to three groups of publicly-traded oil pipeline
companies. The weighted average cost of capital is then estimated by combining the cost
of equity for the proxy group with the average cost of debt and capital structure for the
proxy group or with the cost of debt and capital structure of Kinder Morgan Energy
Partners (“KMEP”). The cost of equity estimates use data as of the end of May 2013.
Cost of debt and capital structure data are as of the end of the first quarter 2013. The
three estimates of the weighted average cost of capital are 9.02 percent, 9.03 percent, and
9.11 percent. The Company conservatively chose to use the lowest estimate, 9.02 percent,
as the cost of capital input in its cost of service study.
17. The 9.02 percent cost of capital estimate is based on the average DCF result for a proxy
group of five publicly-traded oil pipeline companies with investment-grade bond ratings
and representative equity ratios. The 12.5 percent average DCF result for this group of
five companies combined with the 5.40 percent average cost of debt and the average
49.08 percent debt/50.92 percent equity capital structure for this group of companies
produces a weighted average cost of capital equal to 9.02 percent.
18. The 9.03 percent cost of capital estimate is based on the average DCF result for a proxy
group of seven investment-grade publicly-traded oil pipeline companies with sufficient
information to calculate a DCF result. The 13.3 percent average DCF result for this
group of seven companies combined with KMEP’s 5.94 percent cost of debt and
58.06 percent debt/41.94 percent equity capital structure produces a weighted average
cost of capital equal to 9.03 percent.


EXHIBIT C
Calnev Proposed Tariffs

Cal PUC No. 17 (Cancels Cal PUC No. 16)
CALNEV PIPE LINE LLC LOCAL PIPELINE TARIFF
CONTAININGRATES
APPLYING ON THE TRANSPORTATION OF
PETROLEUM PRODUCTS BY PIPELINE
THIS TARIFF APPLIES TO INTRASTATE TRAFFIC ONLY
Rates herein are governed by Rules and Regulations provided in Calnev Pipe Line LLC’s tariff CalPUC No. 15, Supplements thereto and reissues thereof.
NOTICE: The provisions published herein will, if effective, not result in an adverse effect on the quality of the human environment.
NOTICE: For explanation of abbreviations and reference marks, see concluding page of this tariff.
ISSUED: July 19, 2013 EFFECTIVE: Pending Cal PUC Approval (Application No. ___________) [C]
Issued By: Compiled By:
[W] Ronald G. McClain Thomas A. Bannigan, for John Reyneveld Calnev Pipe Line LLC Calnev Pipe Line LLC [W] 1001 Louisiana St. 500 Dallas, Suite 1000 1100 Town & Country Road Houston, TX 77002 Orange CA 92868
(714) 560- 4954 E-mail: [email protected]

Cal PUC No. 17
Page 2
Table of Rates
From Station On C.P.L. Via To Stations On C.P.L. At Rates In Cents Per Barrel
Colton
San Bernardino County
California Calnev Pipe Line
LLC
Terminaling Services Provided
by Carrier at Destination
No Terminaling Services Provided
by Carrier at Destination
Adelanto
San Bernardino County
California
[U] 37.02
BNSF Takeoff
San Bernardino County
California
[I] 73.15
Southern California International Airport
San Bernardino County
California
[I] 79.45
Barstow Terminal
San Bernardino County
California
[I] 80.65
Yermo
San Bernardino County
California
[I] 74.61
Exceptions to RULES AND REGULATIONS Calnev Pipe Line LLC Cal PUC No. 15, Supplements thereto and reissues thereof.
Item 40. Minimum Batch and Delivery RequirementsMinimum Batch sizes at Origin and Delivery Barrels at Destination are shown in the table below.
Origin
Colton,
San Bernardino County,
California
Destination
All Locations
Minimum Batch
5,000 Bbls
Minimum
Delivery
2,500 Bbls

Cal PUC No. 17
Page 3
EXPLANATION OF ABBREVIATIONS C.P.L. …………………………………………………………….… Calnev Pipe Line LLC
Cal PUC …………………………………………………………California Public Utilities Commission
EXPLANATION OF REFERENCE MARKS
Reference Mark Explanation
[I] Increase
[U] Unchanged rate
[W] Change in wording only
[C] Cancel
NOTES
Restricted to jet fuels.
Restricted to military jet fuels.
[C] [C] This tariff will take effect January 14, 2013, unless suspended by the Cal PUC.

EXHIBIT D
Calnev Financial Statements

Comparative Balance Sheet Statement
Name of Respondent This Report Is:(1) An Original(2) A Resubmission
Date of Report(Mo, Da, Yr)
Year/Period of Report
End ofCalnev Pipe Line LLC X / / 2012/Q4
Line No.
Item(a)
ReferencePage No.for Annual
(b)
Current Year End ofQuarter/Year Balance
(in dollars)(c)
For instructions covering this schedule, see the text and instructions pertaining to Balance Sheet Accounts in the U.S. of A. The entriesin this balance sheet should be consistent with those in the supporting schedules on the pages indicated. 1.) For instructions covering this schedule, see the text and instructions pertaining to Balance Sheet Accounts in the U.S. of A. Theentries in this balance sheet should be consistent with those in the supporting schedules on the pages indicated. 2.) On line 30, include depreciation applicable to investmentin system property.For instructions covering this schedule, see the text and instructions pertaining to Balance Sheet Accounts in the U.S. of A. The entriesin this balance sheet should be consistent with those in the supporting schedules on the pages indicated.
Prior Year EndBalance 12/31
(in dollars)(d)
CURRENT ASSETS
Cash (10) 1
Special Deposits (10-5) 2
Temporary Investments (11) 3
Notes Receivable (12) 4
8,106,379 6,510,211200Receivables from Affiliated Companies (13) 5
5,516,473 13,021,014Accounts Receivable (14) 6
( 200,000)( 199,578)Accumulated Provision For Uncollectible Accounts (14-5) 7
Interest and Dividends Receivable (15) 8
Oil Inventory (16) 9
59,486 114,086Material and Supplies (17) 10
87,634 98,367Prepayment (18) 11
Other Current Assets (19) 12
230-231Deferred Income Tax Assets (19-5) 13
13,569,972 19,544,100 TOTAL Current Assets (Total of lines 1 thru 13) 14
INVESTMENTS AND SPECIAL FUNDS
Investments in Affiliated Companies (20):
202-203 Stocks 15
202-203 Bonds 16
202-203 Other Secured Obligations 17
202-203 Unsecured Notes 18
95,177,258 12,806,114202-203 Investment Advances 19
204 Undistributed Earnings from Certain Invest. in Acct. 20 20
Other Investments (21):
Stocks 21
Bonds 22
Other Secured Obligations 23
Unsecured Notes 24
Investment Advances 25
Sinking and other funds (22) 26
95,177,258 12,806,114 TOTAL Investment and Special Funds (Total lines 15 thru 26) 27
TANGIBLE PROPERTY
340,123,279 348,035,607213 & 215Carrier Property (30) 28
Page 110FERC FORM NO. 6 (REV. 02-04)

Comparative Balance Sheet Statement (continued)
Name of Respondent This Report Is:(1) An Original(2) A Resubmission
Date of Report(Mo, Da, Yr)
Year/Period of Report
End ofCalnev Pipe Line LLC X / / 2012/Q4
Line No.
Item(a)
ReferencePage No.for Annual
(b)
Current Year End ofQuarter/Year Balance
(in dollars)(c)
For instructions covering this schedule, see the text and instructions pertaining to Balance Sheet Accounts in the U.S. of A. The entriesin this balance sheet should be consistent with those in the supporting schedules on the pages indicated. 1.) For instructions covering this schedule, see the text and instructions pertaining to Balance Sheet Accounts in the U.S. of A. Theentries in this balance sheet should be consistent with those in the supporting schedules on the pages indicated. 2.) On line 30, include depreciation applicable to investmentin system property.For instructions covering this schedule, see the text and instructions pertaining to Balance Sheet Accounts in the U.S. of A. The entriesin this balance sheet should be consistent with those in the supporting schedules on the pages indicated.
Prior Year EndBalance 12/31
(in dollars)(d)
75,397,838 83,723,441216 & 217 (Less) Accrued Depreciation-Carrier Property (31) 29
(Less) Accrued Amortization-Carrier Property (32) 30
264,725,441 264,312,166Net Carrier Property (Line 28 less 29 and 30) 31
Operating Oil Supply (33) 32
30,409,838 37,928,836220Noncarrier Property (34) 33
4,957,651 5,815,636 (Less) Accrued Depreciation-Noncarrier Property 34
25,452,187 32,113,200Net Noncarrier Property (Line 33 less 34) 35
290,177,628 296,425,366 TOTAL Tangible Property (Total of lines 31, 32, and 35) 36
OTHER ASSETS AND DEFERRED CHARGES
187,694,899 187,694,899Organization Costs and Other Intangibles (40) 37
3,548,450 3,548,450 (Less) Accrued Amortization of Intangibles (41) 38
Reserved 39
Miscellaneous Other Assets (43) 40
3,256,049 316,120221Other Deferred Charges (44) 41
230-231Accumulated Deferred Income Tax Assets (45) 42
Derivative Instrument Assets (46) 43
Derivative Instrument Assets - Hedges (47) 44
187,402,498 184,462,569 TOTAL Other Assets and Deferred Charges (37 thru 44) 45
Page 111FERC FORM NO. 6 (REV. 02-04)

Comparative Balance Sheet Statement (continued)
Name of Respondent This Report Is:(1) An Original(2) A Resubmission
Date of Report(Mo, Da, Yr)
Year/Period of Report
End ofCalnev Pipe Line LLC X / / 2012/Q4
Line No.
Item(a)
ReferencePage No.for Annual
(b)
Current Year End ofQuarter/Year Balance
(in dollars)(c)
For instructions covering this schedule, see the text and instructions pertaining to Balance Sheet Accounts in the U.S. of A. The entriesin this balance sheet should be consistent with those in the supporting schedules on the pages indicated. 1.) For instructions covering this schedule, see the text and instructions pertaining to Balance Sheet Accounts in the U.S. of A. Theentries in this balance sheet should be consistent with those in the supporting schedules on the pages indicated. 2.) On line 30, include depreciation applicable to investmentin system property.For instructions covering this schedule, see the text and instructions pertaining to Balance Sheet Accounts in the U.S. of A. The entriesin this balance sheet should be consistent with those in the supporting schedules on the pages indicated.
Prior Year EndBalance 12/31
(in dollars)(d)
586,327,356 513,238,149 TOTAL Assets (Total of lines 14, 27, 36 and 45) 46
CURRENT LIABILITIES
Notes Payable (50) 47
5,311,453 4,930,690225Payables to Affiliated Companies (51) 48
4,712,149 4,469,422Accounts Payable (52) 49
Salaries and Wages Payable (53) 50
Interest Payable (54) 51
Dividends Payable (55) 52
36,451 175,185Taxes Payable (56) 53
226-227Long-Term Debt - Payable Within One Year (57) 54
4,294,887 3,313,171Other Current Liabilities (58) 55
230-231Deferred Income Tax Liabilities (59) 56
14,354,940 12,888,468 TOTAL Current Liabilities (Total of lines 47 thru 56) 57
NONCURRENT LIABILITIES
226-227Long-Term Debt - Payable After One Year (60) 58
Unamortized Premium on Long-Term Debt (61) 59
(Less) Unamortized Discount on Long-Term Debt-Dr. (62) 60
10,661,826 12,036,301Other Noncurrent Liabilities (63) 61
230-231Accumulated Deferred Income Tax Liabilities (64) 62
Derivative Instrument Liabilities (65) 63
Derivative Instrument Liabilities - Hedges (66) 64
Asset Retirement Obligations (67) 65
10,661,826 12,036,301 TOTAL Noncurrent Liabilities (Total of lines 58 thru 65) 66
25,016,766 24,924,769 TOTAL Liabilities (Total of lines 57 and 66) 67
STOCKHOLDERS' EQUITY
2,000 2,000251Capital Stock (70) 68
Premiums on Capital Stock (71) 69
Capital Stock Subscriptions (72) 70
352,115,838 352,115,838254Additional Paid-In Capital (73) 71
118Appropriated Retained Income (74) 72
209,192,752 136,195,542119Unappropriated Retained Income (75) 73
(Less) Treasury Stock (76) 74
116Accumulated Other Comprehensive Income (77) 75
561,310,590 488,313,380 TOTAL Stockholders' Equity (Total of lines 68 thru 75) 76
586,327,356 513,238,149 TOTAL Liabilities and Stockholders' Equity (Total of lines 67 and 76) 77
Page 113FERC FORM NO. 6 (REV. 02-04)

Schedule Page: 110 Line No.: 28 Column: c Account activity reflects compliance with FERC Opinion No. 511-A issued in December of 2011
Schedule Page: 110 Line No.: 28 Column: d Account activity reflects compliance with FERC Opinion No. 511-A issued in December of 2011
Schedule Page: 110 Line No.: 33 Column: c Account activity reflects compliance with FERC Opinion No. 511-A issued in December of 2011
Schedule Page: 110 Line No.: 33 Column: d Account activity reflects compliance with FERC Opinion No. 511-A issued in December of 2011
Name of Respondent
Calnev Pipe Line LLC
This Report is:(1) X An Original(2) A Resubmission
Date of Report(Mo, Da, Yr)
/ /
Year of Report
2012/Q4
FOOTNOTE DATA
FERC FORM NO. 6 (ED. 12-91) 604.1

Income Statement
Name of Respondent This Report Is:(1) An Original(2) A Resubmission
Date of Report(Mo, Da, Yr)
Year/Period of Report
End ofCalnev Pipe Line LLC X / / 2012/Q4
Line No.
Item(a)
Reference PageNo. in Annual
Report(b)
Total current year todate Balance for
Quarter/Year(c)
1. Enter in column (c) the year to date operations for the period, and enter in column (d) the year to date operations for the same periodof the prior year.
2. Enter in column (e) the operations for the reporting quarter and enter in column (f) the operations for the same three month period forthe prior year. Do not report Annual data in columns (e) and (f)
Total prior year todate Balance for
Quarter/Year(d)
Current 3 monthsended Quarterly
only no 4th Quarter(e)
Prior 3 monthsended Quarterly
only no 4th Quarter(f)
ORDINARY ITEMS - Carrier Operating Income
58,057,802 53,179,220301Operating Revenues (600) 1
44,988,832 89,528,460302-303(Less) Operating Expenses (610) 2
13,068,970( 36,349,240) Net Carrier Operating Income 3
Other Income and Deductions
9,241,107 8,218,651335Income (Net) from Noncarrier Property (620) 4
571,296 551,263336Interest and Dividend Income (From Investment under Cost Only ) (630) 5
7,465,942 1,682,319337Miscellaneous Income (640) 6
Unusual or Infrequent Items--Credits (645) 7
(Less) Interest Expense (650) 8
203337(Less) Miscellaneous Income Charges (660) 9
(Less) Unusual or Infrequent Items--Debit (665) 10
Dividend Income (From Investments under Equity Only) 11
205 Undistributed Earnings (Losses) 12
Equity in Earnings (Losses) of Affiliated Companies (Total lines 11 and 12) 13
17,278,345 10,452,030 TOTAL Other Income and Deductions (Total lines 4 thru 10 and 13) 14
30,347,315( 25,897,210) Ordinary Income before Federal Income Taxes (Line 3 +/- 14) 15
(Less) Income Taxes on Income from Continuing Operations (670) 16
230-231(Less) Provision for Deferred Taxes (671) 17
30,347,315( 25,897,210) Income (Loss) from Continuing Operations (Total lines 15 thru 17) 18
Discontinued Operations
Income (Loss) from Operations of Discontinued Segments (675)* 19
Gain (Loss) on Disposal of Discontinued Segments (676)* 20
TOTAL Income (Loss) from Discontinued Operations (Lines 19 and 20) 21
30,347,315( 25,897,210) Income (Loss) before Extraordinary Items (Total lines 18 and 21) 22
EXTRAORDINARY ITEMS AND ACCOUNT CHANGES
337Extraordinary Items -- Net -- (Debit) Credit (680) 23
337Income Taxes on Extraordinary Items -- Debit (Credit) (695) 24
230-231Provision for Deferred Taxes -- Extraordinary Items (696) 25
TOTAL Extraordinary Items (Total lines 23 thru 25) 26
Cumulative Effect of Changes in Accounting Principles (697)* 27
TOTAL Extraordinary Items and Accounting Changes -- (Debit) Credit
(Line 26 + 27)
28
30,347,315( 25,897,210) Net Income (Loss) (Total lines 22 and 28) 29
* Less applicable income taxes as reported on page 122
FERC FORM No. 6/6-Q (REV. 02-04) Page 114

Schedule Page: 114 Line No.: 6 Column: c Account activity reflects compliance with FERC Opinion No. 511-A issued in December of 2011
Schedule Page: 114 Line No.: 6 Column: d Account activity reflects compliance with FERC Opinion No. 511-A issued in December of 2011
Name of Respondent
Calnev Pipe Line LLC
This Report is:(1) X An Original(2) A Resubmission
Date of Report(Mo, Da, Yr)
/ /
Year of Report
2012/Q4
FOOTNOTE DATA
FERC FORM NO. 6 (ED. 12-91) 604.1

EXHIBIT E
Form of Shipper Notice (plus subscriber list)

1100 Town & Country Road Orange, California 92868 714/560-4600 714/560-4601 Fax
July 19, 2013
To Calnev Pipe Line LLC’s California Intrastate Shippers and Interested Parties:
This is to inform you that on July 19, 2013, Calnev Pipe Line LLC (“Calnev”) submitted an application to the California Public Utilities Commission (“CPUC”) under Section 454 of the Public Utilities Code requesting to increase the intrastate rates it charges for transportation of refined petroleum products by pipeline. The proposed rate increase results in an expected annual revenue increase of approximately $846,000.
Section 454 authorizes oil pipeline public utilities like Calnev to increase their public utility pipeline transportation rates subject to a showing before the CPUC and a finding by the CPUC that the proposed new rates are justified. Therefore, the proposed rate increase will take effect only upon CPUC approval.
With this rate increase, Calnev will continue to realize a negative return on equity rate base and will continue to underearn any reasonably derived cost of service. The effective rates, proposed rates and percent increase for each movement as submitted in the application are as follows:
Origin Destination Existing Rates (effective 1/14/13) Proposed Rate Percent Increase
Colton Adelanto $0.3702 $0.3702 00.00% Colton BNSF $0.4815 $0.7315 51.92% Colton SCIA $0.5445 $0.7945 45.91% Colton Barstow $0.5565 $0.8065 44.92% Colton Yermo $0.4961 $0.7461 50.39%
Any protests related to the proposed rate increase should be directed to:
California Public Utilities Commission Energy Branch
505 Van Ness Avenue San Francisco, CA 94102
The filing is available on the Kinder Morgan Website (www.kindermorgan.com), under Products Pipelines, Pacific Operations, Calnev, Tariffs. Please direct any questions you may have concerning this filing, including requests for copies of the referenced application, to the undersigned at [email protected].
Peter M. Dito Director, Economics and Regulatory Analysis
cc: Gregory S. Reisinger California Public Utilities Commission 505 Van Ness Avenue San Francisco, CA 94102

Cal
nev
Pip
e Li
ne L
LCC
PU
C A
pplic
atio
n fil
ed J
uly
19, 2
013
List
of T
ariff
Sub
scrib
ers
CO
MP
AN
Y_N
AM
EF
IRS
T_N
AM
ELA
ST
_NA
ME
AD
DR
ES
S_L
INE
_1A
DD
RE
SS
_LIN
E_2
CIT
YS
TA
TE
ZIP
_CO
DE
EM
AIL
Ven
able
LLP
Ste
ven
A.
Add
ucci
575
7th
St.
NW
Was
hing
ton
DC
2000
4sa
addu
cci@
vena
ble.
com
PD
S E
nerg
y In
form
atio
nT
ariff
Ana
lyst
P.O
. Box
160
6A
ustin
TX
7876
7ta
riffs
@pd
sene
rgy.
com
Tes
oro
Ref
inin
g A
nd M
arke
ting
Co.
Den
nis
Bak
2350
E. 2
23rd
C
arso
nC
A90
810
Den
nis.
C.B
ak@
tsoc
orp.
com
SC
Fue
lsM
ayra
Bej
aran
o18
00 W
. Kat
ella
Ave
Sui
te 4
00O
rang
eC
A92
867
beja
rano
m@
scfu
els.
com
She
ll P
ipel
ine
Com
pany
LP
Jole
ttaB
enne
ttP
.O. B
ox 2
648
Rm
. 145
3 T
SP
Hou
ston
TX
7725
2Jo
letta
.Ben
nett@
She
ll.co
mR
ebel
Oil
Co.
, Inc
.G
regg
Ben
son
2200
S. H
ighl
and
Dr.
Las
Veg
asN
V89
102
greg
gb@
rebe
loil.
com
Cos
mo
Oil
of U
SA
Dan
Bur
ns21
250
Haw
thor
ne B
lvd.
Ste
550
Tor
ranc
eC
A90
503
dbur
ns@
cosm
ooilu
sa.c
omP
hilli
ps 6
6D
onna
Bye
rs60
0 N
. Dai
ry A
shfo
rdH
U 2
020B
Hou
ston
TX
7707
9C
omm
erci
alP
ricin
g@p6
6.co
mE
nerg
y A
naly
sis
Inte
rnat
iona
lT
ariff
Coo
rdin
ator
1200
0 N
. Pec
osS
te. 3
10W
estm
inst
erC
O80
234
tarif
fs@
eaiw
eb.c
omG
olds
tein
& A
ssoc
iate
sM
atth
ew A
.C
orco
ran
1757
P. S
tree
t N.W
.W
ashi
ngto
nD
C20
036
mco
rcor
an@
gold
stei
n-la
w.c
omD
orse
y &
Whi
tney
LLP
Dia
ne B
.C
vitk
o18
01 C
onne
ctic
ut A
ve. N
WS
uite
750
Was
hing
ton
DC
2000
6cv
itko.
dian
e@do
rsey
.com
Con
ocoP
hilli
psT
imot
hyD
avis
on60
0 N
. Dai
ry A
shfo
rdC
H 3
080
Hou
ston
TX
7707
9tim
othy
.r.d
avis
on@
cono
coph
illip
s.co
mC
hevr
on P
rodu
cts
Om
pany
R. H
ardi
ngE
rwin
, Jr.
1400
Sm
ith S
tree
tR
oom
716
4H
oust
onT
X77
002
herw
in@
chev
ron.
com
Uni
on P
acifi
c R
ailro
adJe
ffG
lasg
ow14
00 D
ougl
as S
t.S
top
0780
Om
aha
NE
6817
9jw
glas
go@
up.c
omG
olds
tein
& A
ssoc
iate
sM
elvi
nG
olds
tein
1757
P. S
tree
t N.W
.W
ashi
ngto
nD
C20
036
mgo
ldst
ein@
gold
stei
n-la
w.c
omC
L T
hom
as, I
nc.
Jenn
ifer
Has
dorf
f71
5 W
est B
onan
zaLa
s V
egas
NV
8910
6tp
supp
ly@
clth
omas
.com
Ent
erpr
ise
Pro
duct
sA
ndre
wH
ill11
00 L
ouis
iana
Str
eet
Sui
te 1
000
Hou
ston
TX
7700
2ta
riffs
@ep
rod.
com
Koc
h P
ipel
ine
Com
pany
Mik
eH
oove
r41
11 E
37t
h S
t NW
ichi
taK
S67
201
mik
e.ho
over
@ko
chpi
pelin
e.co
mA
llied
Was
hoe
Sco
ttIn
man
P.O
. Box
693
0R
eno
NV
8951
3S
cott@
Alli
edw
asho
e.co
mD
orse
y &
Whi
tney
LLP
Fre
deric
k G
.Ja
uss,
IV18
01 C
onne
ctic
ut A
ve. N
WS
uite
750
Was
hing
ton
DC
2000
6ja
uss.
fred
@do
rsey
.com
Pro
Pet
role
um, I
nc.
Mat
tJo
hnso
nP
.O. B
ox 6
761
Pho
enix
AZ
8500
9m
attj@
prop
etro
leum
.com
Leon
ard
B. L
evin
e &
Ass
ocia
tes
Len
Levi
neP
.O. B
ox 3
730
Was
hing
ton
DC
2002
7le
n.le
vine
@le
nson
was
hing
ton.
com
Val
ero
Mar
ketin
g &
Sup
ply
Co.
Wen
dyM
atth
ys24
02 E
. Ana
heim
Wilm
ingt
onC
A90
744
Wen
dy.M
atth
ys@
vale
ro.c
omS
hell
Oil
Pro
duct
s U
S S
uppl
yJe
nnife
rM
cCan
n90
9 F
anni
n S
t.S
te 7
7250
Hou
ston
TX
7701
0je
nnife
r.M
cCan
n@sh
ell.c
omS
hell
Avi
atio
n U
SA
War
ren
Mey
erP
.O. B
ox 2
105
Hou
ston
TX
7725
2w
arre
n.m
eyer
@sh
ell.c
omC
onoc
oPhi
llips
Mar
yM
iller
600
N. D
airy
Ash
ford
Hou
ston
TX
7707
9M
ary.
G.M
iller
@co
noco
phill
ip.c
omS
C F
uels
Mar
ieM
orga
n18
00 W
. Kat
ella
Ave
Sui
te 4
00O
rang
eC
A92
863
mor
ganm
@sc
fuel
s.co
mE
nter
pris
e P
rodu
cts
Ste
veM
oses
1100
Lou
isia
na S
tree
tH
oust
onT
X77
002
Sm
oses
@ep
rod.
com
Hus
ch B
lack
wel
l LLP
Elis
abet
h R
.M
yers
750
17th
St.
NW
Ste
. 100
0W
ashi
ngto
nD
C20
006
elis
abet
h.m
yers
@hu
schb
lack
wel
l.com
Che
vron
Glo
bal S
uppl
y an
d T
radi
ngN
ancy
Phi
llips
1500
Lou
isia
na S
t.H
oust
onT
X77
002
pipe
updt
@ch
evro
n.co
mV
enab
le L
LPR
icha
rd E
.P
ower
s, J
r.57
5 7t
h S
t. N
WW
ashi
ngto
nD
C20
004
repo
wer
s@ve
nabl
e.co
mB
urlin
gton
No.
& S
anta
Fe
Rai
lway
Co.
Kris
tiR
adfo
rd26
00 L
ou M
enk
Dr.
OO
B-2
For
t Wor
thT
X76
131
Kris
ti.R
adfo
rd@
bnsf
.com
CL
Tho
mas
, Inc
John
Sax
on71
5 W
est B
onan
zaLa
s V
egas
NV
8910
6js
axon
@C
LTho
mas
.com
Val
ero
Mar
ketin
g &
Sup
ply
Co.
And
rea
Sim
pson
2402
E. A
nahe
imW
ilmin
gton
CA
9074
4an
drea
.sim
pson
@va
lero
.com
Dor
sey
& W
hitn
ey L
LPM
arcu
s W
.S
isk,
Jr.
1801
Con
nect
icut
Ave
. NW
Sui
te 7
50W
ashi
ngto
nD
C20
006
sisk
.mar
cus@
dors
ey.c
omT
esor
o R
efin
ing
And
Mar
ketin
g C
o.V
icto
riaS
omer
s19
100
Rid
gew
ood
Par
kway
San
Ant
onio
TX
7825
9V
icto
ria.R
.Som
ers@
tsoc
orp.
com
Goo
din,
Mac
Brid
e, S
quer
i, R
itchi
e &
Day
, Jam
esS
quer
i50
5 S
anso
me
St.
Ste
. 900
San
Fra
ncis
coC
A94
111
jsqu
eri@
GM
SS
R.c
omE
xxon
Mob
il O
il C
orpo
ratio
nR
ayS
tew
ert
3700
W. 1
90th
St.
Tor
ranc
eC
A90
509
ray.
a.st
ewer
t@ex
xonm
obil.
com
Tre
jo O
il C
ompa
nyS
teve
Str
ong
2096
Don
ner
Dr.
Lake
Hav
asu
City
AZ
8640
6S
teve
@S
teve
Str
ong.
org
US
Airw
ays,
Inc.
Sco
ttT
ram
pus
Pitt
sbur
gh In
t'l A
irpor
tP
.O. B
ox 1
2346
PIT
-OS
B-F
UE
LP
ittsb
urgh
PA
1523
1tr
ampu
s@us
airw
ays.
com
Tes
oro
Ref
inin
g A
nd M
arke
ting
Co.
John
Tso
uval
as23
50 E
. 223
rd
Car
son
CA
9081
0Jo
hn.T
souv
alas
@ts
ocor
p.co
mT
ower
Ene
rgy
Gro
upM
ark
Vas
ey19
83 W
. 190
th S
tT
orra
nce
CA
9050
4op
erat
ions
@to
wer
ener
gy.c
omB
P P
ipel
ines
Den
nyV
icen
te28
100
Tor
ch P
kwy.
War
renv
ille
IL60
555
Den
ny.V
icen
te@
bp.c
omW
eber
& A
ssoc
iate
s, P
.C.
Geo
rge
L.W
eber
1629
K. S
tree
t, N
WS
uite
300
Was
hing
ton
DC
2003
6gl
web
er44
@ao
l.com
Val
ero
Ene
rgy
Cor
pK
athy
Wrig
htP
.O. B
ox 6
9600
0S
an A
nton
ioT
X78
269
Kat
hy.W
right
@va
lero
.com
Tes
oro
Com
pani
es In
c.P
ricin
g -
Mas
ter
Dat
a U
nit
1910
0 R
idge
woo
d P
arkw
ayT
X1-
091
San
Ant
onio
TX
7825
9pr
icin
gmas
terd
ata@
tsoc
orp.
com
AirB
PJu
stin
Col
ley
150
W W
arre
nvill
e R
oad
Bld
g 20
0N
aper
ville
IL60
563
Just
in.C
olle
y@bp
.com
Tes
oro
Ref
inin
g A
nd M
arke
ting
Co.
Ana
hiC
ovar
rubi
as19
100
Rid
gew
ood
Par
kway
TX
1-09
1S
an A
nton
ioT
X78
259
Ana
hi.G
.Cov
arru
bias
@ts
ocor
p.co
mV
aler
oC
arol
Kas
prza
kO
ne V
aler
o W
ayS
an A
nton
ioT
X78
249
caro
l.kas
prza
k@va
lero
.com