Embed Size (px)
Citation preview

18-06-2018
Master thesis Business Administration
University of Twente
School of Behavioural, Management and Social sciences
Chair of Technology Management
Becoming the preferred customer
The influence of buyer and supplier importance
Marnix M. Jansen, BSc
s1250981
Contact e-mail: [email protected]
1st
Supervisor: Dr. Frederik G.S. Vos
2nd
Supervisor: Prof. Dr. Habil. Holger Schiele
3rd
Supervisor: Aldis G. Sigurdardottir, PhD
Number of pages/words: 90/24.354
Bibliography programme used: EndNote X8.2

2
Acknowledgements After years of hard working, blood, sweat, and tears, this master thesis marks the end of an
era. The past period I have been researching the effects of buyer and supplier importance on
becoming and maintaining the preferred customer. This thesis is the final part of my
graduation from the Master Business Administration, track Purchasing and Supply
Management at the University of Twente. The previous period was not easy, luckily a few
people helped me and deserve some extra words of acknowledgement.
At the beginning of my master, I went to professor emeritus Jan Telgen with an empty piece
of paper to get a head start in the process of writing a master thesis. With his help I found the
first company to perform my research.
After finding the company for analysis, it became clear that I needed a supervisor who was an
expert in private procurement. I found this expert in the person of dr. Frederik Vos. During
the past year, we had regular meetings and discussions which finally resulted in the model
presented in this thesis. I thank him a lot for these sessions and the useful feedback he
provided.
Third, I would like to thank professor dr. habil. Holger Schiele for reviewing my thesis,
providing feedback and finally grading my process. Also, a special word of thank you for
Aldis Sigurdardottir for last-minute reviewing and grading my thesis.
Fourth, I would like to thank Elsa Adema-Zenk for performing a final check to my thesis
before submitting it.
Finally, a major word of thanks to my family and friends. Even in tough times, you supported
me. Thanks a lot!
Marnix M. Jansen
18 June 2018
3
Abstract The past decades the field of purchasing has gained more and more attention. Companies
recognise the importance of good and strategic purchasing, every euro saved on purchasing
contributes directly to a company's profit. Resources are scarce and companies compete to
obtain the best resources available, suppliers supplying those resources have the ability to
choose the buyer they prefer the most, their preferred customer. Recent studies showed the
importance of becoming and maintaining the preferred customer of certain suppliers. Those
studies were focussed on the antecedents of supplier satisfaction in relation to becoming the
preferred customer. This research uses a different approach and focuses on the effect of
supplier and buyer importance on becoming the preferred customer. The quantitative data for
analyses is gathered via a survey among the suppliers of two different Dutch companies. The
149 useful responses are analysed using PLS-SEM. The results showed that supplier
importance resulted in buying firms putting a bit more effort in the buyer-supplier
relationship, resulting in a higher level of perceived reliability by the supplier. Buyer
importance on the other hand turned out to be the main cause for becoming the preferred
customer, stronger than supplier satisfaction.
Keywords: preferred customer status; supplier satisfaction; preferential treatment; supplier
importance; buyer importance
4
Table of contents
Acknowledgements .................................................................................................................... 2
Abstract ...................................................................................................................................... 3
List of tables ............................................................................................................................... 6
List of figures ............................................................................................................................. 6
1. Purchasing as a source of competitive advantage for a company .......................................... 7
2. Theory .................................................................................................................................. 11
2.1 Satisfying suppliers is crucial for a good relationship and in receiving the preferred
customer status ..................................................................................................................... 11
2.2 Being the preferred customer of crucial suppliers could result in competitive advantage.
.............................................................................................................................................. 14
2.3 Being the preferred customer of a supplier could result in a preferential treatment over
other buyers .......................................................................................................................... 18
2.4 The type of commodity a supplier supplies has an influence on the buyer-supplier
relationship ........................................................................................................................... 24
2.4.1 The vision of the supplier is crucial in the buyer-supplier relationship ................... 30
2.5 Medium-sized companies have different buyer-supplier relationships .......................... 33
3. Hypotheses ........................................................................................................................... 35
4. Methods ................................................................................................................................ 40
4.1 Collecting quantitative data suitable for statistical analysis ........................................... 40
4.2 PLS as the silver bullet for path analysis ........................................................................ 43
5. Results .................................................................................................................................. 46
5.1 Data structure quality assessment and model validity and reliability ............................ 46
5.2 Reproducing Vos et al. (2016) ........................................................................................ 49
5.3 Supplier importance has a positive effect on reliability and relational behaviour ......... 52
5.4 Buyer importance has a direct influence on becoming the preferred customer ............. 56
6. Discussion, conclusions and implications for future research ............................................. 61
6.1 Discussion ....................................................................................................................... 61

5
6.2 Conclusions .................................................................................................................... 64
6.3 Limitations and implications for future research ............................................................ 65
7. References ............................................................................................................................ 66
Appendix .................................................................................................................................. 76
Appendix A ........................................................................................................................... 76
Appendix B ........................................................................................................................... 79
Appendix C ........................................................................................................................... 80
Appendix D ........................................................................................................................... 82
Appendix E ........................................................................................................................... 84
Appendix F ........................................................................................................................... 86
Appendix G ........................................................................................................................... 87
Appendix H ........................................................................................................................... 88
Appendix I ............................................................................................................................ 89

6
List of tables
Table 1: Portfolio models, derived from Olsen and Ellram (1997a).........................................25
Table 2: Length of the buyer-supplier relationship...................................................................41
Table 3: Average value of the buyer-supplier relationships in 2017........................................42
Table 4: Differences in product complexity of the products supplied......................................42
Table 5: Composite reliability measures...................................................................................47
Table 6: HTMT values for validity analysis.............................................................................48
List of figures
Figure 1: The preferred customer pyramid...............................................................................15
Figure 2: Becoming and maintaining the preferred customer...................................................17
Figure 3: Conceptual model presented by Vos et al. (2016).....................................................19
Figure 4: Revised model by Vos et al. (2016)..........................................................................20
Figure 5: Kraljic Matrix............................................................................................................27
Figure 6: The Dutch Windmill..................................................................................................31
Figure 7: Conceptual research model........................................................................................36
Figure 8: The revised model of Vos et al. (2016).....................................................................49
Figure 9: The reproduced model of Vos et al. (2016)...............................................................50
Figure 10: The relation between supplier importance, and relational behaviour/operative
excellence..................................................................................................................................53
Figure 11: The relation between supplier importance and support, involvement, reliability
and, contact accessibility...........................................................................................................54
Figure 12: The adjusted relations between supplier importance, reliability and, relational
behaviour...................................................................................................................................55
Figure 13: The influence of buyer importance on becoming the preferred
customer....................................................................................................................................57
Figure 14: Separately testing the effects of profitability and customer attractiveness.............58
Figure 15: Testing the effect of growth opportunity on buyer importance...............................59
7
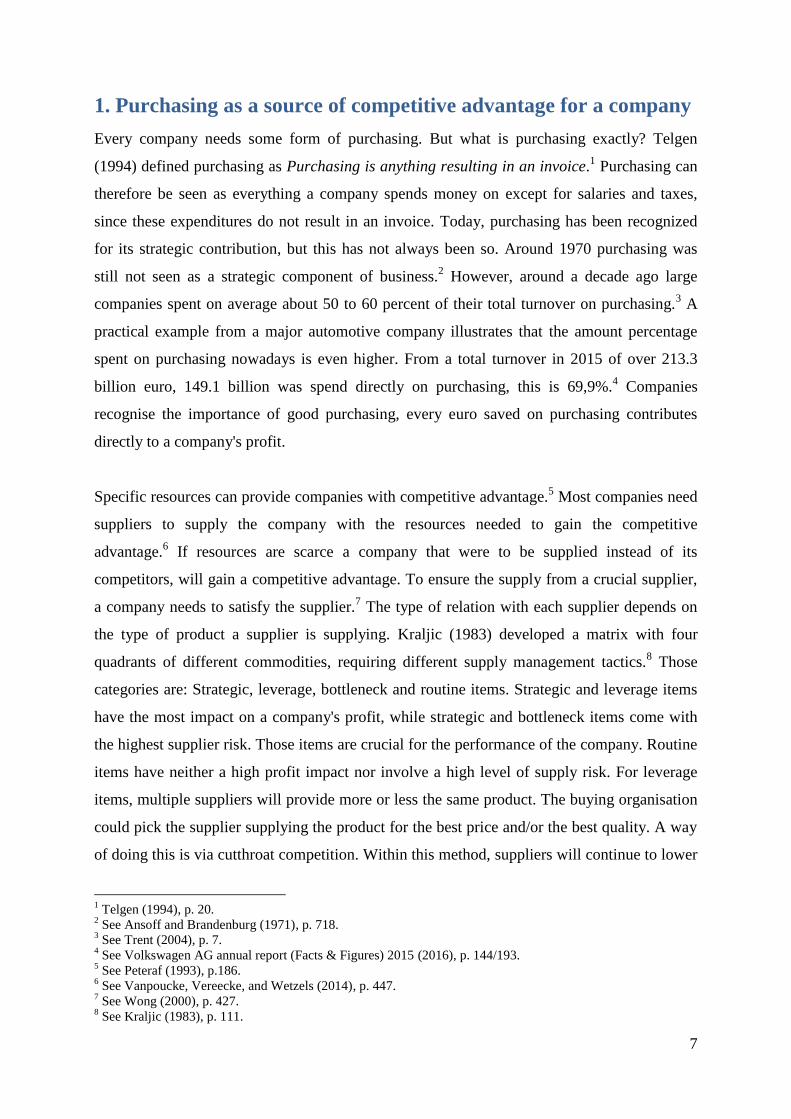
1. Purchasing as a source of competitive advantage for a company
Every company needs some form of purchasing. But what is purchasing exactly? Telgen
(1994) defined purchasing as Purchasing is anything resulting in an invoice.1 Purchasing can
therefore be seen as everything a company spends money on except for salaries and taxes,
since these expenditures do not result in an invoice. Today, purchasing has been recognized
for its strategic contribution, but this has not always been so. Around 1970 purchasing was
still not seen as a strategic component of business.2 However, around a decade ago large
companies spent on average about 50 to 60 percent of their total turnover on purchasing.3 A
practical example from a major automotive company illustrates that the amount percentage
spent on purchasing nowadays is even higher. From a total turnover in 2015 of over 213.3
billion euro, 149.1 billion was spend directly on purchasing, this is 69,9%.4 Companies
recognise the importance of good purchasing, every euro saved on purchasing contributes
directly to a company's profit.
Specific resources can provide companies with competitive advantage.5 Most companies need
suppliers to supply the company with the resources needed to gain the competitive
advantage.6 If resources are scarce a company that were to be supplied instead of its
competitors, will gain a competitive advantage. To ensure the supply from a crucial supplier,
a company needs to satisfy the supplier.7 The type of relation with each supplier depends on
the type of product a supplier is supplying. Kraljic (1983) developed a matrix with four
quadrants of different commodities, requiring different supply management tactics.8 Those
categories are: Strategic, leverage, bottleneck and routine items. Strategic and leverage items
have the most impact on a company's profit, while strategic and bottleneck items come with
the highest supplier risk. Those items are crucial for the performance of the company. Routine
items have neither a high profit impact nor involve a high level of supply risk. For leverage
items, multiple suppliers will provide more or less the same product. The buying organisation
could pick the supplier supplying the product for the best price and/or the best quality. A way
of doing this is via cutthroat competition. Within this method, suppliers will continue to lower
1 Telgen (1994), p. 20.
2 See Ansoff and Brandenburg (1971), p. 718.
3 See Trent (2004), p. 7.
4 See Volkswagen AG annual report (Facts & Figures) 2015 (2016), p. 144/193.
5 See Peteraf (1993), p.186.
6 See Vanpoucke, Vereecke, and Wetzels (2014), p. 447.
7 See Wong (2000), p. 427.
8 See Kraljic (1983), p. 111.

8
their bid, until only one supplier survives.9 This way of supply management is not
recommended for items in the strategic and bottleneck quadrant. For these commodities
usually one or maybe a few suppliers are available. Negotiating the hard way via cutthroat
will cause suppliers to drop out and leaving the company without the necessary commodity.
Better is to establish a good relationship with a supplier. For a good relationship, supplier
satisfaction is essential.10
The past few years some research has been done towards the
antecedents and effects of supplier satisfaction.1112
According to the model of Vos et al. (2016), supplier satisfaction can lead to the preferred
customer status, which again can lead to a preferential treatment. If a company is the preferred
customer of a supplier, the supplier shall do its best to keep that company as a customer by
supplying its best products, with the best employees and probably for the best price. This
could, in the end, lead to competitive advantage for the company. Hüttinger et al. (2014)
found three significant antecedents for supplier satisfaction: Growth opportunity, reliability
and relational behaviour.13
Vos et al. (2016) extended this research and found eight significant
relational aspects causing supplier satisfaction.14
The purpose of this research is to combine
the model of Vos et al. (2016) with the model of Kraljic (1983) to find significant differences
in the buyer-supplier relationship in terms of the type of supplier.
Almost 35 years ago, Kraljic (1983) pointed out that different commodities require different
strategies of supply management. Vos et al. (2016) already made a distinction between direct
and indirect procurement in their research for supplier satisfaction, becoming the preferred
customer and receiving a preferential treatment.15
Direct procurement includes all materials
needed for the production of a company, while indirect procurement includes everything that
a company needs to ensure everyday business, but not directly related to the production
process.16
However, Kraljic (1983) suggested that the way suppliers are managed depends on
the type of commodity the supplier is supplying. Bottleneck and strategic commodities require
a stronger relationship than leverage and routine commodities. A strong relationship will
9 See Telser (1966) , p. 264.
10 See Vos, Schiele, and Hüttinger (2016), p. 4613.
11 See Hüttinger, Schiele, and Schröer (2014)
12 See Vos et al. (2016)
13 See Hüttinger et al. (2014), p. 711.
14 See Vos et al. (2016), p. 4620.
15 See Vos et al. (2016), p. 4614.
16 See Chopra and Meindl (2007); Cited by Vos et al. (2016), p. 4614.
9
cause a supplier to be more satisfied.17
The ideas from Kraljic (1983) differ from the
statement made by Vos et al (2016), since direct procurement could consists of leverage,
strategic, bottleneck and maybe even routine products, as well as for indirect procurement.
Therefore, this research will search for differences in supplier relationship in terms of the type
commodities they are supplying.
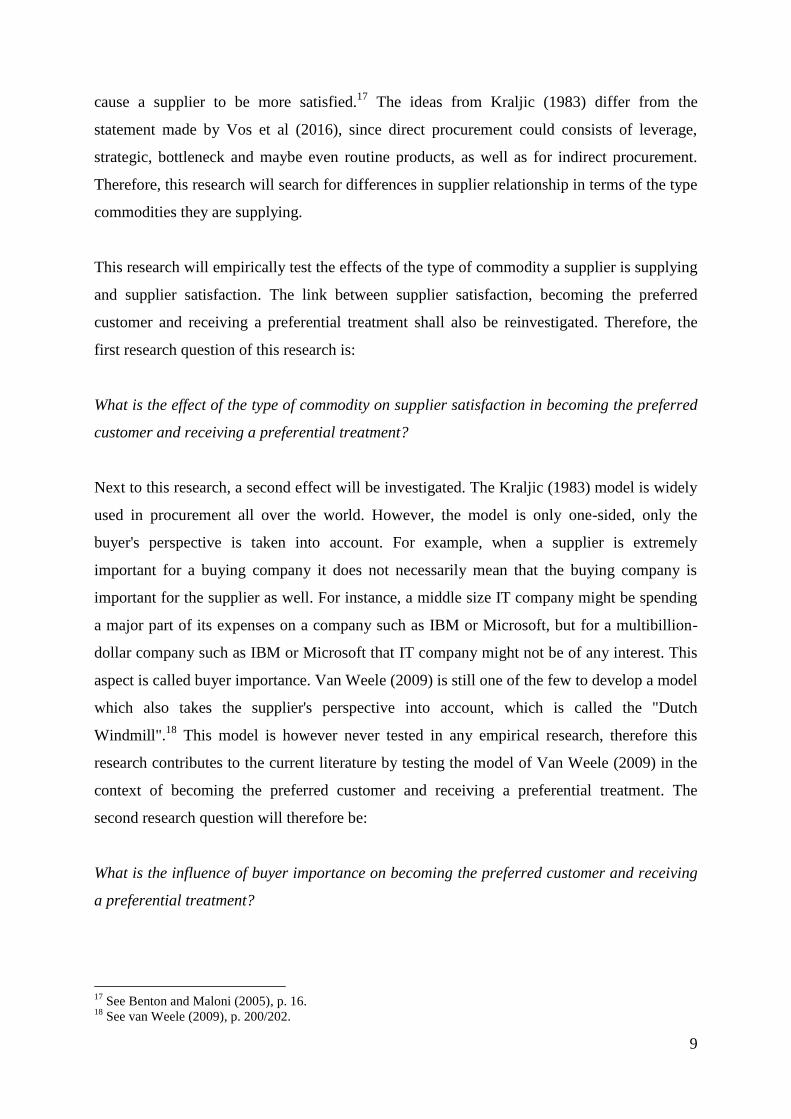
This research will empirically test the effects of the type of commodity a supplier is supplying
and supplier satisfaction. The link between supplier satisfaction, becoming the preferred
customer and receiving a preferential treatment shall also be reinvestigated. Therefore, the
first research question of this research is:
What is the effect of the type of commodity on supplier satisfaction in becoming the preferred
customer and receiving a preferential treatment?
Next to this research, a second effect will be investigated. The Kraljic (1983) model is widely
used in procurement all over the world. However, the model is only one-sided, only the
buyer's perspective is taken into account. For example, when a supplier is extremely
important for a buying company it does not necessarily mean that the buying company is
important for the supplier as well. For instance, a middle size IT company might be spending
a major part of its expenses on a company such as IBM or Microsoft, but for a multibillion-
dollar company such as IBM or Microsoft that IT company might not be of any interest. This
aspect is called buyer importance. Van Weele (2009) is still one of the few to develop a model
which also takes the supplier's perspective into account, which is called the "Dutch
Windmill".18
This model is however never tested in any empirical research, therefore this
research contributes to the current literature by testing the model of Van Weele (2009) in the
context of becoming the preferred customer and receiving a preferential treatment. The
second research question will therefore be:
What is the influence of buyer importance on becoming the preferred customer and receiving
a preferential treatment?
17
See Benton and Maloni (2005), p. 16. 18
See van Weele (2009), p. 200/202.
10
The outcomes of this research, are a relevant addition to the current literature and for
managers in practice. Most of all, because this research extends the research of Vos et al.
(2016). This research will be the link between the theory of Kraljic (1983) and the theories on
supplier satisfaction in relation to becoming the preferred customer and receiving a
preferential treatment. Vos et al. (2016) made a distinction between different types of
procurement (direct and indirect) but did not link this to the four types developed by Kraljic
(1983), while Kraljic (1983) explicitly stated that the four types he distinguished will ask for a
different type of supplier management.19
Also, this research contributes by empirically testing
the model of Van Weele (2009) and linking it to becoming the preferred customer and
receiving a preferential treatment.
In the following section, the theoretic concepts and background relevant for this research will
be explained.
19
See Kraljic (1983), p. 112.

11
2. Theory
2.1 Satisfying suppliers is crucial for a good relationship and in receiving
the preferred customer status
As mentioned in the previous chapter, a good relationship with a supplier can be crucial for a
firm's performance. Company A can gain competitive advantage to company B if they can
obtain the required resources from the supplier and company B cannot. Suppliers can also
help companies with parts of their new product development.20
As mentioned in the
introduction, a satisfied supplier could award a buyer with the preferred customer status,
resulting in a preferential treatment. But what is supplier satisfaction exactly? To fully
understand the concept of supplier satisfaction, a proper definition of this concept is needed.
Essig and Amann (2009) defined supplier satisfaction as "a supplier’s feeling of fairness with
regard to buyer’s incentives and supplier’s contributions within an industrial buyer–seller
relationship as relates to the supplier’s need fulfilment".21
Another definition was used by
Benton and Maloni (2005), they said that supplier satisfaction is "a feeling of equity with the
supply chain relationship no matter what power imbalances exists between the buyer–seller
dyad".22
Although these definitions seem quite different, they are more or less about the same
thing, the feeling of the supplier towards the relationship with the buyer. Supplier satisfaction
in the buyer-supplier relationship can be influenced by many different aspects. This chapter
further explores the current theories about the concepts of supplier satisfaction and preferred
customer. First the history in supplier satisfaction and preferred customer research will be
addressed. Second the current theories which are the base for this research are further
elaborated on. Finally the framework for this research is drawn.
The concept of taking the feeling of the supplier into account is widely accepted in the current
literature, but this has not always been the case. In 1962 Sprowls and Asimow stated that
dissatisfaction with a current supplier determines the need for a search of alternative
suppliers.23
But when a supplier is supplying a scarce resource, a company is usually not able
to switch to another supplier. Buyers are often largely dependent on certain suppliers to obtain
resources and to gain competitive advantage.24
It took decades before the importance of a
20
See Johnsen (2009), p. 187. 21
Essig and Amann (2009), p. 104. 22
Benton and Maloni (2005), p. 2. 23
See Sprowls and Asimow (1962), p. 321. 24
See Chen, Paulraj, and Lado (2004), cited by: Bemelmans, Voordijk, Vos, and Dewulf (2015), p. 179.

12
mutual good relationship was recognised. In 1990, Anderson and Narus wrote that in
partnerships the success of each firm depends in part on the other firm, which can be seen as
an early form of supplier satisfaction.25
Wong (2000) was the first to explore the concept of supplier satisfaction.26
He stated: "When
suppliers’ needs are satisfied, suppliers will be more willing to help companies meet the
needs of their customers. Thus, companies need to integrate supplier satisfaction with
customer satisfaction in order to achieve business excellence".27
This statement triggered a
major switch in the current research in the field of buyer-supplier relationships. Since his
paper more and more researchers performed research focussed on the supplier perspective
instead of solely the buyer perspective. As an example of this, also in 2000, the first empirical
research towards supplier satisfaction was performed.
Forker and Stannack (2000) found that the establishment of inter organisational relationships
would be more effective if the parties involved (buyers and suppliers) sense that the value
they provide is compensated with the equal value received.28
A few years later, in 2005,
Benton and Maloni performed an empirical research and found that a relationship-driven
strategy, rather than a performance-based strategy, is the best choice for companies to prosper
in the competitive global environment.29
Four years after the recognition of the relationship-
driven strategy by Benton and Maloni (2005), the research of Essig and Amann (2009) also
acknowledged the importance of supplier satisfaction, by stating: "An unsatisfied supplier
may produce poor quality output that lowers the quality of a buyer's products and thus
influences the buyer's sale volumes and profitability".30
This implied that supplier
dissatisfaction has large implications for the performance of the buying company, an idea that
has been recognised and further explored by other researchers.
Nyaga, Whipple and Lynch investigated in 2010 the joint relationship between buyer and
supplier. They found that actions from buyer and supplier will increase trust and commitment,
resulting in higher levels of satisfaction for both buyer and supplier.31
25
See Anderson and Narus (1990), p. 42. 26
See Wong (2000) 27
Wong (2000), p. 427. 28
See Forker and Stannack (2000), p. 37. 29
See Benton and Maloni (2005), p. 19. 30
Essig and Amann (2009), p. 107. 31
See Nyaga, Whipple, and Lynch (2010), p.111.
13
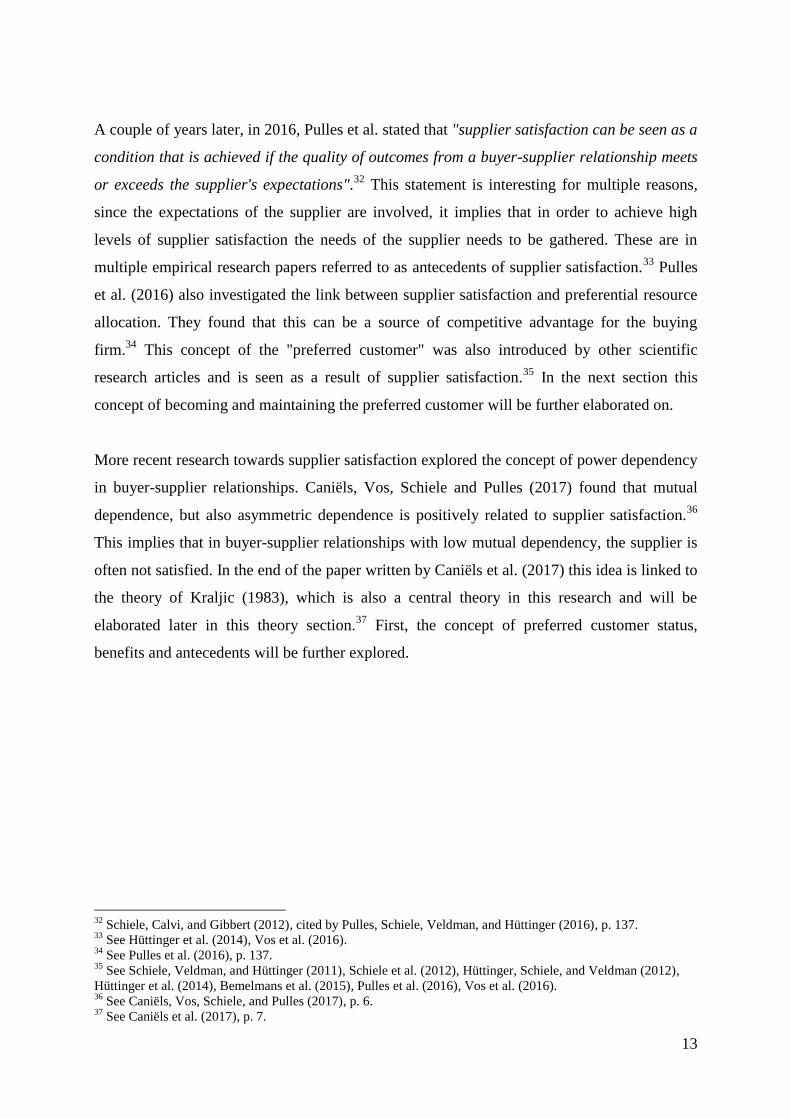
A couple of years later, in 2016, Pulles et al. stated that "supplier satisfaction can be seen as a
condition that is achieved if the quality of outcomes from a buyer-supplier relationship meets
or exceeds the supplier's expectations".32
This statement is interesting for multiple reasons,
since the expectations of the supplier are involved, it implies that in order to achieve high
levels of supplier satisfaction the needs of the supplier needs to be gathered. These are in
multiple empirical research papers referred to as antecedents of supplier satisfaction.33
Pulles
et al. (2016) also investigated the link between supplier satisfaction and preferential resource
allocation. They found that this can be a source of competitive advantage for the buying
firm.34
This concept of the "preferred customer" was also introduced by other scientific
research articles and is seen as a result of supplier satisfaction.35
In the next section this
concept of becoming and maintaining the preferred customer will be further elaborated on.
More recent research towards supplier satisfaction explored the concept of power dependency
in buyer-supplier relationships. Caniëls, Vos, Schiele and Pulles (2017) found that mutual
dependence, but also asymmetric dependence is positively related to supplier satisfaction.36
This implies that in buyer-supplier relationships with low mutual dependency, the supplier is
often not satisfied. In the end of the paper written by Caniëls et al. (2017) this idea is linked to
the theory of Kraljic (1983), which is also a central theory in this research and will be
elaborated later in this theory section.37
First, the concept of preferred customer status,
benefits and antecedents will be further explored.
32
Schiele, Calvi, and Gibbert (2012), cited by Pulles, Schiele, Veldman, and Hüttinger (2016), p. 137. 33
See Hüttinger et al. (2014), Vos et al. (2016). 34
See Pulles et al. (2016), p. 137. 35
See Schiele, Veldman, and Hüttinger (2011), Schiele et al. (2012), Hüttinger, Schiele, and Veldman (2012),
Hüttinger et al. (2014), Bemelmans et al. (2015), Pulles et al. (2016), Vos et al. (2016). 36
See Caniëls, Vos, Schiele, and Pulles (2017), p. 6. 37
See Caniëls et al. (2017), p. 7.

14
2.2 Being the preferred customer of crucial suppliers could result in
competitive advantage.
As already mentioned in the previous section, supplier satisfaction is often seen as a cause for
becoming the preferred customer of suppliers. But to know more about this effect, the concept
of preferred customer needs extra attention. In 2008, Steinle and Schiele were one of the first
to write about the concept of being the preferred customer. They stated that "being a preferred
customer implies receiving better treatment than other customers. By definition, this is an
advantage when a firm competes with other customers of a supplier for its attention and the
supplier fulfils the criteria of being a valuable resource".38
This definition includes also the
aspect of receiving a better treatment from the supplier, also called preferential treatment, a
concept that is explained further in this theory section.
In addition to the above-mentioned definition, a general division between three types of
preferred customers can be made. Although one can argue that a supplier treats its customers
all equally, some customers are business-wise more important than others.39
See figure 1 on
the next page. Non-preferred customers are at the bottom of the preferred customer pyramid,
this is the largest group of customers. These customers do not receive any additional benefits
for the money they spend on the supplier. Medium preferred customers do receive some extra
benefits in the process of doing business with the supplier, however, these customers do have
to pay to receive these benefits. Examples of extra benefits can be for instance reducing
delivery time when ordering products, additional services for which the supplier will charge
the buying company. The final category is the top preferred customers, this category consists
usually of just one or a few customers, this is the category on which the focus will be in this
research. The top preferred customers are the most favourite customers of the specific
supplier, the supplier does not want to lose these as a customer and will put extra effort in the
buyer-supplier relationship. These customers receive a better treatment compared to other
customers without paying additional money.40
This better treatment could be in terms of
product quality and availability, support in the sourcing process, reduced delivery time or/and
prices.41
It is this category of top preferred customers that is referred to in this research by
using the term 'preferred customer'.
38
Steinle and Schiele (2008), p. 11. 39
See Bemelmans et al. (2015), p. 179. 40
See Steinle and Schiele (2008), p. 11. 41
See Nollet, Rebolledo, and Popel (2012), p. 1186.

15
Figure 1: The preferred customer pyramid.
The theory of preferred customer status as explained on the previous pages, was not linked to
the previously mentioned aspect of supplier satisfaction in the early preferred customer
research. In 2012, Hüttinger, Schiele and Veldman linked the concept of supplier satisfaction
with the concepts of customer attractiveness and preferred customer status.42
Hüttinger et al.
(2012) performed an extensive literature review and summarised many possible antecedents
for preferred customer status. They categorised them in four categories: Economic Value (e.g.
Profitability), Relational Quality (e.g. Trust), Instruments of Interaction (e.g. Early Supplier
Involvement) and Strategic Compatibility (e.g. Geographical Proximity).43
But besides these
researches, some other researchers also looked at the concept of becoming and maintaining
the preferred customer of certain suppliers.
42
See Hüttinger et al. (2012) 43
See Hüttinger et al. (2012), p. 1202.

16
In 2012 Nollet, Rebolledo and Popel also performed a research combining the aspects of the
preferred customer with supplier satisfaction.44
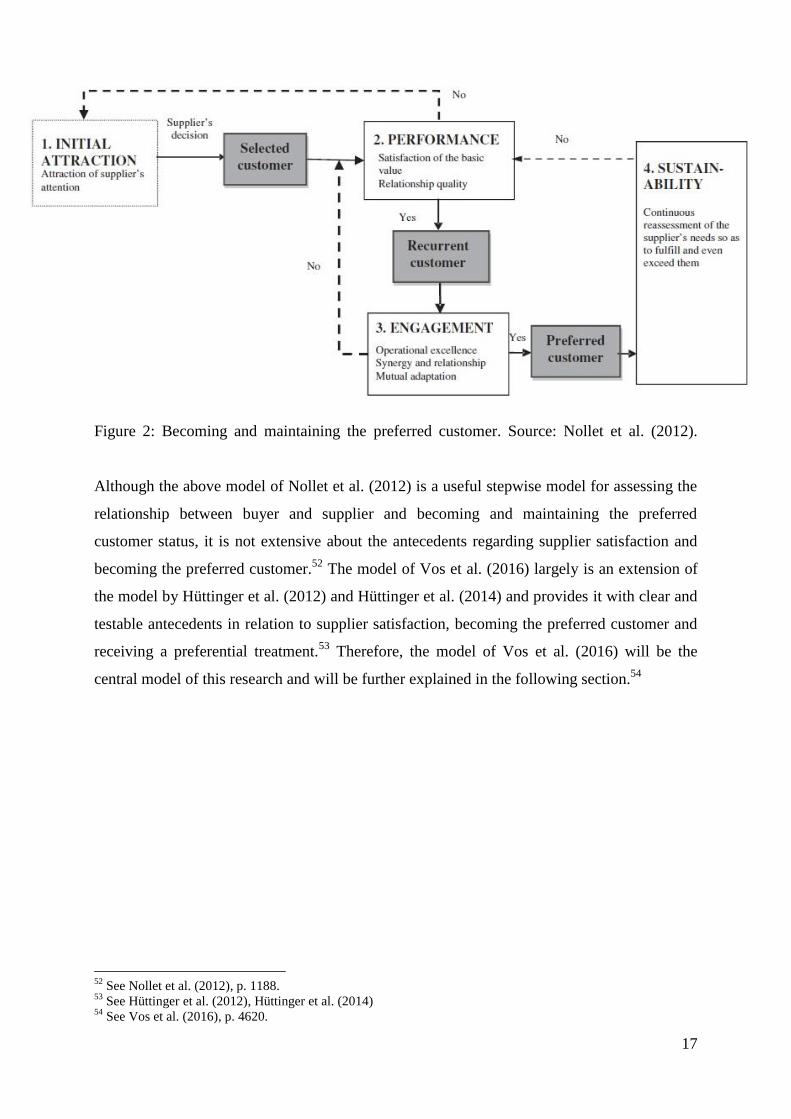
Nollet et al. (2012) developed a four-step
model in becoming and maintaining the preferred customer, see figure 2 on the next page.45
This model follows the basic steps in becoming and sustaining the preferred customer from a
supplier's perspective. First the customer has to be selected. Secondly, the basic needs of a
buyer-supplier relationship needs to satisfied, which encourages the customer to return for a
second time, therefore fulfilling step three. By performing well on for example aspects like
operative excellence, the supplier can see this customer as its preferred customer. When the
customer continuously reassesses the needs of the supplier and fulfils or even exceeds the
needs of the supplier, this customer can achieve the sustainable preferred customer status.
Two years later Hüttinger, Schiele, & Schröer (2014) tested the antecedents mentioned by
Hüttinger et al. (2012) and found three to be significant. These three antecedents are growth
opportunity, reliability (both p < .01) and relational behaviour (p < .05).46
In the year after the
research of Hüttinger et al. (2014), the research of Bemelmans, Voordijk, B. Vos and Dewulf
(2015) was published. They further explored the concept of becoming the preferred customer
and being the preferred customer.47
They added an unexplored factor, which is the maturity of
the buyer perceived by the supplier.48
The concept maturity in relation with purchasing in
itself is not new. In 2007, Schiele developed his maturity model, this model, however, was not
yet linked to becoming the preferred customer, but instead only acted as a tool to assess the
maturity of company's purchasing function.49
Another year later the research by Pulles, Schiele, Veldman and Hüttinger (2016) was
published combining the aspects of customer attractiveness and supplier satisfaction towards
the concept of preferred customer status.50
In the same year, Vos et al. (2016) combined the
two models of Hüttinger et al. (2014) and developed one causal model with antecedents
causing supplier satisfaction, supplier satisfaction causing preferred customer status which
again causes a preferential treatment.51
44
See Nollet et al. (2012) 45
See Nollet et al. (2012), p. 1188. 46
See Hüttinger et al. (2014), p. 700. 47
See Bemelmans et al. (2015), p. 179. 48
See Bemelmans et al. (2015), p. 179. 49
See Schiele (2007), p. 274. 50
See Pulles et al. (2016) 51
See Vos et al. (2016), p. 4615.
17
Figure 2: Becoming and maintaining the preferred customer. Source: Nollet et al. (2012).
Although the above model of Nollet et al. (2012) is a useful stepwise model for assessing the
relationship between buyer and supplier and becoming and maintaining the preferred
customer status, it is not extensive about the antecedents regarding supplier satisfaction and
becoming the preferred customer.52
The model of Vos et al. (2016) largely is an extension of
the model by Hüttinger et al. (2012) and Hüttinger et al. (2014) and provides it with clear and
testable antecedents in relation to supplier satisfaction, becoming the preferred customer and
receiving a preferential treatment.53
Therefore, the model of Vos et al. (2016) will be the
central model of this research and will be further explained in the following section.54
52
See Nollet et al. (2012), p. 1188. 53
See Hüttinger et al. (2012), Hüttinger et al. (2014) 54
See Vos et al. (2016), p. 4620.

18
2.3 Being the preferred customer of a supplier could result in a preferential
treatment over other buyers
Vos, Schiele & Hüttinger (2016) further explored the concept of reverse marketing, where
customers are competing for capable suppliers instead of satisfying the need of the market
(customers).55
They stated that due to supplier scarcity and increased outsourcing, buyers are
increasingly dependent on their suppliers.56
Buyers are often co-developing new products
with their suppliers and suppliers often introduce new technologies which cannot be
developed solely by the buying company. Buying firms that collaborate on such a strategic
level with their suppliers score higher on innovation performance.57
Suppliers can be the key
source of competitive advantage and innovation and buyers need to achieve the preferred
customer status in order to benefit from these advantages.58
The question raised by Vos et al.
(2016) is how to become this preferred customer of certain crucial supplier and how to receive
a preferential treatment, which can cause competitive advantage. As mentioned before,
supplier satisfaction links to the concept of preferred customer status. It is assumed that
buyers who are able to satisfy the suppliers receive the best resources and ultimately will have
a preferred status over other buyers.59
These other buyers are often competitors in the same
industry. Being the preferred customer of certain suppliers while your competitor is not, is
therefore very interesting in the field of purchasing. Since the purchasing department is
responsible for most of the contact with suppliers, this department might represent a critical
cornerstone for adapting innovation from suppliers and therefore influencing the innovative
performance of the firm.60
To find out how this preferential treatment can be achieved and possibly maintained by
buying companies, Vos et al. (2016) empirically tested an extended model of Hüttinger et al.
(2014) by using partial least squares (PLS). Since PLS will also be used for this research, an
extended explanation of this method for statistical analysis is given in the methods section
further on. The model of Vos et al. (2016) replicates the model of Hüttinger et al. (2014) and
adds an extra antecedent of supplier satisfaction causing preferred customer status. This
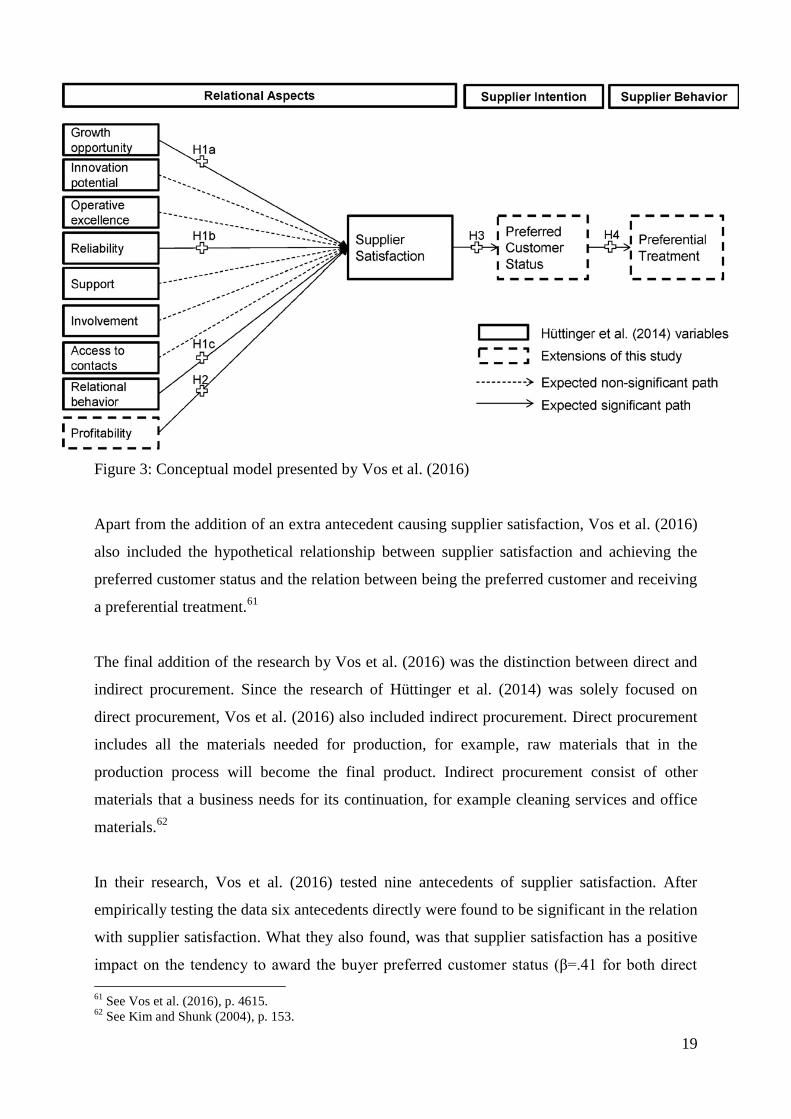
antecedent is profitability. See figure 3 on the next page for an overview of this conceptual
model presented by Vos et al. (2016).
55
See Blenkhorn and Banting (1991), p. 185. 56
See Vos et al. (2016), p. 4613. 57
See Luzzini, Amann, Caniato, Essig, and Ronchi (2015), p. 115. 58
See Schiele et al. (2011), p. 2. 59
See Hüttinger et al. (2012), p. 1199. 60
See Luzzini et al. (2015), p. 110.
19
Figure 3: Conceptual model presented by Vos et al. (2016)
Apart from the addition of an extra antecedent causing supplier satisfaction, Vos et al. (2016)
also included the hypothetical relationship between supplier satisfaction and achieving the
preferred customer status and the relation between being the preferred customer and receiving
a preferential treatment.61
The final addition of the research by Vos et al. (2016) was the distinction between direct and
indirect procurement. Since the research of Hüttinger et al. (2014) was solely focused on
direct procurement, Vos et al. (2016) also included indirect procurement. Direct procurement
includes all the materials needed for production, for example, raw materials that in the
production process will become the final product. Indirect procurement consist of other
materials that a business needs for its continuation, for example cleaning services and office
materials.62
In their research, Vos et al. (2016) tested nine antecedents of supplier satisfaction. After
empirically testing the data six antecedents directly were found to be significant in the relation
with supplier satisfaction. What they also found, was that supplier satisfaction has a positive
impact on the tendency to award the buyer preferred customer status (β=.41 for both direct
61
See Vos et al. (2016), p. 4615. 62
See Kim and Shunk (2004), p. 153.

20
and indirect procurement) and that having the preferred customer status has a positive impact
on receiving a preferential treatment from the supplier (β=.55 for direct and β=.51 for indirect
procurement).63
Due to the fact that after testing the original conceptual model only six
antecedents turned out to have a direct significant effect on supplier satisfaction, Vos et al.
(2016) decided to revise their model. Their study identifies the possibility to order the factors
into first- and second-tier antecedents of supplier satisfaction. They included particular the
interrelations of antecedents. They found that innovation potential is positively related to
growth opportunity, that support, reliability and involvement are positively related to
relational behaviour, and that contact accessibility is positively related to operative
excellence.64
See for the full revised model figure 4. To get a better understanding of the
meaning of each antecedent of the revised model, the following pages will provide a closer
look at each aspect.
Figure 4: Revised model by Vos et al. (2016).
63
See Vos et al. (2016), p. 4618. 64
See Vos et al. (2016), p. 4620.

21
Companies in all kinds of industries face the increasing global competition. The markets
worldwide demand more and more innovation from the companies. In the 1990s the way of
innovation changed to network-innovation, which means that instead of developing your own
ideas, working together with other businesses and combining the knowledge, information,
skills and other resources to create new innovations is becoming more usual.65
As mentioned
before, also co-developing with your suppliers is positively related to innovation
performance.66
Innovation potential as an antecedent of supplier satisfaction is referred to by
Hüttinger et al. (2014) as the opportunity to generate innovations in the exchange relationship
due to the buying firm's innovative capabilities and its contribution in joint innovation
processes.67
In other words, a supplier is more likely to be satisfied by a buying company if he
could collaborate with that buying firm to create innovations.
Innovation potential is positively related to growth opportunity. Growth opportunity is
referred to by Hüttinger et al. (2014) as the suppliers' ability to grow together with the buying
firm and to generate new potential business opportunities through the relationship.68
In other
words, if a buying company is likely to grow in the near future, a supplier is more willing to
establish a long-term relationship with that company, because the supplier expects to generate
more profit with that customer in the nearby future.69
The next concept of relational behaviour refers to the behaviour of the buying firm towards
the supplier.70
It means that the buying firm treats the supplier fairly and, is strongly related to
supplier satisfaction.71
Fairness in the buyer-supplier relationship is a difficult concept since it
is essentially an evaluative judgement of the other party in the relationship, however, it
usually includes the fair sharing in financial terms and equality in both the decision making
and in the interpersonal relationships between companies.72
In the revised model of Vos et al.
(2016) relational behaviour is a first-tier antecedent of supplier satisfaction. Support,
reliability and involvement are considered as a second-tier antecedent of relational
behaviour.73
65
See Schiele et al. (2011), p. 4. 66
See Luzzini et al. (2015), p. 115. 67
See Hüttinger et al. (2014), p. 703. 68
See Hüttinger et al. (2014), p. 703. 69
See Zaefarian, Najafi-Tavani, Henneberg, and Naudé (2016), p. 162. 70
See Hüttinger et al. (2014), p. 703. 71
See Griffith, Harvey, and Lusch (2006), p. 94. 72
See Jap (2001) and Luo (2009), cited by: Jokela and Söderman (2017), p. 268. 73
See Vos et al. (2016), p. 4619.

22
Support of suppliers can be seen as the effort invested by the buying firm in the supplier
development. These efforts can occur in multiple ways, from a greater emphasis on
communication with the supplier and formal evaluation and feedback, to greater levels of
involvement in activities such as site visits and training/education of suppliers' personnel.
These efforts appear to be rewarded by the supplier.74
To summarise, it can be said that the
more support the supplier receives from the buyer in multiple ways, the more satisfied a
supplier potentially is.
For the following antecedent of reliability, a clear definition can be used. According to Hald
et al. (2009) reliability is "the actor's perception that the other actor's promises are fulfilled
or that commitments are reliable and that the dyadic associate acts in a consistent or
predictable manner. Thus if an actor is presumed to be reliable, the other party believes this
actor “keeps a promise” and does not “let us down”".75
In other words, does a buying firm
keeps its promise or not? A reliable buying firm is often more appreciated by its suppliers.
Unreliability from either the supplier or the buyer side of the relationship can often 'poison'
the buyer-supplier relationship.76
Involvement as an antecedent of supplier satisfaction refers to the level of involvement of
suppliers in the buying firm. The antecedent involvement should not be confused with another
antecedent called support. Involvement differs from the aspect of support, a supportive buying
firm is a firm which is involved in the supplier, whereas involvement is meant that the
supplier is involved in the buying firm. Companies who let involve their suppliers in the
development of new products and ideas can benefit from the technology and expertise of the
supplier. This concept of ESI is widely used by companies all over the world.7778
The
involvement of suppliers can also increases the dedication and improves the communication,
reduces errors and enables understanding mutual capabilities.79
Next is the aspect of operative excellence as a first-tier antecedent of supplier satisfaction.
According to Hüttinger et al. (2014) operative excellence refers to "the supplier’s perception
that the buying firm’s operations are handled in a sorrow and efficient way, which facilitates
74
See Krause and Ellram (1997), p. 50/51. 75
See Hald, Cordón, and Vollmann (2009), p. 965. 76
See Zaefarian et al. (2016), p. 160. 77
See Dowlatshahi (1998), p. 143. 78
See Luzzini et al. (2015), p. 115. 79
See Handfield, Ragatz, Petersen, and Monczka (1999), p. 52.
23
the way of doing business for the supplier".80
According to Vos et al. (2016) and Essig &
Amann (2009), operative excellence in the buyer-supplier relationship does refer to having a
specific contact person within the buying firm who takes care of the relationship and
coordinates activities. This can lead to a supplier perceiving a higher operational excellence of
the buying firm.81
Therefore contact accessibility is seen directly related to operational
excellence.
In relation to operative excellence is contact accessibility, referred to as the availability of a
close contact person among the buying organisation for all upcoming issues. It is a second-tier
antecedent of supplier satisfaction in relation to receiving the preferred customer status and
having a preferential treatment. Easy and frequent contact seems to be essential in the
collaboration between buyer and supplier.82
The antecedent of profitability is a new concept in the research of supplier satisfaction and
preferred customer status introduced by Vos et al. (2016). This antecedent was not
investigated by Hüttinger et al. (2014).83
The concept can be described quite simple. Is a
relationship profitable for the supplier? The more profitable a relationship is with a buying
company, the more satisfied a supplier probably is.
80
See Hüttinger et al. (2014), p. 703. 81
See Vos et al. (2016), p. 4619. 82
See Hüttinger et al. (2014), p. 703. 83
See Vos et al. (2016), p. 4614.

24
2.4 The type of commodity a supplier supplies, has an influence on the
buyer-supplier relationship
As described in the introductory chapter of this research, different commodities require
different types of supply management and purchasing strategies. The purchasing department
of a company is responsible for acquiring most of the company's resources. Resources include
all assets, capabilities, organizational processes, firm attributes, information, knowledge, etc.
controlled by a firm that enable the firm to conceive of and implement strategies that improve
its efficiency and effectiveness.84
Resources can cause competitive advantage and even
sustained competitive advantage when current or potential competitors are not able to
duplicate the benefits of these resources.85
Resources causing competitive advantage have to be valuable, rare, imperfectly imitable and
non-substitutable by other resources (VRIN).86
These assumptions are the underlying thoughts
of the resource-based view (RBV) introduced by Barney (1991).87
The RBV analyses the
competitive position of an organisation according to its resources. For purchasing this is very
interesting, because most of a company's resources will be purchased. Suppliers that are
responsible for these resources require specific purchasing strategies. To define what
strategies are necessary for each specific supplier and resource, the buying firm has to define
its most crucial resources according to the RBV.88
When defining the resources and the suppliers supplying these resources, companies will
eventually end up with an overview of their crucial and non-crucial resources needed for
competitive advantage. When this is done by the purchasing department, a portfolio
management strategy has to be developed. Successful supply-chain management requires the
effective and efficient management of a portfolio of relationships; first, companies should
match the type of relationships to the various supplier conditions; second, they should adopt
the appropriate management approach for each type of relationship. Failures in purchasing
and supply-chain management are often the result of a mismatched relational design or a
poorly managed appropriate design.89
84
Daft, Murphy, and Willmott (2010), cited by; Barney (1991), p. 101. 85
See Barney (1991), p. 102. 86
See Barney (1991), p. 106-109. 87
See Barney (1991) 88
See Quintens, Pauwels, and Matthyssens (2006), p. 882. 89
See Bensaou (1999), p. 35.

25
To effectively manage the portfolio of buyer-supplier relationships, companies can make use
of a portfolio model on which business relationships can be categorised. However, the use
portfolio models in marketing and purchasing have been limited.90
Since marketing and
purchasing are considered as mirrored departments in an organisation, meaning the type of
business is similar but in a reversed way, models used in marketing provide often the basis for
the development of models in purchasing.91
Olsen and Ellram (1997a) performed a literature
study and discovered six conceptual models used for marketing and/or purchasing.92
These
are summarised in table 1.
Author(s) Approach Conclusions/Contributions
Fiocca (1982) Marketing Develops a portfolio model of customer accounts.
Campbell and
Cunningham (1983)
Marketing Emphasizes the importance of analysing both the present
customers and the potential customers (tomorrow's
customers).).
Dubinsky and
Ingram (1984)
Marketing Argues that companies have to analyse the present and
future profit contribution of customers in order to create a
balanced mix of customers.
Ansoff and
Leontiades (1976)
Strategic planning
and purchasing
Describes strategic business units (SBUs) and strategic
resource areas and the interdependencies between them. The
strategic planning for the SBUs should include a strategic
planning for the corresponding resources.
Kraljic (1983) Purchasing Develops a portfolio model for products and suggests ways
of managing the different buyer-supplier relationships based
on the buying power in the relationship.
Turnbull (1990) Marketing and
purchasing
Suggests a number of areas where portfolio models can be
used and argues that portfolio models are a useful tool in
purchasing. The author concludes that the use of portfolio
models for the management of purchasing functions is a
neglected area.
Table 1: Portfolio models, derived from Olsen and Ellram (1997a).
90
See Capon, Farley, and Hulbert (1987), cited by: Olsen and Ellram (1997a), p. 102. 91
See Olsen and Ellram (1997b), cited by: Olsen and Ellram (1997a), p. 102. 92
See Olsen and Ellram (1997a), p. 103.

26
In more recent research also research was performed towards portfolio management in
business relationships and towards buyer-supplier relationships specifically. However, most
of the research towards these supplier portfolio management theories were linked to the basic
model of Kraljic (1983).93
One other classification portfolio model that has the same layout as
the Kraljic (1983) model, but is substantially different. It ranks suppliers in four categories
based on the supplier's relative power and the supplier's overall performance.94
Although it
provides purchasers with a useful overview of the performance and power of their suppliers, it
is a difficult process to assess each supplier in terms of these two factors and it does not
qualify the importance of the supplier, like for instance, the Kraljic (1983) model does.
Other portfolio management models, for example, the Boston Consulting Group's (BCG)
growth/share matrix, widely used in sales, is also often used for purchasing.95
It categorises
suppliers among their market share and their growth potential.96
Fiocca (1982), mentioned
already on the previous page, developed a customer portfolio model which can be easily used
in purchasing. His model consists of nine quadrants with customer attractiveness on the left
side and the strength of the buyer/seller relationship to the right.97
Still, besides the
extensiveness which makes them difficult to use, these models were not specifically designed
for purchasing. That is mainly why the Kraljic-model has the most influence and most
commonly used in purchasing education.98
Until today, Kraljic (1983) has been cited more
than 2.400 times in scientific literature and has proven its effectiveness in purchasing practice,
therefore this research uses the Kraljic (1983) model for distinguishing between different
types of commodities.
To get a better understanding of the Kraljic (1983) model a deeper view of the model is
needed. According to Kraljic (1983), a buying company should adapt its supply-chain strategy
depending two factors: 1. Profit impact and 2. Supply risk.99
Based on these two factors,
Kraljic (1983) developed a four quadrant matrix to which all commodities bought by an
organisation can be ranked.100
See for this matrix figure 5 on the next page.
93
See Gelderman and Semeijn (2006), Caniëls and Gelderman (2007) and Knight, Tu, and Preston (2014) 94
See Zhu, Dou, and Sarkis (2010), p. 308. 95
See Olsen and Ellram (1997a), p. 102. 96
See Hax and Majluf (1983), p. 46/47. 97
See Fiocca (1982), p. 60. 98
See Kamann and Bakker (2004), p. 59. 99
See Kraljic (1983), cited by: Caniels and Gelderman (2005), p. 141. 100
See Kraljic (1983), p. 111.
27
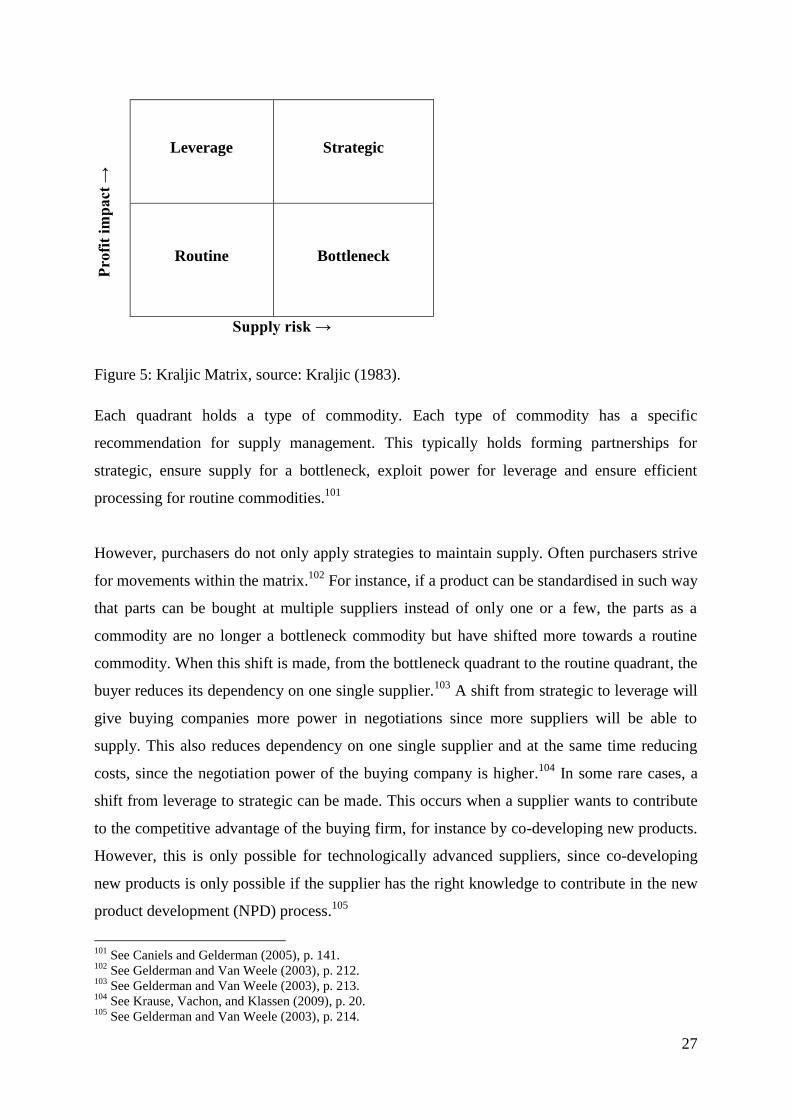
Figure 5: Kraljic Matrix, source: Kraljic (1983).
Each quadrant holds a type of commodity. Each type of commodity has a specific
recommendation for supply management. This typically holds forming partnerships for
strategic, ensure supply for a bottleneck, exploit power for leverage and ensure efficient
processing for routine commodities.101
However, purchasers do not only apply strategies to maintain supply. Often purchasers strive
for movements within the matrix.102
For instance, if a product can be standardised in such way
that parts can be bought at multiple suppliers instead of only one or a few, the parts as a
commodity are no longer a bottleneck commodity but have shifted more towards a routine
commodity. When this shift is made, from the bottleneck quadrant to the routine quadrant, the
buyer reduces its dependency on one single supplier.103
A shift from strategic to leverage will
give buying companies more power in negotiations since more suppliers will be able to
supply. This also reduces dependency on one single supplier and at the same time reducing
costs, since the negotiation power of the buying company is higher.104
In some rare cases, a
shift from leverage to strategic can be made. This occurs when a supplier wants to contribute
to the competitive advantage of the buying firm, for instance by co-developing new products.
However, this is only possible for technologically advanced suppliers, since co-developing
new products is only possible if the supplier has the right knowledge to contribute in the new
product development (NPD) process.105
101
See Caniels and Gelderman (2005), p. 141. 102
See Gelderman and Van Weele (2003), p. 212. 103
See Gelderman and Van Weele (2003), p. 213. 104
See Krause, Vachon, and Klassen (2009), p. 20. 105
See Gelderman and Van Weele (2003), p. 214.
Pro
fit
imp
act
→
Leverage Strategic
Routine Bottleneck
Supply risk →

28
The Kraljic-model for managing commodities can be easily linked to the theory of being the
preferred customer of certain suppliers.106
Both strategic and bottleneck have the highest level
of supply risk.107
Bottleneck items do have a lower profit impact but could have a major
impact on the business. For instance, if a spare part for a machine is not available and an
entire production facility cannot operate.108
Buying companies often establish partnerships with strategic suppliers. However, due to a low
purchasing volume, this is not interesting for bottleneck suppliers. Therefore, buyers will raise
their commitment to the supplier instead of establishing a partnership.109
Commitment can be
seen as support of the supplier. This enhances the antecedent of relational behaviour and is
therefore likely to have a positive influence on supplier satisfaction, receiving the preferred
customer status and a preferential treatment from the supplier.110
However, just having a
supportive attitude towards the suppliers is probably not enough to satisfy the supplier and
becoming the preferred customer and benefiting from all its advantages. A buying company
can also look for opportunities to increase the buying volume in the nearby future. If the
supplier knows that if he supplies this bottleneck commodity in the desired way, he is also
likely to sell more products in the future, he will be more satisfied with the current buyer-
supplier relationship. This is referred to as an aspect of growth opportunity in preferred
customer research.111
If a buying firm plans to have buy more in the future, it will also cause
the buyer to be more profitable for the supplier. This will have a positive influence on
profitability in relation to supplier satisfaction.112
The main products in the routine segment are often non-production related products, such as
office supplies and services. These kinds of products do not ask for much attention.
Nowadays the purchasing process for this quadrant is often being replaced by e-procurement
with an electronic catalogue and ordering systems. This enables companies to automatically
order new specific products from the standard supplier.113
106
See Hüttinger et al. (2012), p. 1194. 107
See Kraljic (1983), p. 112. 108
See Caniels and Gelderman (2005), p. 145. 109
See Lindwall, Ellmo, Rehme, and Kowalkowski (2010), p. 14. 110
See Vos et al. (2016), p. 4619. 111
See Hüttinger et al. (2014), p. 703. 112
See Vos et al. (2016), p. 4614. 113
See Gelderman and Van Weele (2003), p. 213.
29
Leverage items are, as mentioned before, items that have a low level of supply risk, but do
have a high level of profit impact. Usually because multiple suppliers are able to supply the
same product, buyers will have a strong position for negotiation. Most buying companies will
apply a sourcing strategy that focuses on efficiency and cost reductions with leverage
suppliers.114
In the strategic quadrant the buyer is highly dependent on the supplier.115
The supplier comes
with a high level of supply risk and at the same time a high level of profit impact, the goal of
the buyer is often to establish long-lasting partnerships with these kind of suppliers. Although
strategic suppliers can be world class, alert and high performing, strategic partnerships are
rare. In the course of time these partnerships may become unsatisfactory for the buying
company, while sometimes the firm is locked in a partnerships due to an oligopolistic or
monopolistic market situation.116
That is why most buying firms strive for a switch towards a
more leverage construction to lower dependency and to raise negotiation power.
As mentioned before, the theory regarding supplier portfolio management is largely based on
Kraljic (1983). Kraljic (1983) was not the only one developing a model for analysing
portfolios, he was, however, one of the first. Other researchers have developed similar or
more extended models of the Kraljic (1983) model, but since the Kraljic (1983) model is the
most user-friendly and commonly used model in practice, for this research the Kraljic (1983)
model will be the central model for managing a portfolio of buyer-supplier relationships.117
Buyer-supplier relationship portfolio management theories often view the side of the buyer.
The vision of the supplier is usually not taken into account, the next section therefore zooms
in into the supplier's perspective of the buyer-supplier relationship.
114
See Gelderman and Van Weele (2003), p. 214. 115
See Caniels and Gelderman (2005), p. 141. 116
See Gelderman and Van Weele (2003), p. 214. 117
See Olsen and Ellram (1997a), p. 107.
30
2.4.1 The vision of the supplier is crucial in the buyer-supplier relationship
According to the Kraljic (1983) model, explained in the previous section, strategic
commodities are commodities with a high profit impact and at the same time a high level of
supply risk, meaning that only one or a few suppliers are able to supply this commodity.118
For a buying company these type of suppliers are crucial for the existence of the firm.119
The
importance of a supplier influences the way the buyer treats the supplier. The more important
a supplier is for a buyer the more the buyer does on the antecedents of relational behaviour
and operative excellence to keep the supplier for the company.120
Losing strategic suppliers
will have huge consequences for the company.
Bottleneck commodities on the other hand, referring to the Kraljic (1983) model, are goods or
services which do not have a large profit impact but do come with a high level of supply
risk.121
Commodities in this quadrant are for example spare parts for machines in production
facilities. These do not cost that much but can only be supplied by one or a few suppliers and
if not supplied, it can cause operational problems for the buying company.122
The relationship between buyer and supplier is also largely dependent on the view of the
supplier on the relation and should be taken into account. Van Weele (2009) developed a
model called the "Dutch Windmill" which combines the portfolio analysis of both the buyer
and supplier.123
This model suggests that a supplier might be of strategic interest for a buyer
but not vice versa. For example, for a middle large IT company that buys software from IBM,
this software is extremely important. But for IBM this company is probably not its core
customer and therefore not relevant to spend much effort on, regarding the relationship. See
for the full model figure 6.
But when a strategic supplier sees the buyer as its core or as a development customer, a
balance exists between buyer and supplier due to an interdependency of interests.124
This
means that the buyer is equally important to the supplier as vice versa. Both companies are
118
See Gelderman and Van Weele (2003), p. 207. 119
See Caniels and Gelderman (2005), p. 144. 120
See Vos et al. (2016), p. 4620. 121
See Caniels and Gelderman (2005), p. 145. 122
See De Boer, Labro, and Morlacchi (2001), p. 77. 123
See van Weele (2009), p. 200/202. 124
See Caniëls and Gelderman (2007), p. 222.

31
therefore expected to put a lot of effort in keeping up a good relationship with each other, in
order to ensure supply.125
Figure 6: The Dutch Windmill, source: Van Weele (2009).
The type of buyer-supplier relationship is for bottleneck commodities, compared to the
strategic suppliers, also dependent on the view of both the buyer and the supplier on the
relationship. For most bottleneck commodities the buyer-supplier relationship is in unbalance.
This because the buyer is not interesting for the supplier due to its low profit impact.126
It is, however, possible, according to the "Dutch Windmill" by Van Weele (2009), that the
vision from the supplier towards the buyer-supplier relationship is different, that for example
buying firm buying a bottleneck commodity such as a spare part for machinery is the core
125
See Gelderman and Semeijn (2006), p. 212. 126
See Caniëls and Gelderman (2007), p. 222.
32
customer of that supplier.127
But this odd type of buyer-supplier relationship where for the
buyer the profit impact is low but high for the supplier, is only likely to happen in cases where
the buying company is multiple times larger in annual turnover, than the supplier.128
Even when a customer might not be of big interest for the supplier, the supplier is still very
important to the buyer. Therefore, the buying company will do everything to keep the supplier
supplying the strategic or bottleneck products. These efforts might be shown in terms of
increased positive relational behaviour and a higher operative excellence as antecedents of
supplier satisfaction related to the award of the preferred customer status and receiving
preferential treatment.129
The expected relationships between supplier/buyer importance and
supplier satisfaction, becoming the preferred customer and receiving a preferential treatment
is further highlighted in the hypotheses section later in this research.
127
See van Weele (2009), p. 200/202. 128
See Morrissey and Pittaway (2006), p. 5. 129
See Vos et al. (2016), p. 4620.
33
2.5 Medium-sized companies have different buyer-supplier relationships
Previous research towards buyer-supplier relationships in the context of supplier satisfaction,
becoming the preferred customer and receiving a preferential treatment was performed in the
context of large companies.130
This research adds to the current literature of supplier
satisfaction, since it will be performed in the context of a medium-sized company and a large
company. Small and medium-sized enterprises (SMEs) are companies that have fewer than
500 employees.131
This difference seems interesting, because, while large companies often have more access to
resources.132
SMEs are more forced to form partnerships and close alliances with suppliers, as
they are seen crucial for their survival.133
On the other hand, SMEs often lack the
implementation of good supply chain management due to different priorities. Priorities often
lie with the day to day business, therefore, purchasing departments in SMEs are often less
sophisticated compared to large enterprises.134
Another cause for poorer supply chain
management in SMEs is the influence of the customer. Customers often determine the end
product produced by the SME.135
Most SMEs do not even have a purchasing or a supply chain
strategy implemented to deal with suppliers and other supply chain related issues.136
In contrast with SMEs, large enterprises often have extensive purchasing departments headed
by a chief procurement officer (CPO) and have proper strategies for strategic purchasing
implemented.137
In large companies, purchasing departments are crucial for a firm's
innovation capabilities. Good integrated purchasing with other functions of the organisation is
stimulating and enabling new product development, since most new products are co-
developed with suppliers and purchasing has the most contact with suppliers.138
In large,
technologically advanced companies, purchasing activities become more and more similar to
the activities from the marketing and sales department.139
Most large companies have a
purchasing department with a CPO that reports directly to the chief executive officer (CEO)
130
See Steinle and Schiele (2008), Schiele et al. (2011), Hüttinger et al. (2012), Hüttinger et al. (2014), Pulles et
al. (2016), Vos et al. (2016). 131
See Arend (2006), p. 741. 132
See McAdam and Reid (2001), p. 232. 133
See Arend (2006), p. 741. 134
See Vaaland and Heide (2007), p. 21. 135
See Arend and Wisner (2005), cited by: Vaaland and Heide (2007), p. 21. 136
See Quayle (2003), p. 83. 137
See Uhl, Nabhani, Kauf, Shokri, and Hughes (2017), p. 1373. 138
See Luzzini and Ronchi (2011), p. 24. 139
See Luzzini and Ronchi (2011), p. 25.

34
of a company. Under the CPO, several purchasing professionals report again to the CPO.
These professionals consist of strategic buyers, who negotiate the contracts, and operational
buyers, people who make sure the products are delivered on time and for the negotiated
price.140
SMEs usually do not have enough financial resources or personnel to establish such a
purchasing department as large enterprises do. In the purchasing process, large enterprises
have the advantage of economies of scale and higher buying power.141
On the other hand,
SMEs are often seen to be more flexible due to faster internal communication and therefore
able to adapt faster to changing environments and shifting customer demands.142
Most large
enterprises are multinational companies with a supplier pool all over the world. Large
enterprises have the opportunities, the personnel and the financial resources to scan the world
for the best suppliers.143
Although SMEs can be multinational companies, they usually are
more operating locally and therefore more dependent on the local pool of suppliers.144
The
existence of a strong local network is vital for the survival of SMEs. For large enterprises a
local network is less vital, since they can source their products over the entire world.
Although it seems more likely that, due to a larger level of dependency on a few suppliers,
SMEs are more assumed to invest relatively more in establishing good relationships with
suppliers, SMEs do employ little supply chain management.145
SMEs receive little attention in the current supply chain literature. Due to the large
dependency on certain, largely local, suppliers, SMEs are interesting to investigate in the
context of supplier satisfaction research. Therefore this research will be performed in the
context of large and small and medium-sized enterprises and a group comparison is included.
In the next section the hypotheses which will be tested later on will be drawn. The above
discussed theories will be the ground for the conceptual research model of this research.
140
See Luzzini and Ronchi (2011), p. 18. 141
See Karlsson and Olsson (1998), p. 39. 142
See Rothwell and Zegveld (1982), cited by: Karlsson and Olsson (1998), p. 38/39. 143
See Karlsson and Olsson (1998), p. 37. 144
See Pottier (1988), cited by: Karlsson and Olsson (1998), p. 37. 145
See Quayle (2003), p. 80.

35
3. Hypotheses
In the theory section the theories for buyer-supplier relations are drawn. In this section the
hypotheses which will be tested later will be given. In this research, one conceptual research
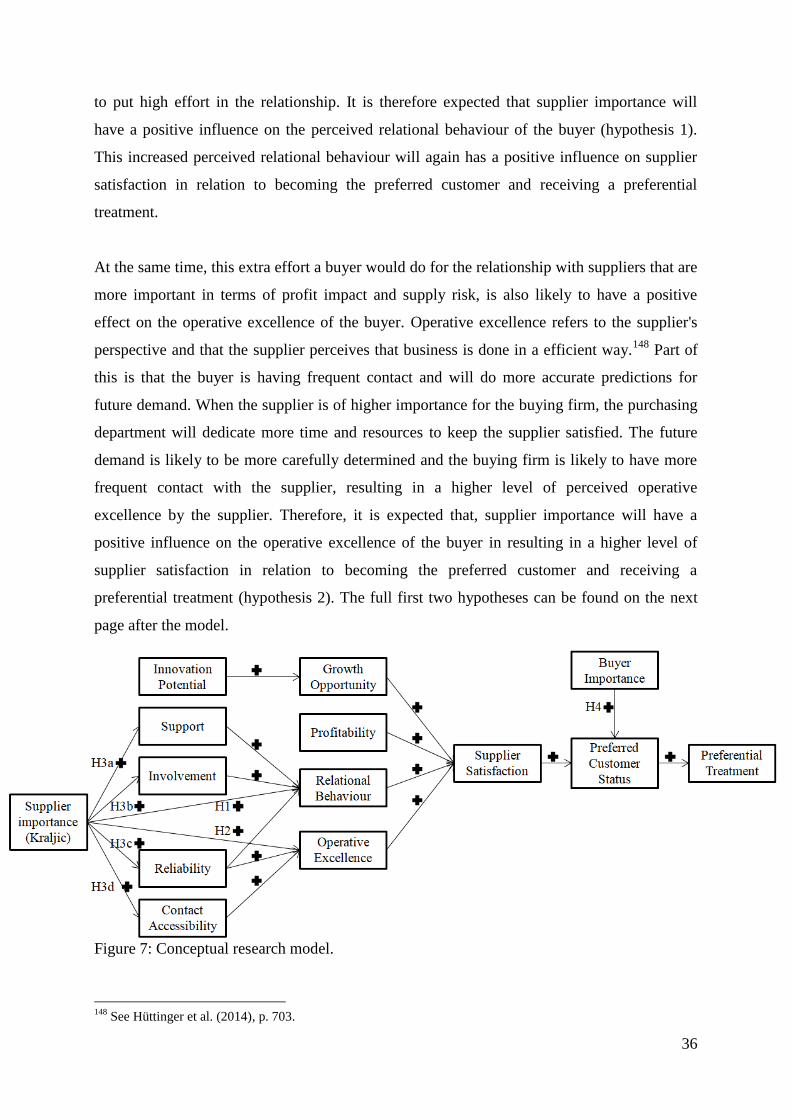
model is placed central. This model is shown at the next page. Each arrow within the model
will be further elaborated in this section.
First the relation between supplier importance and the first tier antecedents for supplier
satisfaction will be tested; relational behaviour and operative excellence. The construct of
supplier importance is derived from the Kraljic (1983) matrix. The matrix consists of four
quadrants in which suppliers can be divided; strategic, leverage, bottleneck and routine. These
four quadrants are ranked on two axes, profit impact and supply risk. The higher the profit
impact and/or the supply risk, the more important a supplier is for the buying firm. The
construct of supplier importance is therefore built out of two sub-constructs; profit impact and
supply risk.
As explained in the previous chapter, companies require resources to produce. According to
the Resource Based View, resources that are valuable, rare, imperfectly imitable and non-
substitutable by other resources (VRIN) will cause competitive advantage.146
Since most of
the resources are acquired by the purchasing department, the purchasing professionals will do
everything they can to get the resources available for the company.147
Resources that are key
for a company's performance are considered as the most important. Therefore, suppliers
supplying these resources are considered the most important suppliers. It is likely that the
purchasing department of the buying firm is unable to give all suppliers equal attention, thus,
the more important a supplier is for the buying company, the more attention the buyer devotes
to the supplier.
This attention, or effort in other words, is expected to have influence on the relationship
between buyer and supplier. When the supplier is of high importance (high profit impact, high
supply risk) for the buyer, the buyer does not want to lose this supplier. It is therefore
expected that the buyer will show more positive relational behaviour towards the supplier, by
acting friendlier, being more honest and showing more commitment. The other way round
will be the same, if the supplier is not of high importance for the buyer, the buyer is not likely
146
See Barney (1991), p. 106-109. 147
See Trent (2004), p. 7.
36
to put high effort in the relationship. It is therefore expected that supplier importance will
have a positive influence on the perceived relational behaviour of the buyer (hypothesis 1).
This increased perceived relational behaviour will again has a positive influence on supplier
satisfaction in relation to becoming the preferred customer and receiving a preferential
treatment.
At the same time, this extra effort a buyer would do for the relationship with suppliers that are
more important in terms of profit impact and supply risk, is also likely to have a positive
effect on the operative excellence of the buyer. Operative excellence refers to the supplier's
perspective and that the supplier perceives that business is done in a efficient way.148
Part of
this is that the buyer is having frequent contact and will do more accurate predictions for
future demand. When the supplier is of higher importance for the buying firm, the purchasing
department will dedicate more time and resources to keep the supplier satisfied. The future
demand is likely to be more carefully determined and the buying firm is likely to have more
frequent contact with the supplier, resulting in a higher level of perceived operative
excellence by the supplier. Therefore, it is expected that, supplier importance will have a
positive influence on the operative excellence of the buyer in resulting in a higher level of
supplier satisfaction in relation to becoming the preferred customer and receiving a
preferential treatment (hypothesis 2). The full first two hypotheses can be found on the next
page after the model.
Figure 7: Conceptual research model.
148
See Hüttinger et al. (2014), p. 703.

37
Derived from the theory discussed earlier, summarised on the previous pages, the first two
hypotheses for this research are:
Hypothesis 1: Buying firms will put more effort in the relationship with suppliers of higher
importance, therefore the suppliers will experience a higher level of positive relational behaviour.
Hypothesis 2: Buying firms will put more effort in the relationship with suppliers of higher
importance, therefore the suppliers will experience a higher level of operative excellence.
In the previous section the positive relation between supplier risk and positive relational
behaviour and operative excellence is examined. Hüttinger et al. (2014) investigated the
antecedents of supplier satisfaction, resulting in a direct relationship of all antecedents
regarding supplier satisfaction.149
However, in the revised model of Vos et al. (2016) a
distinction is made between second-tier and first-tier antecedents in the concept of supplier
satisfaction in relation to becoming the preferred customer and receiving a preferential
treatment. The antecedent of relational behaviour has three second-tier antecedents which
may explain the first-tier antecedent of relational behaviour in relation to supplier satisfaction,
becoming the preferred customer and receiving a preferential treatment. These are: support,
reliability and involvement.150
Support, reliability and involvement are found to have a positive influence on the perceived
relational behaviour of the buyer by the supplier.151
To find the exact effect of supplier
importance on supplier satisfaction, it needs to be tested if supply risk and profit impact are
directly related to positive relational behaviour or to one or multiple of the antecedents of
relational behaviour. Therefore, on the next page hypothesis 3a, 3b and 3c can be found,
which will further make clear what the exact effect is of supplier importance on the
antecedents of relational behaviour in relation to supplier satisfaction, becoming the preferred
customer and receiving a preferential treatment from the supplier.
The same holds for the relation between supplier importance and operative excellence as an
antecedent for supplier satisfaction in relation to becoming the preferred customer and
receiving a preferential treatment. For operative excellence one second-tier antecedent was
identified by Vos et al. (2016), this antecedent is called contact accessibility. To find out
149
See Hüttinger et al. (2014), cited by: Vos et al. (2016), p. 4615. 150
See Vos et al. (2016), p. 4620. 151
See Vos et al. (2016), p. 4620.
38
whether a direct effect on operative excellence, an indirect effect via the antecedent of contact
accessibility or no effect at all is present, the final hypothesis of this set of hypotheses tests
the indirect effect of supplier importance on operative excellence by testing the relation
between supplier importance and contact accessibility. Therefore the third set of hypotheses
will be:
Hypothesis 3a: Buying firms will put more effort in the relationship with suppliers of higher
importance, therefore the suppliers will experience a higher level of support.
Hypothesis 3b: Buying firms will put more effort in the relationship with suppliers of higher
importance, therefore the suppliers will experience a higher level of involvement.
Hypothesis 3c: Buying firms will put more effort in the relationship with suppliers of higher
importance, therefore the suppliers will experience a higher level of reliability.
Hypothesis 3d: Buying firms will put more effort in the relationship with suppliers of higher
importance, therefore the suppliers will experience a higher level of contact accessibility.
As mentioned in the theory section, in a buyer-supplier relationship the vision of the supplier
is at least equally important or maybe even more important than the vision of the buyer.152
When the vision of the supplier is different than the vision of the buyer, the relationship is in
unbalance.153
To return to the example from the introduction, imagine a medium-sized IT
company which maybe has IBM or Microsoft as one of its larger suppliers. This IT company
can put a lot of effort in the relationship with Microsoft, causing high levels of support,
involvement, reliability, etcetera. But due to the fact that Microsoft is a company that is
multiple times larger than the example IT company, the company is not of high interest for
Microsoft. It is therefore not likely that this IT company will ever become the preferred
customer of Microsoft, despite a maybe excellent relational behaviour and operative
excellence. More or less the same can be said for buyer-supplier relationships which are the
opposite of the above example. When a supplier is largely dependent for its existence on one
or a few buyers, this supplier will see that buying firm as its preferred customer. If that buying
firm does not perform well for example on relational behaviour or operative excellence this
152
See van Weele (2009), p. 200/202. 153
See Caniëls and Gelderman (2007), p. 222.

39
will not be of influence on the buying firm being the preferred customer of that supplier.
The goal of the following hypothesis is to check for effects with the Dutch Windmill model
by Van Weele (2009). In this research the vision of the supplier is called buyer importance, in
other words, how important is the buyer for the supplier. Van Weele (2009) developed his
Dutch Windmill model with the constructs of customer attractiveness and competitive
position supplier. Using this model will result to the following hypothesis:
Hypothesis 4: If the buyer is of high importance to the supplier, the supplier is more likely to
award the buyer with the preferred customer status.
In the model some arrows do not have any hypothesis linked to them. These relations are
similar to the model of Vos et al. (2016) and are tested to control the model of this research
with the model of Vos et al. (2016). In other words, this research replicates most of the model
by Vos et al. (2016). One arrow is added, which is the relation between reliability and
operative excellence. Operative excellence is largely about the future demands being right and
about accurate predictions. It is therefore also necessary that the buying firm is seen as
reliable by the supplier. If future demands are not reliable, the supplier faces planning
challenges. In the next section the methods for analysis will be discussed and further
elaborated on.
40
4. Methods
4.1 Collecting quantitative data suitable for statistical analysis
To test the model developed in the previous section proper statistics are needed. The basis of
this study is the model of Vos et al. (2016) which is a replication study of Hüttinger et al.
(2014).154155
In addition to the measured constructs in these researches the constructs of buyer
importance and supplier importance are added. As mentioned before, these constructs are
derived from Van Weele (2009) and Kraljic (1983).
To find the quantitative data suitable for statistical analysis, data from two companies based in
the Netherlands are used. Samplings of both companies collect data from dissimilar context.
Questionnaires were sent to approximately 740 key account managers. In total 159 valid
questionnaires were returned, which is a response rate of 21,5 per cent.
However, this is the average response rate. Between the two companies a large difference in
response exists. The first company is a medium-sized technical company specialised in water
treatment, further referred to as "water company". For this company, approximately 510 key
account managers were addressed and invited to fill in the survey. In the end, 39 useful
surveys were returned, a response rate of 7,6 per cent. For the second company, a major
Dutch energy company, further referred to as "energy company", only 230 account managers
were addressed. At the closing date 120 responses were returned, a response rate of 52,2 per
cent. This large difference in response rates between these companies will be further
discussed in the final section of this thesis.
The questionnaire is largely based on the previous supplier research performed by Vos et al
(2016) and Hüttinger et al. (2014) and is extended with questions specifically needed for this
research. The full questionnaire can be found in appendix A. Questionnaires were directly
emailed to supplying companies. Account managers were able to give anonymous answers to
prevent response bias. Response bias is something to take into account when not giving the
opportunity for anonymous responses, especially in supplier research. Suppliers are often
largely dependent on the buying company, they are often cautious while giving their opinion
to prevent losing the buying company as a customer. In the emails towards the suppliers the
account managers are asked to give honest and not socially desired answers. Further, it is
154
See Vos et al. (2016), p. 4620. 155
See Hüttinger et al. (2014), p. 703.

41
explicitly stated that the survey should and cannot be used as a marketing tool for the supplier.
To place the responding suppliers in the Kraljic (1983) matrix, the buying companies were
asked to place the suppliers on a scale from 1 to 5 on the aspect of supply risk and on the
aspect of profit impact. A spend analysis over the past year was used to check the profit
impact estimated by the buying department. No major discrepancies were found in this check.
Finally, the dataset is analysed and extreme cases or non-complete cases were deleted from
the set. Also, one of the final questions in the survey was a control question to test if the
respondents had enough knowledge of the buyer-supplier relationship. If they answered this
questioned negative, their entire response was not used for analysing the final model. The
final dataset consisted of 149 cases.
Table 2 shows the distribution of the cases in the length of the buyer-supplier relationship of
both companies. This table indicates that the energy company has on average longer buyer-
supplier relationships. Companies that work with a long-term planning and consider
purchasing to be strategic are likely to build more long-term cooperative relationships with
their suppliers.156
In large companies the strategic contribution of purchasing, as discussed
before, is often more recognised. Therefore it is not surprising that the large energy company
has on average longer lasting buyer-supplier relationships, compared to the medium-sized
water company.157
The difference between the mean length of the buyer-supplier relationship,
between the energy and water company, is 7,4 years (p < .01), see for the full analysis
appendix B.
Total Energy Water
<5 years 16 10,74% 7 6,36% 9 23,08%
5-10 years 40 26,85% 30 27,27% 10 25,64%
11-20 years 52 34,90% 40 36,36% 12 30,77%
> 20 years 37 24,83% 32 29,09% 5 12,82%
Not specified 4 2,68% 1 0,91% 3 7,69%
149 110 39
Table 2: Length of the buyer-supplier relationship.
156
See Carr and Pearson (1999), p. 500. 157
See Uhl et al. (2017), p. 1373.

42
In table 3, see below, the average value of each buyer-supplier relationship in 2017 is listed.
The suppliers are divided into quartiles of each approximately 25 per cent of the total amount
of suppliers. These numbers show the large difference between the buyer-supplier relationship
values of the large and the medium-sized company. In total, the purchasing value of the
energy company in 2017 was 600 million euro compared to 6 million euro for the water
company.
Total spent (N=149)
Energy (N=110)
Water (N=39)
Lowest quartile € 12.233,87
€ 61.623,68
€ 2.523,38
Second quartile € 100.461,64
€ 225.117,88
€ 8.529,20
Third quartile € 393.142,65
€ 587.212,85
€ 17.088,30
Upper quartile € 2.684.814,39
€ 3.432.111,05
€ 83.896,58
Total average € 802.445,13
€ 1.056.721,45
€ 26.576,36
Table 3: Average value of the buyer-supplier relationships in 2017.
Complex products often involve specific knowledge only available among certain suppliers,
to ensure supply buying companies will establish stronger relationships.158
The differences in
terms of complexity are shown below in table 4, note that the N is lower than previously, this
because not all suppliers answered this question in the survey. In terms of complexity in the
products supplied by the suppliers, the differences between the energy and the water company
are small. Although the difference is significant (p < .05). According table 4, it can therefore
be said that the products supplied to the water company are more complex and require more
attention, compared to the products supplied to the energy company. To see if the difference
in complexity has any implications in the buyer-supplier relationship, the results require more
analyses, to be done in the results section. First more information about the methods to be
used for analyses will be given.
Company N Mean Std. Deviation Std. Error Mean
Product
complexity
Energy 107 1,91 1,103 0,107
Water 28 2,39 0,916 0,173
Table 4: Differences in product complexity of the products supplied.
158
See Gann and Salter (2000), p. 956.

43
4.2 PLS as the silver bullet for path analysis
To test the model developed in section 3 (figure 7), suitable statistics need to be selected. The
model consists of multiple constructs which influence variables. For instance, supplier
importance influences reliability. But these variables are assumed to influence other variables,
which on their turn influence again other variables. In the end, a path from start to end with
relations will be created. PLS (Partial Least Squares) is a widely used technique for analysing
these type of models.159
Since the model of this research is an extension of the model
developed by Vos et al. (2016), it seems obvious to use the same method for analysing, PLS
path modelling (PLS-PM). But before applying the method, first a zoom on the method is
required.
Partial Least Squares (PLS) path modelling is a variance-based Structural Equation Modelling
(SEM) technique that is widely applied in business and social sciences. SEM is a family of
statistical techniques that has the ability to model latent variables, take into account various
forms of measurement error, and to test entire theories.160
Also, other well-known statistics
researchers conclude that PLS-SEM path modelling, if appropriately applied, is indeed a
"silver bullet" for estimating causal models in many theoretical models and empirical data
situations.161
A silver bullet is seen as a perfect solution for solving difficult problems.
In SEM two types can be distinguished, the previous mentioned variance-based, and
covariance-based SEM. In variance-based SEM the model creates entities as combinations of
observed variables. Next, it estimates model parameters using these entities. Variance-based
SEM is seen as the method to be used when the hypothesised model contains composites.
Covariance-based SEM estimates model parameters using the empirical variance-covariance
matrix and is widely used when the hypothesised model consists of one or more common
factors.162
PLS is among the variance-based SEM methods considered as one of the most fully
developed methods and as a general system.163
Largely because it has the ability to model
both factors and composites.
159
See Vos et al. (2016), Hüttinger et al. (2014), Pulles et al. (2016). 160
See Henseler, Hubona, and Ray (2016), p. 2. 161
Hair, Ringle, and Sarstedt (2011), p. 139. 162
See Henseler et al. (2016), p. 2/3. 163
See McDonald (1996), p. 240, cited by: Henseler et al. (2016), p. 3.
44
PLS path models consists of two different models; the measurement model (outer model) and
the structural model (inner model). The measurement model explains the relations between a
construct and its observed indicators. The structural model on the other hand measures the
relations between the constructs.164
The estimation of a PLS path model usually involves four steps of statistical analysis. The
first step is to create an entity for each construct as a combination of the observed indicators.
The indicator weights are determined such that each entity shares as much variance as
possible with the entities of causally related constructs. The output of the first step are the
entities, the correlation matrix, and the indicator weights.
In the second step the entities will be corrected for random measurement errors. This will be
done by dividing an entity's correlations by the square root of its reliability. The output of this
second step is a consistent construct correlation matrix.
The third step is to estimate the model parameters, which is possible now the consistent
construct correlation matrix is available. If the structural model has no feedback loops, the
model is recursive and ordinary least squares (OLS) regression can be used to obtain
parameter estimates for the paths. When the model contains feedback loops, in other words, is
non-recursive, other techniques such as two-stage least squares should be used. The output of
the third step consists of estimates for loadings, indirect effects, total effects, and several
model assessments.
The fourth and final step involves a bootstrap to obtain inference statistics for all model
parameters. Bootstrapping is a technique which is non-parametric and rests on the assumption
that the sample distribution holds information about the population distribution. The process
of bootstrapping consists of drawing a large number of small samples from the original
dataset and estimating the model parameters for each bootstrap sample. The standard error of
an estimate is inferred from the standard deviation of the bootstrap estimates.165166
164
See Henseler et al. (2016), p. 4. 165
See Henseler et al. (2016), p. 5. 166
See Hair et al. (2011), p. 142.

45
To start the analysis each variable needs to have multiple constructs. The constructs are
gathered via the questionnaire as mentioned in the previous section. Each latent variable of
the model is influenced by several constructs, the questionnaire in appendix A is subdivided
in categories, each category represents a latent variable of the model. One of the latent
variables, the variable of supplier importance is different, it is derived from the answers of the
buying companies instead of the suppliers.
In the next section the results of the statistical analysis will be presented and discussed.
46
5. Results
5.1 Data structure quality assessment and model validity and reliability
To check and control if the measured items, which are linked to the same construct in the
survey measured the same, a confirmatory factor analysis is produced to obtain the factor
loadings. A principal axis factoring is used, with a varimax rotation. Principal axis factoring
seeks for the least number of factors. Principal axis factoring also includes factors with
weaker loadings and is therefore useful in research based on real cases.167
Varimax rotations
are orthogonal, where the new axes are also orthogonal to each other. Varimax is a simple
solution when each factor has a small number of large loadings and a large number of zero (or
small) loadings. This simplifies the interpretation, because after the rotation each original
variable tends to be associated with one or a small number of factors.168
Based on an eigenvalue of 1, twelve factors were extracted. When supplier importance, since
it is measured from a different perspective, is not taken into account, this research consisted of
thirteen variables. Largely because of the strong relation, achieving the preferred customer
status and getting a preferential treatment are listed among the same factor. Three levels of
factor analysis exist: low (0,3), medium (0,5) and high (0,7). In larger cases, with sample sizes
larger than 100 samples, also low loadings can be used for analysis.169
In this research, three
constructs scored lower than 0,3 on the factor they are supposed to measure. These constructs
are: S_InnovationPot_30_5 (0,249), S_OperativeExc_40_7 (0,226) and
PC_Attractiveness_126_4 (0,267). These constructs are due to their low loadings with their
corresponding factor excluded for further research. See for the full rotated factor matrix
appendix C.
Next, is to check the validity and reliability of the constructs and variables. SmartPLS 3, a
programme to perform extensive structural equation models (SEM), provides also tools to
assess the validity and reliability of the observed constructs and variables. After bootstrapping
(5000 samples) SmartPLS 3 provides with information about reliability, the reliability of the
constructs is measured by the outer loadings of each construct. In order to accept the construct
in the model, the minimum loading has to be at least 0,7.170
However, other researchers argue
167
See De Winter and Dodou (2012), p. 707. 168
See Abdi (2003), p.3. 169
See Shevlin and Miles (1998), p. 86/88. 170
See Hulland (1999), p. 198.
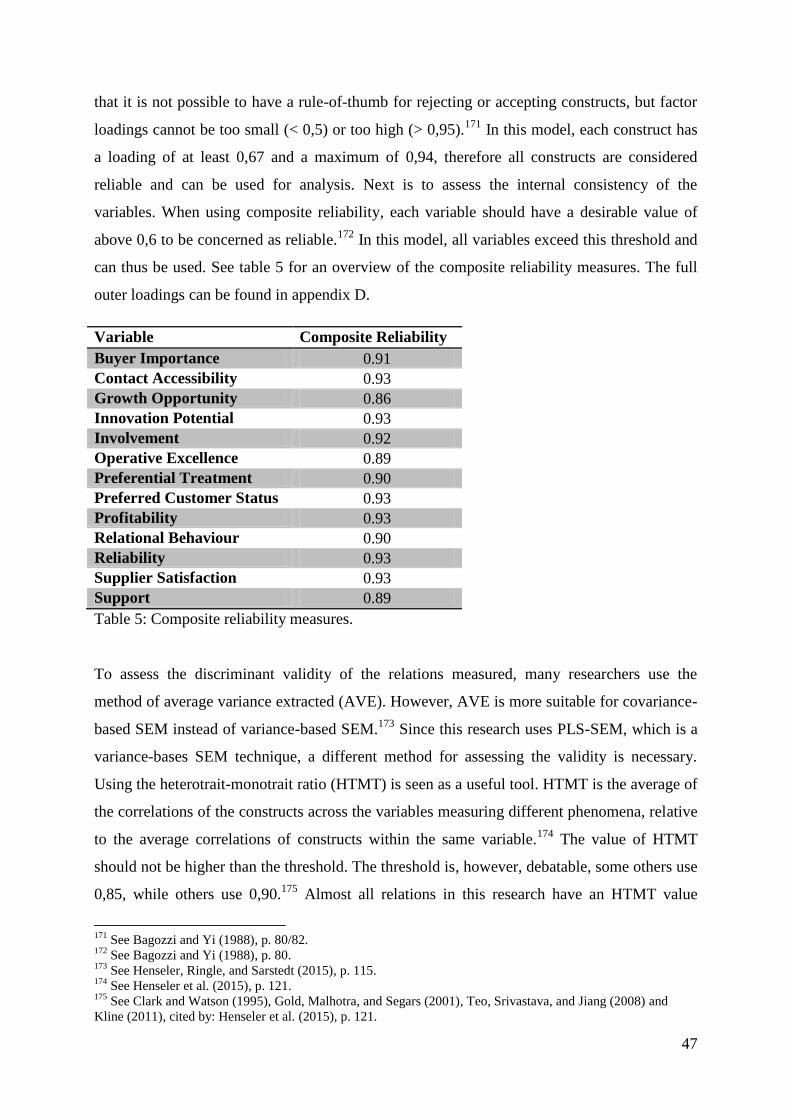
47
that it is not possible to have a rule-of-thumb for rejecting or accepting constructs, but factor
loadings cannot be too small (< 0,5) or too high (> 0,95).171
In this model, each construct has
a loading of at least 0,67 and a maximum of 0,94, therefore all constructs are considered
reliable and can be used for analysis. Next is to assess the internal consistency of the
variables. When using composite reliability, each variable should have a desirable value of
above 0,6 to be concerned as reliable.172
In this model, all variables exceed this threshold and
can thus be used. See table 5 for an overview of the composite reliability measures. The full
outer loadings can be found in appendix D.
Variable Composite Reliability
Buyer Importance 0.91
Contact Accessibility 0.93
Growth Opportunity 0.86
Innovation Potential 0.93
Involvement 0.92
Operative Excellence 0.89
Preferential Treatment 0.90
Preferred Customer Status 0.93
Profitability 0.93
Relational Behaviour 0.90
Reliability 0.93
Supplier Satisfaction 0.93
Support 0.89
Table 5: Composite reliability measures.
To assess the discriminant validity of the relations measured, many researchers use the
method of average variance extracted (AVE). However, AVE is more suitable for covariance-
based SEM instead of variance-based SEM.173
Since this research uses PLS-SEM, which is a
variance-bases SEM technique, a different method for assessing the validity is necessary.
Using the heterotrait-monotrait ratio (HTMT) is seen as a useful tool. HTMT is the average of
the correlations of the constructs across the variables measuring different phenomena, relative
to the average correlations of constructs within the same variable.174
The value of HTMT
should not be higher than the threshold. The threshold is, however, debatable, some others use
0,85, while others use 0,90.175
Almost all relations in this research have an HTMT value
171
See Bagozzi and Yi (1988), p. 80/82. 172
See Bagozzi and Yi (1988), p. 80. 173
See Henseler, Ringle, and Sarstedt (2015), p. 115. 174
See Henseler et al. (2015), p. 121. 175
See Clark and Watson (1995), Gold, Malhotra, and Segars (2001), Teo, Srivastava, and Jiang (2008) and
Kline (2011), cited by: Henseler et al. (2015), p. 121.
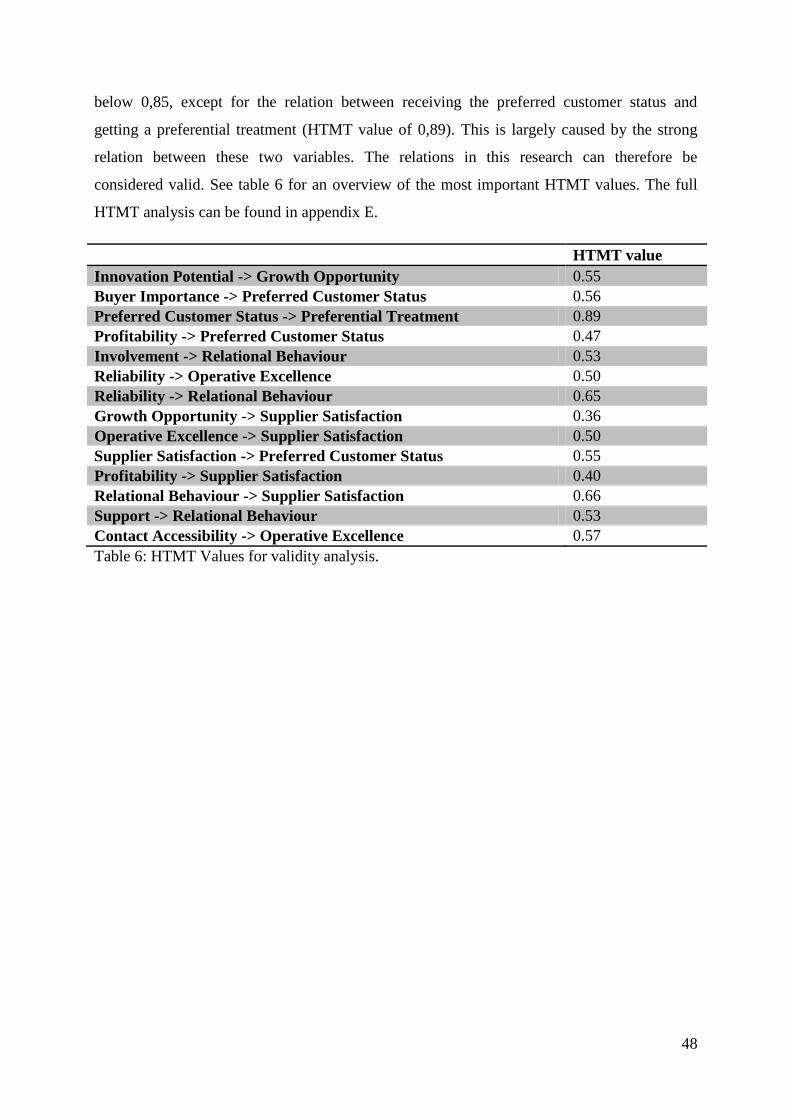
48
below 0,85, except for the relation between receiving the preferred customer status and
getting a preferential treatment (HTMT value of 0,89). This is largely caused by the strong
relation between these two variables. The relations in this research can therefore be
considered valid. See table 6 for an overview of the most important HTMT values. The full
HTMT analysis can be found in appendix E.
HTMT value
Innovation Potential -> Growth Opportunity 0.55
Buyer Importance -> Preferred Customer Status 0.56
Preferred Customer Status -> Preferential Treatment 0.89
Profitability -> Preferred Customer Status 0.47
Involvement -> Relational Behaviour 0.53
Reliability -> Operative Excellence 0.50
Reliability -> Relational Behaviour 0.65
Growth Opportunity -> Supplier Satisfaction 0.36
Operative Excellence -> Supplier Satisfaction 0.50
Supplier Satisfaction -> Preferred Customer Status 0.55
Profitability -> Supplier Satisfaction 0.40
Relational Behaviour -> Supplier Satisfaction 0.66
Support -> Relational Behaviour 0.53
Contact Accessibility -> Operative Excellence 0.57
Table 6: HTMT Values for validity analysis.

49
5.2 Reproducing Vos et al. (2016)
This research builds on the revised model proposed by Vos et al. (2016).176
Compared to the
model by Vos et al. (2016) it adds variables and seeks for new relations. Before testing the
model with the new variables, it makes sense to test if the analysis with the new data for the
model of Vos et al. (2016) finds the same relations as Vos et al. (2016) did. The questions to
obtain scores for each construct were the same for both this research and the research of Vos
et al. (2016), only the context differs in terms of investigated companies. The research by Vos
et al. (2016) took place in the context of a major German automotive and a major German
chemical company.177
This research on the other hand uses data from both a large Dutch
energy related company and a medium-sized, also based in the Netherlands, water technology
company. To compare the results of both this research and the research of Vos et al. (2016) in
terms of context, both the original model (figure 8) and the reproduced model (figure 9) are
shown below and on the next page respectively. After the figures a short analysis will be
made of the differences of both models.
Figure 8: The revised model of Vos et al. (2016)
176
See Vos et al. (2016), p. 4620. 177
See Vos et al. (2016), p. 4616.

50
Figure 9: The reproduced model of Vos et al. (2016)
Both models show a lot of communalities in terms of the significant relations. For instance a
strong relation between supplier satisfaction and becoming the preferred customer becomes
visible and the high effect of reliability on relational behaviour. A minor difference is the
strong significant relation between innovation potential and growth opportunity, which was a
less stronger and less significant relation in the revised model of Vos et al. (2016). Apart from
the similarities in both models, however, two major differences can be noticed: the relations
between both growth opportunity and profitability to supplier satisfaction do not exist in the
reproduced model. The relation between growth opportunity and supplier satisfaction used to
be already a weak relation in the revised model of Vos et al. (2016), with a path coefficient of
0,13 (direct procurement) and 0,15 (indirect procurement), still it is odd that this relation
vanishes completely when using a different dataset.
The reason why profitability is not directly related to supplier satisfaction stems with the
theory about buyer importance explained previously in this research. As an aspect of buyer
importance derived from the "Dutch Windmill" theory proposed by Van Weele (2009),
profitability is expected to have a direct relationship on becoming the preferred customer,
instead of an indirect relationship via supplier satisfaction.178
Pretesting the reproduced model
with a direct relation between profitability and becoming the preferred customer shows a
178
See van Weele (2009), p. 200/202.
51
significant relationship of 0,21 (p < 0,01). Growth opportunity shows a small relation, but
insignificant, with preferred customer status. Another assumption made in the conceptual
research model is the effect of reliability. Reliability is found to have a large influence on
relational behaviour (0,52; p < 0,01), but also on operative excellence (0,28, p < 0,01).
According to Hüttinger et al. (2014) operative excellence refers to "the supplier’s perception
that the buying firm’s operations are handled in a sorrow and efficient way, which facilitates
the way of doing business for the supplier", this involves also that the buyer handles in a
reliable way, therefore reliability needs to be related to operative excellence as well.179
In the
revised reproduced model this is shown in a figure. See for the full revised reproduced model
appendix F.
In the next section the effect of supplier importance, derived from the Kraljic-matrix (1983),
on the antecedents of supplier satisfaction will be analysed.
179
See Hüttinger et al. (2014), p. 703.
52
5.3 Supplier importance has a positive effect on reliability and relational
behaviour
The first set of hypotheses in section 3 was related to the effect of supplier importance, related
to the Kraljic-matrix (1983), on the antecedents of supplier satisfaction. The theory suggested
that when a supplier is of higher importance for a buying company, the buying company does
not want to lose their important suppliers and is likely to put more effort in the buyer-supplier
relationship.180
This increased effort can become visible in a higher level of relational
behaviour and operative excellence, both first-tier antecedents of supplier satisfaction.
Hypothesis 1 and hypothesis 2 tested this assumption. A PLS-SEM was performed with a
bootstrap of 5000 samples. Bootstrapping is necessary, since PLS-SEM does not presume that
the data is normally distributed. Bootstrapping creates a large, pre-specified number of
bootstrap samples (5000) by randomly drawing cases with replacement from the original
sample, creating a normally distributed dataset suitable for analysis.181
. The R2 value
describes the amount of variation the model explains compared to the variation in the data. A
low value is, however, not necessarily a bad thing.182
What is considered as a high value, also
depends. A R2 of 0,20 is considered high in for example consumer behaviour studies, whereas
in marketing research values of 0,75, 0,50 and 0,25 are described as substantial, moderate,
and weak, respectively.183
Another and much more clearer way to assess the model, involves the model's capability to
predict. This is done via the Stone-Geisser's Q2.184
The Q2
value is obtained using a
blindfolding procedure, a technique that excludes a part of the data and uses the rest of the
data to predict the excluded part. A value larger than zero for an endogenous variable means
that its explanatory latent construct has predictive relevance.185
Both relational behaviour
(0,05) and operative excellence (0,01) have a Q2
value of above zero, meaning that supplier
importance is relevant for both relational behaviour and operative excellence. A path
coefficient of 0,32 indicates that 32% of the variance in the latent variable is caused by the
independent variable. As shown in figure 9 on the next page, the path coefficients for the first
two hypotheses are 0,32 and 0,14, respectively. However, the relation between supplier
180
See Lindwall et al. (2010), p. 14. 181
See Hair et al. (2011), p. 148. 182
See Heinzl and Mittlböck (2003), p. 270. 183
See Hair et al. (2011), p. 147. 184
See Stone (1974) and Geisser (1974), cited by: Hair et al. (2011), p. 147. 185
See Hair et al. (2011), p. 147.

53
importance and relational behaviour has a p-value of < 0,01, which means that the relation is
significant and not based on coincidence. The relation between supplier importance and
operative excellence, on the other hand, has a p-value of > 0,1, meaning that this relationship
cannot be considered as significant. Therefore hypothesis 1 is supported and hypothesis 2 is
not supported. Figure 10, below, shows the results of testing hypothesis 1 and hypothesis 2.
Figure 10: The relation between supplier importance and relational behaviour/operative
excellence.
The second set of hypotheses examines the relation between supplier importance, in terms of
the Kraljic-matrix (1983), and the second-tier antecedents of supplier satisfaction. These
antecedents are support, involvement and reliability, and are all three related to the first-tier
antecedent relational behaviour. Contact accessibility is related to the first-tier antecedent of
operative excellence. Hypotheses 3a, 3b, 3c and 3d tested the assumptions derived from the
theory section, that an increased level of supplier importance results in higher efforts in the
buyer-supplier relationship, resulting in higher levels of support, involvement, reliability and
contact accessibility, perceived by the supplier.
Figure 11, on the next page, shows the results of the PLS-SEM test with a bootstrap of 5000
samples. From the four relations tested, only the relation between supplier importance and
reliability showed a strong and significant relationship (p < 0.01). Therefore hypothesis 3c is

54
supported and hypotheses 3a, 3b and 3d are not supported. Despite low R2 values, all Q
2
values, except for the variable of involvement, are above zero, meaning, that the influence of
supplier importance on these variables is relevant.
Testing hypothesis 1 and hypothesis 3c at the same time shows a strong relation between
supplier importance and reliability (.29, p < 0.01), and a strong relation between reliability
and relational behaviour (.57, p < 0.01), but a non-significant relation between supplier
importance and relational behaviour (.12, p > 0.1). These relations stay the same when the
other second-tier antecedents (support, involvement, and contact accessibility) are added to
the model. This extended model can be found in appendix G. Figure 12 on the next page
shows only the relation between supplier importance, reliability, and relational behaviour. All
Q2 values are above zero. It can therefore be concluded that supplier importance has a strong
effect on the second-tier antecedent of reliability and that thus buying companies tend to be
more reliable towards more important suppliers.
Figure 11: The relation between supplier importance and support, involvement, reliability,
and contact accessibility.

55
Figure 12: The adjusted relations between supplier importance, reliability, and relational
behaviour.
Now the effect of supplier importance on the antecedents of supplier satisfaction is known, it
is time to look further into the next objective of this research; the effect of buyer importance.
In the next section the theory of the "Dutch Windmill" developed by Van Weele (2009) in
relation to preferred customer status will be empirically tested and further explored.186
186
See van Weele (2009), p. 200/202.

56
5.4 Buyer importance has a direct influence on becoming the preferred
customer
In the theory section and in the part where the hypotheses were developed the theory for
buyer importance was introduced. The "Dutch Windmill" theory developed by Van Weele
(2009) uses a dyadic approach to the Kraljic-matrix (1983).187188
Previously, the buyer-
supplier relationship was solely viewed from the buyer's perspective. It is however possible
that a supplier is a strategic supplier for the buying company, but that the buying company is
not at all strategic for the supplier. The example from the hypothesis section illustrates this
clearly. A medium-sized IT company might be having a multinational company as Microsoft
or IBM as a strategic supplier, but for Microsoft or IBM this company is just too small, which
means that despite all the good relational behaviour, contact accessibility or even growth
opportunity, this IT company will never become the preferred customer of Microsoft or IBM.
The same holds the other way round. A small supplier supplying solely to one customer is
fully dependent on this customer and will see it automatically as its preferred customer,
despite maybe bad relational behaviour, low contact accessibility, and maybe even negative
growth opportunities.
Van Weele (2009) extended the Kraljic-matrix (1983) by adding two extra axes which among
the buying firms can be ranked; customer attractiveness and profitability for the supplier.189
Profitability was previously linked to supplier satisfaction, but in this research not found to
have significant influence. Therefore, in this research it is combined with customer
attractiveness and directly linked to becoming the preferred customer. This research is the
first research to empirically testing the "Dutch Windmill" model and to test a form of buyer
importance in relation to already extensive preferred customer research. The hypothesis
related to this topic is hypothesis 4 and was constructed as follows: If the buyer is of high
importance to the supplier, the supplier is more likely to award the buyer the preferred
customer status.
187
See van Weele (2009), p. 200/202. 188
See Kraljic (1983), p. 111. 189
See van Weele (2009), p. 200/202.
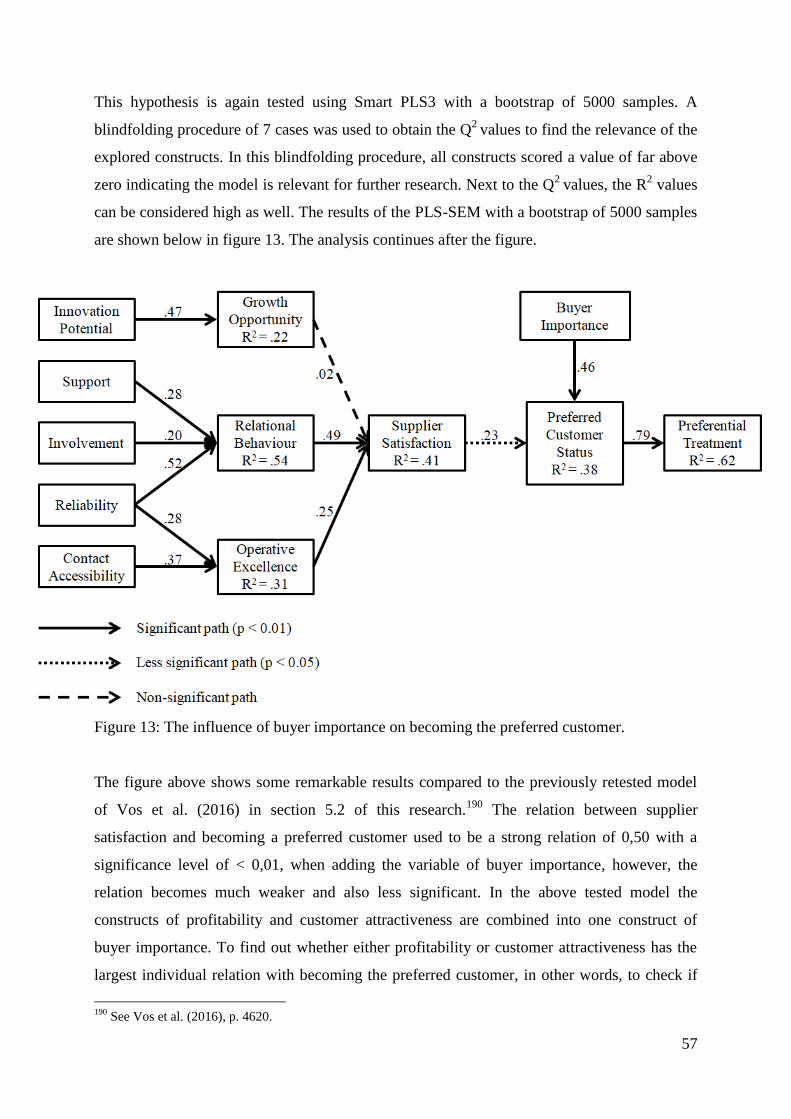
57
This hypothesis is again tested using Smart PLS3 with a bootstrap of 5000 samples. A
blindfolding procedure of 7 cases was used to obtain the Q2
values to find the relevance of the
explored constructs. In this blindfolding procedure, all constructs scored a value of far above
zero indicating the model is relevant for further research. Next to the Q2
values, the R2 values
can be considered high as well. The results of the PLS-SEM with a bootstrap of 5000 samples
are shown below in figure 13. The analysis continues after the figure.
Figure 13: The influence of buyer importance on becoming the preferred customer.
The figure above shows some remarkable results compared to the previously retested model
of Vos et al. (2016) in section 5.2 of this research.190
The relation between supplier
satisfaction and becoming a preferred customer used to be a strong relation of 0,50 with a
significance level of < 0,01, when adding the variable of buyer importance, however, the
relation becomes much weaker and also less significant. In the above tested model the
constructs of profitability and customer attractiveness are combined into one construct of
buyer importance. To find out whether either profitability or customer attractiveness has the
largest individual relation with becoming the preferred customer, in other words, to check if
190
See Vos et al. (2016), p. 4620.

58
the high path coefficient in relation of buyer importance with preferred customer is not caused
by one of the two construct, both constructs are also tested separately in relation with
becoming the preferred customer. In figure 14, below, the results of this separate testing are
shown. Both profitability and customer attractiveness have a high path coefficient in relation
to becoming the preferred customer: 0,31 and 0.30 respectively (p < 0,01). The final check for
determining the direct effect of buyer importance is to analyse a possible moderation effect of
buyer importance. It might still be possible that buyer importance influences the relation
between supplier satisfaction and becoming the preferred customer, but that it has no direct
effect itself. However, the moderating effect is found very low (0,06) and cannot be
considered significant (p > 0,1). The results of this additional test can be found in appendix H.
The conclusion that can be drawn is that buyer importance has a major influence on becoming
the preferred customer of a supplier, therefore hypothesis 4 is supported.
Figure 14: Separately testing the effects of profitability and customer attractiveness.

59
In the model by Vos et al. (2016), growth opportunity used to have a weak but nevertheless
significant relationship with supplier satisfaction, 0,13 and 0,15 for respectively, both direct
and indirect procurement.191
In the retested version of the model, as presented in section 5.2,
both growth opportunity and profitability was found insignificant in relation to supplier
satisfaction. As discussed above, profitability was found to have a strong and significant
relation as a construct of buyer importance. However, still the deviation with the aspect of
growth opportunity remains. To find out if there is any other relation between growth
opportunity and other aspects of the preferred customer model, some additional testing with
Smart PLS3 is necessary. Since buyer importance is found to be an important antecedent for
becoming the preferred customer and receiving a preferential treatment, it can be expected
that growth opportunity is related to buyer importance. If a buying company can grow in the
nearby future, the profitability is also likely to grow, and with that, also the attractiveness of
that buying firm increases. Figure 15 tests this possible relation. The analysis continues after
the figure.
Figure 15: Testing the effect of growth opportunity on buyer importance.
191
See Vos et al. (2016), p. 4620.
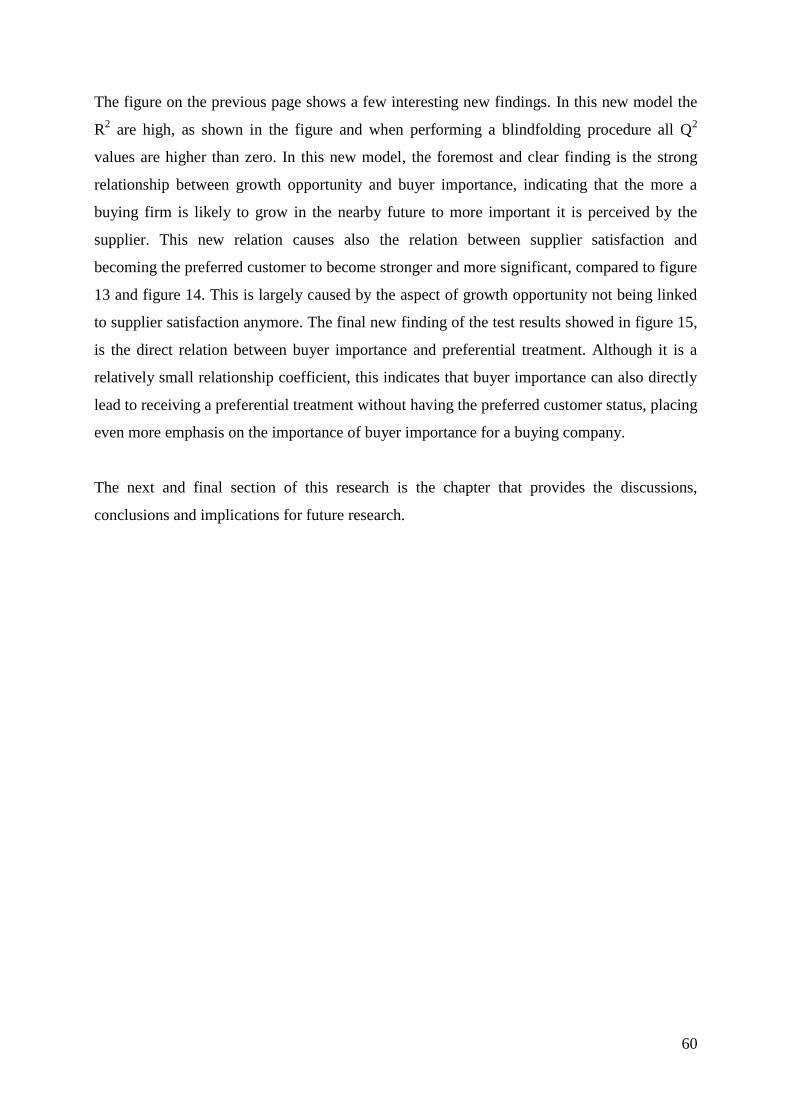
60
The figure on the previous page shows a few interesting new findings. In this new model the
R2 are high, as shown in the figure and when performing a blindfolding procedure all Q
2
values are higher than zero. In this new model, the foremost and clear finding is the strong
relationship between growth opportunity and buyer importance, indicating that the more a
buying firm is likely to grow in the nearby future to more important it is perceived by the
supplier. This new relation causes also the relation between supplier satisfaction and
becoming the preferred customer to become stronger and more significant, compared to figure
13 and figure 14. This is largely caused by the aspect of growth opportunity not being linked
to supplier satisfaction anymore. The final new finding of the test results showed in figure 15,
is the direct relation between buyer importance and preferential treatment. Although it is a
relatively small relationship coefficient, this indicates that buyer importance can also directly
lead to receiving a preferential treatment without having the preferred customer status, placing
even more emphasis on the importance of buyer importance for a buying company.
The next and final section of this research is the chapter that provides the discussions,
conclusions and implications for future research.

61
6. Discussion, conclusions and implications for future research
6.1 Discussion This research tried to make several contributions to the current literature in the field of
purchasing and supply chain management, and to give practical implications for purchasing
managers. The first contribution was to reproduce the model of Vos et al. (2016) in a different
context.192
Second, this research was performed within two companies, one large company
and one medium-sized company. The differences in supplier relationship management are
addressed. Third, different type of suppliers require different types of buyer-supplier
relationships, this research investigates the Kraljic-matrix (1983) and its influence on supplier
satisfaction.193
The fourth and final contribution is testing the effect of the "Dutch Windmill"
on becoming the preferred customer.194
The full model developed by Vos et al. (2016) derived from Hüttinger et al. (2014), tested the
antecedents of supplier satisfaction in relation to achieving the preferred customer status and
receiving a preferential treatment.195196
The original research was performed in the context of
a major German automotive and a major German chemical company.197
This research used
data collected via a survey from a major Dutch energy company and a medium-sized
specialised water company, with a total of 149 useful responses. Most significant relations
found by Vos et al. (2016) were found similar in this research, except for the relations of both
profitability and growth opportunity with supplier satisfaction. The construct of profitability
was found to have a direct relationship with becoming the preferred customer instead of
indirectly via supplier satisfaction, further discussed with the "Dutch Windmill" discussion.
Growth opportunity was found to have a relatively low impact on supplier satisfaction in the
revised model of Vos et al. (2016), 0,13 and 0,15 for respectively, both direct and indirect
procurement. It might therefore be that in a different context, for example, different types of
companies and different countries in which the analysis took place, this relation becomes even
weaker and less significant. However, linking growth opportunity to buyer importance
showed a really strong relationship, indicating that the more a buying firm is likely to grow in
the nearby future, the more it is perceived to be important by the supplier. This research also
192
See Vos et al. (2016), p. 4620. 193
See Kraljic (1983), p. 111. 194
See van Weele (2009), p. 200/202. 195
See Vos et al. (2016), p. 4620. 196
See Hüttinger et al. (2014), p. 703. 197
See Vos et al. (2016), p. 4616.

62
linked the concept of reliability to not only relational behaviour, but also to operative
excellence. This new link between existing constructs showed a strong and significant relation
between reliability and operative excellence, showing that high levels of operative excellence
is not only caused by high levels of contact accessibility, but also by reliable behaviour from
the buyer's side.
Most previous research towards supplier satisfaction, becoming the preferred customer, and
receiving a preferential treatment, was performed in the context of large companies.198
This
research was performed in the context of both a large company and a medium-sized company.
In this research the energy company was the large company and the water company, on the
other hand, was the medium-sized company. The differences between the two companies tend
to be smaller than one would expect on beforehand. Next to the obvious difference in average
spend between the two companies, the results showed that the large company has on average
longer relationships. This might be caused by the more extensive purchasing department with
more people and time to invest in relationship management. It might also be the cause for the
slightly higher scores on becoming the preferred customer for the large company compared to
the medium-sized company. The most notable difference between the two companies is the
response rate for the survey. The response rates were 52,2 per cent for the energy company
compared to 7,6 per cent for the water company. This is partly caused by the way of sending
out the inventations, to be discussed more thoroughly in the implications for future research,
but also often caused by the water company, as a buying company, just being too small. Many
suppliers indicated via email, telephone or via the survey server that they knew not enough
about the buying company to fill in a fifteen minute survey about the buyer-supplier
relationship.
The third objective of this research was to link the theory for supplier importance, derived
from Kraljic (1983), to the theory of supplier satisfaction in relation to becoming the preferred
customer and receiving a preferential treatment. The theory suggested that buying companies
will put more effort in the buyer-supplier relationship with more important resulting in
peceived higher levels of support, involvement, reliability, and contact accessibility. Although
three of the four relations were not found to have a significant influence, a strong relationship
between supplier importance and reliability was found. This indicates that when the supplier
198
See Steinle and Schiele (2008), Schiele et al. (2011), Hüttinger et al. (2012), Hüttinger et al. (2014), Pulles et
al. (2016), Vos et al. (2016).
63
is of high importance for the buyer, the buying company will foremost make sure that it
provides reliable information to the supplier and that agreements between buyer and supplier
are treated in a fair way.
The fourth, final and most important contribution is the influence of buyer importance on the
concept of becoming the preferred customer and receiving a preferential treatment. Buyer
importance in this research is defined as a combination of profitability and customer
attractiveness. The "Dutch Windmill" model, developed by Van Weele (2009), is the ground
theory for analysing this view on the buyer-supplier relationship. The results of the analysis
showed a large influence (β = 0.46; p < 0,01) of buyer importance on becoming a preferred
customer and receiving a preferential treatment. Both profitability and customer attractiveness
showed a large influence on becoming the preferred customer. Interesting to see is the effect
of adding buyer importance to the model on the relationship between supplier satisfaction and
becoming the preferred customer. Reproducing the model of Vos et al. (2016) without buyer
importance, showed a high relationship of 0,50 (p < 0,01). But when buyer importance is
added, the beta value of the relationship between supplier satisfaction and preferred customer
lowers to 0,23 and becomes less significant (p < 0,05). This indicates that the importance of
the buyer has a much higher influence, than the level of satisfaction of the supplier.
64
6.2 Conclusions
This research has made several contributions to the field of purchasing and supply chain
management, for both researchers in this field and purchasing managers and specialists
dealing with buyer-supplier relationships. Next to a more thorough understanding of
purchasing and the concepts of supplier satisfaction, becoming the preferred customer and
receiving a preferential treatment, this research also performed some empirical contributions
to this field. Four conclusions from this empirical research can be drawn.
The first conclusion that can be drawn is that the construct of reliability does not only have an
influence on relational behaviour, but also on operative excellence (β = 0,28; p < 0,01).
Second, the difference in buyer-supplier relationships between large companies and SMEs is
further investigated, although some differences were found, the only convincing differences
are: the length of the average buyer-supplier relationship, the average value of the buyer-
supplier relationship, and foremost, the response rate of the surveys that have been returned.
The effect of supplier importance on the antecedents of supplier satisfaction is the third
contribution. Although at first, a strong relationship was found between supplier importance
and relational behaviour, supporting hypothesis 1, introducing the second-tier antecedent of
reliability showed that only an indirect effect on supplier satisfaction exists, supporting only
hypothesis 3c. Introducing the concept of buyer importance made a huge change in the model
of Vos et al. (2016) and is the fourth contribution of this research. Next to the first empirical
evidence for the "Dutch Windmill", by Van Weele (2009), the analysis showed that although
supplier satisfaction still has an influence on becoming the preferred customer, buyer
importance has a much higher influence on becoming the preferred customer. Next to
profitability and customer attractiveness, growth opportunity has a strong influence on buyer
importance. For managers this means that, next to satisfying the suppliers, they also have to
invest time and money in becoming more important for the suppliers in order to benefit from
being the preferred customer. To quote a famous German artist: "It is nice to be important, but
it is more important to be nice." In purchasing, however, one could say: "It is important to be
nice, but it is nicer to be important."
65
6.3 Limitations and implications for future research
As for almost every academic research, this research also has its limitations. The most
influencing limitation is considered to be the non-response bias. This is especially the case for
the water specialised company, where the response rate was only 7,6 per cent. It might be that
only the suppliers who are most satisfied with the buyer-supplier relationship, take the effort
to fill in the fifteen minute during questionnaire. But also for the energy company, with an
extreme high response rate of 52,2 per cent, the data is dealing with this non-response bias,
since the invitation for the survey was only sent to a selection of suppliers. These were the
suppliers of whom the full and direct contact details were available. Second, although,
suppliers have been told that their answers were made anonymous for the buying company,
they still might have given socially desired answers to avoid harm to the buyer-supplier
relationship. The final limitation that might influenced the quality of the dataset involved the
length of the questionnaire. Some suppliers complained about that the questionnaire was
taking too long, around fifteen minutes. This could be an indication that in the end of the
questionnaire, the respondents did not answered the questions properly, but more or less
hurried towards the end.
For future research in this field, the advice could therefore be given, to reduce the length of
the questionnaire by removing questions that will not be used in the final analysis. One of the
reasons, not mentioned before, for the high response among the energy company is the
cooperation of the buying company. In the research with the water company the invitation for
the questionnaire was send from a student email account to largely info@ mail addresses from
suppliers. The research within the energy company was coordinated and send by the CPO of
the buying company to mostly direct mail addresses of the key account managers of the
suppliers. In the introduction to the research the CPO emphasised on the importance of the
research. This resulted in a high response and questions from the suppliers indicating that they
took this research very serious. To future research it is strongly recommended to have
involvement from the buying company to have high response rates. To extend the literature, it
is interesting to see whether the assumptions made in this will hold in different contexts. Next
to this, the "Dutch Windmill" needs further exploration to be considered as a solid theory for
assessing buyer-supplier relations.

66
7. References
1. Abdi, H. (2003). Factor rotations in factor analyses. Encyclopedia for Research
Methods for the Social Sciences. Sage: Thousand Oaks, CA, 792-795.
2. Anderson, J. C., & Narus, J. A. (1990). A Model of Distributor Firm and Manufacturer
Firm Working Partnerships. Journal of Marketing, 54(1), 42-58. doi:10.2307/1252172
3. Ansoff, H. I., & Brandenburg, R. G. (1971). A Language for Organization Design:
Part II. Management Science, 17(12), B-717-B-731. doi:10.1287/mnsc.17.12.B717
4. Ansoff, H. I., & Leontiades, J. C. (1976). Strategic portfolio management. Journal of
General Management, 4(1), 13-29.
5. Arend, R. J. (2006). SME–supplier alliance activity in manufacturing: contingent
benefits and perceptions. Strategic management journal, 27(8), 741-763.
doi:10.1002/smj.538
6. Arend, R. J., & Wisner, J. D. (2005). Small business and supply chain management: is
there a fit? Journal of Business Venturing, 20(3), 403-436.
doi:https://doi.org/10.1016/j.jbusvent.2003.11.003
7. Bagozzi, R. P., & Yi, Y. (1988). On the evaluation of structural equation models.
Journal of the Academy of Marketing Science, 16(1), 74-94.
8. Barney, J. (1991). Firm resources and sustained competitive advantage. Journal of
management, 17(1), 99-120.
9. Bemelmans, J., Voordijk, H., Vos, B., & Dewulf, G. (2015). Antecedents and benefits
of obtaining preferred customer status: Experiences from the Dutch construction
industry. International Journal of Operations & Production Management, 35(2), 178-
200. doi:doi:10.1108/IJOPM-07-2012-0263
10. Bensaou, M. (1999). Portfolios of buyer-supplier relationships. MIT Sloan
Management Review, 40(4), 35.
67
11. Benton, W. C., & Maloni, M. (2005). The influence of power driven buyer/seller
relationships on supply chain satisfaction. Journal of Operations Management, 23(1),
1-22. doi:http://dx.doi.org/10.1016/j.jom.2004.09.002
12. Blenkhorn, D. L., & Banting, P. M. (1991). How reverse marketing changes buyer—
seller roles. Industrial Marketing Management, 20(3), 185-191.
doi:http://dx.doi.org/10.1016/0019-8501(91)90016-9
13. Campbell, N. C., & Cunningham, M. T. (1983). Customer analysis for strategy
development in industrial markets. Strategic management journal, 4(4), 369-380.
14. Caniels, M. C. J., & Gelderman, C. J. (2005). Purchasing strategies in the Kraljic
matrix—A power and dependence perspective. Journal of Purchasing and Supply
Management, 11(2), 141-155.
15. Caniëls, M. C. J., & Gelderman, C. J. (2007). Power and interdependence in buyer
supplier relationships: A purchasing portfolio approach. Industrial Marketing
Management, 36(2), 219-229.
16. Caniëls, M. C. J., Vos, F. G. S., Schiele, H., & Pulles, N. J. (2017). The effects of
balanced and asymmetric dependence on supplier satisfaction: Identifying positive
effects of dependency. Journal of Purchasing and Supply Management.
doi:https://doi.org/10.1016/j.pursup.2017.11.003
17. Capon, N., Farley, J. U., & Hulbert, J. M. (1987). Corporate strategic planning:
Columbia University Press.
18. Carr, A. S., & Pearson, J. N. (1999). Strategically managed buyer–supplier
relationships and performance outcomes. Journal of Operations Management, 17(5),
497-519. doi:https://doi.org/10.1016/S0272-6963(99)00007-8
19. Chen, I. J., Paulraj, A., & Lado, A. A. (2004). Strategic purchasing, supply
management, and firm performance. Journal of Operations Management, 22(5), 505-
523. doi:https://doi.org/10.1016/j.jom.2004.06.002
20. Chopra, S., & Meindl, P. (2007). Supply chain management. Strategy, planning &
operation. In Das summa summarum des management (pp. 265-275): Springer.
68
21. Clark, L. A., & Watson, D. (1995). Constructing validity: Basic issues in objective
scale development. Psychological assessment, 7(3), 309-319.
22. Daft, R. L., Murphy, J., & Willmott, H. (2010). Organization theory and design:
Cengage learning EMEA.
23. De Boer, L., Labro, E., & Morlacchi, P. (2001). A review of methods supporting
supplier selection. European Journal of Purchasing & Supply Management, 7(2), 75-
89.
24. De Winter, J. C., & Dodou, D. (2012). Factor recovery by principal axis factoring and
maximum likelihood factor analysis as a function of factor pattern and sample size.
Journal of Applied Statistics, 39(4), 695-710.
25. Dowlatshahi, S. (1998). Implementing early supplier involvement: A conceptual
framework. International Journal of Operations & Production Management, 18(2),
143-167. doi:10.1108/01443579810193285
26. Dubinsky, A. J., & Ingram, T. N. (1984). A portfolio approach to account profitability.
Industrial Marketing Management, 13(1), 33-41.
27. Essig, M., & Amann, M. (2009). Supplier satisfaction: Conceptual basics and
explorative findings. Journal of Purchasing and Supply Management, 15(2), 103-113.
doi:http://dx.doi.org/10.1016/j.pursup.2009.01.001
28. Fiocca, R. (1982). Account portfolio analysis for strategy development. Industrial
Marketing Management, 11(1), 53-62. doi:https://doi.org/10.1016/0019-
8501(82)90034-7
29. Forker, L. B., & Stannack, P. (2000). Cooperation versus competition: do buyers and
suppliers really see eye-to-eye? European Journal of Purchasing & Supply
Management, 6(1), 31-40. doi:http://dx.doi.org/10.1016/S0969-7012(99)00032-5
30. Gann, D. M., & Salter, A. J. (2000). Innovation in project-based, service-enhanced
firms: the construction of complex products and systems. Research Policy, 29(7), 955-
972. doi:https://doi.org/10.1016/S0048-7333(00)00114-1
69
31. Geisser, S. (1974). A predictive approach to the random effect model. Biometrika,
61(1), 101-107.
32. Gelderman, C. J., & Semeijn, J. (2006). Managing the global supply base through
purchasing portfolio management. Journal of Purchasing and Supply Management,
12(4), 209-217.
33. Gelderman, C. J., & Van Weele, A. J. (2003). Handling measurement issues and
strategic directions in Kraljic's purchasing portfolio model. Journal of Purchasing and
Supply Management, 9(5), 207-216.
34. Gold, A. H., Malhotra, A., & Segars, A. H. (2001). Knowledge management: An
organizational capabilities perspective. Journal of management information systems,
18(1), 185-214.
35. Griffith, D. A., Harvey, M. G., & Lusch, R. F. (2006). Social exchange in supply chain
relationships: The resulting benefits of procedural and distributive justice. Journal of
Operations Management, 24(2), 85-98.
doi:http://dx.doi.org/10.1016/j.jom.2005.03.003
36. Hair, J. F., Ringle, C. M., & Sarstedt, M. (2011). PLS-SEM: Indeed a Silver Bullet.
Journal of Marketing Theory and Practice, 19(2), 139-152. doi:10.2753/MTP1069-
6679190202
37. Hald, K. S., Cordón, C., & Vollmann, T. E. (2009). Towards an understanding of
attraction in buyer–supplier relationships. Industrial Marketing Management, 38(8),
960-970. doi:http://dx.doi.org/10.1016/j.indmarman.2008.04.015
38. Handfield, R. B., Ragatz, G. L., Petersen, K. J., & Monczka, R. M. (1999). Involving
Suppliers in New Product Development. California Management Review, 42(1), 59-
82.
39. Hax, A. C., & Majluf, N. S. (1983). The Use of the Growth-Share Matrix in Strategic
Planning. Interfaces, 13(1), 46-60. doi:10.1287/inte.13.1.46

70
40. Heinzl, H., & Mittlböck, M. (2003). Pseudo R-squared measures for Poisson
regression models with over- or underdispersion. Computational Statistics & Data
Analysis, 44(1), 253-271. doi:https://doi.org/10.1016/S0167-9473(03)00062-8
41. Henseler, J., Hubona, G., & Ray, P. A. (2016). Using PLS path modeling in new
technology research: updated guidelines. Industrial Management & Data Systems,
116(1), 2-20. doi:doi:10.1108/IMDS-09-2015-0382
42. Henseler, J., Ringle, C. M., & Sarstedt, M. (2015). A new criterion for assessing
discriminant validity in variance-based structural equation modeling. Journal of the
Academy of Marketing Science, 43(1), 115-135. doi:10.1007/s11747-014-0403-8
43. Hulland, J. (1999). Use of partial least squares (PLS) in strategic management
research: A review of four recent studies. Strategic management journal, 195-204.
44. Hüttinger, L., Schiele, H., & Schröer, D. (2014). Exploring the antecedents of
preferential customer treatment by suppliers: a mixed methods approach. Supply
Chain Management: An International Journal, 19(5/6), 697-721.
45. Hüttinger, L., Schiele, H., & Veldman, J. (2012). The drivers of customer
attractiveness, supplier satisfaction and preferred customer status: A literature review.
Industrial Marketing Management, 41(8), 1194-1205.
46. Jap, S. D. (2001). “Pie Sharing” in Complex Collaboration Contexts. Journal of
Marketing Research, 38(1), 86-99. doi:10.1509/jmkr.38.1.86.18827
47. Johnsen, T. E. (2009). Supplier involvement in new product development and
innovation: Taking stock and looking to the future. Journal of Purchasing and Supply
Management, 15(3), 187-197.
48. Jokela, P., & Söderman, A. (2017). Re-examining the link between fairness and
commitment in buyer-supplier relationships. Journal of Purchasing and Supply
Management, 23(4), 268-279. doi:https://doi.org/10.1016/j.pursup.2017.08.003
49. Kamann, D.-J. F., & Bakker, E. F. (2004). Changing supplier selection and
relationship practices: a contagion process. Journal of Purchasing and Supply
Management, 10(2), 55-64. doi:http://doi.org/10.1016/j.pursup.2003.12.002

71
50. Karlsson, C., & Olsson, O. (1998). Product Innovation in Small and Large Enterprises.
Small Business Economics, 10(1), 31-46. doi:10.1023/a:1007970416484
51. Kim, J.-I., & Shunk, D. L. (2004). Matching indirect procurement process with
different B2B e-procurement systems. Computers in Industry, 53(2), 153-164.
doi:https://doi.org/10.1016/j.compind.2003.07.002
52. Kline, R. (2011). Principles and Practice of Structural Equation Modeling, 3rd edn
Guilford Press. New York.
53. Knight, L., Tu, Y.-H., & Preston, J. (2014). Integrating skills profiling and purchasing
portfolio management: An opportunity for building purchasing capability.
International Journal of Production Economics, 147, 271-283.
doi:https://doi.org/10.1016/j.ijpe.2013.06.013
54. Kraljic, P. (1983). Purchasing must become supply management. Harvard business
review, 61(5), 109-117.
55. Krause, D. R., & Ellram, L. M. (1997). Success factors in supplier development.
International Journal of Physical Distribution & Logistics Management, 27(1), 39-52.
56. Krause, D. R., Vachon, S., & Klassen, R. D. (2009). Introduction and Reflections on
the Role of Purchasing Management. Journal of Supply Chain Management, 45(4),
18-25. doi:10.1111/j.1745-493X.2009.03173.x
57. Lindwall, C., Ellmo, A., Rehme, J., & Kowalkowski, C. (2010). Increasing customer
attractiveness through upstream brand equity. Paper presented at the The International
IPSERA workshop on Customer attractiveness, supplier satisfaction and customer
value.
58. Luo, Y. (2009). From gain-sharing to gain-generation: The quest for distributive
justice in international joint ventures. Journal of International Management, 15(4),
343-356. doi:https://doi.org/10.1016/j.intman.2008.12.006
59. Luzzini, D., Amann, M., Caniato, F., Essig, M., & Ronchi, S. (2015). The path of
innovation: purchasing and supplier involvement into new product development.
72
Industrial Marketing Management, 47, 109-120.
doi:https://doi.org/10.1016/j.indmarman.2015.02.034
60. Luzzini, D., & Ronchi, S. (2011). Organizing the purchasing department for
innovation. Operations Management Research, 4(1), 14-27. doi:10.1007/s12063-010-
0042-2
61. McAdam, R., & Reid, R. (2001). SME and large organisation perceptions of
knowledge management: comparisons and contrasts. Journal of knowledge
Management, 5(3), 231-241. doi:doi:10.1108/13673270110400870
62. McDonald, R. P. (1996). Path Analysis with Composite Variables. Multivariate
Behavioral Research, 31(2), 239-270. doi:10.1207/s15327906mbr3102_5
63. Morrissey, W. J., & Pittaway, L. (2006). Buyer-supplier relationships in small firms:
the use of social factors to manage relationships. International Small Business
Journal, 24(3), 272-298.
64. Nollet, J., Rebolledo, C., & Popel, V. (2012). Becoming a preferred customer one step
at a time. Industrial Marketing Management, 41(8), 1186-1193.
doi:http://doi.org/10.1016/j.indmarman.2012.10.003
65. Nyaga, G. N., Whipple, J. M., & Lynch, D. F. (2010). Examining supply chain
relationships: Do buyer and supplier perspectives on collaborative relationships differ?
Journal of Operations Management, 28(2), 101-114.
doi:https://doi.org/10.1016/j.jom.2009.07.005
66. Olsen, R. F., & Ellram, L. M. (1997a). A portfolio approach to supplier relationships.
Industrial Marketing Management, 26(2), 101-113.
67. Olsen, R. F., & Ellram, L. M. (1997b). Buyer-supplier relationships: alternative
research approaches. European Journal of Purchasing & Supply Management, 3(4),
221-231. doi:https://doi.org/10.1016/S0969-7012(97)00022-1
68. Peteraf, M. A. (1993). The cornerstones of competitive advantage: a resource‐based
view. Strategic management journal, 14(3), 179-191.

73
69. Pottier, C. (1988). Local innovation and large firm strategies in Europe. Aydalot and
Keeble (eds.), 99-120.
70. Pulles, N. J., Schiele, H., Veldman, J., & Hüttinger, L. (2016). The impact of customer
attractiveness and supplier satisfaction on becoming a preferred customer. Industrial
Marketing Management, 54, 129-140.
doi:http://doi.org/10.1016/j.indmarman.2015.06.004
71. Quayle, M. (2003). A study of supply chain management practice in UK industrial
SMEs. Supply Chain Management: An International Journal, 8(1), 79-86.
doi:doi:10.1108/13598540310463387
72. Quintens, L., Pauwels, P., & Matthyssens, P. (2006). Global purchasing strategy:
Conceptualization and measurement. Industrial Marketing Management, 35(7), 881-
891. doi:https://doi.org/10.1016/j.indmarman.2006.05.009
73. Rothwell, R., & Zegveld, W. (1982). Innovation and the small and medium sized firm.
74. Schiele, H. (2007). Supply-management maturity, cost savings and purchasing
absorptive capacity: Testing the procurement–performance link. Journal of
Purchasing and Supply Management, 13(4), 274-293.
doi:http://dx.doi.org/10.1016/j.pursup.2007.10.002
75. Schiele, H., Calvi, R., & Gibbert, M. (2012). Customer attractiveness, supplier
satisfaction and preferred customer status: Introduction, definitions and an overarching
framework. Industrial Marketing Management, 41(8), 1178-1185.
doi:https://doi.org/10.1016/j.indmarman.2012.10.002
76. Schiele, H., Veldman, J., & Hüttinger, L. (2011). Supplier innovativeness and supplier
pricing: The role of preferred customer status. International Journal of Innovation
Management, 15(01), 1-27.
77. Shevlin, M., & Miles, J. N. V. (1998). Effects of sample size, model specification and
factor loadings on the GFI in confirmatory factor analysis. Personality and Individual
Differences, 25(1), 85-90. doi:https://doi.org/10.1016/S0191-8869(98)00055-5

74
78. Sprowls, R. C., & Asimow, M. (1962). A model of customer behavior for the Task
Manufacturing Corporation. Management Science, 8(3), 311-324.
79. Steinle, C., & Schiele, H. (2008). Limits to global sourcing?: Strategic consequences
of dependency on international suppliers: Cluster theory, resource-based view and
case studies. Journal of Purchasing and Supply Management, 14(1), 3-14.
80. Stone, M. (1974). Cross-validatory choice and assessment of statistical predictions.
Journal of the royal statistical society. Series B (Methodological), 111-147.
81. Telgen, J. (1994). Inzicht en overzicht: de uitdagingen van Besliskunde en
Inkoopmanagement: Universiteit Twente.
82. Telser, L. G. (1966). Cutthroat competition and the long purse. The Journal of Law
and Economics, 9, 259-277.
83. Teo, T. S., Srivastava, S. C., & Jiang, L. (2008). Trust and electronic government
success: An empirical study. Journal of management information systems, 25(3), 99-
132.
84. Trent, R. J. (2004). The use of organizational design features in purchasing and supply
management. Journal of Supply Chain Management, 40(2), 4-18.
85. Turnbull, P. W. (1990). A review of portfolio planning models for industrial
marketing and purchasing management. European Journal of marketing, 24(3), 7-22.
86. Uhl, C., Nabhani, F., Kauf, F., Shokri, A., & Hughes, D. (2017). Purchasing
Management: The Optimisation of Product Variance. Procedia Manufacturing, 11,
1366-1374. doi:https://doi.org/10.1016/j.promfg.2017.07.266
87. Vaaland, T. I., & Heide, M. (2007). Can the SME survive the supply chain challenges?
Supply Chain Management: An International Journal, 12(1), 20-31.
doi:doi:10.1108/13598540710724374
88. van Weele, A. J. (2009). Purchasing and Supply Chain Management: Analysis,
Strategy, Planning and Practice. Hampshire: Cengage Learning.
75
89. Vanpoucke, E., Vereecke, A., & Wetzels, M. (2014). Developing supplier integration
capabilities for sustainable competitive advantage: A dynamic capabilities approach.
Journal of Operations Management, 32(7–8), 446-461.
doi:http://doi.org/10.1016/j.jom.2014.09.004
90. Volkswagen, A. (2016). Facts and figures 2016. Retrieved from Wolfsburg:
91. Vos, F. G. S., Schiele, H., & Hüttinger, L. (2016). Supplier satisfaction: Explanation
and out-of-sample prediction. Journal of Business Research, 69(10), 4613-4623.
doi:http://dx.doi.org/10.1016/j.jbusres.2016.04.013
92. Wong, A. (2000). Integrating supplier satisfaction with customer satisfaction. Total
Quality Management, 11(4-6), 427-432.
93. Zaefarian, G., Najafi-Tavani, Z., Henneberg, S. C., & Naudé, P. (2016). Do supplier
perceptions of buyer fairness lead to supplier sales growth? Industrial Marketing
Management, 53, 160-171. doi:https://doi.org/10.1016/j.indmarman.2015.07.003
94. Zhu, Q., Dou, Y., & Sarkis, J. (2010). A portfolio-based analysis for green supplier
management using the analytical network process. Supply Chain Management: An
International Journal, 15(4), 306-319.

76
Appendix
Appendix A
Construct Code Survey question
Contact accessibility
There is a contact person within BuyingFirmXY who…
S_Available_10_1 …coordinates the relevant relationship activities within and outside of
BuyingFirmXY.
S_Available_10_2 …is, for the employees of our company, the one to contact in regard to partner-
specific questions.
S_Available_10_3 …informs employees within BuyingFirmXY firm about the needs of our company.
Growthpotential for your company
The relationship with BuyingFirmXY …
S_Growth_20_1 ... provides us with a dominant market position in our sales area.
S_Growth_20_2 ... is very important for us with respect to growth rates.
S_Growth_20_3 ... enables us to attract other customers.
S_Growth_20_4 ... enables us to exploit new market opportunities.
Innovation potential
S_InnovationPot_30_1 In collaborating with BuyingFirmXY, our firm developed a very high number of new
products/services.
S_InnovationPot_30_2 In collaborating with BuyingFirmXY, our firm was able to bring to market a very
high number of new products/services.
S_InnovationPot_30_3 The speed with which new products/services are developed and brought to market
with BuyingFirmXY is very high.
S_InnovationPot_30_5 BuyingFirmXY is able to anticipate competitors’ (technological) developments.
Customer's operative excellence
BuyingFirmXY…
S_OperativeExc_40_2 ... has always exact and in time forecasts about future demand.
S_OperativeExc_40_3 ... provides us with forecasts our firm can rely and plan on.
S_OperativeExc_40_4 ... has for our firm simple and transparent internal processes.
S_OperativeExc_40_5 ... supports short decision-making processes.
S_OperativeExc_40_7 … has an optimal payment habit.
Customer's reliability
In working with our company, BuyingFirmXY…
S_Collaboration_50_1 ... provided a completely truthful picture when negotiating.
S_Collaboration_50_2 ... always negotiated from a good faith bargaining perspective.
S_Collaboration_50_3 ... never breached formal or informal agreements to benefit themselves.
S_Collaboration_50_4 ... never altered facts in order to meet its own goals and objectives.
Support
BuyingFirmXY …
S_Support_60_1 ... collaborates with us to improve our manufacturing processes or services.
S_Support_60_2 ... gives us (technological) advice (e.g. on materials, software, way of working).
S_Support_60_3 ... gives us quality related advice (e.g. on the use of inspection equipment, quality
assurance procedures, service evaluation).
Development
BuyingFirmXY…
S_SupportNew_65_2 … invites us to visit their site to increase awareness of how our product /service is
used.
S_SupportNew_65_3 … conducted training and education programs for our personnel.
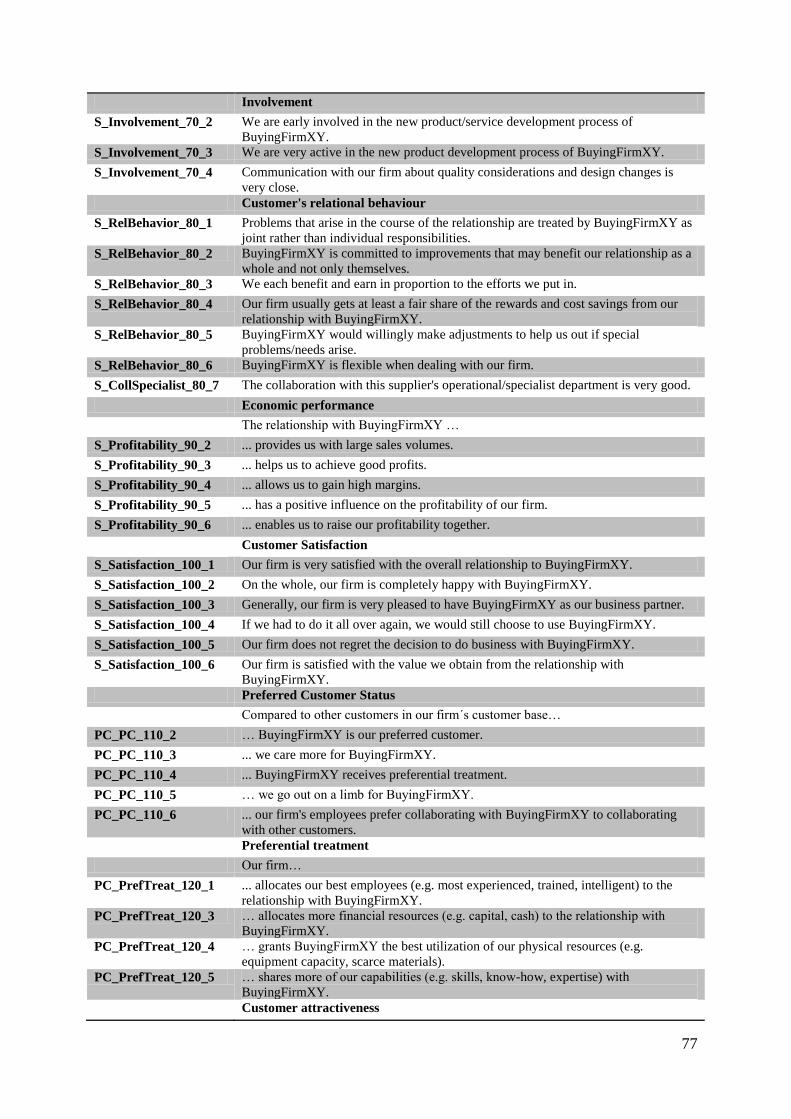
77
Involvement
S_Involvement_70_2 We are early involved in the new product/service development process of
BuyingFirmXY.
S_Involvement_70_3 We are very active in the new product development process of BuyingFirmXY.
S_Involvement_70_4 Communication with our firm about quality considerations and design changes is
very close.
Customer's relational behaviour
S_RelBehavior_80_1 Problems that arise in the course of the relationship are treated by BuyingFirmXY as
joint rather than individual responsibilities.
S_RelBehavior_80_2 BuyingFirmXY is committed to improvements that may benefit our relationship as a
whole and not only themselves.
S_RelBehavior_80_3 We each benefit and earn in proportion to the efforts we put in.
S_RelBehavior_80_4 Our firm usually gets at least a fair share of the rewards and cost savings from our
relationship with BuyingFirmXY.
S_RelBehavior_80_5 BuyingFirmXY would willingly make adjustments to help us out if special
problems/needs arise.
S_RelBehavior_80_6 BuyingFirmXY is flexible when dealing with our firm.
S_CollSpecialist_80_7 The collaboration with this supplier's operational/specialist department is very good.
Economic performance
The relationship with BuyingFirmXY …
S_Profitability_90_2 ... provides us with large sales volumes.
S_Profitability_90_3 ... helps us to achieve good profits.
S_Profitability_90_4 ... allows us to gain high margins.
S_Profitability_90_5 ... has a positive influence on the profitability of our firm.
S_Profitability_90_6 ... enables us to raise our profitability together.
Customer Satisfaction
S_Satisfaction_100_1 Our firm is very satisfied with the overall relationship to BuyingFirmXY.
S_Satisfaction_100_2 On the whole, our firm is completely happy with BuyingFirmXY.
S_Satisfaction_100_3 Generally, our firm is very pleased to have BuyingFirmXY as our business partner.
S_Satisfaction_100_4 If we had to do it all over again, we would still choose to use BuyingFirmXY.
S_Satisfaction_100_5 Our firm does not regret the decision to do business with BuyingFirmXY.
S_Satisfaction_100_6 Our firm is satisfied with the value we obtain from the relationship with
BuyingFirmXY.
Preferred Customer Status
Compared to other customers in our firm´s customer base…
PC_PC_110_2 … BuyingFirmXY is our preferred customer.
PC_PC_110_3 ... we care more for BuyingFirmXY.
PC_PC_110_4 ... BuyingFirmXY receives preferential treatment.
PC_PC_110_5 … we go out on a limb for BuyingFirmXY.
PC_PC_110_6 ... our firm's employees prefer collaborating with BuyingFirmXY to collaborating
with other customers.
Preferential treatment
Our firm…
PC_PrefTreat_120_1 ... allocates our best employees (e.g. most experienced, trained, intelligent) to the
relationship with BuyingFirmXY.
PC_PrefTreat_120_3 … allocates more financial resources (e.g. capital, cash) to the relationship with
BuyingFirmXY.
PC_PrefTreat_120_4 … grants BuyingFirmXY the best utilization of our physical resources (e.g.
equipment capacity, scarce materials).
PC_PrefTreat_120_5 … shares more of our capabilities (e.g. skills, know-how, expertise) with
BuyingFirmXY.
Customer attractiveness

78
These questions are about the expectations you have of the relationship with
BuyingFirmXY.
PC_Attractiveness_126
_1
We consider BuyingFirmXY to be an attractive partner for future collaborations.
PC_Attractiveness_126
_2
We expect positive outcomes from the relationship with BuyingFirmXY.
PC_Attractiveness_126
_3
Our firm has positive expectations about the value of the relationship with
BuyingFirmXY.
PC_Attractiveness_126
_4
We have a strong feeling that we need to compete in order to keep BuyingFirmXY as
a customer.
Length of relationship (in years)
LNGTH_Relationship_
230_1
How long has your company been a supplier of BuyingFirmXY?
LNGTH_SupplierOfB
_230_2
How long have you already been working as an employee of your firm?
LNGTH_EmployeeSup
plier_230_3
How long have you already been acting as a sales representative for your company?
LNGTH_SalesReprese
nt_230_4
How long have you, as a representative of your firm, already been cooperating with
BuyingFirmXY?
General information
ORG_Turnover_240_1 Annual Turnover (in €). (When you belong to a firm-group, please provide the
details of your firm branch!)
ORG_DepTurnover_2
40_2
Please indicate the annual turnover with BuyingFirmXY as % of your total annual
turnover.
Complexity
ORG_ProdComplexity
_244
The supplied product/service is very complex in relation to others that we produce

79
Appendix B
Independent Samples Test
Levene's Test
for Equality of
Variances
t-test for Equality of Means
F Sig. t df Sig. (2-
tailed)
Mean
Difference
Std. Error
Difference
95% Confidence
Interval of the
Difference
Lower Upper
LNGTH
Relationship_
230_1
Equal variances
assumed 2,444 0,120 2,921 143 0,004 7,411 2,537 2,396 12,425
Equal variances
not assumed 3,678 97,955 0,000 7,411 2,015 3,412 11,409
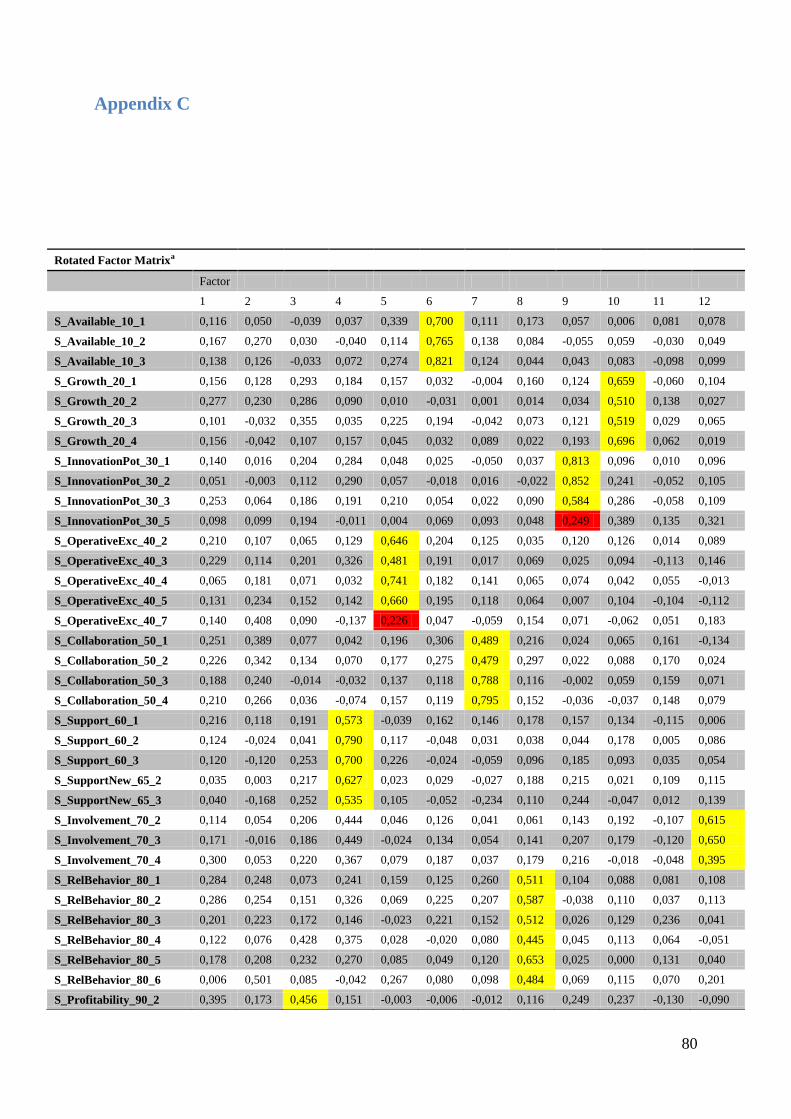
80
Appendix C
Rotated Factor Matrixa
Factor
1 2 3 4 5 6 7 8 9 10 11 12
S_Available_10_1 0,116 0,050 -0,039 0,037 0,339 0,700 0,111 0,173 0,057 0,006 0,081 0,078
S_Available_10_2 0,167 0,270 0,030 -0,040 0,114 0,765 0,138 0,084 -0,055 0,059 -0,030 0,049
S_Available_10_3 0,138 0,126 -0,033 0,072 0,274 0,821 0,124 0,044 0,043 0,083 -0,098 0,099
S_Growth_20_1 0,156 0,128 0,293 0,184 0,157 0,032 -0,004 0,160 0,124 0,659 -0,060 0,104
S_Growth_20_2 0,277 0,230 0,286 0,090 0,010 -0,031 0,001 0,014 0,034 0,510 0,138 0,027
S_Growth_20_3 0,101 -0,032 0,355 0,035 0,225 0,194 -0,042 0,073 0,121 0,519 0,029 0,065
S_Growth_20_4 0,156 -0,042 0,107 0,157 0,045 0,032 0,089 0,022 0,193 0,696 0,062 0,019
S_InnovationPot_30_1 0,140 0,016 0,204 0,284 0,048 0,025 -0,050 0,037 0,813 0,096 0,010 0,096
S_InnovationPot_30_2 0,051 -0,003 0,112 0,290 0,057 -0,018 0,016 -0,022 0,852 0,241 -0,052 0,105
S_InnovationPot_30_3 0,253 0,064 0,186 0,191 0,210 0,054 0,022 0,090 0,584 0,286 -0,058 0,109
S_InnovationPot_30_5 0,098 0,099 0,194 -0,011 0,004 0,069 0,093 0,048 0,249 0,389 0,135 0,321
S_OperativeExc_40_2 0,210 0,107 0,065 0,129 0,646 0,204 0,125 0,035 0,120 0,126 0,014 0,089
S_OperativeExc_40_3 0,229 0,114 0,201 0,326 0,481 0,191 0,017 0,069 0,025 0,094 -0,113 0,146
S_OperativeExc_40_4 0,065 0,181 0,071 0,032 0,741 0,182 0,141 0,065 0,074 0,042 0,055 -0,013
S_OperativeExc_40_5 0,131 0,234 0,152 0,142 0,660 0,195 0,118 0,064 0,007 0,104 -0,104 -0,112
S_OperativeExc_40_7 0,140 0,408 0,090 -0,137 0,226 0,047 -0,059 0,154 0,071 -0,062 0,051 0,183
S_Collaboration_50_1 0,251 0,389 0,077 0,042 0,196 0,306 0,489 0,216 0,024 0,065 0,161 -0,134
S_Collaboration_50_2 0,226 0,342 0,134 0,070 0,177 0,275 0,479 0,297 0,022 0,088 0,170 0,024
S_Collaboration_50_3 0,188 0,240 -0,014 -0,032 0,137 0,118 0,788 0,116 -0,002 0,059 0,159 0,071
S_Collaboration_50_4 0,210 0,266 0,036 -0,074 0,157 0,119 0,795 0,152 -0,036 -0,037 0,148 0,079
S_Support_60_1 0,216 0,118 0,191 0,573 -0,039 0,162 0,146 0,178 0,157 0,134 -0,115 0,006
S_Support_60_2 0,124 -0,024 0,041 0,790 0,117 -0,048 0,031 0,038 0,044 0,178 0,005 0,086
S_Support_60_3 0,120 -0,120 0,253 0,700 0,226 -0,024 -0,059 0,096 0,185 0,093 0,035 0,054
S_SupportNew_65_2 0,035 0,003 0,217 0,627 0,023 0,029 -0,027 0,188 0,215 0,021 0,109 0,115
S_SupportNew_65_3 0,040 -0,168 0,252 0,535 0,105 -0,052 -0,234 0,110 0,244 -0,047 0,012 0,139
S_Involvement_70_2 0,114 0,054 0,206 0,444 0,046 0,126 0,041 0,061 0,143 0,192 -0,107 0,615
S_Involvement_70_3 0,171 -0,016 0,186 0,449 -0,024 0,134 0,054 0,141 0,207 0,179 -0,120 0,650
S_Involvement_70_4 0,300 0,053 0,220 0,367 0,079 0,187 0,037 0,179 0,216 -0,018 -0,048 0,395
S_RelBehavior_80_1 0,284 0,248 0,073 0,241 0,159 0,125 0,260 0,511 0,104 0,088 0,081 0,108
S_RelBehavior_80_2 0,286 0,254 0,151 0,326 0,069 0,225 0,207 0,587 -0,038 0,110 0,037 0,113
S_RelBehavior_80_3 0,201 0,223 0,172 0,146 -0,023 0,221 0,152 0,512 0,026 0,129 0,236 0,041
S_RelBehavior_80_4 0,122 0,076 0,428 0,375 0,028 -0,020 0,080 0,445 0,045 0,113 0,064 -0,051
S_RelBehavior_80_5 0,178 0,208 0,232 0,270 0,085 0,049 0,120 0,653 0,025 0,000 0,131 0,040
S_RelBehavior_80_6 0,006 0,501 0,085 -0,042 0,267 0,080 0,098 0,484 0,069 0,115 0,070 0,201
S_Profitability_90_2 0,395 0,173 0,456 0,151 -0,003 -0,006 -0,012 0,116 0,249 0,237 -0,130 -0,090
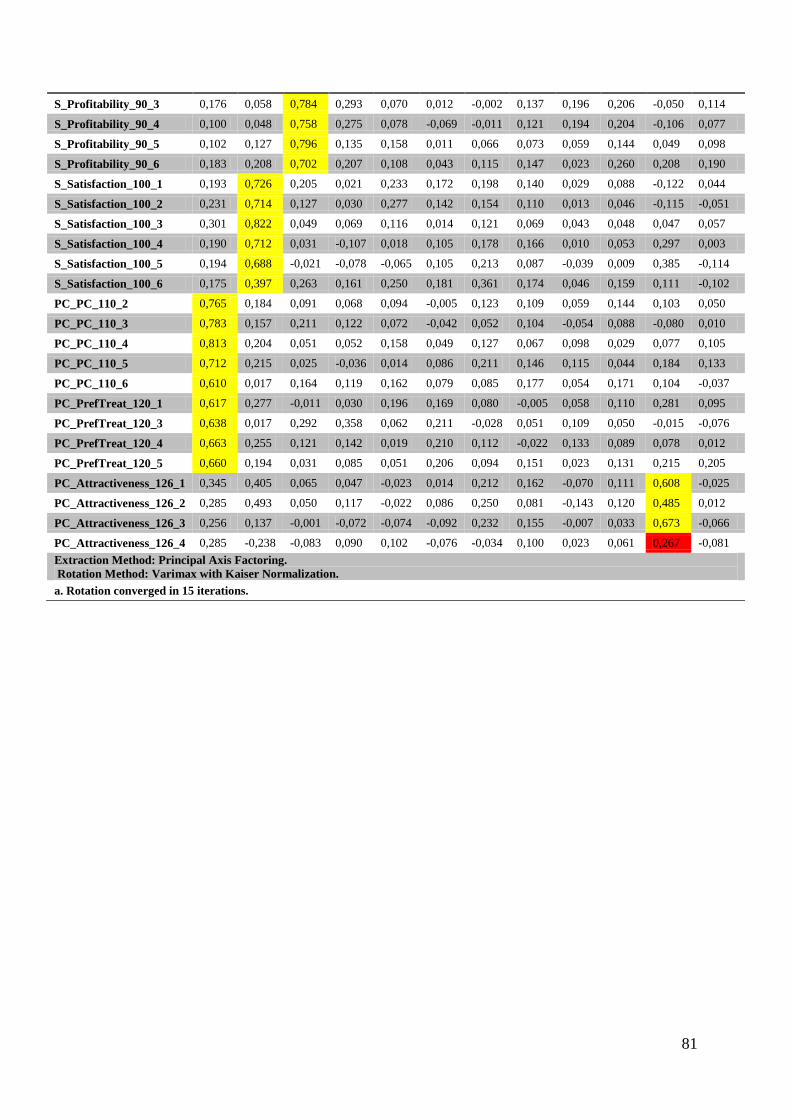
81
S_Profitability_90_3 0,176 0,058 0,784 0,293 0,070 0,012 -0,002 0,137 0,196 0,206 -0,050 0,114
S_Profitability_90_4 0,100 0,048 0,758 0,275 0,078 -0,069 -0,011 0,121 0,194 0,204 -0,106 0,077
S_Profitability_90_5 0,102 0,127 0,796 0,135 0,158 0,011 0,066 0,073 0,059 0,144 0,049 0,098
S_Profitability_90_6 0,183 0,208 0,702 0,207 0,108 0,043 0,115 0,147 0,023 0,260 0,208 0,190
S_Satisfaction_100_1 0,193 0,726 0,205 0,021 0,233 0,172 0,198 0,140 0,029 0,088 -0,122 0,044
S_Satisfaction_100_2 0,231 0,714 0,127 0,030 0,277 0,142 0,154 0,110 0,013 0,046 -0,115 -0,051
S_Satisfaction_100_3 0,301 0,822 0,049 0,069 0,116 0,014 0,121 0,069 0,043 0,048 0,047 0,057
S_Satisfaction_100_4 0,190 0,712 0,031 -0,107 0,018 0,105 0,178 0,166 0,010 0,053 0,297 0,003
S_Satisfaction_100_5 0,194 0,688 -0,021 -0,078 -0,065 0,105 0,213 0,087 -0,039 0,009 0,385 -0,114
S_Satisfaction_100_6 0,175 0,397 0,263 0,161 0,250 0,181 0,361 0,174 0,046 0,159 0,111 -0,102
PC_PC_110_2 0,765 0,184 0,091 0,068 0,094 -0,005 0,123 0,109 0,059 0,144 0,103 0,050
PC_PC_110_3 0,783 0,157 0,211 0,122 0,072 -0,042 0,052 0,104 -0,054 0,088 -0,080 0,010
PC_PC_110_4 0,813 0,204 0,051 0,052 0,158 0,049 0,127 0,067 0,098 0,029 0,077 0,105
PC_PC_110_5 0,712 0,215 0,025 -0,036 0,014 0,086 0,211 0,146 0,115 0,044 0,184 0,133
PC_PC_110_6 0,610 0,017 0,164 0,119 0,162 0,079 0,085 0,177 0,054 0,171 0,104 -0,037
PC_PrefTreat_120_1 0,617 0,277 -0,011 0,030 0,196 0,169 0,080 -0,005 0,058 0,110 0,281 0,095
PC_PrefTreat_120_3 0,638 0,017 0,292 0,358 0,062 0,211 -0,028 0,051 0,109 0,050 -0,015 -0,076
PC_PrefTreat_120_4 0,663 0,255 0,121 0,142 0,019 0,210 0,112 -0,022 0,133 0,089 0,078 0,012
PC_PrefTreat_120_5 0,660 0,194 0,031 0,085 0,051 0,206 0,094 0,151 0,023 0,131 0,215 0,205
PC_Attractiveness_126_1 0,345 0,405 0,065 0,047 -0,023 0,014 0,212 0,162 -0,070 0,111 0,608 -0,025
PC_Attractiveness_126_2 0,285 0,493 0,050 0,117 -0,022 0,086 0,250 0,081 -0,143 0,120 0,485 0,012
PC_Attractiveness_126_3 0,256 0,137 -0,001 -0,072 -0,074 -0,092 0,232 0,155 -0,007 0,033 0,673 -0,066
PC_Attractiveness_126_4 0,285 -0,238 -0,083 0,090 0,102 -0,076 -0,034 0,100 0,023 0,061 0,267 -0,081
Extraction Method: Principal Axis Factoring.
Rotation Method: Varimax with Kaiser Normalization.
a. Rotation converged in 15 iterations.
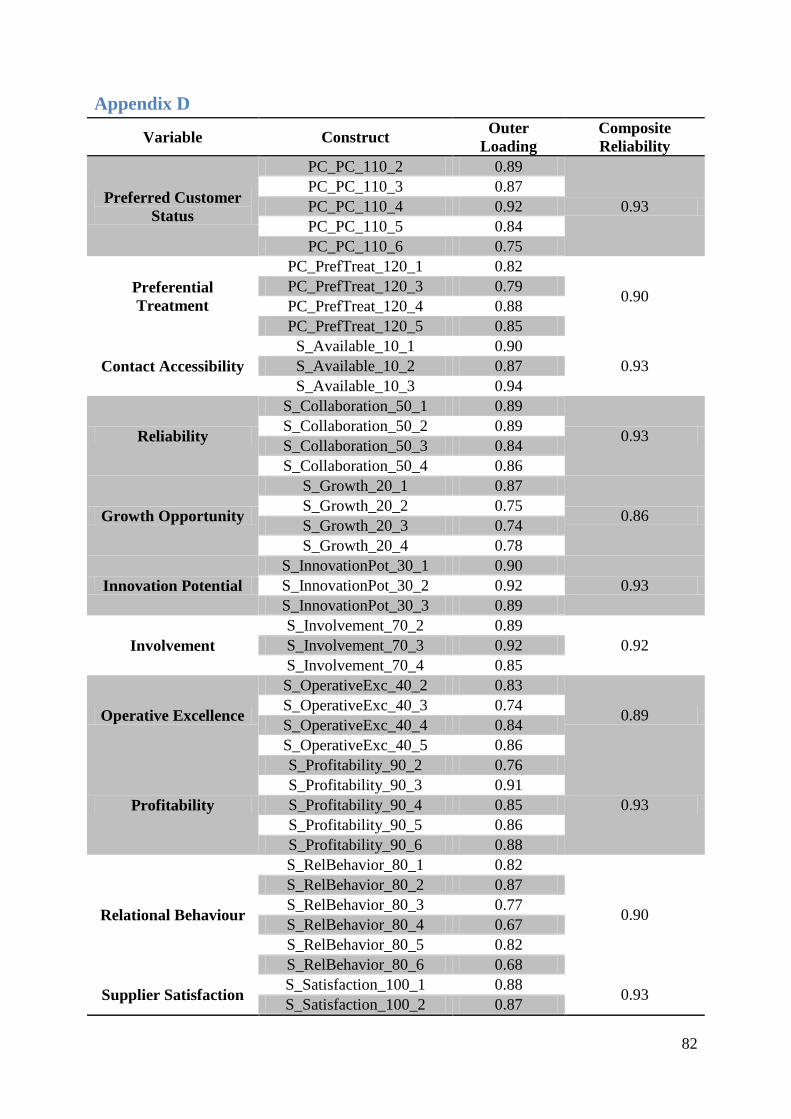
82
Appendix D
Variable Construct Outer
Loading
Composite
Reliability
Preferred Customer
Status
PC_PC_110_2 0.89
0.93
PC_PC_110_3 0.87
PC_PC_110_4 0.92
PC_PC_110_5 0.84
PC_PC_110_6 0.75
Preferential
Treatment
PC_PrefTreat_120_1 0.82
0.90 PC_PrefTreat_120_3 0.79
PC_PrefTreat_120_4 0.88
PC_PrefTreat_120_5 0.85
Contact Accessibility
S_Available_10_1 0.90
0.93 S_Available_10_2 0.87
S_Available_10_3 0.94
Reliability
S_Collaboration_50_1 0.89
0.93 S_Collaboration_50_2 0.89
S_Collaboration_50_3 0.84
S_Collaboration_50_4 0.86
Growth Opportunity
S_Growth_20_1 0.87
0.86 S_Growth_20_2 0.75
S_Growth_20_3 0.74
S_Growth_20_4 0.78
Innovation Potential
S_InnovationPot_30_1 0.90
0.93 S_InnovationPot_30_2 0.92
S_InnovationPot_30_3 0.89
Involvement
S_Involvement_70_2 0.89
0.92 S_Involvement_70_3 0.92
S_Involvement_70_4 0.85
Operative Excellence
S_OperativeExc_40_2 0.83
0.89 S_OperativeExc_40_3 0.74
S_OperativeExc_40_4 0.84
S_OperativeExc_40_5 0.86
Profitability
S_Profitability_90_2 0.76
0.93
S_Profitability_90_3 0.91
S_Profitability_90_4 0.85
S_Profitability_90_5 0.86
S_Profitability_90_6 0.88
Relational Behaviour
S_RelBehavior_80_1 0.82
0.90
S_RelBehavior_80_2 0.87
S_RelBehavior_80_3 0.77
S_RelBehavior_80_4 0.67
S_RelBehavior_80_5 0.82
S_RelBehavior_80_6 0.68
Supplier Satisfaction S_Satisfaction_100_1 0.88
0.93 S_Satisfaction_100_2 0.87
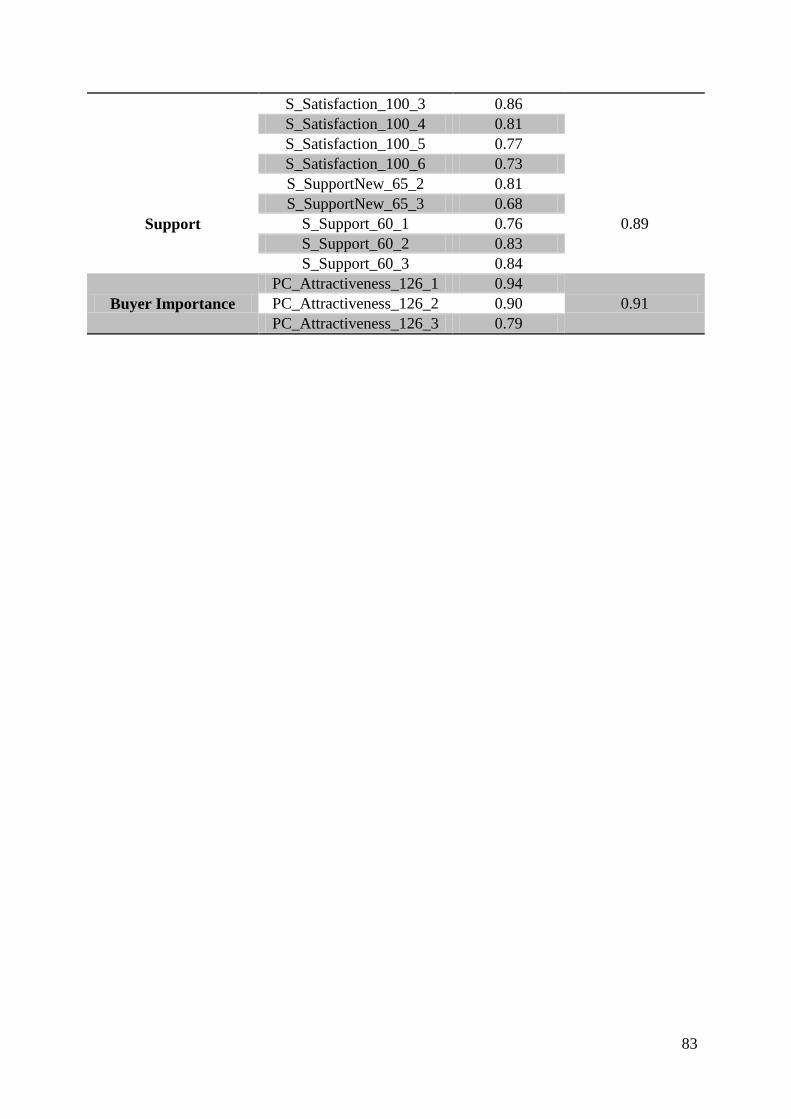
83
S_Satisfaction_100_3 0.86
S_Satisfaction_100_4 0.81
S_Satisfaction_100_5 0.77
S_Satisfaction_100_6 0.73
Support
S_SupportNew_65_2 0.81
0.89
S_SupportNew_65_3 0.68
S_Support_60_1 0.76
S_Support_60_2 0.83
S_Support_60_3 0.84
Buyer Importance
PC_Attractiveness_126_1 0.94
0.91 PC_Attractiveness_126_2 0.90
PC_Attractiveness_126_3 0.79
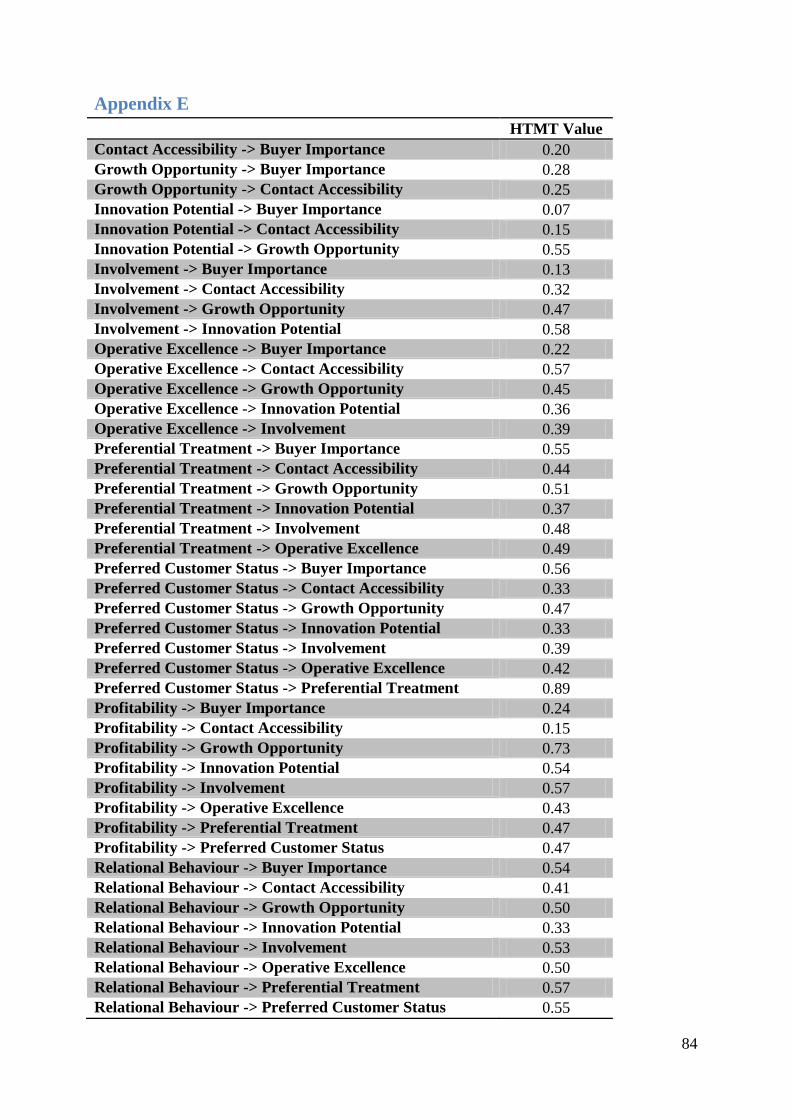
84
Appendix E
HTMT Value
Contact Accessibility -> Buyer Importance 0.20
Growth Opportunity -> Buyer Importance 0.28
Growth Opportunity -> Contact Accessibility 0.25
Innovation Potential -> Buyer Importance 0.07
Innovation Potential -> Contact Accessibility 0.15
Innovation Potential -> Growth Opportunity 0.55
Involvement -> Buyer Importance 0.13
Involvement -> Contact Accessibility 0.32
Involvement -> Growth Opportunity 0.47
Involvement -> Innovation Potential 0.58
Operative Excellence -> Buyer Importance 0.22
Operative Excellence -> Contact Accessibility 0.57
Operative Excellence -> Growth Opportunity 0.45
Operative Excellence -> Innovation Potential 0.36
Operative Excellence -> Involvement 0.39
Preferential Treatment -> Buyer Importance 0.55
Preferential Treatment -> Contact Accessibility 0.44
Preferential Treatment -> Growth Opportunity 0.51
Preferential Treatment -> Innovation Potential 0.37
Preferential Treatment -> Involvement 0.48
Preferential Treatment -> Operative Excellence 0.49
Preferred Customer Status -> Buyer Importance 0.56
Preferred Customer Status -> Contact Accessibility 0.33
Preferred Customer Status -> Growth Opportunity 0.47
Preferred Customer Status -> Innovation Potential 0.33
Preferred Customer Status -> Involvement 0.39
Preferred Customer Status -> Operative Excellence 0.42
Preferred Customer Status -> Preferential Treatment 0.89
Profitability -> Buyer Importance 0.24
Profitability -> Contact Accessibility 0.15
Profitability -> Growth Opportunity 0.73
Profitability -> Innovation Potential 0.54
Profitability -> Involvement 0.57
Profitability -> Operative Excellence 0.43
Profitability -> Preferential Treatment 0.47
Profitability -> Preferred Customer Status 0.47
Relational Behaviour -> Buyer Importance 0.54
Relational Behaviour -> Contact Accessibility 0.41
Relational Behaviour -> Growth Opportunity 0.50
Relational Behaviour -> Innovation Potential 0.33
Relational Behaviour -> Involvement 0.53
Relational Behaviour -> Operative Excellence 0.50
Relational Behaviour -> Preferential Treatment 0.57
Relational Behaviour -> Preferred Customer Status 0.55
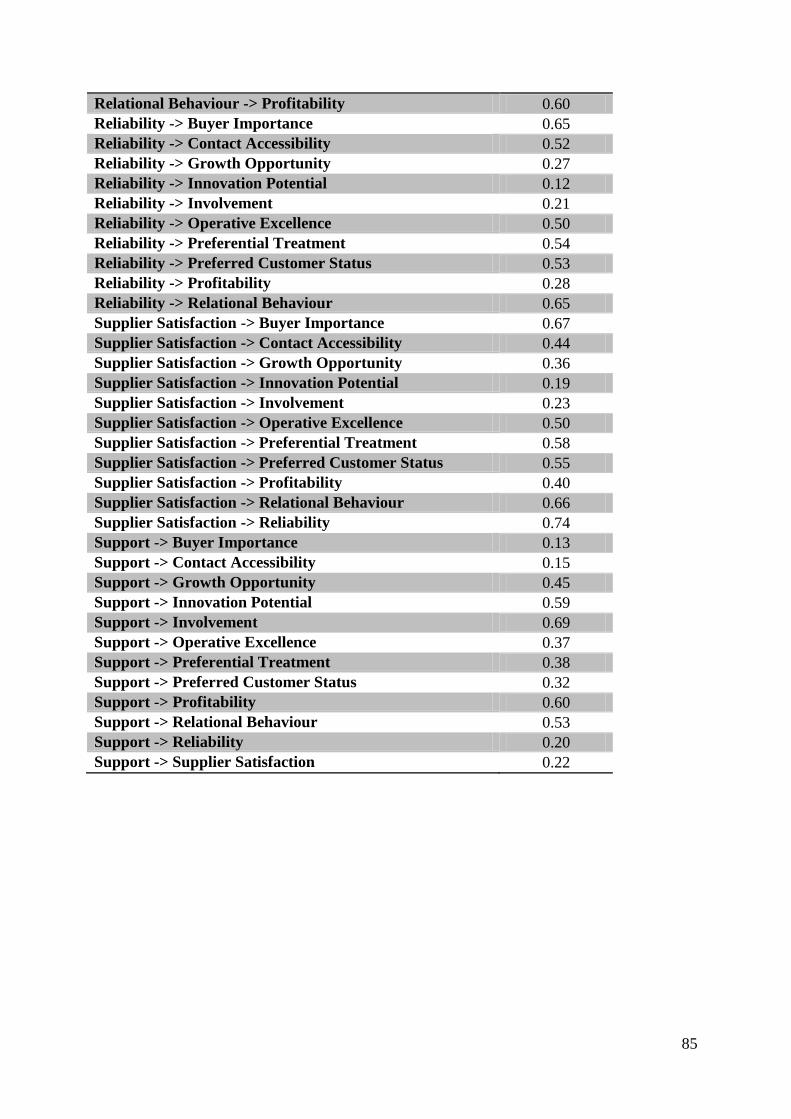
85
Relational Behaviour -> Profitability 0.60
Reliability -> Buyer Importance 0.65
Reliability -> Contact Accessibility 0.52
Reliability -> Growth Opportunity 0.27
Reliability -> Innovation Potential 0.12
Reliability -> Involvement 0.21
Reliability -> Operative Excellence 0.50
Reliability -> Preferential Treatment 0.54
Reliability -> Preferred Customer Status 0.53
Reliability -> Profitability 0.28
Reliability -> Relational Behaviour 0.65
Supplier Satisfaction -> Buyer Importance 0.67
Supplier Satisfaction -> Contact Accessibility 0.44
Supplier Satisfaction -> Growth Opportunity 0.36
Supplier Satisfaction -> Innovation Potential 0.19
Supplier Satisfaction -> Involvement 0.23
Supplier Satisfaction -> Operative Excellence 0.50
Supplier Satisfaction -> Preferential Treatment 0.58
Supplier Satisfaction -> Preferred Customer Status 0.55
Supplier Satisfaction -> Profitability 0.40
Supplier Satisfaction -> Relational Behaviour 0.66
Supplier Satisfaction -> Reliability 0.74
Support -> Buyer Importance 0.13
Support -> Contact Accessibility 0.15
Support -> Growth Opportunity 0.45
Support -> Innovation Potential 0.59
Support -> Involvement 0.69
Support -> Operative Excellence 0.37
Support -> Preferential Treatment 0.38
Support -> Preferred Customer Status 0.32
Support -> Profitability 0.60
Support -> Relational Behaviour 0.53
Support -> Reliability 0.20
Support -> Supplier Satisfaction 0.22
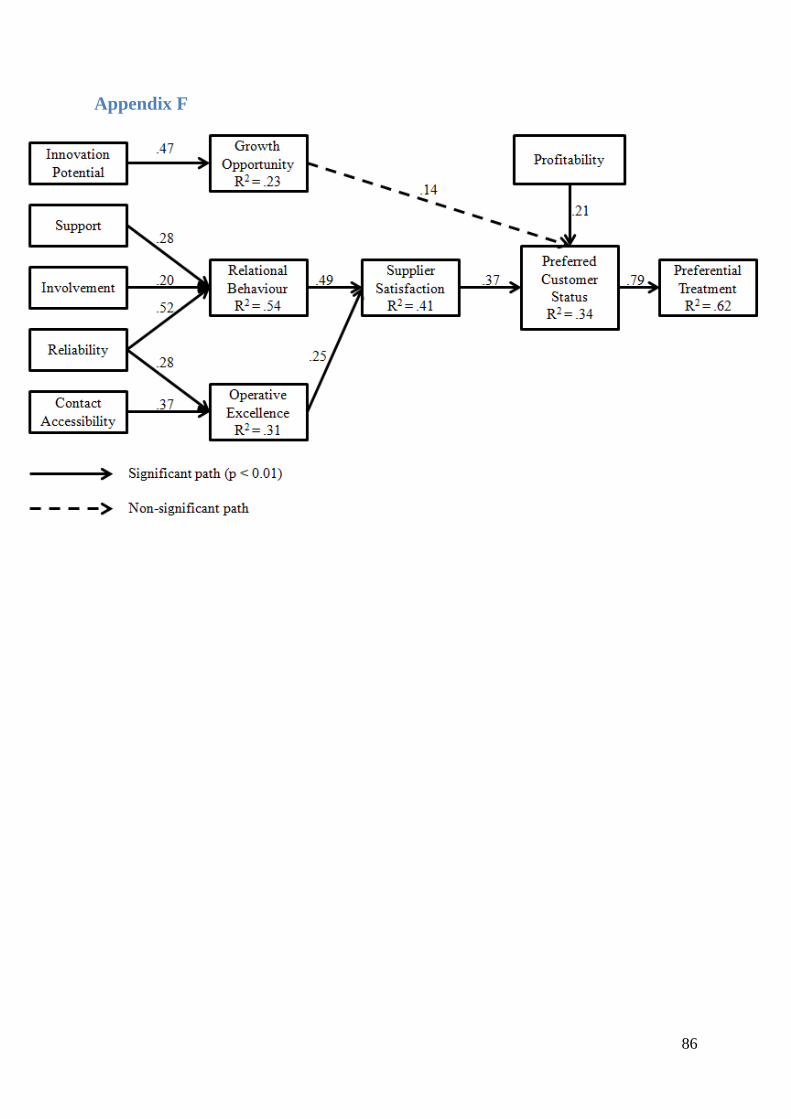
86
Appendix F
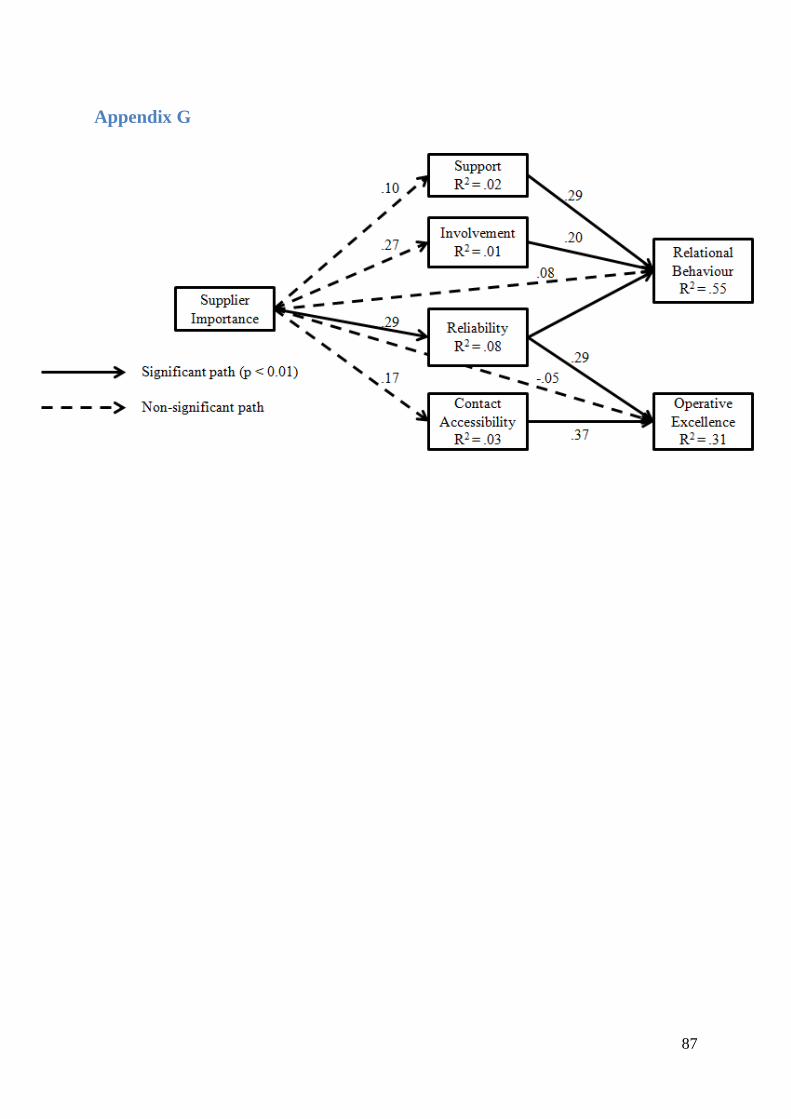
87
Appendix G
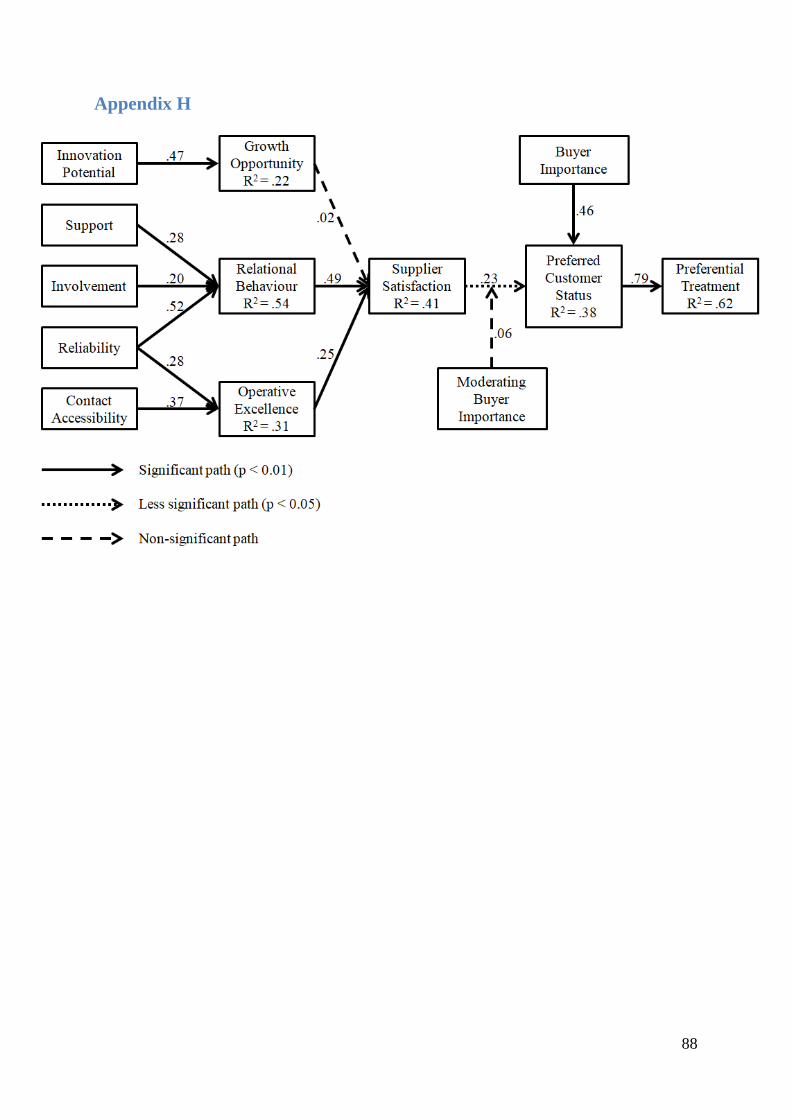
88
Appendix H
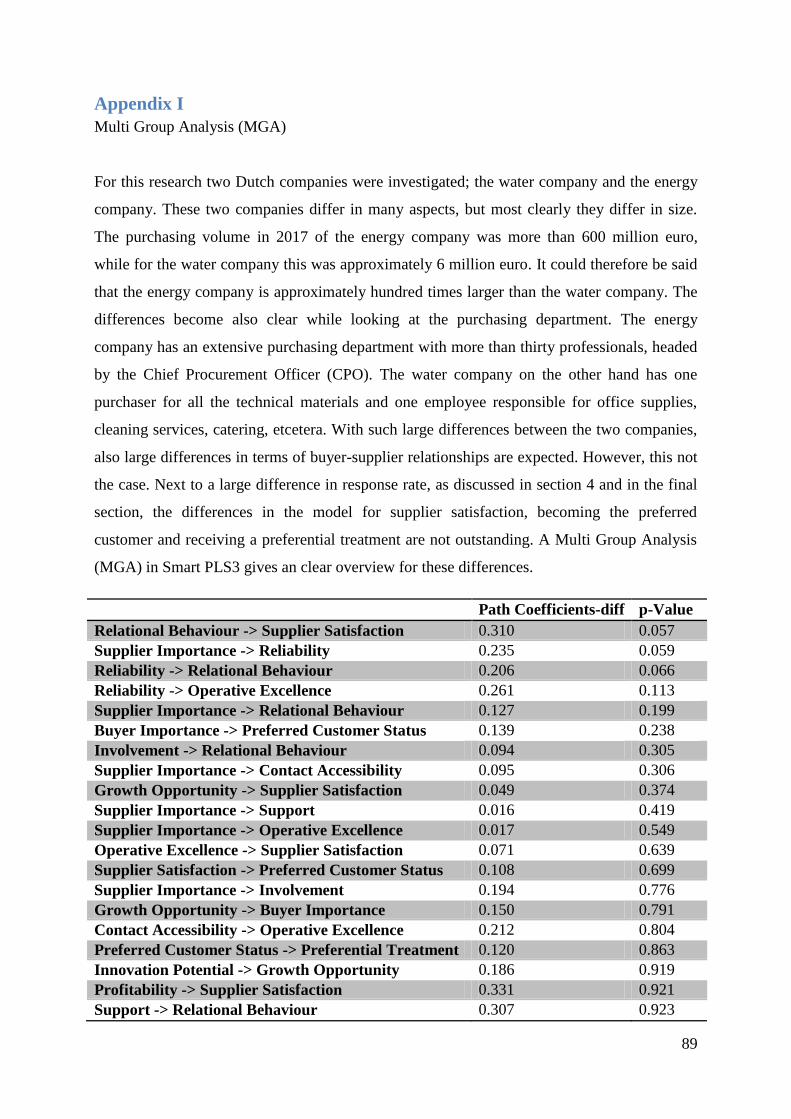
89
Appendix I
Multi Group Analysis (MGA)
For this research two Dutch companies were investigated; the water company and the energy
company. These two companies differ in many aspects, but most clearly they differ in size.
The purchasing volume in 2017 of the energy company was more than 600 million euro,
while for the water company this was approximately 6 million euro. It could therefore be said
that the energy company is approximately hundred times larger than the water company. The
differences become also clear while looking at the purchasing department. The energy
company has an extensive purchasing department with more than thirty professionals, headed
by the Chief Procurement Officer (CPO). The water company on the other hand has one
purchaser for all the technical materials and one employee responsible for office supplies,
cleaning services, catering, etcetera. With such large differences between the two companies,
also large differences in terms of buyer-supplier relationships are expected. However, this not
the case. Next to a large difference in response rate, as discussed in section 4 and in the final
section, the differences in the model for supplier satisfaction, becoming the preferred
customer and receiving a preferential treatment are not outstanding. A Multi Group Analysis
(MGA) in Smart PLS3 gives an clear overview for these differences.
Path Coefficients-diff p-Value
Relational Behaviour -> Supplier Satisfaction 0.310 0.057
Supplier Importance -> Reliability 0.235 0.059
Reliability -> Relational Behaviour 0.206 0.066
Reliability -> Operative Excellence 0.261 0.113
Supplier Importance -> Relational Behaviour 0.127 0.199
Buyer Importance -> Preferred Customer Status 0.139 0.238
Involvement -> Relational Behaviour 0.094 0.305
Supplier Importance -> Contact Accessibility 0.095 0.306
Growth Opportunity -> Supplier Satisfaction 0.049 0.374
Supplier Importance -> Support 0.016 0.419
Supplier Importance -> Operative Excellence 0.017 0.549
Operative Excellence -> Supplier Satisfaction 0.071 0.639
Supplier Satisfaction -> Preferred Customer Status 0.108 0.699
Supplier Importance -> Involvement 0.194 0.776
Growth Opportunity -> Buyer Importance 0.150 0.791
Contact Accessibility -> Operative Excellence 0.212 0.804
Preferred Customer Status -> Preferential Treatment 0.120 0.863
Innovation Potential -> Growth Opportunity 0.186 0.919
Profitability -> Supplier Satisfaction 0.331 0.921
Support -> Relational Behaviour 0.307 0.923
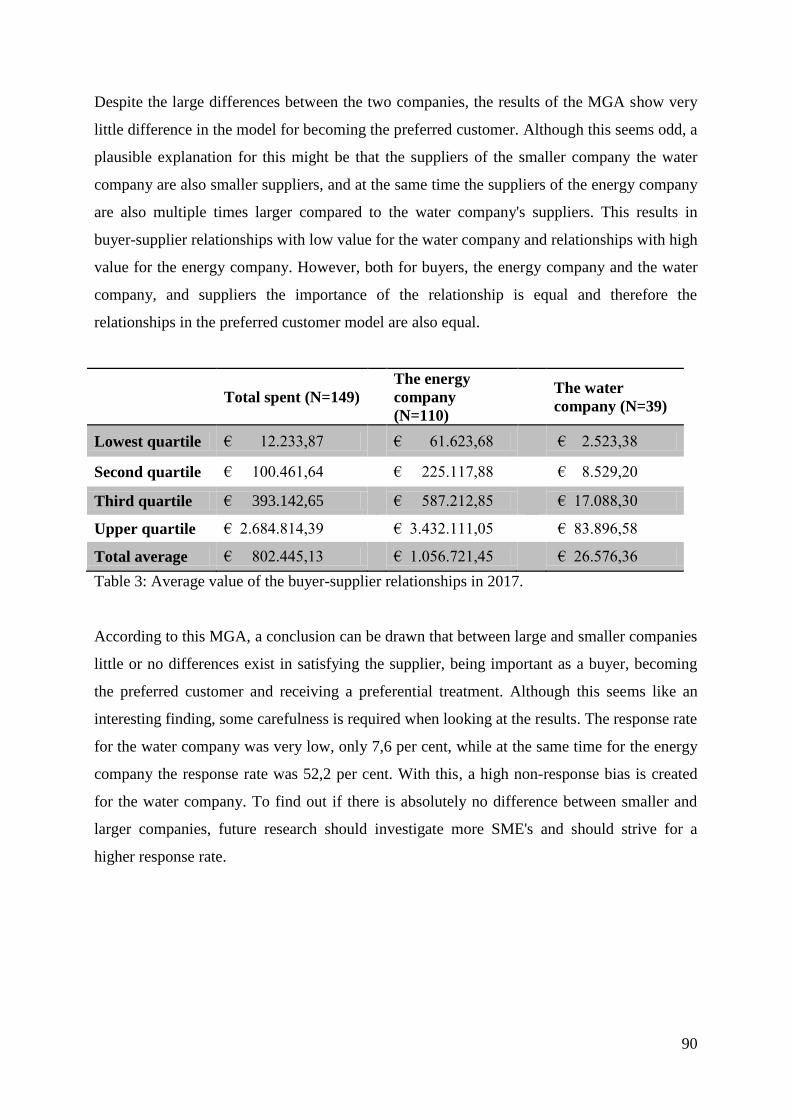
90
Despite the large differences between the two companies, the results of the MGA show very
little difference in the model for becoming the preferred customer. Although this seems odd, a
plausible explanation for this might be that the suppliers of the smaller company the water
company are also smaller suppliers, and at the same time the suppliers of the energy company
are also multiple times larger compared to the water company's suppliers. This results in
buyer-supplier relationships with low value for the water company and relationships with high
value for the energy company. However, both for buyers, the energy company and the water
company, and suppliers the importance of the relationship is equal and therefore the
relationships in the preferred customer model are also equal.
Total spent (N=149)
The energy
company
(N=110)
The water
company (N=39)
Lowest quartile € 12.233,87
€ 61.623,68
€ 2.523,38
Second quartile € 100.461,64
€ 225.117,88
€ 8.529,20
Third quartile € 393.142,65
€ 587.212,85
€ 17.088,30
Upper quartile € 2.684.814,39
€ 3.432.111,05
€ 83.896,58
Total average € 802.445,13
€ 1.056.721,45
€ 26.576,36
Table 3: Average value of the buyer-supplier relationships in 2017.
According to this MGA, a conclusion can be drawn that between large and smaller companies
little or no differences exist in satisfying the supplier, being important as a buyer, becoming
the preferred customer and receiving a preferential treatment. Although this seems like an
interesting finding, some carefulness is required when looking at the results. The response rate
for the water company was very low, only 7,6 per cent, while at the same time for the energy
company the response rate was 52,2 per cent. With this, a high non-response bias is created
for the water company. To find out if there is absolutely no difference between smaller and
larger companies, future research should investigate more SME's and should strive for a
higher response rate.


![Blood, Sweat & Tears - [Book] the Best of Blood, Sweat & Tears](https://img.dokumen.tips/doc/110x75/577c780e1a28abe0548e8be9/blood-sweat-tears-book-the-best-of-blood-sweat-tears.jpg)