Embed Size (px)
Citation preview

BEAs ICT Prices:Historical Analysis and Future Plans
Bureau of Economic AnalysisMarch 4, 2014
Dave WasshausenBEA Advisory Committee Meeting
Suitland, MDMay 12, 2017
Historical Overview: BEA ICT Prices
• BEA’s collaborative work with IBM 1980s– Experimental PPIs in the late 80s
• Semiconductors 1990s
• PCs late 1990s
• Photocopying equipment early 2000s
• Software early 2000s– Purchased and own‐account (function points)
2

BEA Computer Prices
3
Multiuser Computers 1972‐1997 1998 1999‐2004 2005‐present
DomesticBEA Hedonic Index
(Speed, capacity & chip density)BLS PPI
(Host computers, multiusers)
Imported
Personal Computers 1982‐1989 1989‐1992 1993‐1998 1999‐present
DomesticBEA Matched‐Model
Experimental PPIs
Imported BLS PPIs and MPI BLS MPI
(Computers)
Printers 1994‐1999 2000‐present
Domestic
BEA Hedonic Index and BLS PPIs (Impact printers;
laser printers; ink jet printers)
BLS PPI (Computer peripheral eq)
ImportedBEA Hedonic Index and
BLS MPI (Printers)
BLS MPI(Computer acc., perip.&parts)
BEA Matched‐Model
BEA Hedonic Index(Dot matrix, line, laser & ink jet)
1972‐1993
BEA Hedonic Index(Dot matrix, line, laser & ink jet)
BLS MPI(Computers)
BLS PPIs(Single user; PC's &workstation; Portables & laptops)
BLS PPIs(Large scale; Mid‐range)
BEA Hedonic Index(Speed, capacity & chip density)
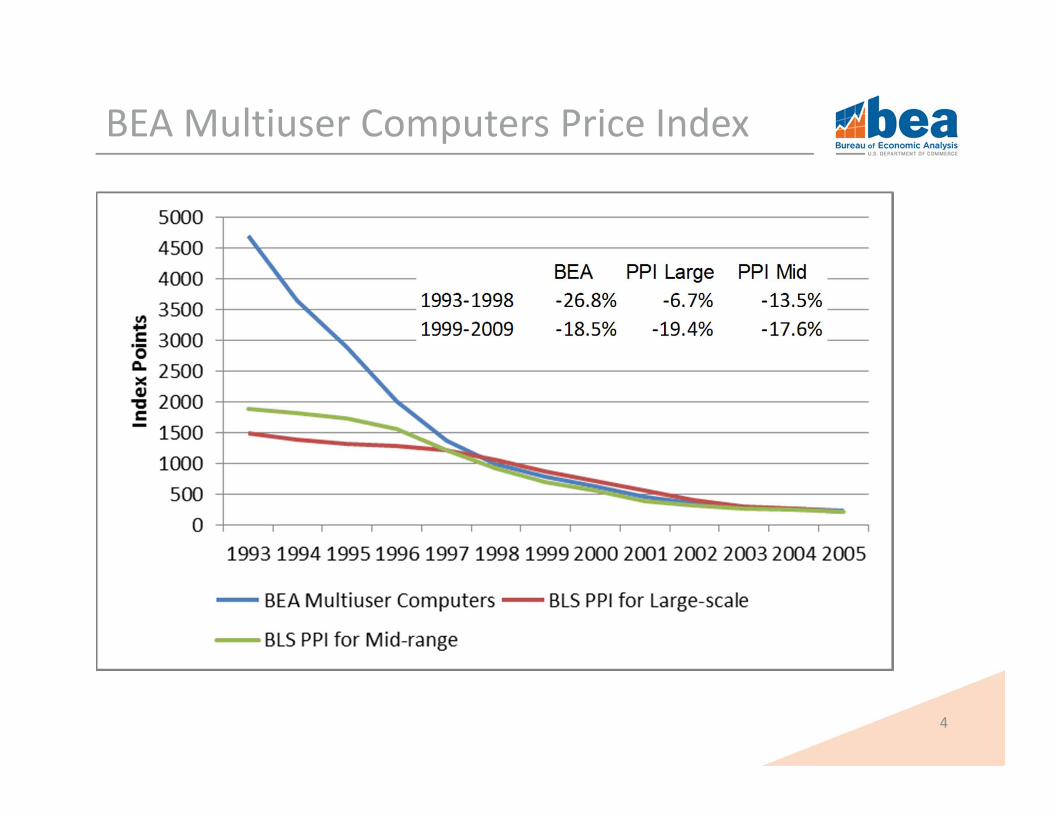
BEA Multiuser Computers Price Index
4
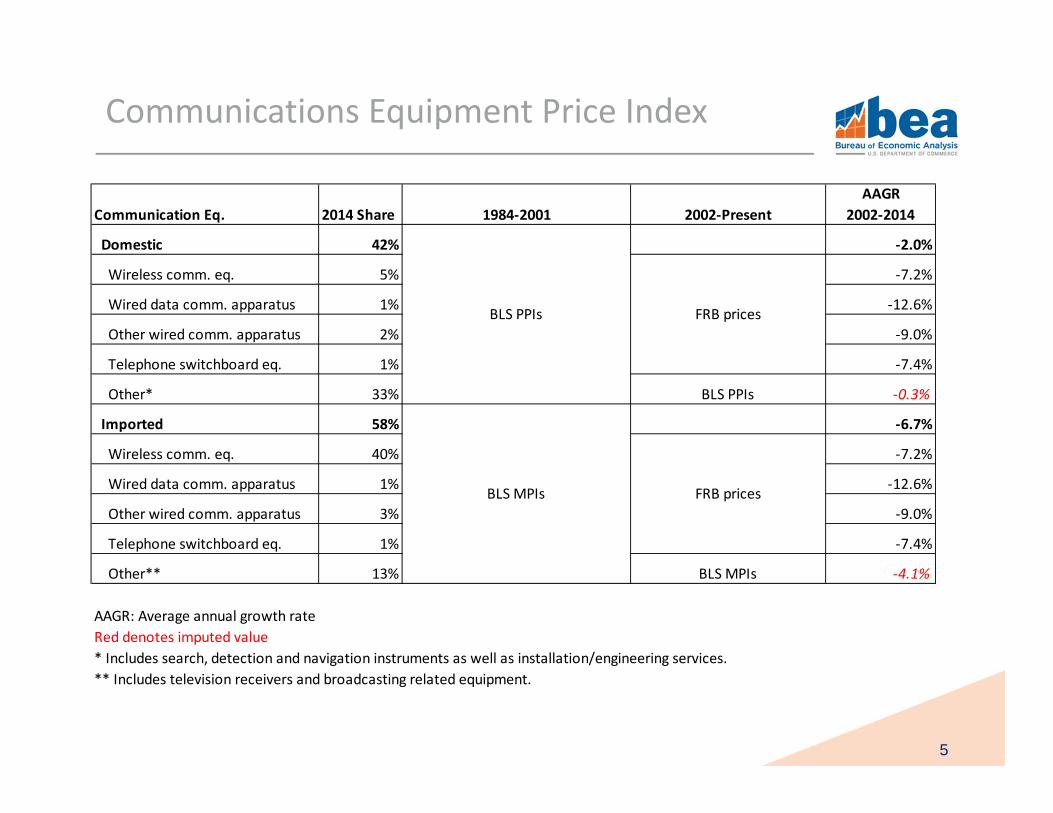
Communications Equipment Price Index
5
Communication Eq. 2014 Share 1984‐2001 2002‐PresentAAGR
2002‐2014
Domestic 42% ‐2.0%
Wireless comm. eq. 5% ‐7.2%
Wired data comm. apparatus 1% ‐12.6%
Other wired comm. apparatus 2% ‐9.0%
Telephone switchboard eq. 1% ‐7.4%
Other* 33% BLS PPIs ‐0.3%
Imported 58% ‐6.7%
Wireless comm. eq. 40% ‐7.2%
Wired data comm. apparatus 1% ‐12.6%
Other wired comm. apparatus 3% ‐9.0%
Telephone switchboard eq. 1% ‐7.4%
Other** 13% BLS MPIs ‐4.1%
AAGR: Average annual growth rateRed denotes imputed value* Includes search, detection and navigation instruments as well as installation/engineering services.** Includes television receivers and broadcasting related equipment.
FRB prices
BLS PPIs
BLS MPIs
FRB prices

BEA Communications Equipment Price Index
6
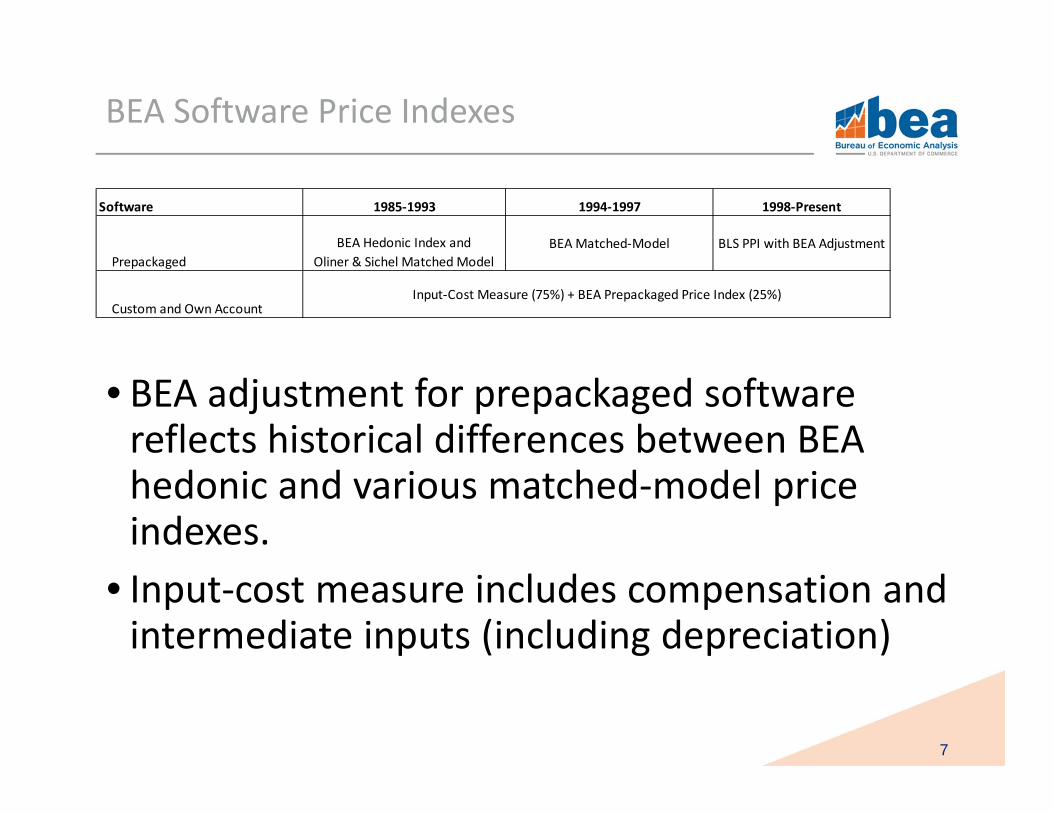
BEA Software Price Indexes
7
• BEA adjustment for prepackaged software reflects historical differences between BEA hedonic and various matched‐model price indexes.
• Input‐cost measure includes compensation and intermediate inputs (including depreciation)
Software 1985‐1993 1994‐1997 1998‐Present
PrepackagedBEA Hedonic Index and
Oliner & Sichel Matched ModelBEA Matched‐Model BLS PPI with BEA Adjustment
Custom and Own AccountInput‐Cost Measure (75%) + BEA Prepackaged Price Index (25%)
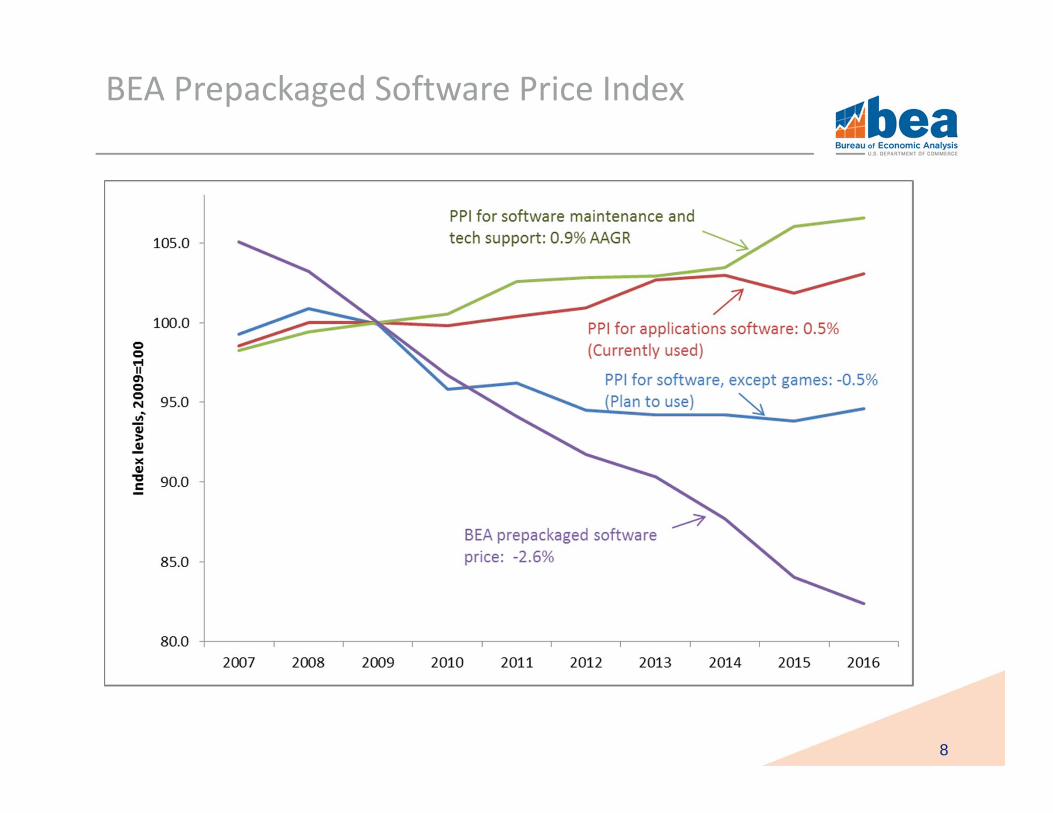
BEA Prepackaged Software Price Index
8
BEAPPI Excl. games
PPI Applications
PPIMaintenance
2007‐2016 ‐2.6% ‐0.5% 0.5% 0.9%
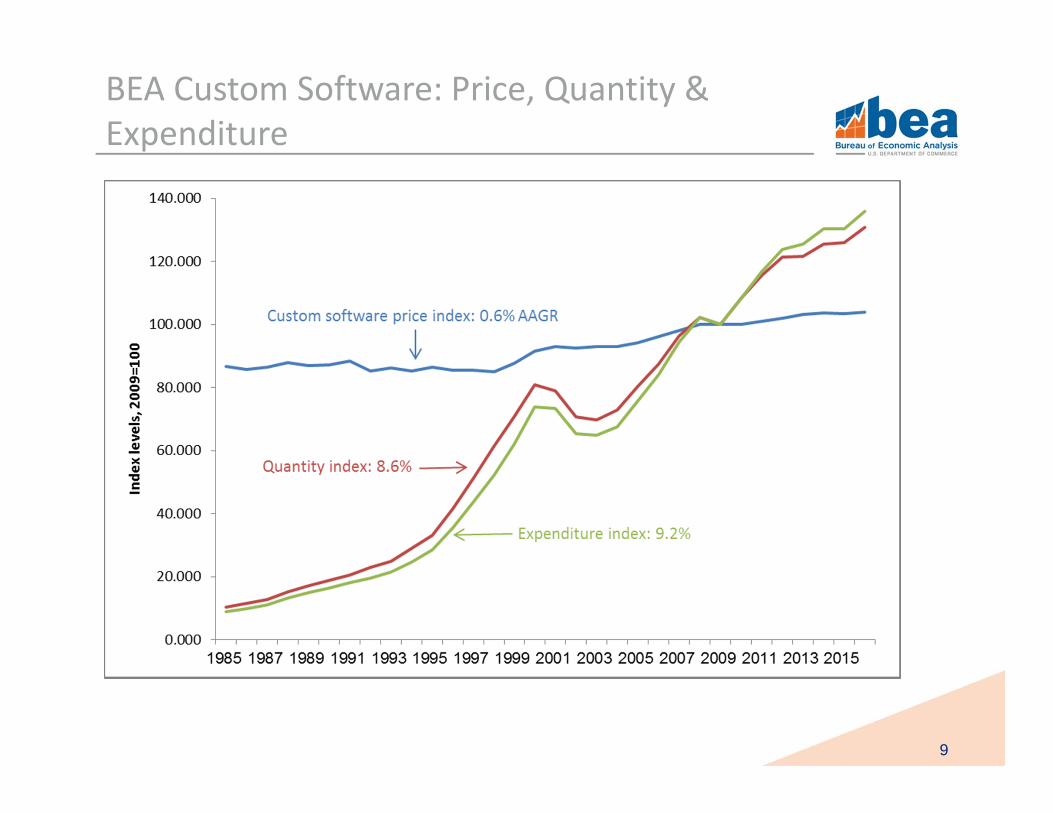
BEA Custom Software: Price, Quantity & Expenditure
9
Recent focus and looking forward
• Recent focus on harmonizing accounts with international guidelines and promoting international consistency
– Capitalizing intellectual property products– New satellite accounts (healthcare, arts and culture)– Supply‐Use framework
• Increased integration of the national accounts– Integrated industry‐level production account (BLS)– Integrated macroeconomic accounts (FRB)– Harmonized Quarterly GDP by Industry and by state
• Renewed emphasis on improving quality adjusted prices for information and communication technology products.
– Digital Economy work with NTIA and ESA– Motivated by recent research
10

Looking Forward: Custom and OA Software
• Almost $270 billion in fixed investment in 2015• Prices primarily reflect input‐costs• Recently purchased an extensive database tracking prices, functionality, and quality
• 8000 observations, spanning years 2006‐2014• Average annual rate of decline of price per FP is about 5%
11
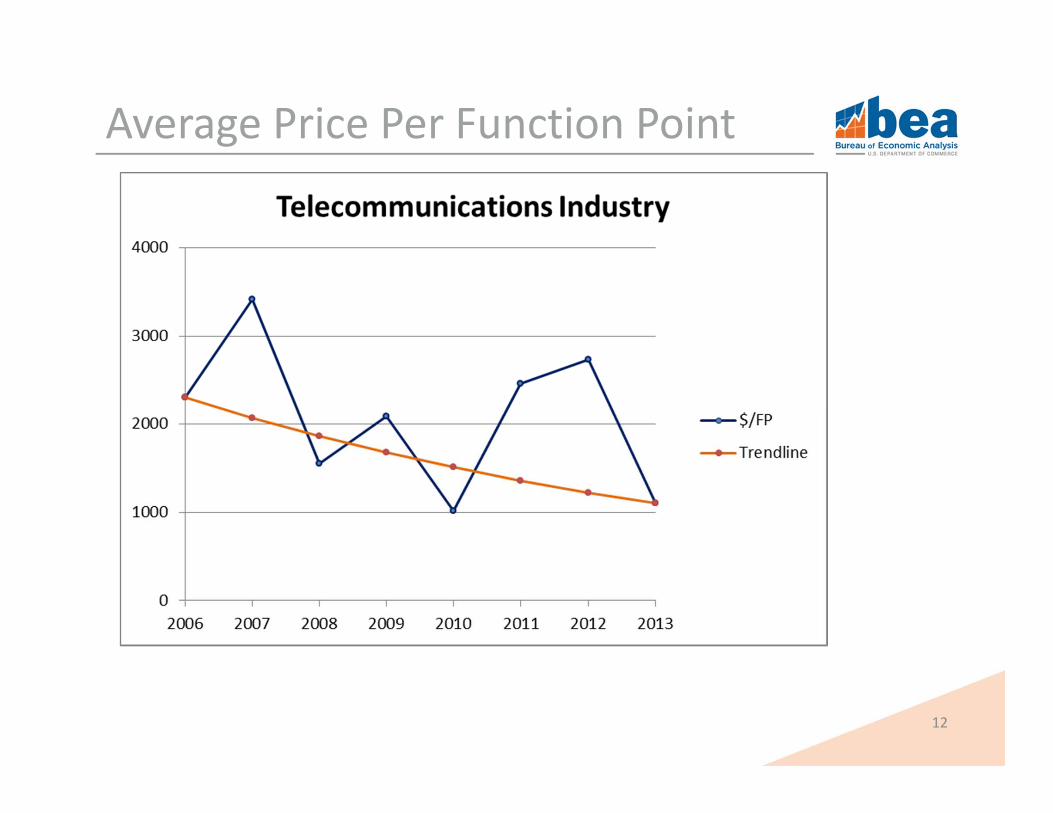
Average Price Per Function Point
12
Looking Forward: Packaged Software
• Incorporating the more representative PPI for software excluding games beginning with the 2017 annual update
• BEA adjustment is old and will be updated with the 2018 comprehensive update
13
Looking Forward: Communication Eq
• Continue conferring with BLS and FRB – Plan to pick‐up FRB price analysis
• As part of 2012 I‐O Benchmark, update deflation‐level categories to more closely align with current products
14
Looking Forward: Medical Equipment
15Source: Authors’ calculations based on ECRI data
• Private fixed investment in electro‐medical equipment almost $50 billion
• Rapid rates of product innovation
• Initial analysis suggests that prices for imaging equipment range from about ‐25% per year for MRI and CTSCAN machines to about ‐10% per year for ultrasound machines.
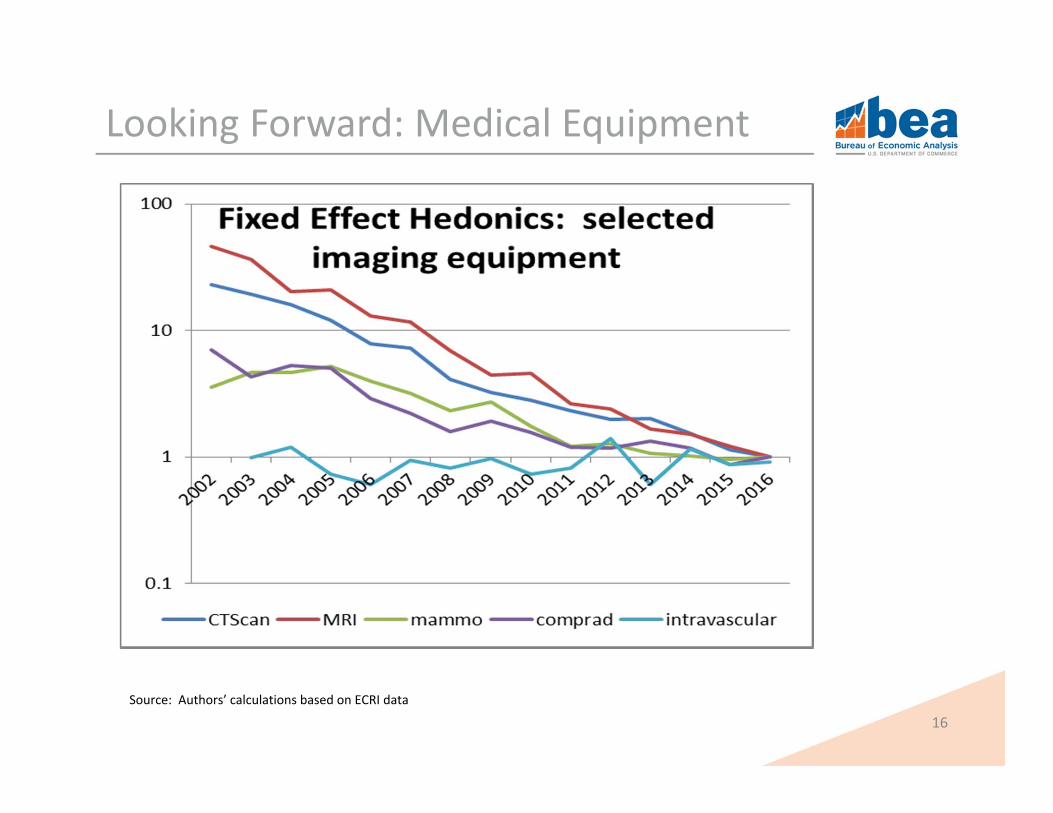
Looking Forward: Medical Equipment
16Source: Authors’ calculations based on ECRI data

Looking Forward: Wireless Services
17
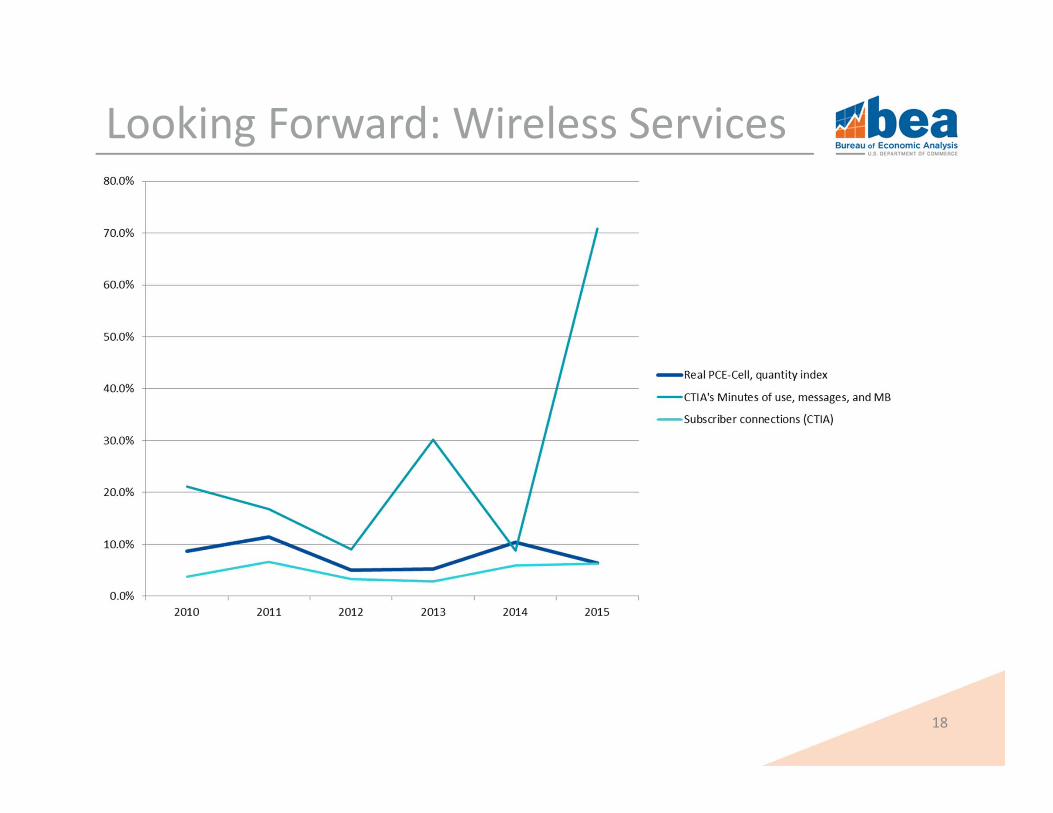
Looking Forward: Wireless Services
18
Conclusion
• Improving BEA ICT prices is a high priority
• Current and future activities:– Research and development
– Collaboration• Efficient use of resources
• Joint products and papers
19


