Embed Size (px)
Citation preview

BEARING CAPACITY OF CIRCULAR FOOTING LOCATED ON RANDOMLY
REINFORCED SAND BED
A REPORT SUBMITTED IN PARTIAL FULFILLMENT OF THE REQUIREMENTS FOR THE DEGREE OF
Bachelor of Technology
In
Civil Engineering
By
Sailendra Kumar Halwai
Roll No. : 107CE018
Under the Guidance of
Prof. S.P.SINGH
DEPARTMENT OF CIVIL ENGINEERING
NATIONAL INSTITUTE OF TECHNOLOGY ROURKELA
2011

National Institute of Technology
Rourkela
CERTIFICATE
This is to certify that the thesis entitled, “BEARING CAPACITY OF CIRCULAR
FOOTING LOCATED ON RANDOMLY REINFORCED SAND BED” submitted by
SAILENDRA KUMAR HALWAI in partial fulfillments for the requirements for
the degree of Bachelor of Technology 20010-11 in Civil Engineering at National
Institute of Technology, Rourkela is an authentic work carried out by him under
my supervision and guidance. To the best of my knowledge, the matter embodied in this report has not been
submitted to any other University / Institute for the award of any Certificate.
Prof S.P.SINGH Date: 12-05-2010Dept. of Civil Engineering
National Institute of Technology
Rourkela - 769008

ACKNOWLEDGEMENT
I wish to express my deep sense of gratitude to my Project Guide, Prof. S. P. Singh , Department of Civil Engineering ,NITRourkela for his able guidance and sympathy and co-operation for providing necessary facilities and sources during the entire period of this project.
I would to like to thank Prof. M. Panda, Head of the Dept. Of Civil Engineering, National Institute of Technology, Rourkela, who have enlightened me during my project.
I would like to express my heartfelt thanks to Mr. Chamru Suniani , Mr. H.M. Garnaik and other lab staffs for their useful co-operation during the experimental work.
Finally, I would like to thank my Parents for their love and care.
Thanks to GOD.
(Sailendra Kumar Halwai)

ABSTRACT
Earth reinforcement is an effective and reliable technique for increasing the strength and stability
of soils. The technique is used today in a variety of applications ranging from retaining structures
and embankments to sub grade stabilization beneath footings and pavements. Reinforcement can
vary greatly; either in form (strips, sheets, grids, bars, or fibers), texture (rough or smooth), and
relative stiffness (high such as steel or low such as polymeric fabrics). In past practice
reinforcements have typically consisted of long, flexible, galvanized steel strips with either a
smooth or ribbed surface. Most field research to date on the mechanics of reinforced earth has
tended to focus on high modulus, steel strips. (Wasti Y Butun MD [1997])However, randomly
distributed fiber reinforced soils have recently attracted increasing attention in geotechnical
engineering.
In comparison with systematically reinforced soils, randomly distributed fiber reinforced soils
exhibit some advantages. Preparation of randomly distributed fiber reinforced soils represents
soil stabilization by admixture. Discrete fibers are simply added and mixed with the soil, much
like cement, lime, or other additives. Randomly distributed fibers offer strength isotropy and
limit potential planes of weakness that can develop parallel to oriented
reinforcement.(Yetimoglu T Salbas O [2003])
In the current study bearing capacities for sand specimens containing fiber contents 0%, 0.1%,
0.25%, 0.5%, 0.75% and having relative densities 40%, 55%, 73%, 88% were prepared and
tested.

CONTENTS
CERTIFICATE…….……………………………………………………………………………..iii
ACKNOWLEDGEMENT…………………… ………………………………………………….iv
ABSTRACT………………………………………………………………………………………v
CONTENTS……………………………………………………………………………………....vi
LIST OF TABLES……………...………………………………………………………………..xii
LIST OF FIGURES…………………..…………………………………………………………xiii
CHAPTER 1: INTRODUCTION…………………………………………………………...….1
1.1 BEARING CAPACITY OF FOOTING ON SEMI-INFINITE SOIL………………...…2
1.2 MODES OF FOUNDATION FAILURE………………………….………………….....2
1.3 BEARING CAPACITY THEORIES……………………………………………………3
1.3.1 TERZAGHI’S ANALYSIS…………………………………………………………………3
1.3.2 MEYERHOF’S THEORY…………………………………………………………………..7
1.3.3 HANSEN’S MODIFICATION……………………………………………………………10
1.4 PRINCIPLES OF REINFORCED EARTH…………………………………………………12
1.5 EFFECT OF REINFORCEMENT ON SOIL………………………………………….12
1.5.1 TRANSFER OF FORCE FROM SOIL TO REINFORCEMENT……………..12
1.5.2 EQUIVALENT CONFINING STRESS CONCEPT…………………………...14
1.5.3 PSEUDO COHESION CONCEPT……………………………………………..14
1.6 FIBER REINFORCED SOIL…………………………………………………………16

1.7 ADVANTAGES OF FIBER-REINFORCED SOIL…………………………………...16
1.8 MECHANISM OF REINFORCEMENT………………………………………………17
1.9 TYPES OF FIBERS…………………………………………………………………….17
1.10 DIRECTION OF REINFORCEMENTS……………………………………………...18
1.11 FACTORS AFFECTING THE STRENGTH AND PROPERTIES OF
RANDOMLY DISTRIBUTED FIBER-REINFORCED SOIL…………..................18
1.12 MODES OF FAILURES IN REINFORCED EARTH STRUCTURES…………….19
CHAPTER 2: LITERATURE REVIEW………………………………………………….20
CHAPTER 3: EXPERIMENTAL INVESTIGATION……………………………………25
3.1 TEST SAND PREPARATION……………………………………………………………...26
3.2 DETERMINATION OF PROPERTIES OF THE TEST SAND…………………………..26
3.2.1 GRAIN SIZE DISTRIBUTION…………………………………………………………..26
3.2.2 DETERMINATION OF SPECIFIC GRAVITY………………………………………….27
3.2.3 DETERMINATION OF MAXIMUM AND MINIMUM DENSITY……………………28
3.3 TEST REINFORCEMENT …………………………………………………………………29
3.4 WORK PROCEDURE ……………………………………………………………...………30
3.4.1 MATERIALS AND EQUIPMENTS USED………………………………………………30
3.4.2 EXPERIMENTAL SETUP………………………………………………………………...32
3.4.3 TEST VARIABLES……………………………………………………………………….34
3.4.3.1 FIBER CONTENT……………………………………………………………………….34

3.4.3.2 RELATIVE DENSITY…………………………………………………………………..34
CHAPTER 4: RESULTS & DISCUSSIONS………………………………………………35
CHAPTER 5: CONCLUSIONS…………………………………………………………….59
CHAPTER 6: REFERENCES………………………………………………………………61

LIST OF TABLES
Table 1.1: Terzaghi's bearing capacity factors ………………………………………………..6
Table 1.2: Meyerhof's bearing capacity factors ……………………………………………...10
Table 3.1: Data and Observation Sheet for Sieve Analysis ………………………………….26
Table 3.2: Data & Observation Sheet ………………………………………………………..28
Table 3.3: Data Sheet for Max. & Min. Density ……………………………………………...28
Table 3.4: Properties of Sand ………………………………………………………………….29
Table 3.5: Fiber Properties of Coir …………………………………………………………...30
Table 4.1 (Data Sheet for the specimens having fiber content = 0%) ………………………37
Table 4.2 (Data Sheet for the specimens having fiber content = 0.1%) …………………….39
Table 4.3 (Data Sheet for the specimens having fiber content = 0.25%) …………………...41
Table 4.4 (Data Sheet for the specimens having fiber content = 0.5%) …………………….43
Table 4.5 (Data Sheet for the specimens having fiber content = 0.75%) …………………...45
Table 4.6 (Data Sheet for the specimens having Relative Density = 88%) …………………47
Table 4.7 (Data Sheet for the specimens having Relative Density = 73%) …………………49
Table 4.8 (Data Sheet for the specimens having Relative Density = 55%) …………………51
Table 4.9 (Data Sheet for the specimens having Relative Density = 40%) …………………53
Table 4.10 Variation of bearing capacity with fiber % for different Relative Densities…...55

Table 4.11 Variation of bearing capacity with Relative Densities for different fiber % ….56
Table 4.12 Variation of bearing capacity ratio with fiber % for different Relative
Densities………………………………………………………………………….57
Table 4.13 Variation of bearing capacity ratio with Relative Densities for different
fiber % …………………………………………………………………………58

LIST OF FIGURES
Figure 1.1: Terzaghi's Bearing Capacity Analysis …………………………………………….4
Figure 1.2: Meyerhof's Analysis ………………………………………………………………..8
Figure 1.3: Stress Transfer By Soil Reinforcement ………………………………………….13
Figure 1.4: Confining Stress on Soil by Reinforcement ……………………………………..13
Figure 1.5: Equivalent Confining Stress Concept ……………………………………………14
Figure 1.6: Pseudo Cohesion Concept ………………………………………………………...15
Figure 3.1: Grain Size Distribution …………………………………………………………...27
Figure 3.2: Reinforcement used (coir) ………………………………………………………..29
Figure 3.3: Mould used for specimen preparation …………………………………………..30
Figure 3.4: Proving Ring ……………………………………………………………………....31
Figure 3.5: Dial Gauge …………………………………………………………………………31
Figure 3.6: Loading Frame at NIT ROURKELA ……………………………………………32
Figure 3.7: Compaction on the Shaker ……………………………………………………….33
Figure 3.8: Compacted Specimen …………………………………………………………...33
Figure 4.1: Stress -Strain Curve (fiber content = 0%) …………………………………………………………..38
Figure 4.2: Stress -Strain Curve (fiber content = 0.1%) ………………………………………………………..40

Figure 4.3: Stress -Strain Curve (fiber content = 0.25%)…………………………………………………….. 42
Figure 4.4: Stress -Strain Curve (fiber content = 0.5%) …………………………………………………………44
Figure 4.5: Stress -Strain Curve (fiber content = 0.75%)……………………………………………………… 46
Figure 4.6: Stress -Strain Curve (Relative Density = 88%) ……………………………………………………..48
Figure 4.7: Stress -Strain Curve (Relative Density = 73%) ……………………………………………………..50
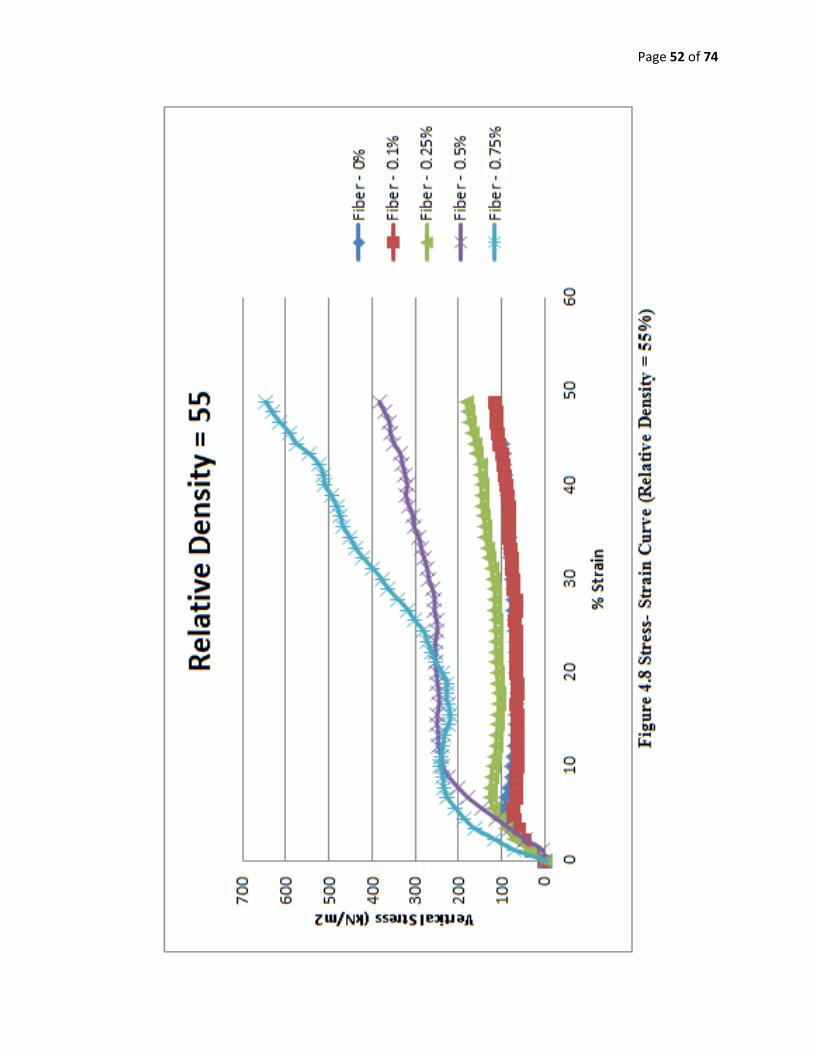
Figure 4.8: Stress -Strain Curve (Relative Density = 55%) ……………………………………………………..52
Figure 4.9: Stress -Strain Curve (Relative Density = 40%) ……………………………………………………..54
Figure 4.10: Bearing Capacities vs. Fiber Content ………………………………………….55
Figure 4.11: Bearing Capacities vs. Relative Density………………………………………...56
Figure 4.12: Bearing Capacities Ratio vs. Fiber Content……………………………………57
Figure 4.13: Bearing Capacities Ratio vs. Relative Density…………………………………58

Page 1 of 74
Chapter 1 INTRODUCTION

Page 2 of 74
1.1 BEARING CAPACITY OF FOOTING ON SEMI-INFINITE SOIL
The lowest part of a structure is generally referred to as the foundation. Its function is to transfer
the load of the structure to the soil on which it is resting. A properly designed foundation
transfers the load throughout the soil without overstressing the soil. Overstressing the soil can
result in either excessive settlement or shear failure of the soil, both of which cause damage to
the structure. Thus, geotechnical and structural engineers who design foundations must evaluate
the bearing capacity of soils.
1.2 MODES OF FOUNDATION FAILURE
Foundation is that part of the structure which is in direct contact with the soil and transmits load
directly to the soil. Prior to the application of load, the soil beneath the base of the footing is in
elastic equilibrium. As the load is applied settlement occur which is proportional to the load.
With the increase in loading, settlement progressively increases, and the soil transforms from the
state of elastic equilibrium to plastic equilibrium and thus the distribution of soil reaction
changes and failure of soil occurs. There are three principal modes of shear failure i.e. general
shear failure, local shear failure and punching shear failure depending upon the relative
compressibility and characteristics of soil. General shear failure occurs in relatively
incompressible soil with finite shearing strength. The failure is accompanied by considerable
bulging of on the soil surface. Local shear failure occurs in relatively compressible soil. The
failure is accompanied by visible sheared zone after bulging has taken place. Punching shear
failure takes place due to the relatively great compressibility of soil and may be evaluated by
determining the rigidity index of the soil.

Page 3 of 74
1.3 BEARING CAPACITY THEORIES
A number of equations based on theoretical analysis and experimental investigations are
available to determine the ultimate bearing capacity equation.
1.3.1 TERZAGHI’S ANALYSIS[12]:
Main assumption made by Terzaghi was that the soil behaves like an ideally plastic material
(This concept was initially developed by Prandtl). Terzaghi analysed the failure of a shallow
continuous footing (L/B = ∞) and then suggested mo difications for isolated square, rectangular
and circular footings. The three cases considered by him are (1) smooth base of a footing resist
on an ideal soil surface, (2) Rough base of a footing resting on an ideal soil surface and (3)
Rough base of a footing resting at a level below the ground surface.
Terzaghi has neglected the shearing resistance of the soil above the base of the footing.
The soil above the base of the footing is substituted by an equivalent surcharge (q=γ*Df), where
γ = unit weight of soil above the base of the footing. According to Terzaghi, the soil mass above
the failure surface consists of three zones:
Zone I: Because of friction and adhesion between the soil and the base of the footing, this zone
cannot spread laterally. It moves downward as an elastic wedge and the soil in this zone behaves
as if it is a part of the footing. The two sides of the wedge ac and bc make angle Φ with the
horizontal[2].
Zone II: The zones aef and bed are under this zone, which are called zones of radial shear. The
soil in this zone is pushed into zone III[2].

Page 4 of 74
Zone III : These are the two passive Rankine zones, boundaries of which make angles (45° −
𝜑𝜑 2⁄ ) with the horizontal[2].
Figure 3.1 Terzaghi's Bearing Capacity Analysis[14]
The equation for ultimate bearing capacity can be expressed as,
𝑞𝑞𝑓𝑓 = 𝑐𝑐𝑐𝑐𝑐𝑐 + σ 𝑐𝑐𝑞𝑞 + 0.5𝛾𝛾𝛾𝛾𝑐𝑐𝛾𝛾

Page 5 of 74
Where, γ corresponds to surcharge unit weight and unit weight of the soil under footing.
This is known as general bearing capacity equation 𝑐𝑐𝛾𝛾 , 𝑐𝑐𝑞𝑞 and𝑐𝑐𝑐𝑐 are Terzaghi’s dimensionless
bearing capacity factors due to the soil weight, surcharge and cohesion respectively. There have
numerical values depend upon the value of the angle of internal friction of the soil.
𝑐𝑐𝑞𝑞 =𝑎𝑎2
2cos2(45° + 𝜑𝜑 2⁄ )
𝑐𝑐𝑐𝑐 = �𝑎𝑎2
2cos2(45° + 𝜑𝜑 2⁄ ) − 1� cot𝜑𝜑
𝑐𝑐𝛾𝛾 =tan𝜑𝜑
2�𝐾𝐾𝑝𝑝𝛾𝛾
cos2 𝜑𝜑− 1�
Where, 𝐾𝐾𝑝𝑝𝛾𝛾 = passive earth pressure coefficient, dependent on 𝜑𝜑,
𝑎𝑎 = 𝑒𝑒(0.75𝜋𝜋−𝜑𝜑 2⁄ ) tan 𝜑𝜑
and 𝜑𝜑 = Angle of internal friction
Terzaghi has determined these bearing capacity factors as functions of the angle of internal
friction 𝜑𝜑 as given in the table 1.1 in the next page.
Page 6 of 74
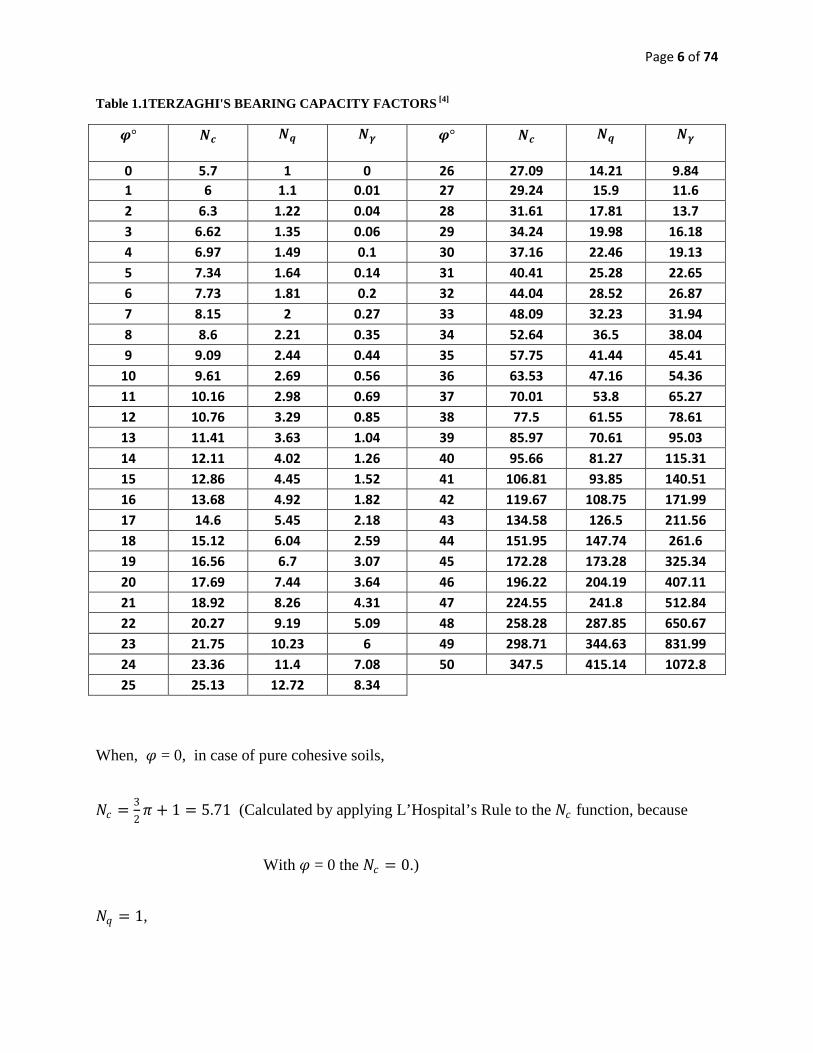
Table 1.1TERZAGHI'S BEARING CAPACITY FACTORS [4]
𝝋𝝋° 𝑵𝑵𝒄𝒄 𝑵𝑵𝒒𝒒 𝑵𝑵𝜸𝜸 𝝋𝝋° 𝑵𝑵𝒄𝒄 𝑵𝑵𝒒𝒒 𝑵𝑵𝜸𝜸
0 5.7 1 0 26 27.09 14.21 9.84 1 6 1.1 0.01 27 29.24 15.9 11.6 2 6.3 1.22 0.04 28 31.61 17.81 13.7 3 6.62 1.35 0.06 29 34.24 19.98 16.18 4 6.97 1.49 0.1 30 37.16 22.46 19.13 5 7.34 1.64 0.14 31 40.41 25.28 22.65 6 7.73 1.81 0.2 32 44.04 28.52 26.87 7 8.15 2 0.27 33 48.09 32.23 31.94 8 8.6 2.21 0.35 34 52.64 36.5 38.04 9 9.09 2.44 0.44 35 57.75 41.44 45.41
10 9.61 2.69 0.56 36 63.53 47.16 54.36 11 10.16 2.98 0.69 37 70.01 53.8 65.27 12 10.76 3.29 0.85 38 77.5 61.55 78.61 13 11.41 3.63 1.04 39 85.97 70.61 95.03 14 12.11 4.02 1.26 40 95.66 81.27 115.31 15 12.86 4.45 1.52 41 106.81 93.85 140.51 16 13.68 4.92 1.82 42 119.67 108.75 171.99 17 14.6 5.45 2.18 43 134.58 126.5 211.56 18 15.12 6.04 2.59 44 151.95 147.74 261.6 19 16.56 6.7 3.07 45 172.28 173.28 325.34 20 17.69 7.44 3.64 46 196.22 204.19 407.11 21 18.92 8.26 4.31 47 224.55 241.8 512.84 22 20.27 9.19 5.09 48 258.28 287.85 650.67 23 21.75 10.23 6 49 298.71 344.63 831.99 24 23.36 11.4 7.08 50 347.5 415.14 1072.8 25 25.13 12.72 8.34
When, 𝜑𝜑 = 0, in case of pure cohesive soils,
𝑐𝑐𝑐𝑐 = 32𝜋𝜋 + 1 = 5.71 (Calculated by applying L’Hospital’s Rule to the 𝑐𝑐𝑐𝑐 function, because
With 𝜑𝜑 = 0 the 𝑐𝑐𝑐𝑐 = 0.)
𝑐𝑐𝑞𝑞 = 1,

Page 7 of 74
𝑐𝑐𝛾𝛾 = 0.
In order to take into account the shape of the footing (i.e. strip, round, square, etc.), Terzaghi
used only
The equation for ultimate bearing capacity for circular footing can be expressed as,
𝑞𝑞𝑓𝑓 = 1.3𝑐𝑐𝑐𝑐𝑐𝑐 + σ 𝑐𝑐𝑞𝑞 + 0.3𝛾𝛾𝛾𝛾𝑐𝑐𝛾𝛾
The equation for ultimate bearing capacity for square footing can be expressed as,
𝑞𝑞𝑓𝑓 = 1.3𝑐𝑐𝑐𝑐𝑐𝑐 + σ 𝑐𝑐𝑞𝑞 + 0.4𝛾𝛾𝛾𝛾𝑐𝑐𝛾𝛾
Terzaghi’s method of analysis of the bearing capacity of a cohesive soil is independent of the
width of the footing. The settlement, however, of a cohesive soil is inversely proportional to the
width ‘b’ of the footing.
The allowable bearing capacity, qallowable of a cohesive soil is obtained by dividing the ultimate
bearing capacity, qu, by a factor of safety, say f.
Terzaghi has further defined two types of failures. Before loading the soil is in a state of elastic
equilibrium. When a load greater than critical load is applied, the soil gradually passes to a state
of plastic equilibrium. For this transition from elastic to plastic state there may be either loacal
shear failure or general shear failure.
1.3.2 MEYERHOF’S THEORY:
Meyerhof extended Terzaghi’s analysis of the plastic equilibrium of the surface footing to
shallow and deep foundations, considering the shear strength of overburden. Figure 1.2, shows
the failure mechanism for shallow and deep foundations according to both Terzaghi and

Page 8 of 74
Meyerhof’s analysis. In the Meyerhof’s analysis, abd is the elastic zone, bde is the radial shear
zone and befg is the zone of mixed shear in which shear varies between radial and plane shear,
which depend upon the depth and roughness of the foundation. The plastic equilibrium in all
these zones is established from the boundary conditions starting from the foundation shaft. To
make analysis simpler, Meyerhof introduced a parameter β, the angle to define the line bf,
joining point b to f where the boundary failure slip line intersects the soil surface. The resultant
effects of the wedge bfg are represented by normal stress and tangential stress, p0and s0 on bf.
The plane bf is termed as the equivalent free surface, and p0
Figure 1.4 Meyerhof's Analysis[12]

Page 9 of 74
and s0 are termed as the equivalent free surface stresses. The value of β increases with depth, and
becomes 90° for deep foundations.
The equation for ultimate bearing capacity (taking into account the shape, depth and inclination
factors) can be expressed as,
Vertical Load: 𝑞𝑞𝑓𝑓 = 𝑐𝑐𝑐𝑐𝑐𝑐𝑠𝑠𝑐𝑐𝑑𝑑𝑐𝑐 + 𝜎𝜎�𝑐𝑐𝑞𝑞𝑠𝑠𝑞𝑞𝑑𝑑𝑞𝑞 + 0.5𝛾𝛾𝛾𝛾𝑐𝑐𝛾𝛾𝑠𝑠𝛾𝛾𝑑𝑑𝛾𝛾
Inclined Load: 𝑞𝑞𝑓𝑓 = 𝑐𝑐𝑐𝑐𝑐𝑐𝑑𝑑𝑐𝑐𝑖𝑖𝑐𝑐 + 𝜎𝜎�𝑐𝑐𝑞𝑞𝑑𝑑𝑞𝑞𝑖𝑖𝑞𝑞 + 0.5𝛾𝛾𝛾𝛾𝑐𝑐𝛾𝛾𝑆𝑆𝛾𝛾𝑑𝑑𝛾𝛾
Above expression is of same form as that of Terzaghi, but𝑐𝑐𝑐𝑐 , 𝑐𝑐𝑞𝑞 and 𝑐𝑐𝛾𝛾 now depend upon the
depth and shape of the foundation and the angle of internal friction and the roughness of the
base.
𝑐𝑐𝑞𝑞 = 𝑒𝑒𝜋𝜋 tan 𝜑𝜑 tan2(45° + 𝜑𝜑 2⁄ )
𝑐𝑐𝑐𝑐 = (𝑒𝑒𝜋𝜋 tan 𝜑𝜑 tan2(45° + 𝜑𝜑 2⁄ ) − 1) cot𝜑𝜑
𝑐𝑐𝛾𝛾 = (𝑒𝑒𝜋𝜋 tan 𝜑𝜑 tan2(45° + 𝜑𝜑 2⁄ ) − 1) tan 1.4𝜑𝜑

Page 10 of 74
Table 2.2 MEYERHOF'S BEARING CAPACITY FACTORS[12]
𝜑𝜑° 𝑐𝑐𝑐𝑐 𝑐𝑐𝑞𝑞 𝑐𝑐𝛾𝛾
0 5.14 1.0 0
5 6.5 1.6 0.1
10 8.3 2.5 0.4
15 11.0 3.9 1.1
20 14.8 6.4 2.9
25 20.7 10.7 6.8
30 30.1 18.4 15.7
35 46.1 33.3 37.1
40 75.3 64.2 93.7
45 133.9 134.9 262.7
50 266.9 319.0 873.7
1.3.3 HANSEN’S MODIFICATION[12]:
Brinch Hansen (1960) modified the equation of Terzaghi by including five new
variables, namely, the (i) shape factor ‘s’, (ii) depth factor ‘d’, (iii) inclination factor ‘i’,
(iv) ground factor ‘g’ and (v) base factor ‘b’
and can be expressed as,
𝑞𝑞𝑢𝑢 = 𝑐𝑐𝑐𝑐𝑐𝑐𝑠𝑠𝑐𝑐𝑑𝑑𝑐𝑐𝑖𝑖𝑐𝑐𝑔𝑔𝑐𝑐𝑏𝑏𝑐𝑐 + 𝜎𝜎0𝑐𝑐𝑞𝑞𝑠𝑠𝑞𝑞𝑑𝑑𝑞𝑞𝑖𝑖𝑞𝑞𝑔𝑔𝑞𝑞𝑏𝑏𝑞𝑞 + 0.5𝛾𝛾𝛾𝛾𝑐𝑐𝛾𝛾𝑠𝑠𝛾𝛾𝑑𝑑𝛾𝛾𝑖𝑖𝛾𝛾𝑔𝑔𝛾𝛾𝑏𝑏𝛾𝛾
Where,
𝜎𝜎0 = effective overburden pressure at foundation level,

Page 11 of 74
s = shape factor, to consider the effect of the shape of the foundation in developing a
failure surface,
d = depth factor to account for the embedment depth and the extra shearing resistance in
the top soil,
i = inclination factor to account for both horizontal and vertical components of
foundation loads,
g = ground factor,
b = base factor, 𝛾𝛾 = density of soil below the foundation level.
Hansen’s recommendation for the bearing capacity factors are,
𝑐𝑐𝑞𝑞 = 𝑒𝑒𝜋𝜋 tan 𝜑𝜑 tan2(45° + 𝜑𝜑 2⁄ )
𝑐𝑐𝑐𝑐 = (𝑒𝑒𝜋𝜋 tan 𝜑𝜑 tan2(45° + 𝜑𝜑 2⁄ ) − 1) cot𝜑𝜑
𝑐𝑐𝛾𝛾 = 1.8 (𝑒𝑒𝜋𝜋 tan 𝜑𝜑 tan2(45° + 𝜑𝜑 2⁄ ) − 1) tan𝜑𝜑
Equations for depth and shape factors are,
𝑑𝑑𝑐𝑐 =1 + 0.35
𝛾𝛾𝐷𝐷𝑓𝑓
+ 0.61+7 tan 4 𝜑𝜑
dq = dc −(dc − 1)
Nq
𝑠𝑠𝑐𝑐 = 1 + (0.2 + tan6 𝜑𝜑)𝛾𝛾 𝐿𝐿�
Where L = Length of the rectangular foundation

Page 12 of 74
𝑠𝑠𝑞𝑞 = 𝑠𝑠0 − (𝑠𝑠0 − 1)/𝑐𝑐𝑞𝑞
𝑠𝑠 = 1 − 12� (0.2 + tan2 𝜑𝜑)𝛾𝛾 𝐿𝐿�
1.4 PRINCIPLES OF REINFORCED EARTH
Soil mass is generally a discrete system which consists of soil grains. It cannot bear tensile
stresses and this is particularly true in the case of cohesion less soil like sand. Such soils cannot
be stable on steep slopes and relatively large strains are caused when external loads are imposed
on them. Reinforced earth is a composite material, a combination of soil and reinforcement
suitably placed to bear the tensile stresses developed and also to improve the resistance of soil in
the direction of greatest stress. The presence of reinforcement alters the stress field giving a
restraint mostly in the form of friction or adhesion so thatless strainis induced and tension is
avoided. Inclusions like discrete &short fibers placed random or in definite layers will also
impart additional resistance by way of cohesion and friction.
1.5 EFFECT OF REINFORCEMENT ON SOIL
1.5.1 TRANSFER OF FORCE FROM SOIL TO REINFORCEMENT
Figure 1.3 shows cohesion less soil mass reinforced with a flat strip. The forces at the ends of the
strip are not equal when there is transference of force by friction to the soil mass (vidal, 1969). If
the average vertical stress in the soil is 𝜎𝜎𝑣𝑣in the region, the difference between the forces at the
end of a reinforcing element AB of length ‘dl’can be expressed by
𝑑𝑑𝑑𝑑 = 𝜎𝜎𝑣𝑣 . 2𝑤𝑤.𝑑𝑑𝑑𝑑. tan𝜑𝜑𝜇𝜇

Page 13 of 74
Where w is the width of the reinforcement and 𝜑𝜑𝜇𝜇 is the angle of friction between the
reinforcement and the soil.
Figure 1.3 Stress Transfer By Soil Reinforcement[13]
Therefore, if we consider a soil system with reinforcement at a spacing of ′∆ℎ′and ′∆𝑣𝑣′ as
shown in the figure 1.4 the effect of the reinforcement on the soil mass will be to restraint by
imposing an additional stress of
∆𝜎𝜎3 = ∆ℎ �𝑑𝑑𝑝𝑝∆𝑣𝑣�
This restraint on the soil system increases the resistance of the soil to failure under
applied stress.
Figure 1.4Confining Stress on Soil by Reinforcement[13]

Page 14 of 74
1.5.2 EQUIVALENT CONFINING STRESS CONCEPT
Fig. 1.5 shows the comparison of failure stresses on two soils, (i) unreinforced and (ii)
reinforced. The increase in the deviatoric stress is seen to be ∆𝜎𝜎3times kp, where kp is the
coefficient of passive earth pressure equal to tan2(45°+𝜑𝜑/2) and ∆𝜎𝜎3is the equivalent confining
stress on the sand imposed by the reinforcement (Yang, 1972).
Figure 1.5 Equivalent Confining Stress Concept[13]
1.5.3 PSEUDO COHESION CONCEPT[12]
This concept (Schlosser and Long, 1974) proposes that the reinforcement induces an
anisotropic or pseudo cohesion to the soil which depends on the spacing and strength of the
reinforcement as shown in the fig. 1.6. The increase in deviator stress at failure is
∆𝜎𝜎1 = 2𝑐𝑐. tan(45° +𝜑𝜑2
)

Page 15 of 74
Where ‘c’ is the pseudo cohesion induced in the soil and 𝜑𝜑 is the angle of friction. Both the
equivalent confining stress concept and the pseudo cohesion concept are linked to the stress
induced in the reinforcement. If 𝛼𝛼𝑓𝑓 is the force in the reinforcement per unit width of soil mass
and ∆𝑣𝑣 is the vertical spacing.
𝛼𝛼𝑓𝑓∆𝑣𝑣
isthe equivalent confining pressure ∆𝜎𝜎3
And ∆𝜎𝜎1 = 𝛼𝛼𝑓𝑓∆𝑣𝑣
. 𝑡𝑡𝑎𝑎𝑡𝑡2(45° + 𝜑𝜑2
)
Or ∆𝜎𝜎1 = 2c. tan(45° + 𝜑𝜑2
) which yields
𝑐𝑐 = 𝛼𝛼𝑓𝑓2∆𝑣𝑣
. tan(45° + 𝜑𝜑2)
Figure 1.6Pseudo Cohesion Concept[13]
The value of 𝛼𝛼𝑓𝑓 is same as the tensile strength of the reinforcement, if the reinforcement fails by
breakage or the maximum force transferred by friction between the soil and reinforcement, if
there is bond failure and reinforcement pulls off.
Page 16 of 74
In the above mentioned concept, it is necessary that the layer of reinforcement must be
close enough so that there is effective transfer of stress by friction or adhesion as the case may be
and hence the granular soils of high relative density are particularly suitable for use in reinforced
earth.
The concept outlined above can also hold good for cohesive soils to a very limited extend
only since the adhesion of the clay to reinforcement is small and its effect on restraint does not
have a multiplying effect as in granular materials.
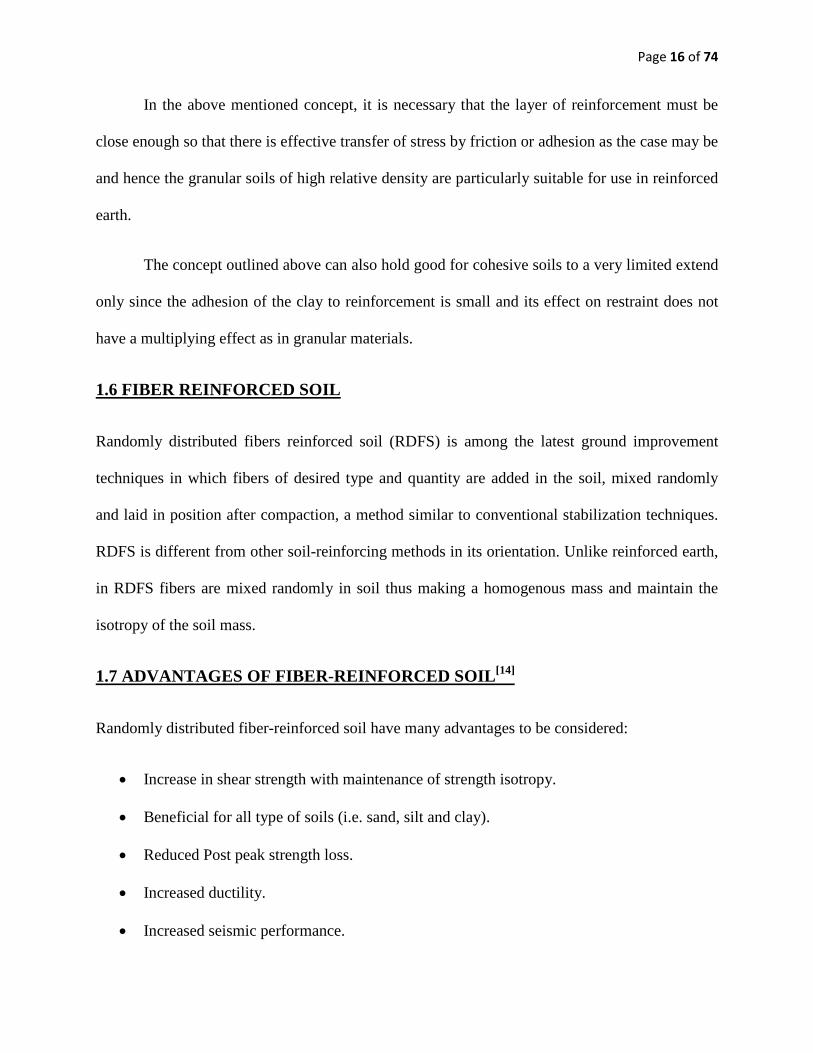
1.6 FIBER REINFORCED SOIL
Randomly distributed fibers reinforced soil (RDFS) is among the latest ground improvement
techniques in which fibers of desired type and quantity are added in the soil, mixed randomly
and laid in position after compaction, a method similar to conventional stabilization techniques.
RDFS is different from other soil-reinforcing methods in its orientation. Unlike reinforced earth,
in RDFS fibers are mixed randomly in soil thus making a homogenous mass and maintain the
isotropy of the soil mass.
1.7 ADVANTAGES OF FIBER-REINFORCED SOIL[14]
Randomly distributed fiber-reinforced soil have many advantages to be considered:
• Increase in shear strength with maintenance of strength isotropy.
• Beneficial for all type of soils (i.e. sand, silt and clay).
• Reduced Post peak strength loss.
• Increased ductility.
• Increased seismic performance.

Page 17 of 74
• No catastrophic failure
• Great capacity to use natural or waste material such as coir fibers and recycled waste
plastic strips.
• Provide erosion control and facilitate vegetation development
• Reduce shrinkage and swell pressures of expansive soil.
• No appreciable change in permeability.
• Unlike lime, cement, and other chemical stabilization methods, the construction using
fiber-reinforcement is not greatly affected by weather conditions.
• Fiber-reinforcement has been reported to be helpful in discarding the shallow failure on
the slope face and thus reducing the cost of maintenance.
1.8 MECHANISM OF REINFORCEMENT
Randomly oriented discrete inclusions added into soil improve its load-deformation behavior by
interacting with the soil particles mechanically through surface friction and also by interlocking.
The function of the bond is to transfer the stress from the soil to the discrete inclusions by
mobilizing the tensile strength of discrete fibers. Thus, fiber-reinforcement works as frictional
and tension resistant element.
1.9 TYPES OF FIBERS
Fibers can be classified in two main categories: Synthetic fiber and Natural Fiber
(i) Synthetic fibers:The various types of synthetic fibers are nylon, plastic,
polypropylene, glass, asbestos, etc. These are generally preferred than the natural
fibers because of their higher strength and resistance.

Page 18 of 74
(ii) The various types of natural fiber available in India are coir, sisal, jute, hemp, bhabar,
munja, bamboo, banana. In order to minimize the cost of the reinforced soil, locally
available fibers are considered in design. Due to its low strength and lack of
durability, natural fibers are not used widely for reinforcements but are preferred for
erosion control as they are eco-friendly.
1.10 DIRECTION OF REINFORCEMENTS
As the reinforced earth functions through a system of restraints of soil deformation by transfer of
stress to reinforcement, it is logical to place the reinforcement in the direction where stress is
maximum in an earth mass. Normally in a soil systemthe reinforcement is most effective in the
horizontal direction.
However, by introducing reinforcement and increasing strain, shear stresses are induced
in a horizontal plane and consequently horizontal and vertical planes cease to be the principal
planes and direction of maximum strains.
Fibers can be oriented or mixed randomly in the soil. In oriented case, the fibers are placed
within the soil at specific positions and directions. In case of random orientation, fibers are mixd
with the soil and placed within the probable shear zone.
1.11 FACTORS AFFECTING THE STRENGTH AND PROPERTIES OF RANDOMLY
DISTRIBUTED FIBER-REINFORCED SOIL
• Type of soil
• Type of Fiber: monofilament or fibrillated
• FIBER CONTENT: EXPRESSED IN % WITH RESPECT TO WEIGHT OF SOIL.

Page 19 of 74
• DENIER OF FIBER
• FIBER LENGTH
• ASPECT RATIO
• FIBER-SOIL SURFACE FRICTION
1.12 MODES OF FAILURES IN REINFORCED EARTH STRUCTURES[14]
The following modes of failure have been observed in reinforced earth structures.
(I) Shear failure of the soil above the upper most layer of reinforcement: this mode of
failure is possible if the depth to the topmost layer of reinforcement is sufficiently
large so as to form an effective boundary into which the shear zones cannot penetrate.
(II) Reinforcement pullout failures: the type of failure occurs for reinforcements placed at
shallow depths below the footing and/or reinforcements which have insufficient
anchorage
(III) Reinforcement tension failure: this type of failure occurs in the case of long and
shallow reinforcements for which the functional pullout resistance is more than the
tensile strength.

Page 20 of 74
Chapter 2
LITERATURE
REVIEW

Page 21 of 74
LITERATURE REVIEW: In comparison to systematically reinforced soils, less information has been reportedon
randomly distributed fiber-reinforced soils in the literature. However, anincreasing
number of experimental and numerical studies on the subject have beenconducted by
several researchers in the past few decades (e.g., Hoare, 1979; Grayand Ohashi, 1983;
Freitag, 1986; Gray and Al-Refeai, 1986; Maher and Gray, 1990;Ranjan et al., 1996;
Bauer and Oancea, 1996; Michalowski and Zhao, 1996; Wastiand Butun, 1996; Consoli
et al., 1998; Kumar et al., 1999; Santoni et al., 2001;Kaniraj and Havanagi, 2001).
These previous studies indicate that stress–strain–strength properties of randomly
distributed fiber-reinforced soils are also a functionof fiber content, aspect ratio, and
fiber-surface friction along with the soil and fiberindex and strength characteristics.
Gray Donald H, OhashiHarukazu.[1983] Direct shear tests were run on a dry sand
reinforced with differenttypes of fibers. Both natural and synthetic fibers plus metal wires
were tested.Experimental behavior was compared with theoretical predictions based on
aforce equilibrium model of a fiber reinforced sand. Test results showed thatfiber
reinforcement increased the peak shear strength and limited post peakreductions in shear
resistance. The fiber reinforcement model correctly predictedthe influence of various
sand-fiber parameters through shear strengthincreases that were: (1) Directly proportional
to concentration or area ratio offibers; (2) greatest for initial fiber orientations of 60° with
respect to the shearsurface; and (3) approximately the same for a reinforced sand tested in

Page 22 of 74
a looseand dense state, respectively. The findings of this study are relevant to suchdiverse
problems as the contribution of roof reinforcement to the stability ofsandy, coarse
textured soils in granitic slopes, dune and beach stabilization bypioneer plants, tillage in
root permeated soils, and soil stabilization with lowmodulus, woven fabrics.
Wasti Y., Butun M.D., [1996]. A series of laboratory model tests on a strip footing
supported by sandreinforced by randomly distributed polypropylene fiber and mesh
elements wasconducted in order to compare the results with those obtained from
unreinforcedsand and with each other. For conducting the model tests, uniformsand was
compacted in the test box at its optimum moisture content andmaximum dry density.
Three types of reinforcement, two sizes of meshelements having the same opening size
and one size of fiber element cut fromthe meshes, were used in varying amounts in the
tests. Results indicated thatreinforcement of sand by randomly distributed inclusions
caused an increase inthe ultimate bearing capacity values and the settlement at the
ultimate load ingeneral. The effectiveness of discrete reinforcing elements was observed
todepend on the quantity as well as the shape of the inclusions. The larger meshsize was
found to be superior to other inclusions considering the ultimatebearing capacity values.
For the mesh elements there appears to be an optimuminclusion ratio, whereas fibers
exhibited a linearly increasing trend onthe basis of an increase in ultimate bearing
capacity for the range of reinforcement amounts employed.

Page 23 of 74
McGown, Andrews & Hytiris(1985) Drained triaxial test and model footing tests were
done. Result showed that mesh increased the deviator stress developed at all strains, even
at very small strains, and the peak stresses in the sand-mesh mixture occurred at slightly
higher axial strains than for the sand alone. Very large improvements were obtained at all
strain levels which were similar to triaxial tests in terms of both strength and deformation
characteristics. Recoverable settlement plot shows that where a layer of sand –mesh
mixture was present, almost 20% of the imposed vertical settlement was recovered,
which was 4 times that for the soil alone.
Yetimoglu T Salbas O [2003]A study was undertaken to investigate the shear strength of
sands reinforced with randomlydistributed discrete fibers by carrying out direct shear
tests. The effect of the fiberreinforcement content on the shear strength was investigated.
The results of the testsindicated that peak shear strength and initial stiffness of the sand
were not affectedsignificantly by the fiber reinforcement. The horizontal displacements at
failure were alsofound comparable for reinforced and unreinforced sands under the same
vertical normalstress. Fiber reinforcements, however, could reduce soil brittleness
providing smaller loss ofpost-peak strength. Thus, there appeared to be an increase in
residual shear strength angle ofthe sand by adding fiber reinforcements.
HatafN., Rahimi M.M., [2005]. A series of laboratory model tests has been carried out
to investigate the using of shredded waste tires as reinforcement to increasethe bearing
capacity of soil. Shred content and shreds aspect ratio are the main parameters that affect

Page 24 of 74
the bearing capacity.Tire shreds with rectangular shape and widths of 2 and 3 cm with
aspect ratios 2, 3, 4 and 5 are mixed with sand. Five shred contentsof 10%, 20%, 30%,
40% and 50% by volume were selected. Addition of tire shreds to sand increases BCR
(bearing capacity ratio)from 1.17 to 3.9 with respect to shred content and shreds aspect
ratio. The maximum BCR is attained at shred content of 40% anddimensions of 3 · 12
cm. It is shown that increasing of shred content increases the BCR. However, an
optimum value for shred contentis observed after that increasing shreds led to decrease in
BCR. For a given shred width, shred content and soil density it seems that aspect ratio of
4 gives maximum BCR.

Page 25 of 74
Chapter 3
EXPERIMENTAL INVESTIGATIONS

Page 26 of 74
3.1TEST SAND PREPARATION
Relatively uniformly graded sand was used in this study. The sand used in the test was cleaned
and sieved by 200 micron sieve. This sand is classified as SW by Unified Soil Classification
System (USCS). The particle size distribution of the sand is shown in Fig. 3.1. It had a mean
grain diameter (D50) of 0.55 mm. Various tests are performed to obtain the engineering
properties of sand. Those are listed in Table 3.4.
3.2 DETERMINATION OF PROPERTIES OF THE TEST SAND
3.2.1 GRAIN SIZE DISTRIBUTION
Materials and Equipments used:
(i) Balance accurate to 1 g,
(ii) Set of IS sieves: 2 mm, 1 mm , 600 micron, 425 micron, 212 micron
(iii) Thermostatically controlled oven,
(iv) Trays, Sieve Brushes and a wire brush
Table 3.1 Data and Observation Sheet for Sieve Analysis
Sl.
No. IS sieve
Particle size
D (mm)
Mass
Retained (g)
Cumulative
retained (g)
Cumulative
% retained
Cumulative
% finer
1 2 mm 2 0.4 0.4 0.13 99.87
2 1 mm 1 19.2 19.6 6.53 93.47
3 600 micron 0.6 100.5 120.1 40.03 59.97
4 425 micron 0.425 110.3 230.4 76.8 23.2
5 212 micron 0.212 68 298.4 99.47 0.53

Page 27 of 74
Figure 3.1 Grain Size Distribution
3.2.2 DETERMINATION OF SPECIFIC GRAVITY
Materials and Equipments:
(i) Pycnometer, with a stopper,
(ii) Balance sensitive to 0.01 g,
(iii) Glass rod,
(iv) Distilled water
0
20
40
60
80
100
120
100 1000
%ag
e Fi
ner
Grain Size (in micrometres)
coarse sand

Page 28 of 74
Table 3.2 Data & Observation Sheet
Test No. 1 2 3
Temperature (deg.) 27 27 27
Bottle No. 8 11 2
Weight of Sp. Gr. Bottle W1(g) 122.93 124.12 116.53
Weight of Sp. Gr. Bottle + Soil W2(g) 172.93 174.12 166.53
Weight of Sp. Gr. Bottle + Soil +Water W3(g) 409.84 411.34 404.04
Weight of Sp. Gr. Bottle + Water W4(g) 378.89 380.28 372.9
Specific Gravity of Soil (G) 2.62 2.63 2.65
Average 2.63
3.2.3 DETERMINATION OF MAXIMUM AND MINIMUM DENSITY
Materials and Equipments:
(i) Mould (15 cm dia, 17 cm height)
(ii) Balance sensitive to 1g
(iii) Dynamic Shaker
(iv) Funnel
Table 3.3 Data Sheet for Max. & Min. Density
Specimen for Wt. of Sand (g) Volume of the mould (cc) Density(g/cc) Void ratio
Maximum Density 4886 3004.15 1.6264 0.6171
Minimum Density 4166 3004.15 1.3867 0.8966

Page 29 of 74
Table 3.4 Properties of Sand
Property Value
Specific gravity 2.63
Maximum dry unit weight(kN/m3) 15.95
Minimum dry unit weight(kN/m3) 13.60
Maximum void ratio 0.897
Minimum void ratio 0.617
Effective grain size D10 (mm) 0.30
D60 (mm) 0.60
D30 (mm) 0.47
Co-efficient of Uniformity (CU) 2.00
Co-efficient of Curvature (CC) 1.227
3.3 TEST REINFORCEMENT :
Coir fiber is used as reinforcement during the experimental work. It was cut into small
sizes(about 12-15 mm). Fiber properties of coir are given in Table 3.5.
Figure 3.2 Reinforcement used (coir)

Page 30 of 74
Table 3.5 Fiber Properties of Coir[16]
Quantity Value Unit
Young's modulus 4000 - 5000 MPa
Tensile strength 140 - 150 MPa
Elongation 15 - 17.3 %
Thermal conductivity 0.047 - 0.047 W/m.K
Density 1.15 - 1.33 kg/m3
Water absorption 10 - 0 %
3.4 WORK PROCEDURE
3.4.1 MATERIALS AND EQUIPMENTS USED
(i) Mould ( Internal Dia. : 25.7 cm , Height: 30.1 cm)
[The steel cylindrical tank was designed big enough to avoid boundary effect on
bearing capacity.]
Figure 3.3 Mould used for specimen preparation

Page 31 of 74
(ii) Cover Plate (thickness: 1.7 cm, dia.: 25.6 cm)
(iii) Trays
(iv) Shaker
(v) Proving Ring (No. PR. 5 KN.0256, No. PR 1 KN. 0292)
(vi) Dial Gauge (least count 0.01 mm)
Figure 3.4 Proving Ring
Figure 3.5 Dial Gauge

Page 32 of 74
(vii) Loading Frame
3.4.2 EXPERIMENTAL SETUP
• All the engineering properties of the sand were determined with the help of experiments
as mentioned earlier.
• Weight of sand required to be filled in the given mould for different relative densities
were calculated.
• Specimens were prepared for each relative density.
• The model footing was made out of steel plate of 5 mm thickness and diameter 45 mm. It
had a smooth bottom face and a hole at the center of the top face for mounting the
proving ring.
Figure 3.6 Loading Frame at NIT ROURKELA

Page 33 of 74
• A dial gauges was attached along the centre-line on both sides of the footing to measure
the displacement (settlement).
• The sand was placed in the mould and compacted to attain desired relative density.
• Fiber to be added in the sand was considered as a part of the solids fraction in the void-
solid matrix of the soil.
• The designated fibers were weighed according to the pre-determined reinforcement
content and mixed into the sand in small parts until all of the fibers were effectively
distribution within the sand. The fibers were mixed thoroughly by hand to get a fairly
uniform mixture. During mixing, a segregation or floating tendency of fibers was noted.
Much care was taken to mix the fibers uniformly. With increase in fiber content,
difficulty in mixing also increased. However, it was possible to get a acceptably uniform
fiber-sand mixture.
Figure 3.7 Compaction on the Shaker Figure 3.8 Compacted Specimen

Page 34 of 74
• The specimen prepared is placed on the loading frame and load is applied by strain-
controlled gear mechanism. The rate of strain applied was 1.2 mm/min. The resistance
offered by the footing(Bearing pressure of the footing) was noted from the dial gauge of
the proving ring at different penetration values. Hence Stress strain curve for different
relative densities with and without reinforcement was determined.
3.4.3 TEST VARIABLES
3.4.3.1 Fiber Content
Specimens for different fiber contents were prepared. In this study fiber contents of 0%, 0.1%,
0.25%, 0.5%, 0.75% were considered.
3.4.3.2 Relative Density
Specimens for different relative densities were prepared. In this project work relative densities of
40%, 55%, 73%, 88% were considered.
Four specimens for each case were prepared and best three results were averaged and plotted.

Page 35 of 74
Chapter 4
RESULTS &
DISCUSSIONS

Page 36 of 74
4.1 RESULTS & DISCUSSIONS
The stress-strain curves obtained from the tests for unreinforced sand & reinforced sand with the
fiber content of 0.1% to 0.75% and with different relative densities are shown in Figures 4.1 –
4.9. The test results obtained suggest that the fiber reinforcements can change the brittle behavior
of the sand to a comparatively ductile one. That means, the samples tested with fiber inclusions
exhibited a smaller loss of post-peak strength. This reduction in the loss of post-peak strength is
magnified for higher vertical stresses and fiber contents.
Curves of Bearing Capacity- Fiber Content, Bearing Capacity- Relative Density were also
plotted to display the variation of bearing capacity with inclusion of reinforcements.
Curves of Bearing Capacity Ratio- Fiber Content, Bearing Capacity Ratio - Relative Density
were also plotted. These show the magnification in bearing capacity with introduction of fiber
reinforcement.

Page 37 of 74
TABLE 4.1 (Data Sheet for the specimens having fiber content = 0%)
R.D. = 88% R.D. = 73% R.D. = 55% R.D. = 40% Settlement (in mm )
% strain Stress (KPa) Stress (KPa) Stress (KPa) Stress (KPa)
0 0 0 0 0 0 0.5 1.1 158.36 19.79 25.17 4.40 1 2.2 239.37 47.41 59.14 25.66
1.5 3.3 276.76 75.02 76.61 43.99 2 4.4 280.42 91.89 87.98 69.65
2.5 5.6 250.37 93.84 92.62 84.31 3 6.7 195.01 93.11 90.42 87.24
3.5 7.8 153.96 87.73 85.29 81.38 4 8.9 126.47 83.09 78.69 73.31
4.5 10.0 108.14 79.91 75.88 71.11 5 11.1 92.01 76.25 74.17 61.58
5.5 12.2 89.44 72.82 70.87 57.92 6 13.3 82.11 71.11 68.79 50.59
6.5 14.4 74.05 70.38 67.20 46.92 7 15.6 77.35 69.40 67.20 42.52
7.5 16.7 76.25 69.40 64.88 40.32 8 17.8 76.98 68.91 64.03 35.19
8.5 18.9 75.51 69.65 65.13 38.12 9 20.0 76.61 71.85 66.23 40.32
9.5 21.1 78.45 73.07 66.47 41.06 10 22.2 86.88 75.02 66.84 46.92
10.5 23.3 92.74 76.49 69.28 48.39 11 24.4 100.44 78.69 70.75 47.65
11.5 25.6 103.01 79.18 71.72 49.12 12 26.7 109.24 81.13 73.68 50.59
12.5 27.8 118.77 83.09 74.17 54.25 13 28.9 124.27 85.04 75.64 54.25
13.5 30.0 127.57 85.29 77.35 57.92 14 31.1 133.06 86.27 78.20 58.65
14.5 32.2 134.90 88.46 80.40 61.58 15 33.3 139.30 92.37 81.13 64.52
15.5 34.4 146.99 95.06 80.89 65.98 16 35.6 152.49 97.26 82.48 68.18
16.5 36.7 160.92 100.93 83.46 71.11 17 37.8 164.59 102.64 83.58 75.51
17.5 38.9 165.69 106.79 87.73 76.25 18 40.0 172.65 110.00 90.05 78.45
18.5 41.1 175.95 113.00 91.64 81.38 19 42.2 188.05 121.00 93.11 80.64
19.5 43.3 192.45 129.00 94.45 84.31

Page 38 of 74

Page 39 of 74
TABLE 4.2 (Data Sheet for the specimens having fiber content = 0.1%)
R.D. = 88% R.D. = 73% R.D. = 55% R.D. = 40% Settlement (in mm )
% strain Stress (KPa) Stress (KPa) Stress (KPa) Stress (KPa)
0 0 0 0 0 0 0.5 1.1 109.97 43.25 27.13 14.66 1 2.2 186.95 90.91 44.72 25.66
1.5 3.3 250.00 127.57 58.65 32.26 2 4.4 301.68 151.76 66.72 35.92
2.5 5.6 314.15 161.29 70.38 37.39 3 6.7 297.65 157.62 65.25 36.66
3.5 7.8 251.83 153.96 65.25 35.19 4 8.9 213.71 144.43 63.05 35.19
4.5 10.0 162.76 143.69 62.32 33.72 5 11.1 139.66 140.76 61.58 32.26
5.5 12.2 131.60 134.90 61.58 29.33 6 13.3 122.80 126.83 60.85 28.59
6.5 14.4 115.84 121.70 60.85 28.59 7 15.6 111.80 120.97 62.32 31.52
7.5 16.7 104.11 122.43 63.05 33.72 8 17.8 107.04 115.10 62.32 33.72
8.5 18.9 107.04 112.17 62.32 36.66 9 20.0 104.11 117.30 65.25 37.39
9.5 21.1 104.11 117.30 63.78 38.86 10 22.2 109.60 123.17 65.25 38.86
10.5 23.3 113.64 126.10 65.98 40.32 11 24.4 121.33 122.43 65.98 39.59
11.5 25.6 126.83 126.10 66.72 40.32 12 26.7 129.76 123.90 65.98 40.32
12.5 27.8 131.96 122.43 65.25 41.06 13 28.9 134.16 129.03 69.65 41.79
13.5 30.0 141.49 133.43 70.38 43.25 14 31.1 145.16 137.83 74.78 45.45
14.5 32.2 151.39 145.16 74.05 48.39 15 33.3 159.82 148.09 76.98 52.05
15.5 34.4 165.32 151.03 79.18 52.79 16 35.6 173.02 151.76 79.91 53.52
16.5 36.7 179.62 156.16 81.38 52.79 17 37.8 185.48 158.36 82.11 52.05
17.5 38.9 192.45 164.96 84.31 54.25 18 40.0 197.58 164.22 88.71 54.25
18.5 41.1 200.51 170.09 89.44 55.72 19 42.2 209.31 173.75 92.37 56.45
19.5 43.3 213.34 176.69 98.24 58.65

Page 40 of 74

Page 41 of 74
TABLE 4.3 (Data Sheet for the specimens having fiber content = 0.25%)
R.D. = 88% R.D. = 73% R.D. = 55% R.D. = 40% Settlement (in mm )
% strain Stress (KPa) Stress (KPa) Stress (KPa) Stress (KPa)
0 0 0 0 0 0 0.5 1.1 0 0 0 0 1 2.2 39.22 46.92 36.66 22.73
1.5 3.3 87.98 92.37 70.38 37.76 2 4.4 131.96 140.40 90.91 46.92
2.5 5.6 166.05 185.48 107.40 52.79 3 6.7 193.18 222.51 120.23 56.08
3.5 7.8 208.94 250.37 126.83 57.18 4 8.9 211.14 263.56 125.37 54.62
4.5 10.0 203.44 279.32 124.27 52.42 5 11.1 196.11 290.69 120.97 51.32
5.5 12.2 181.08 288.49 116.57 51.32 6 13.3 176.32 274.93 112.90 50.59
6.5 14.4 160.19 267.23 112.17 50.59 7 15.6 151.76 265.03 109.24 48.39
7.5 16.7 151.03 259.90 108.50 49.49 8 17.8 149.19 254.76 107.04 51.69
8.5 18.9 149.93 245.23 108.14 53.89 9 20.0 151.39 235.34 109.97 54.99
9.5 21.1 152.49 234.60 110.70 54.62 10 22.2 155.42 234.60 112.17 56.45
10.5 23.3 159.09 240.10 112.54 57.18 11 24.4 158.36 243.40 112.54 58.28
11.5 25.6 163.12 245.23 114.00 59.75 12 26.7 167.89 245.97 114.74 60.12
12.5 27.8 169.72 248.17 117.67 61.95 13 28.9 175.95 254.76 115.10 62.68
13.5 30.0 176.32 259.53 117.30 64.88 14 31.1 181.08 262.83 120.97 66.72
14.5 32.2 185.48 266.49 123.90 70.38 15 33.3 189.88 267.59 129.03 73.68
15.5 34.4 198.31 272.36 131.96 77.35 16 35.6 201.98 269.43 137.83 78.45
16.5 36.7 207.11 282.99 138.93 79.91 17 37.8 212.24 293.99 142.59 78.45
17.5 38.9 222.87 296.19 145.16 79.18 18 40.0 222.14 311.22 146.63 80.64
18.5 41.1 229.10 320.75 147.36 81.38 19 42.2 233.50 336.14 149.93 85.41
19.5 43.3 242.30 353.00 150.66 87.98

Page 42 of 74

Page 43 of 74
TABLE 4.4 (Data Sheet for the specimens having fiber content = 0.5%)
R.D. = 88% R.D. = 73% R.D. = 55% R.D. = 40% Settlement (in mm )
% strain Stress (KPa) Stress (KPa) Stress (KPa) Stress (KPa)
0 0 0 0 0 0 0.5 1.1 45.66 63.64 5.87 28.59 1 2.2 113.37 121.47 46.19 51.32
1.5 3.3 217.30 173.85 80.64 74.41 2 4.4 319.65 222.21 112.90 95.31
2.5 5.6 436.17 267.93 147.36 114.37 3 6.7 544.82 301.38 178.15 133.80
3.5 7.8 637.72 324.11 201.61 150.29 4 8.9 719.60 341.73 222.87 166.42
4.5 10.0 773.14 356.56 236.80 182.55 5 11.1 793.61 366.74 239.73 194.28
5.5 12.2 785.74 370.95 247.07 204.18 6 13.3 757.39 372.83 246.33 217.37
6.5 14.4 730.63 372.15 249.27 226.91 7 15.6 695.98 369.84 248.53 238.64
7.5 16.7 664.49 365.36 244.87 244.13 8 17.8 640.87 355.15 245.60 251.47
8.5 18.9 620.40 347.60 248.53 255.13 9 20.0 599.93 346.41 251.47 259.16
9.5 21.1 579.46 340.30 253.66 261.73 10 22.2 565.29 332.48 252.93 264.29
10.5 23.3 557.42 323.58 253.66 268.33 11 24.4 540.10 320.02 248.53 274.93
11.5 25.6 533.80 317.44 250.73 280.06 12 26.7 516.48 316.81 255.86 280.06
12.5 27.8 507.03 315.46 255.13 281.52 13 28.9 508.60 313.26 260.26 286.66
13.5 30.0 503.88 311.16 269.06 295.09 14 31.1 514.90 316.41 272.73 300.22
14.5 32.2 524.35 320.78 280.06 298.75 15 33.3 529.07 323.93 286.66 299.85
15.5 34.4 535.37 321.70 291.79 306.82 16 35.6 543.25 328.27 303.52 313.78
16.5 36.7 552.69 333.70 305.72 318.91 17 37.8 568.44 346.84 314.51 320.75
17.5 38.9 579.46 359.25 321.85 324.78 18 40.0 585.76 367.39 318.91 326.61
18.5 41.1 598.36 379.94 324.05 324.78 19 42.2 609.38 391.61 329.91 328.44
19.5 43.3 623.55 402.93 335.04 327.34

Page 44 of 74

Page 45 of 74
TABLE 4.5 (Data Sheet for the specimens having fiber content = 0.75%)
R.D. = 88% R.D. = 73% R.D. = 55% R.D. = 40% Settlement (in mm )
% strain Stress (KPa) Stress (KPa) Stress (KPa) Stress (KPa)
0 0 0 0 0 0 0.5 1.1 66.13 66.13 71.85 30.79 1 2.2 122.82 136.99 115.10 60.12
1.5 3.3 193.68 203.13 160.56 88.71 2 4.4 278.71 264.54 186.95 117.30
2.5 5.6 377.91 321.22 206.74 147.36 3 6.7 472.39 340.12 225.81 175.95
3.5 7.8 566.87 344.84 233.87 201.61 4 8.9 666.07 335.40 236.07 229.47
4.5 10.0 751.10 321.22 241.93 253.66 5 11.1 864.47 302.33 239.73 268.33
5.5 12.2 973.12 283.43 236.07 284.46 6 13.3 1086.49 264.54 232.40 301.32
6.5 14.4 1195.14 240.92 222.87 304.25 7 15.6 1317.96 240.92 219.21 326.24
7.5 16.7 1417.16 245.64 224.34 336.51 8 17.8 1525.81 245.64 228.00 345.31
8.5 18.9 1634.46 250.37 226.54 365.10 9 20.0 1733.66 255.09 238.27 378.30
9.5 21.1 1823.42 264.54 252.20 380.50 10 22.2 1908.45 273.98 261.73 386.36
10.5 23.3 1988.75 288.16 272.73 392.96 11 24.4 2073.78 307.05 280.79 394.43
11.5 25.6 2154.09 325.95 301.32 401.76 12 26.7 2248.56 335.40 316.71 407.62
12.5 27.8 2343.04 354.29 339.44 413.49 13 28.9 2442.24 377.91 362.17 412.02
13.5 30.0 2536.72 406.25 378.30 421.55 14 31.1 2612.30 425.15 398.09 436.95
14.5 32.2 2678.44 444.04 420.82 442.08 15 33.3 2716.23 472.39 439.15 450.88
15.5 34.4 2768.19 486.56 451.61 458.94 16 35.6 2782.36 500.73 467.01 464.07
16.5 36.7 2787.09 524.35 473.60 469.21 17 37.8 2791.81 547.97 482.40 481.67
17.5 38.9 2805.98 566.87 494.87 498.53 18 40.0 2843.77 595.21 509.53 498.53
18.5 41.1 2839.05 628.28 513.19 509.53 19 42.2 2853.22 637.72 523.46 525.66
19.5 43.3 2857.94 670.79 545.45 538.85

Page 46 of 74

Page 47 of 74
TABLE 4.6 (Data Sheet for the specimens having Relative Density = 88%)
Fiber = 0% Fiber = 0.1% Fiber = 0.25% Fiber = 0.5% Fiber = 0.75%
Strain % Stress (KPa) Stress (KPa) Stress (KPa) Stress (KPa) Stress (KPa) 0 0 0 0 0 0
1.11 158.36 109.97 39.22 45.66 66.13 2.22 239.37 186.95 87.98 113.37 122.82 3.33 276.76 250.00 131.96 217.30 193.68 4.44 280.42 301.68 166.05 319.65 278.71 5.56 250.37 314.15 193.18 436.17 377.91 6.67 195.01 297.65 208.94 544.82 472.39 7.78 153.96 251.83 211.14 637.72 566.87 8.89 126.47 213.71 203.44 719.60 666.07
10.00 108.14 162.76 196.11 773.14 751.10 11.11 92.01 139.66 181.08 793.61 864.47 12.22 89.44 131.60 176.32 785.74 973.12 13.33 82.11 122.80 160.19 757.39 1086.49 14.44 74.05 115.84 151.76 730.63 1195.14 15.56 77.35 111.80 151.03 695.98 1317.96 16.67 76.25 104.11 149.19 664.49 1417.16 17.78 76.98 107.04 149.93 640.87 1525.81 18.89 75.51 107.04 151.39 620.40 1634.46 20.00 76.61 104.11 152.49 599.93 1733.66 21.11 78.45 104.11 155.42 579.46 1823.42 22.22 86.88 109.60 159.09 565.29 1908.45 23.33 92.74 113.64 158.36 557.42 1988.75 24.44 100.44 121.33 163.12 540.10 2073.78 25.56 103.01 126.83 167.89 533.80 2154.09 26.67 109.24 129.76 169.72 516.48 2248.56 27.78 118.77 131.96 175.95 507.03 2343.04 28.89 124.27 134.16 176.32 508.60 2442.24 30.00 127.57 141.49 181.08 503.88 2536.72 31.11 133.06 145.16 185.48 514.90 2612.30 32.22 134.90 151.39 189.88 524.35 2678.44 33.33 139.30 159.82 198.31 529.07 2716.23 34.44 146.99 165.32 201.98 535.37 2768.19 35.56 152.49 173.02 207.11 543.25 2782.36 36.67 160.92 179.62 212.24 552.69 2787.09 37.78 164.59 185.48 222.87 568.44 2791.81 38.89 165.69 192.45 222.14 579.46 2805.98 40.00 172.65 197.58 229.10 585.76 2843.77 41.11 175.95 200.51 233.50 598.36 2839.05 42.22 188.05 209.31 242.30 609.38 2853.22 43.33 192.45 213.34 243.77 623.55 2857.94

Page 48 of 74

Page 49 of 74
TABLE 4.7 (Data Sheet for the specimens having Relative Density = 73%)
Fiber = 0% Fiber = 0.1% Fiber = 0.25% Fiber = 0.5% Fiber = 0.75%
Strain % Stress (KPa) Stress (KPa) Stress (KPa) Stress (KPa) Stress (KPa) 0 0 0 0 0 0
1.11 19.79 43.25 46.92 63.64 66.13 2.22 47.41 90.91 92.37 121.47 136.99 3.33 75.02 127.57 140.40 173.85 203.13 4.44 91.89 151.76 185.48 222.21 264.54 5.56 93.84 161.29 222.51 267.93 321.22 6.67 93.11 157.62 250.37 301.38 340.12 7.78 87.73 153.96 263.56 324.11 344.84 8.89 83.09 144.43 279.32 341.73 335.40
10.00 79.91 143.69 290.69 356.56 321.22 11.11 76.25 140.76 288.49 366.74 302.33 12.22 72.82 134.90 274.93 370.95 283.43 13.33 71.11 126.83 267.23 372.83 264.54 14.44 70.38 121.70 265.03 372.15 240.92 15.56 69.40 120.97 259.90 369.84 240.92 16.67 69.40 122.43 254.76 365.36 245.64 17.78 68.91 115.10 245.23 355.15 245.64 18.89 69.65 112.17 235.34 347.60 250.37 20.00 71.85 117.30 234.60 346.41 255.09 21.11 73.07 117.30 234.60 340.30 264.54 22.22 75.02 123.17 240.10 332.48 273.98 23.33 76.49 126.10 243.40 323.58 288.16 24.44 78.69 122.43 245.23 320.02 307.05 25.56 79.18 126.10 245.97 317.44 325.95 26.67 81.13 123.90 248.17 316.81 335.40 27.78 83.09 122.43 254.76 315.46 354.29 28.89 85.04 129.03 259.53 313.26 377.91 30.00 85.29 133.43 262.83 311.16 406.25 31.11 86.27 137.83 266.49 316.41 425.15 32.22 88.46 145.16 267.59 320.78 444.04 33.33 92.37 148.09 272.36 323.93 472.39 34.44 95.06 151.03 269.43 321.70 486.56 35.56 97.26 151.76 282.99 328.27 500.73 36.67 100.93 156.16 293.99 333.70 524.35 37.78 102.64 158.36 296.19 346.84 547.97 38.89 106.79 164.96 311.22 359.25 566.87 40.00 110.00 164.22 320.75 367.39 595.21 41.11 113.00 170.09 336.14 379.94 628.28 42.22 121.00 173.75 353.00 391.61 637.72 43.33 129.00 176.69 363.27 402.93 670.79

Page 50 of 74

Page 51 of 74
TABLE 4.8 (Data Sheet for the specimens having Relative Density = 55%)
Fiber = 0% Fiber = 0.1% Fiber = 0.25% Fiber = 0.5% Fiber = 0.75%
Strain % Stress (KPa) Stress (KPa) Stress (KPa) Stress (KPa) Stress (KPa) 0 0 0 0 0 0
1.11 25.17 27.13 36.66 5.87 71.85 2.22 59.14 44.72 70.38 46.19 115.10 3.33 76.61 58.65 90.91 80.64 160.56 4.44 87.98 66.72 107.40 112.90 186.95 5.56 92.62 70.38 120.23 147.36 206.74 6.67 90.42 65.25 126.83 178.15 225.81 7.78 85.29 65.25 125.37 201.61 233.87 8.89 78.69 63.05 124.27 222.87 236.07
10.00 75.88 62.32 120.97 236.80 241.93 11.11 74.17 61.58 116.57 239.73 239.73 12.22 70.87 61.58 112.90 247.07 236.07 13.33 68.79 60.85 112.17 246.33 232.40 14.44 67.20 60.85 109.24 249.27 222.87 15.56 67.20 62.32 108.50 248.53 219.21 16.67 64.88 63.05 107.04 244.87 224.34 17.78 64.03 62.32 108.14 245.60 228.00 18.89 65.13 62.32 109.97 248.53 226.54 20.00 66.23 65.25 110.70 251.47 238.27 21.11 66.47 63.78 112.17 253.66 252.20 22.22 66.84 65.25 112.54 252.93 261.73 23.33 69.28 65.98 112.54 253.66 272.73 24.44 70.75 65.98 114.00 248.53 280.79 25.56 71.72 66.72 114.74 250.73 301.32 26.67 73.68 65.98 117.67 255.86 316.71 27.78 74.17 65.25 115.10 255.13 339.44 28.89 75.64 69.65 117.30 260.26 362.17 30.00 77.35 70.38 120.97 269.06 378.30 31.11 78.20 74.78 123.90 272.73 398.09 32.22 80.40 74.05 129.03 280.06 420.82 33.33 81.13 76.98 131.96 286.66 439.15 34.44 80.89 79.18 137.83 291.79 451.61 35.56 82.48 79.91 138.93 303.52 467.01 36.67 83.46 81.38 142.59 305.72 473.60 37.78 83.58 82.11 145.16 314.51 482.40 38.89 87.73 84.31 146.63 321.85 494.87 40.00 90.05 88.71 147.36 318.91 509.53 41.11 91.64 89.44 149.93 324.05 513.19 42.22 93.11 92.37 150.66 329.91 523.46 43.33 94.45 98.24 157.62 335.04 545.45
Page 52 of 74

Page 53 of 74
TABLE 4.9 (Data Sheet for the specimens having Relative Density = 40%)
Fiber = 0% Fiber = 0.1% Fiber = 0.25% Fiber = 0.5% Fiber = 0.75%
Strain % Stress (KPa) Stress (KPa) Stress (KPa) Stress (KPa) Stress (KPa) 0 0 0 0 0 0
1.11 4.40 14.66 22.73 28.59 30.79 2.22 25.66 25.66 37.76 51.32 60.12 3.33 43.99 32.26 46.92 74.41 88.71 4.44 69.65 35.92 52.79 95.31 117.30 5.56 84.31 37.39 56.08 114.37 147.36 6.67 87.24 36.66 57.18 133.80 175.95 7.78 81.38 35.19 54.62 150.29 201.61 8.89 73.31 35.19 52.42 166.42 229.47
10.00 71.11 33.72 51.32 182.55 253.66 11.11 61.58 32.26 51.32 194.28 268.33 12.22 57.92 29.33 50.59 204.18 284.46 13.33 50.59 28.59 50.59 217.37 301.32 14.44 46.92 28.59 48.39 226.91 304.25 15.56 42.52 31.52 49.49 238.64 326.24 16.67 40.32 33.72 51.69 244.13 336.51 17.78 35.19 33.72 53.89 251.47 345.31 18.89 38.12 36.66 54.99 255.13 365.10 20.00 40.32 37.39 54.62 259.16 378.30 21.11 41.06 38.86 56.45 261.73 380.50 22.22 46.92 38.86 57.18 264.29 386.36 23.33 48.39 40.32 58.28 268.33 392.96 24.44 47.65 39.59 59.75 274.93 394.43 25.56 49.12 40.32 60.12 280.06 401.76 26.67 50.59 40.32 61.95 280.06 407.62 27.78 54.25 41.06 62.68 281.52 413.49 28.89 54.25 41.79 64.88 286.66 412.02 30.00 57.92 43.25 66.72 295.09 421.55 31.11 58.65 45.45 70.38 300.22 436.95 32.22 61.58 48.39 73.68 298.75 442.08 33.33 64.52 52.05 77.35 299.85 450.88 34.44 65.98 52.79 78.45 306.82 458.94 35.56 68.18 53.52 79.91 313.78 464.07 36.67 71.11 52.79 78.45 318.91 469.21 37.78 75.51 52.05 79.18 320.75 481.67 38.89 76.25 54.25 80.64 324.78 498.53 40.00 78.45 54.25 81.38 326.61 498.53 41.11 81.38 55.72 85.41 324.78 509.53 42.22 80.64 56.45 87.98 328.44 525.66 43.33 84.31 58.65 91.28 327.34 538.85

Page 54 of 74

Page 55 of 74
TABLE 4.10 (Variation of bearing capacity with fiber % for different Relative Densities)
Bearing Capacity
Fiber % R.D. = 40% R.D. = 55% R.D. = 73% R.D. = 88%
0 87.25 92.61 95.8 280.4
0.1 40.15 70.38 161.28 314.15
0.25 57.8 126.83 208.95 290.71
0.5 259.16 247.07 370.95 793.61
0.75 378.3 239.27 344.84 1733.66
Figure 4.10 Bearing Capacities vs. Fiber Content
0
200
400
600
800
1000
1200
1400
1600
1800
2000
0 0.1 0.2 0.3 0.4 0.5 0.6 0.7 0.8
Bear
ing
Capa
city
(kN
/m2)
fiber content
R.D.=40
R.D.=55
R.D.=73
R.D.=88

Page 56 of 74
TABLE 4.11 (Variation of bearing capacity with Relative Densities for different fiber %)
Bearing Capacity
R.D. Fiber = 0% Fiber = 0.1% Fiber = 0.25% Fiber = 0.5% Fiber = 0.75%
40 87.25 40.15 57.8 259.16 378.3
55 92.61 70.38 126.83 247.07 239.27
73 95.8 161.28 208.95 370.95 344.84
88 280.4 314.15 290.71 793.61 1733.66
Figure 4.11 Bearing Capacities vs. Relative Density
0
200
400
600
800
1000
1200
1400
1600
1800
2000
0 20 40 60 80 100
Bear
ing
Capa
city
(kN
/m2)
Relative Density
Fiber - 0%
Fiber - 0.1%
Fiber - 0.25%
Fiber - 0.5%
Fiber - 0.75%

Page 57 of 74
TABLE 4.12 (Variation of bearing capacity ratio with fiber % for different Relative Densities)
Bearing Capacity Ratio
Fiber % R.D. = 40% R.D. = 55% R.D. = 73% R.D. = 88%
0 1 1.061433 1.034446 2.926931
0.1 1 1.752927 2.29156 1.947855
0.25 1 2.194291 1.647481 1.39129
0.5 1 0.953349 1.501396 2.139399
0.75 1 0.632487 1.441217 5.027433
Figure 4.12 Bearing Capacities Ratio vs. Fiber Content
0
1
2
3
4
5
6
7
0.00 0.10 0.20 0.30 0.40 0.50 0.60 0.70 0.80
Bear
ing
Capa
city
Rat
io
Fiber %
R.D. = 40%
R.D. =55%
R.D. =73%
R.D. =88%

Page 58 of 74
TABLE 4.13 (Variation of bearing capacity ratio with Relative Densities for different fiber %)
Bearing Capacity Ratio
R.D. Fiber = 0% Fiber = 0.1% Fiber = 0.25% Fiber = 0.5% Fiber = 0.75%
40 1 0.460172 0.662464 2.970315 4.335817
55 1 0.759961 1.369507 2.667854 2.58363
73 1 1.683507 2.181106 3.872129 3.599582
88 1 1.120364 1.036769 2.830278 6.18281
Figure 4.13 Bearing Capacities Ratio vs. Relative Density
0
1
2
3
4
5
6
0 20 40 60 80 100
Bear
ing
Capa
city
Rat
io
Relative Density
Fiber - 0%
Fiber - 0.1%
Fiber - 0.25%
Fiber - 0.5%
Fiber - 0.75%

Page 59 of 74
Chapter 5
CONCLUSIONS

Page 60 of 74
CONCLUSIONS
This study was undertaken to investigate the effect of fiber content on the bearing capacity of
randomly distributed fiber-reinforced sand by measuring load-deformation.The following
conclusions can be drawn from the experimental study.
• The bearing capacity of footings on randomly reinforced sand increases due to
interference effects.
• Fiber reinforcements showed smaller loss of post-peak strength and changed the brittle
behavior of the sand to a somewhat more ductile one. Hence, residual strength increases
by adding the fiber reinforcements.
• Fiber reinforcements, having relatively low modulus, behave as “ideally extensible”
inclusions.
• It is very effective in case of foundations subjected to dynamic and earthquake loading
• Reinforcement mobilization needs high strain, so in case of loose soil its effect is less as
compared to dense soils

Page 61 of 74
Chapter 6
REFERENCES

Page 62 of 74
[1] Bauer, G.E., Oancea, A., [1996]. “Triaxial testing of granular soils reinforced with
discrete polypropylene fibers”. Proceedings of the First European Geosynthetics
Conference on Geosynthetics: Applications, Design and Construction.
[2] Bell F.G. (1993) “Engineering Treatment of soils” Publised by E & FN Spon
[3] Consoli N.C., Prietto P.D.M., Ulbrich L.A., [1998]. “Influence of fiber and cement
addition on behavior of sandy soil”. Journal of Geotechnical and Geoenvironmental
Engineering, ASCE 124 (12).
[4] Das B.M., “Principles of Geotechnical Engineering”.
[5] Freitag, D.R., [1986]. Soil randomly reinforced with fibers. Journal of Geotechnical
Engineering, ASCE 112 (8).
[6] Gray D.H., Ohashi H., [1983]. Mechanics of fiber reinforcement in sand. Journal of
Geotechnical Engineering, ASCE 109 (3), 335–353.
[7] Gray DH, Al-Refeai Talal.[1986];“Behavior of fabric-versus fiber reinforced sand”.
J Geotech Eng 112(8):804–20.
[8] Hoare DJ.[1977]“Laboratory study of granular soils reinforced with randomly
oriented discrete fabrics”. In: Proceedings internationalconference on the use of falorics in
geotechnics, vol. I. Paris,France: L_Ecole National des ponts et chaussees;
[9] Hataf N., Rahimi M.M., [2005]. ‘Experimental investigation of bearing capacity of
sand reinforced with randomly distributed tire shreds’

Page 63 of 74
[10] Hoare D.J., [1979]. “Laboratory study of granular soils reinforced with randomly
oriented discrete fibers”. Proceedings of the International Conference on Soil
Reinforcement, Vol. 1, Paris, France.
[11] Izgin M., Wasti Y., [1998]. “Geomembrane–sand interface frictional properties as
determined by inclined board and shear box test”. Geotextiles and Geomembranes 16 (4).
[12] Punmia B.C. “Soil Mechanics & Foundations” Laxmi Publications
[13] Saran S. (2010) “Reinforced Soil”, 2nd Edition
[14] www.matbase.com
[15] www.globalspec.com
[16] Wasti Y., Butun M.D., [1996]. “Behaviour of Model Footings on Sand Reinforced
with Discrete Inclusions”
[17] Yetimoglu T Salbas O [2003] ‘A study on shear strength of sands reinforced with
randomly distributed discrete fibers’