Embed Size (px)
Citation preview

BEARDSLEY PIT AIR QUALITY MONITORING PROJECT REPORT
Air Quality DivisionOctober 4, 2019

2
Air Quality Monitoring Report 2019
FIGURES Figure 1 Location of Beardsley Pit and Nearby Neighborhood ..................................................................................................................... 5Figure 2 Source Layout...................................................................................................................................................................................... 7Figure 3 Deer Valley Airpot and Rose Plot February through March 2019 ................................................................................................. 7Figure 4 24-hr PM10 Modeled Results .............................................................................................................................................................. 8Figure 5 Monitoring Site Location at Buffalo Ridge Tennis Court ............................................................................................................... 8Figure 6 Buffalo Ridge Tennis Court ................................................................................................................................................................ 8Figure 7 E-BAM Sample Flow Path ................................................................................................................................................................... 9Figure 8 Daily Average Concentrations for PM10 ........................................................................................................................................... 14Figure 9 Daily Average Concentrations for PM2.5 .......................................................................................................................................... 15Figure 10 Detected HAPs Concentrations ...................................................................................................................................................... 17Figure 11 Deer Valley Airport wind rose plot during air monitoring project duration ................................................................................. 18
TABLESTable 1 Sampling Instrumentation and Methods for HAPs ........................................................................................................................... 11Table 2 HAPs Monitoring Results .................................................................................................................................................................... 16Table 3 Ambient Temperature and Relative Humidity Summary ................................................................................................................ 18
3
Air Quality Monitoring Report 2019
TABLE OF CONTENTSExecutive Summary .......................................................................................................................................................................................... 4
Background ........................................................................................................................................................................................................ 5
Project Objectives ............................................................................................................................................................................................. 6
Selection of Monitoring Site ............................................................................................................................................................................ 7
Sampling Instrumentation and Methods. ...................................................................................................................................................... 9
Sampling Duration and Frequency .................................................................................................................................................................. 12
Quality Control Activites .................................................................................................................................................................................. 13
Results ................................................................................................................................................................................................................ 14
PM10 ............................................................................................................................................................................................................. 14
PM2.5 ........................................................................................................................................................................................................... 15
HAPs ........................................................................................................................................................................................................... 16
Meteorological Data ................................................................................................................................................................................. 18
Conclusion .......................................................................................................................................................................................................... 19
4
Air Quality Monitoring Report 2019
EXECUTIVE SUMMARY
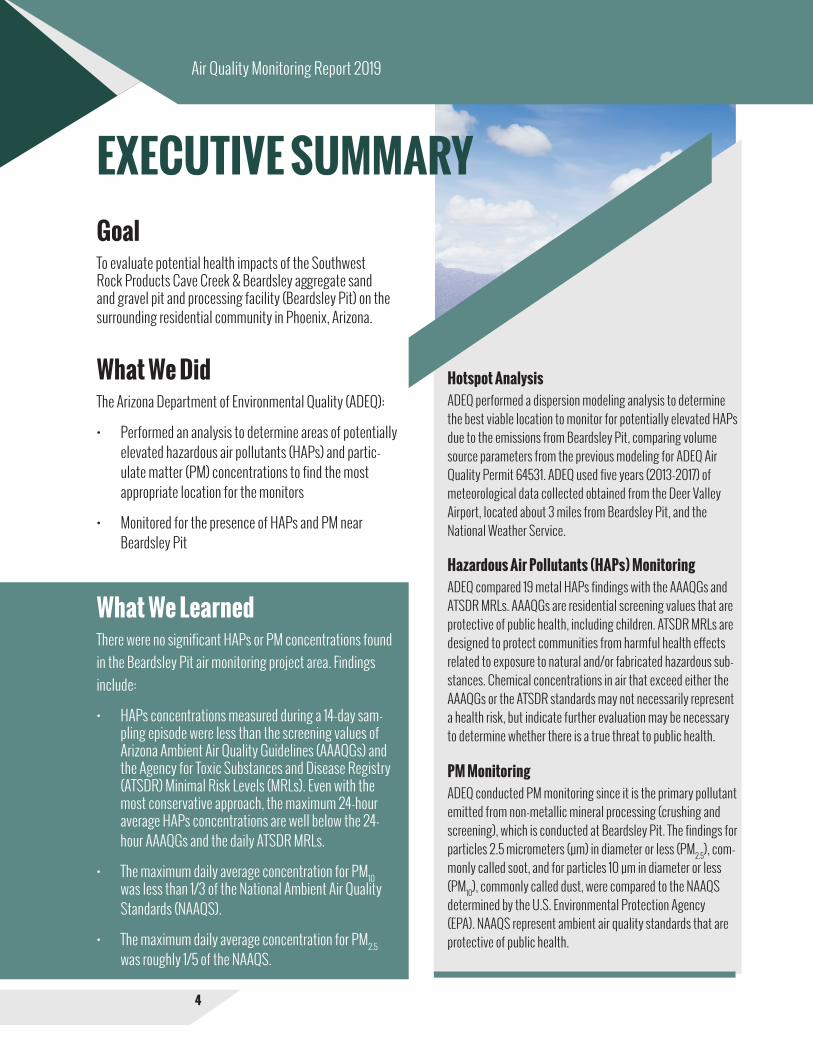
Hotspot AnalysisADEQ performed a dispersion modeling analysis to determine the best viable location to monitor for potentially elevated HAPs due to the emissions from Beardsley Pit, comparing volume source parameters from the previous modeling for ADEQ Air Quality Permit 64531. ADEQ used five years (2013-2017) of meteorological data collected obtained from the Deer Valley Airport, located about 3 miles from Beardsley Pit, and the National Weather Service.
Hazardous Air Pollutants (HAPs) Monitoring ADEQ compared 19 metal HAPs findings with the AAAQGs and ATSDR MRLs. AAAQGs are residential screening values that are protective of public health, including children. ATSDR MRLs are designed to protect communities from harmful health effects related to exposure to natural and/or fabricated hazardous sub-stances. Chemical concentrations in air that exceed either the AAAQGs or the ATSDR standards may not necessarily represent a health risk, but indicate further evaluation may be necessary to determine whether there is a true threat to public health.
PM MonitoringADEQ conducted PM monitoring since it is the primary pollutant emitted from non-metallic mineral processing (crushing and screening), which is conducted at Beardsley Pit. The findings for particles 2.5 micrometers (µm) in diameter or less (PM2.5), com-monly called soot, and for particles 10 µm in diameter or less (PM10), commonly called dust, were compared to the NAAQS determined by the U.S. Environmental Protection Agency (EPA). NAAQS represent ambient air quality standards that are protective of public health.
GoalTo evaluate potential health impacts of the Southwest Rock Products Cave Creek & Beardsley aggregate sand and gravel pit and processing facility (Beardsley Pit) on the surrounding residential community in Phoenix, Arizona.
What We DidThe Arizona Department of Environmental Quality (ADEQ):
• Performed an analysis to determine areas of potentially elevated hazardous air pollutants (HAPs) and partic-ulate matter (PM) concentrations to find the most appropriate location for the monitors
• Monitored for the presence of HAPs and PM near Beardsley Pit
What We LearnedThere were no significant HAPs or PM concentrations found in the Beardsley Pit air monitoring project area. Findings include:
• HAPs concentrations measured during a 14-day sam-pling episode were less than the screening values of Arizona Ambient Air Quality Guidelines (AAAQGs) and the Agency for Toxic Substances and Disease Registry (ATSDR) Minimal Risk Levels (MRLs). Even with the most conservative approach, the maximum 24-hour average HAPs concentrations are well below the 24-hour AAAQGs and the daily ATSDR MRLs.
• The maximum daily average concentration for PM10 was less than 1/3 of the National Ambient Air Quality Standards (NAAQS).
• The maximum daily average concentration for PM2.5 was roughly 1/5 of the NAAQS.

Location of Beardsley Pit and nearby neighborhood
5
Air Quality Monitoring Report 2019
BACKGROUNDSouthwest Rock Products operates a roughly 17.5-acre aggregate sand and gravel pit and facility at Cave Creek & Beardsley
(19636 N. 20th St., Phoenix, AZ 85024). Operations include non-metallic mineral processing (crushing and screening).
Beardsley Pit is permitted and pre-dates residential neighborhood located to the east. Residents have expressed concerns
about the potential for HAPs in the ambient air leaving Beardsley Pit and transporting into general areas in and around the
neighborhood. Residents are concerned that air quality issues were impacting their quality of life and potentially harming
their health. Figure 1 shows the location of Beardsley Pit and the nearby neighborhood.
Figure 1

6
Air Quality Monitoring Report 2019
PROJECT OBJECTIVESTo address concerns from residents, ADEQ conducted a community-based ambient air monitoring project between March 19 and April 16, 2019, to assess potential public exposure to HAPs in ambient air near Beardsley Pit. The monitoring data collected were used to determine if there was a potential threat to public health and if further evaluation was necessary. Specifically, ADEQ determined representative ambient HAPs concentrations and compared them against AAAQGs and ATSDR MRLs. The monitoring project covered 19 metal HAPs. Additionally, ADEQ conducted PM10 and PM2.5 monitoring be-cause PM is the primary pollutant emitted from non-metallic mineral processing and compared results against the NAAQS.
AAAQGs were developed by the Arizona Department of Health Services (ADHS). ADEQ has been using the list of AAAQGs as health-based reference values for making risk management decisions in its environmental pro-grams. AAAQGs are residential screening values that are protective of public health, including children. ATSDR is a federal public health agency with the U.S. Department of Health and Human Services. ATSDR MRLs are designed as a screening tool to protect communities from harmful health effects related to exposure to natural and/or fabricated hazardous substances. NAAQS are determined by the EPA and represent ambient air quality standards that are protective of public health. Contaminant con-centrations in air that exceed the AAAQGs, ATSDR MRLs or NAAQS may not necessarily represent a health risk. Rather, when contaminant concentrations exceed thresh-olds, further evaluation may be necessary to determine whether there is a true threat to public health.

Source layout
Deer Valley Airport wind rose plot February through March 2019
7
Air Quality Monitoring Report 2019
SELECTION OF MONITORING SITEADEQ performed a dispersion modeling analysis with the EPA’s AERMOD model to determine the areas of potentially elevated HAPs concentrations (“hotspots”) due to the emissions from crushing and screening activities at Beardsley Pit. ADEQ modeled three emission sources in and around Beardsley Pit. Google Earth indicates that most of the emission activities are within the pit itself. Therefore, emissions from crushing and screening, plus hauling and storage piles inside the pit, were combined and modeled as a pit source (Figure 2). Emissions from roadways outside the pit were modeled as a series of volume sources. The volume source data was obtained from previous modeling for ADEQ Air Quality Permit 64531. ADEQ modeled two blasting sources, located in the southern and southeastern ramps of the pit. ADEQ used five years (2013-2017) of meteorological data obtained from Deer Valley Airport, located about 3 miles from Beardsley Pit, and the National Weather Service. Wind data from the Deer Valley Airport showed the prevailing winds are from the northeast and secondarily from the southwest (Figure 3). The results of the modeled runs show the hotspot area to be located in the southwestern corner of Beardsley Pit and extending into undeveloped desert. The 24-hr PM10 modeled results are shown in Figures 4.
Based on the modeling and a site visit, ADEQ determined best viable site location for an ambient air quality monitor was the Buffalo Ridge Tennis Court (Figures 5 & 6).
Figure 2
Figure 3

8
Air Quality Monitoring Report 2019
24-hr PM10 Modeled Results
Monitoring site location at Buffalo Ridge Tennis Court
Buffalo Ridge Tennis Court
Figure 4
Figure 5
Figure 6

9
Air Quality Monitoring Report 2019
24-hr PM10 Modeled Results
E-BAM sample flow path
Figure 7
SAMPLING INSTRUMENTATION AND METHODS Sample MethodADEQ installed two Thermo Partisol 2000i Air Samplers at the Buffalo Ridge Tennis Court location to monitor for metals in PM10. The Thermo Partisol 2000i Air Sampler is configured to collect PM of aerodynamic diameter size ≤ 10 micrometers (µm). The sampler contains a sampling inlet system, a filter exchange mechanism, a microprocessor with internal data storage, an active flow control system and a pump. The sampler is set up to collect PM on a standard 47 millimeter filter disk for a 24-hour period using a volumetric flow rate of 16.7 liters per minute. The sampler stores summary and 5-minute interval data for each collection. The data collected also include average temperatures and pressure, total volume through the filter, total collection time and error conditions. The size of the PM collected is controlled by the first stage inlet which limits the size to ≤ 10 µm
Following the completion of the sampling for metals in PM10, ADEQ installed two MetOne E-BAMs for PM monitoring. The E-BAM utilizes beta ray attenuation to measure PM concentrations in ambient air. A beta particle sources emits electrons measured by a detector. A pump pulls ambient air through particle selective inlets and onto a filter tape. The difference in beta counts between a clean filter tape and one laden with particulates determines volumetric concentration. The E-BAM is small and easily deployable.
The sample flow path begins with a PM10 separating inlet and can add a PM2.5 separating cyclone for PM2.5 measurements. Particulates then travel through the downtube and onto the filter tape, measured using the beta source and detector (Figure 7).

10
Air Quality Monitoring Report 2019
Analytical MethodAmbient air samples for metals analysis were collected by passing ambient air through 47mm Teflon® filters. PM10 in ambient air were collected on the filters and returned, along with the Chain of Custody forms and all associated documentation, to the Inter-Mountain Labs (IML) laboratory for analysis.
Upon receipt at the laboratory, the whole filters were digested using a dilute nitric acid, hydrochloric acid and/or hydrofluoric acid (Teflon® only) solution. The digestate was then quantified using Inductively Coupled Plasma Spectroscopy (ICP) and Inductively Coupled Plasma/Mass Spectrometry (ICP-MS) to determine the concentration of individual metals present in the original air sample.
EPA Compendium Method IO-3.4 was used for the analysis of 4 metals in ambient air. Samples were collected 47mm Teflon® filters and then analyzed with ICP.
EPA Compendium Method IO-3.5 was used for the analysis of 15 additional metals in ambient air. Samples were collected 47mm Teflon® filters and then analyzed with ICP-MS.
Table 1 provides a summary of sampling instrumentation and methods for HAPs.

11
Air Quality Monitoring Report 2019
Table 1. Sampling Instrumentation and Methods for HAPs
HAPs Method(s) Lab Analysis Monitoring DeviceAntimony IO-3.5 ICP-MS Thermo Partisol 2000i Air Sampler
Arsenic IO-3.5 ICP-MS Thermo Partisol 2000i Air Sampler
Barium IO-3.5 ICP-MS Thermo Partisol 2000i Air Sampler
Cadmium IO-3.5 ICP-MS Thermo Partisol 2000i Air Sampler
Chromium IO-3.5 ICP-MS Thermo Partisol 2000i Air Sampler
Cobalt IO-3.5 ICP-MS Thermo Partisol 2000i Air Sampler
Copper IO-3.5 ICP-MS Thermo Partisol 2000i Air Sampler
Lead IO-3.5 ICP-MS Thermo Partisol 2000i Air Sampler
Manganese IO-3.5 ICP-MS Thermo Partisol 2000i Air Sampler
Molybdenum IO-3.5 ICP-MS Thermo Partisol 2000i Air Sampler
Selenium IO-3.5 ICP-MS Thermo Partisol 2000i Air Sampler
Silver IO-3.5 ICP-MS Thermo Partisol 2000i Air Sampler
Thallium IO-3.5 ICP-MS Thermo Partisol 2000i Air Sampler
Uranium IO-3.5 ICP-MS Thermo Partisol 2000i Air Sampler
Vanadium IO-3.5 ICP-MS Thermo Partisol 2000i Air Sampler
Aluminum IO-3.4 ICP Thermo Partisol 2000i Air Sampler
Beryllium IO-3.4 ICP Thermo Partisol 2000i Air Sampler
Nickel IO-3.4 ICP Thermo Partisol 2000i Air Sampler
Zinc IO-3.4 ICP Thermo Partisol 2000i Air Sampler

12
Air Quality Monitoring Report 2019
Sampling Duration and FrequencyThe duration of the monitoring project was 28 days from March 19, 2019, to April 16, 2019. Fourteen 24-hour air samples were collected daily from March 19, 2019, through April 1, 2019. The E-BAM recorded PM10 and PM2.5 measurements by continuously sampling and reporting concentration data at hourly intervals from April 5, 2019, to April 16, 2019.

13
Air Quality Monitoring Report 2019
QUALITY CONTROL ACTIVITIESSamples were collected according to methodologies outlined in the monitoring plan (i.e. calibrated pumps, method specific flow rates, volumes, etc.). All sampling pumps and media were handled, transported and utilized per methodological requirements and in accordance with standard industry practice. ADEQ technicians calibrate¬¬d the sampling pumps prior to use. Flow rate checks were conducted and documented prior to and following the study duration using certified calibration standards. Project management and technicians were responsible for the security of the equipment and sampling media and reported or documented any attempt, if any, to influence the analytical results.
Field blanks were prepared and collected in the same type of sampling media utilized throughout the project and were collected along with the investigative samples throughout the sampling event. Analysis of the field blanks was used to determine if decontamination procedures by the lab and in the field were done correctly on the certified sample collection media.
Collection precision was estimated through a collocated run in which both Thermo Partisol 2000i Air Samplers ran concur-rently. Analytical precision was estimated by duplicate/replicate analyses, usually on laboratory control samples, spiked samples and/or field samples. Accuracy is the closeness of a measured result to an accepted reference value. The laboratory determined how their internal laboratory blanks were run based on each method being sampled for and the number of samples being run.

14
Air Quality Monitoring Report 2019
RESULTSPM10
Figure 8 presents hourly concentrations for the Buffalo Ridge Tennis Court monitor PM10 and the nearby Maricopa County Air Quality Department (MCAQD) North Phoenix PM10 monitor during the 12-day E-BAM PM sampling episode. Both the maximum hourly average concentration of 82.0 µg/m3 and the maximum 24-hour concentration of 41.2 µg/m3 are well below the NAAQS of 150 µg/m3 for PM10. Maricopa County experienced a wind and dust event April 9 to 10, 2019, which influenced the Buffalo Ridge Tennis Court monitor, though no exceedance was recorded. A high pollution advisory for PM10 was issued for April 10, 2019, by ADEQ for Maricopa County.
Daily average concentrations for PM10
Figure 8

15
Air Quality Monitoring Report 2019
PM2.5
Figure 9 presents hourly concentrations for Buffalo Ridge Tennis Court monitor PM2.5 and the nearby MCAQD North Phoenix PM2.5 monitor during the 12-day E-BAM PM sampling episode. Both the maximum hourly average concentration of 28.0 µg/m3 and the maximum 24-hour concentration of 7.4 µg/m3 are below the NAAQS of 35 µg/m3 for PM2.5.
Daily average concentrations for PM2.5
Figure 9
16
Air Quality Monitoring Report 2019
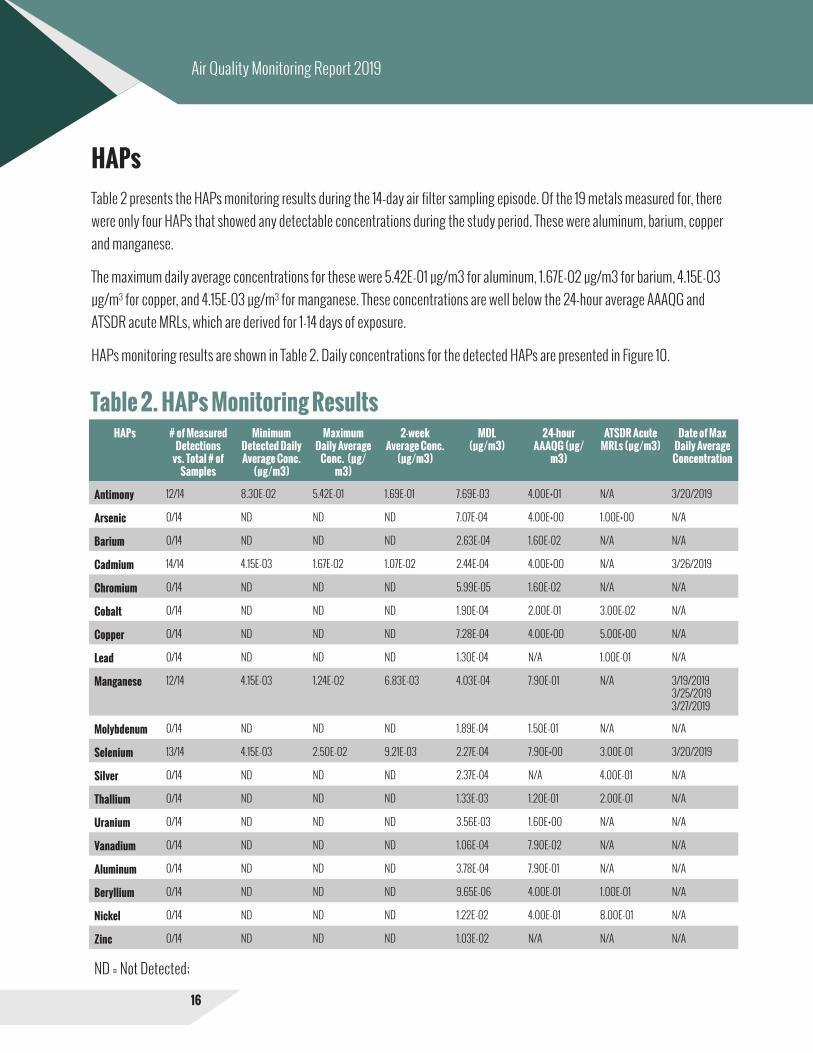
Table 2. HAPs Monitoring Results
ND = Not Detected;
HAPs # of Measured Detections
vs. Total # of Samples
Minimum Detected Daily Average Conc.
(µg/m3)
Maximum Daily Average
Conc. (µg/m3)
2-week Average Conc.
(µg/m3)
MDL(µg/m3)
24-hour AAAQG (µg/
m3)
ATSDR Acute MRLs (µg/m3)
Date of Max Daily Average
Concentration
Antimony 12/14 8.30E-02 5.42E-01 1.69E-01 7.69E-03 4.00E+01 N/A 3/20/2019
Arsenic 0/14 ND ND ND 7.07E-04 4.00E+00 1.00E+00 N/A
Barium 0/14 ND ND ND 2.63E-04 1.60E-02 N/A N/A
Cadmium 14/14 4.15E-03 1.67E-02 1.07E-02 2.44E-04 4.00E+00 N/A 3/26/2019
Chromium 0/14 ND ND ND 5.99E-05 1.60E-02 N/A N/A
Cobalt 0/14 ND ND ND 1.90E-04 2.00E-01 3.00E-02 N/A
Copper 0/14 ND ND ND 7.28E-04 4.00E+00 5.00E+00 N/A
Lead 0/14 ND ND ND 1.30E-04 N/A 1.00E-01 N/A
Manganese 12/14 4.15E-03 1.24E-02 6.83E-03 4.03E-04 7.90E-01 N/A 3/19/20193/25/20193/27/2019
Molybdenum 0/14 ND ND ND 1.89E-04 1.50E-01 N/A N/A
Selenium 13/14 4.15E-03 2.50E-02 9.21E-03 2.27E-04 7.90E+00 3.00E-01 3/20/2019
Silver 0/14 ND ND ND 2.37E-04 N/A 4.00E-01 N/A
Thallium 0/14 ND ND ND 1.33E-03 1.20E-01 2.00E-01 N/A
Uranium 0/14 ND ND ND 3.56E-03 1.60E+00 N/A N/A
Vanadium 0/14 ND ND ND 1.06E-04 7.90E-02 N/A N/A
Aluminum 0/14 ND ND ND 3.78E-04 7.90E-01 N/A N/A
Beryllium 0/14 ND ND ND 9.65E-06 4.00E-01 1.00E-01 N/A
Nickel 0/14 ND ND ND 1.22E-02 4.00E-01 8.00E-01 N/A
Zinc 0/14 ND ND ND 1.03E-02 N/A N/A N/A
HAPs Table 2 presents the HAPs monitoring results during the 14-day air filter sampling episode. Of the 19 metals measured for, there were only four HAPs that showed any detectable concentrations during the study period. These were aluminum, barium, copper and manganese.
The maximum daily average concentrations for these were 5.42E-01 µg/m3 for aluminum, 1.67E-02 µg/m3 for barium, 4.15E-03 µg/m3 for copper, and 4.15E-03 µg/m3 for manganese. These concentrations are well below the 24-hour average AAAQG and ATSDR acute MRLs, which are derived for 1-14 days of exposure.
HAPs monitoring results are shown in Table 2. Daily concentrations for the detected HAPs are presented in Figure 10.

17
Air Quality Monitoring Report 2019
Detected HAPs concentrations
Figure 10

18
Air Quality Monitoring Report 2019
Meteorological Data ADEQ reviewed meteorological data obtained from Deer Valley Airport, located about 3 miles from Beardsley Pit. Figure 11 presents a wind rose plot displaying the statistical distribution of wind speeds and wind directions during the sampling period. The average wind speed during the sampling period was 5.3 m/s. The prevailing winds are from the southwest, west-southwest (WSW) and the northeast. Southwest and west-southwest winds were most frequent. Considering the southwest winds and the proximity to the local community, ADEQ determined that the monitoring site selected in this study reasonably captured the potential ambient impacts from Beardsley Pit. Maricopa County experienced a wind and dust event April 9 through 10, 2019, which influenced the Buffalo Ridge Tennis Court monitor. A high pollution advisory for PM10 was issued for April 10, 2019, by ADEQ for Maricopa County.
Deer Valley Airport wind rose plot during air monitoring project duration
Figure 11
Table 3. Ambient air temperature and relative humidity summaryParameter # of Hourly
MeasurementsMinimum Maximum Average
Ambient Temperature
695 49.1ºF 94.3ºF 70.1ºF
Ambient Relative Humid-ity (%)
695 5.8% 72.5% 25.2%
19
Air Quality Monitoring Report 2019
CONCLUSION ADEQ conducted a community-based ambient air monitoring project to assess potential public exposure to HAPs and PM in am-bient air near Beardsley Pit. There were no significant HAPs or PM concentrations found in the ambient air in the project area. The HAPs concentrations measured during a 14-day sampling episode were less than the screening values of the AAAQGs and ATSDR MRLs. Additionally, the 24-hour average PM10 and PM2.5 concentrations measured were below the NAAQS.

BEARDSLEY PIT AIR QUALITY
MONITORING PROJECT REPORT
October 4, 2019EQR-19-14