Embed Size (px)
Citation preview

Beach nourishment Wissant, France

To serve the needs of our shareholders, customers, banks and other stakeholders DEME chose to pre-pare an activity report accompanied by financial information that is prepared in accordance with the recognition and measurement principles of International Financial Reporting Standards (IFRS) as adopted by the European Union (EU). The underlying consolidated financial statements do not contain all the explanatory notes required by IFRS and are therefore not fully compliant with IFRS as adopted by the EU.
This financial information report includes the financial highlights, consolidated balance sheet and consolidated statement of income, conso-lidated cash flow statement, consolidated statement of changes in equity and some relevant explanatory notes. The parent company balance sheet and statement of income is also included.
The financial annual report of DEME is a sepa-rate brochure, which contains both the officially approved and published parent company and consolidated accounts that are prepared in accordance with Belgian Generally Accepted Accounting Principles (Belgian GAAP). In February
2013 DEME successfully emitted a 6-year corpo-rate bond of 200 million EUR on NYSE Alternext. The financial annual report of DEME is prepared in accordance with the Belgian Royal Decree on the obligations of issuers of financial instruments.
Preliminary remark
3
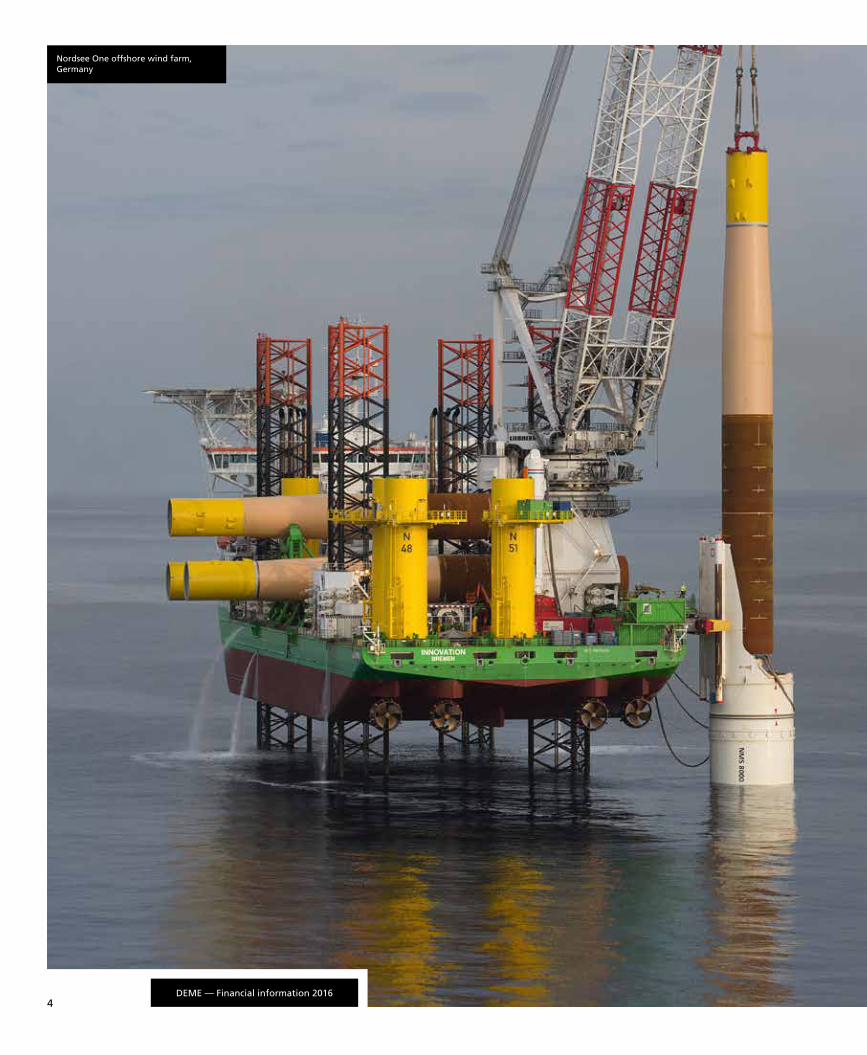
Nordsee One offshore wind farm, Germany
DEME — Financial information 20164

FINANCIAL HIGHLIGHTS 7DEME Group figures 7
DEME Group economic figures 7
DEME Group financial performance 8
DEME Group evolution of consolidated turnover 10
DEME Group evolution of net result, EBIT and EBITDA 10
DEME Group turnover by region, by activity and by customer 11
CONSOLIDATED FINANCIAL STATEMENTS 12DEME IFRS consolidated statement of income 12
DEME IFRS consolidated statement of comprehensive income 13
DEME IFRS consolidated balance sheet 14
DEME IFRS consolidated statement of cash flows 16
DEME IFRS consolidated statement of changes in equity 17
DEME IFRS share capital and reserves 18
DEME IFRS summary of principal accounting policies 18
Statement of compliance 18
Basis of preparation 18
Significant judgments and estimates 19
Principles of consolidation and list of company’s significant subsidiaries, associates and joint ventures 19
Business combinations 23
Business combinations between entities under common control 24
Business combinations and disposals in the course of 2016 24
Business combinations and disposals in the course of 2015 25
Foreign currencies 25
Intangible assets 26
Goodwill 26
Property, plant and equipment 27
The Group as lessee 28
Inventories 28
Amounts due from and due to customers under construction contracts 28
Trade and other receivables 29
Cash and cash equivalents 29
Impairment tangible and intangible assets including goodwill 29
Share capital 29
Provisions 29
Employee benefit obligations 30
Interest-bearing loans and borrowings 31
Trade and other payables 31
Income taxes 31
Investment tax credits 31
Derivative financial instruments and hedging 32
Revenue 33
Expenses 33
DEME IFRS explanatory notes to the consolidated financial statements 34
note (1) Other operating income and expenses 34
note (2) Employment 34
note (3) Intangible assets 35
note (4) Goodwill 35
note (5) Property, plant and equipment 36
note (6) Investments in joint ventures and associates 37
note (7) Other non-current financial assets 37
note (8) Financial derivatives 38
note (9) Deferred tax assets and liabilities 38
note (10) Inventories and construction contracts 39
note (11) Trade and other operating receivables 39
note (12) Interest-bearing debt and net financial debt 40
note (13) Finance and operating lease 41
note (14) Employee benefit obligations 42
note (15) Other current liabilities 43
note (16) Rights and commitments not reflected in the balance sheet 44
Independent auditor’s report 45
PARENT COMPANY FINANCIAL STATEMENTS 47DEME NV introduction 47
DEME NV balance sheet 48
DEME NV profit and loss statement 50
Table of contents
5

DEME — Financial information 20166
FINANCIAL HIGHLIGHTS

Financial HighlightsDEME Group figuresA S O F D E C E M B E R 3 1
According to IFRS (*) (in millions of EUR) 2016 2015 2014
Turnover 1,978.2 2,286.1 2,419.7
EBITDA 447.4 489.2 443.6
EBIT 227.0 269.2 223.5
Net result share of the Group 155.3 199.2 168.9
Average # personnel (in FTE) 4,232 4,099 4,194
Shareholders’ equity (excl. minority interests) 1,220.6 1,132.9 986.7
Net financial debt -151.2 -269.5 -126.8
Total assets 3,288.7 3,149.8 2,901.5
Total investments 258.1 343.1 172.1
Dividend of the year 55.0 60.0 50.7
DEME Group economic figuresA S O F D E C E M B E R 3 1
According to IFRS (**) (in millions of EUR) 2016 2015 2014
Turnover 1,978.2 2,351.0 2,586.9
EBITDA 450.1 558.4 501.5
EBIT 217.6 318.4 259.1
Net result share of the Group 155.3 199.2 168.9
Order book 3,800.0 3,185.0 2,420.0
Average # personnel (in FTE) 4,284 4,186 4,311
Shareholders’ equity (excl. minority interests) 1,220.6 1,132.9 986.7
Net financial debt -154.6 -266.7 -212.8
Total assets 3,312.4 3,233.4 3,132.7
Total investments 272.0 343.9 182.0
Dividend of the year 55.0 60.0 50.7
Definitions:
EBITDA is the sum of operating result (EBIT), depreciation and amortisation expenses.
EBIT is operating result excluding impairment losses.
Order book is the contract value of assignments that are acquired as of December 31 but that is not yet accounted for as turnover because of non-completion.
Net financial debt is the sum of current and non-current financial liabilities decreased with cash and cash equivalents.
Total investments is the amount paid for the acquisition of intangible, tangible and financial fixed assets.
(*) Following the introduction of the new accounting standards IFRS 10 and IFRS 11, group companies jointly controlled by DEME are accounted for using the equity method with effective date as from January 1, 2014.
(**) In this presentation, the group companies that are jointly controlled by DEME are still proportionally integrated. Although this is not in accordance with the new IFRS 10 and IFRS 11 accounting standards, it gives a more complete and economical view of the operations and assets/liabilities of those companies. In the equity accounting as applied under IFRS (*), the contribution of the group companies jointly controlled by DEME is summarised and presented as one single item on the balance sheet and in the income statement.
7

DEME’s turnover according to the economic approach amounted to 1,978.2 million EUR compared to 2,351 million EUR in 2015, the year with, among other things, the large-scale works on the Suez Canal. The record profit of 2015, 199.2 million EUR, could not be matched in 2016 that ended with a net profit share of the Group of 155.3 million EUR. The execution of the many projects in which DEME is involved however progressed well, leading to an EBITDA of 450.1 million EUR which is 22.8% of turnover. Even though this figure is lower than in 2015 it is clearly better than expected and also above the historical range of 16% to 20% EBITDA margin.
Major projects carried out in 2016 included Jurong Island Westward Extension (JIWE) and Tuas Terminal Phase 1 in Singapore, and the widening and deepening of the Pacific access channel of the Panama Canal. DEME had a very busy second half of the year in the United Kingdom with the Galloper and Race Bank projects, as well as in Africa, India and in many places in Europe and expects to continue this positive trend in 2017. GeoSea was able to finish the transport and installation of the monopile foundations for the 54 wind turbines of the German Nordsee One wind farm sooner than expected.
DEME was able to add 2,593 million EUR worth of new contracts and increases on existing contracts to its order book in 2016. New contracts are the construction of offshore wind farms Merkur (Germany), Hornsea Project One (UK), Horns Rev (Denmark) and Rentel (Belgium). In traditional dredging activities we have the renewal of the maintenance dredging contract for the Belgian coast, Port Louis in Mauritius and in the environmental sector we have the Blue Gate remediation works in Antwerp. The order book
increased to 3,800 million EUR at year-end 2016. It should be noted that the contracts for the Hohe See Phase 2 and the Fehmarnbelt project have been won, but have not yet been included in the order book end 2016 because of non-completion of financial close and because of pending final permits. Meanwhile the financial close of Hohe See Phase 2 has been completed. At the beginning of 2017, DEME also signed new contracts, worth 100 million EUR, in India and the Maldives where land reclamation works will be carried out for the construction of ten islands intended for the development of tourism infrastructure. In the Netherlands a contract worth 128 million EUR was awarded for the construction of the Rijnlandroute, a complex infrastructure project with a traffic junction and a bored tunnel.
In order to execute this sizeable order book, DEME continued its investment programme. Six new vessels are currently under construction: the self-propelled jack-up vessel ‘Apollo’, the multipurpose and cable laying vessel ‘Living Stone’, the self-propelled DP2 crane vessel ‘Gulliver’ (in joint venture) and the trailing suction hopper dredgers ‘Scheldt River’, ‘Minerva’ and ‘Bonny River’, together representing an investment of approximately 500 million EUR. Despite some delay at the shipyards building those vessels, the majority will be completed in 2017 and will be deployed immediately. This delay has led to a number of payments that were planned for 2016 being deferred to 2017. Consequently, the total investments in tangible and intangible fixed assets in 2016 is limited to 194.7 million EUR (according to the economic approach).
In February 2017, DEME confirmed the additional order of two new vessels, for a total amount of around 500 million EUR. The ‘Spartacus’, the most
DEME Group financial performance
DEME — Financial information 20168
FINANCIAL HIGHLIGHTS

powerful state-of-the-art cutter suction dredger in the world (44,180 kW) for dredging works in the hardest and most compact rock and soil types also in offshore conditions, and the ‘Orion’, an offshore service vessel (44,180 kW) with dynamic positioning and a crane with a reach of more than 50 metres and a lifting capacity of 5,000 tonnes. The vessel will be used for construction works at sea, such as offshore wind farms, services for customers in the offshore oil and gas industry and the dismantling of old offshore structures.
In 2016, DEME, through its subsidiary DEME Concessions, also invested in a 12.5% stake in the company that will develop the Merkur offshore wind farm (396 MW) as well as in a 18.9% stake in Rentel (309 MW).
DEME’s net financial debt according to the economic approach amounted to -154.6 million EUR at the end of 2016, which is a decrease of 112.1 million EUR compared to the end of 2015. A lower level of CAPEX because of deferral of several installments, together with strong operating cash flows and significant advance payments obtained from customers have led to this low amount. In view of the CAPEX described above the net financial debt of DEME will become more negative in the course of 2017.
Tuas Terminal Phase 1, Singapore
9

500
1,000
1,500
2,000
2,500
3,000
0
100
200
300
400
500
600
700
20162015201420132012
2007 2008 2009 2010 2011 2012 2013 2014 2015 2016
0
DEME Group evolution of net result, EBIT and EBITDAeconomic figures* (in millions of EUR)
DEME Group evolution of consolidated turnovereconomic figures* (in millions of EUR)
Net result E B I T EB I T DA
89
140
351
1,314
1,5091,403
1,801 1,7661,915
2,5322,587
2,351
1,978
155
218
450
199
318
558
169
259
502
109
217
438
* In the economic figures the Group companies that are jointly controlled by DEME are still proportionally integrated which is not in accor-dance with the new IFRS 10 and IFRS 11 accounting standards. It nevertheless gives a more complete picture of the operations and assets/liabilities of those companies.
DEME — Financial information 201610
FINANCIAL HIGHLIGHTS

DEME Group evolution of consolidated turnovereconomic figures* (in %)
By customer
By activity
By region
Asia & Oceania13%
Asia & Oceania12%
Europe EU56%
Maintenancedredging
12%
Maintenancedredging
11%
Oil & gas11%
Fallpipe & landfalls
7%
Fallpipe & landfalls
9%
Renewables29%
Capitaldredging
34%Capital
dredging48%
Government54%
Government43%
Europe EU33%
America8%
Marine works34%
Civil works3%
Marine works23%
Other11%
Mining3%
Renewables12%
Oil & gas20%
Other15%
America4%
Africa12%
Environmental10%
Environmental9%
Mining2%
Africa30%
Indiansubcontinent
4%
Indiansubcontinent
4%
Middle East3%
Middle East7%
Europe non EU4%
Europe non EU10%
2016
2016 2015
20152016
2015
* In the economic figures the Group companies that are jointly controlled by DEME are still proportionally integrated which is not in accordance with the new IFRS 10 and IFRS 11 accounting standards. It nevertheless gives a more complete picture of the operations and assets/liabilities of those companies. 11

Consolidated financial statementsDEME IFRS
Consolidated statement of incomeA S O F D E C E M B E R 3 1
(in thousands of EUR) Notes 2016 2015
REVENUES 1,997,273 2,329,109
Turnover 1,978,250 2,286,124
Movement in contracts in progress -26,043 9,318
Other operating income (1) 45,066 33,667
OPERATING EXPENSES -1,770,317 -2,066,155
Raw materials, consumables, services and subcontracted work -1,167,280 -1,467,496
Personnel expenses (2) -364,006 -354,880
Depreciation and impairment losses -220,433 -223,145
Goodwill impairment – -3,116
Other operating expenses (1) -18,598 -17,518
OPERATING RESULT 226,956 262,954
FINANCIAL RESULT -33,797 -45,353
Interest income 8,191 4,270
Interest expense -33,049 -31,840
Other financial income and expenses -8,939 -17,783
RESULT BEFORE TAXES 193,159 217,601
Income taxes and deferred taxes -20,417 -56,521
RESULT AFTER TAXES 172,742 161,080
Share of profit (loss) of joint ventures and associates (6) -13,278 39,597
RESULT FOR THE PERIOD 159,464 200,677
Attributable to: non-controlling interests 4,130 1,481
the Group 155,334 199,196
CONSOLIDATED FINANCIAL STATEMENTSDEME — Financial information 201612

DEME IFRS
Consolidated statement of comprehensive incomeA S O F D E C E M B E R 3 1
(in thousands of EUR) 2016 2015
Result attributable to non-controlling interests 4,130 1,481
Result attributable to the Group 155,334 199,196
Net result for the period 159,464 200,677
Comprehensive income that may be reclassified to profit and loss in subsequent periods
Changes in fair value related to hedging instruments 4,181 4,645
Changes in cumulative translation adjustment reserve 178 -4,202
Comprehensive income that cannot be reclassified to profit and loss in subsequent periods
Remeasurement of net liabilities relating to defined benefit plans -12,084 -2,301
Total other comprehensive income -7,725 -1,858
Total comprehensive income: 151,739 198,819Attributable to: non-controlling interests 3,959 1,990
the Group 147,780 196,829
13

DEME IFRS
Consolidated balance sheetA S O F D E C E M B E R 3 1
(in thousands of EUR) Notes 2016 2015
AssetsNON-CURRENT ASSETS 1,945,098 1,922,841
Intangible assets (3) 9,141 12,378
Goodwill (4) 18,732 18,732
Property, plant and equipment (5) 1,612,274 1,652,499
Investments in joint ventures and associates (6) 60,374 64,660
Other non-current financial assets (7) 98,861 58,058
Non-current financial derivatives (8) 510 1,381
Other non-current assets 22,506 18,149
Deferred tax assets (9) 122,700 96,984
CURRENT ASSETS 1,343,578 1,226,928
Inventories (10) 25,261 11,259
Amounts due from customers under construction contracts (10) 287,646 233,421
Trade and other operating receivables (11) 479,722 549,032
Current financial derivatives (8) 2,311 8,514
Other current assets 20,860 46,238
Cash and cash equivalents (12) 527,778 378,464
TOTAL ASSETS 3,288,676 3,149,769
CONSOLIDATED FINANCIAL STATEMENTSDEME — Financial information 201614

DEME IFRS
Consolidated balance sheetA S O F D E C E M B E R 3 1
(in thousands of EUR) Notes 2016 2015
Group equity and liabilities SHAREHOLDERS’ EQUITY 1,220,638 1,132,861
Issued capital 31,110 31,110
Share premium 5,645 5,645
Reserves and retained earnings 1,220,757 1,125,427
Hedging reserve -10,600 -14,781
Remeasurements on defined benefit pension plans -23,541 -11,834
Cumulative translation adjustment -2,733 -2,706
NON-CONTROLLING INTERESTS 14,862 10,963
GROUP EQUITY 1,235,500 1,143,824
NON-CURRENT LIABILITIES 703,006 724,021
Employee benefit obligations (14) 42,384 31,031
Provisions 2,721 7,661
Interest-bearing debt (12) 527,046 539,028
Non-current financial derivatives (8) 18,475 33,359
Other non-current liabilities – 3,893
Deferred tax liabilities (9) 112,380 109,049
CURRENT LIABILITIES 1,350,170 1,281,924
Interest-bearing debt (12) 151,947 108,901
Current financial derivatives (8) 23,502 34,607
Amounts due to customers under construction contracts (10) 43,214 35,048
Advances received 104,477 44,160
Trade payables 846,533 876,956
Remuneration and social security 76,818 65,021
Current income taxes 21,094 21,333
Other current liabilities (15) 82,585 95,898
TOTAL GROUP EQUITY AND LIABILITIES 3,288,676 3,149,769
15

DEME IFRS
Consolidated statement of cash flowsA S O F D E C E M B E R 3 1
(in thousands of EUR) 2016 2015
Cash and cash equivalents, opening balance 378,464 579,691
Profit (loss) from operating activities 226,956 262,954
Dividends from participations accounted for using the equity method 8,075 449
Reclassification of (income) loss from sales of property, plant and equipment and financial participation to cash flow from divestments -9,823 -17,939
Income taxes -48,171 -52,509
Non-cash adjustments 215,020 227,180
Depreciation and impairment losses 220,433 226,261
(Decrease) increase of provisions -5,413 919
CASH FLOW FROM OPERATING ACTIVITIES BEFORE CHANGES IN WORKING CAPITAL 392,057 420,135
Changes in working capital 45,963 -38,974
Decrease (increase) in inventories and advances received 72,358 -8,305
Decrease (increase) in amounts receivable -11,412 -131,297
Increase (decrease) in current liabilities (other than borrowings) -14,983 100,628
CASH FLOW FROM OPERATING ACTIVITIES 438,020 381,161
Investments -258,133 -343,129
Acquisition of intangible assets and of property, plant and equipment -178,500 -263,132
Acquisition of subsidiaries – -49,035
Capital increase in joint ventures and associates -20,679 -14,735
New borrowings given to joint ventures and associates -58,954 -16,227
Divestments 33,267 31,020
Sale of intangible assets and of property, plant and equipment 5,030 26,009
Sale of subsidiaries, joint ventures and associates 19,148 682
Repayment of borrowings given to joint ventures and associates 9,089 4,329
CASH FLOW FROM INVESTING ACTIVITIES -224,866 -312,109
Interest received 8,140 4,269
Interest paid -33,531 -31,840
Other financial income (costs) -8,888 -17,783
New interest-bearing debt 215,104 154,050
Repayment of interest-bearing debt -184,039 -351,985
Gross dividend paid to the shareholders -60,003 -50,704
Gross dividend paid to non-controlling interests – –
CASH FLOW FROM FINANCIAL ACTIVITIES -63,217 -293,993
Net increase (decrease) in cash and cash equivalents 149,937 -224,941Change in consolidation scope or method – 24,014
Impact of exchange rate changes on cash and cash equivalents -623 -300
Cash and cash equivalents, ending balance 527,778 378,464
CONSOLIDATED FINANCIAL STATEMENTSDEME — Financial information 201616

DEME IFRS
Consolidated statement of changes in equity
A S O F
D E C E M B E R 3 1 ,
2 0 1 6(in thousands of EUR)
Shar
e ca
pita
l and
sh
are
prem
ium
Hed
ging
res
erve
Defi
ned
bene
fit
pens
ion
plan
s
Trea
sury
sha
res
Cons
olid
ated
re
serv
es
Cum
ulat
ive
tran
slat
ion
adju
stm
ent
Shar
ehol
ders
’ equ
ity
Equi
ty
non-
cont
rolli
ng
inte
rest
s
Tota
l equ
ity
Opening, January 1, 2016
36,755 -14,781 -11,833 – 1,125,426 -2,706 1,132,861 10,963 1,143,824
Profit 155,334 155,334 4,130 159,464
Other comprehensive income
4,181 -11,708 -27 -7,554 -171 -7,725
Total comprehensive income
4,181 -11,708 – 155,334 -27 147,780 3,959 151,739
Dividends paid -60,003 -60,003 -795 -60,798
Other – 735 735
Ending, December 31, 2016
36,755 -10,600 -23,541 – 1,220,757 -2,733 1,220,638 14,862 1,235,500
A S O F
D E C E M B E R 3 1 ,
2 0 1 5(in thousands of EUR)
Shar
e ca
pita
l and
sh
are
prem
ium
Hed
ging
res
erve
Defi
ned
bene
fit
pens
ion
plan
s
Trea
sury
sha
res
Cons
olid
ated
re
serv
es
Cum
ulat
ive
tran
slat
ion
adju
stm
ent
Shar
ehol
ders
’ equ
ity
Equi
ty
non-
cont
rolli
ng
inte
rest
s
Tota
l equ
ity
Opening, January 1, 2015
36,755 -19,426 -9,594 – 976,934 2,067 986,736 11,007 997,743
Profit 199,196 199,196 1,481 200,677
Other comprehensive income
4,645 -2,239 -4,773 -2,367 509 -1,858
Total comprehensive income
4,645 -2,239 – 199,196 -4,773 196,829 1,990 198,819
Dividends paid -50,704 -50,704 -2,093 -52,797
Other – 59 59
Ending, December 31, 2015
36,755 -14,781 -11,833 – 1,125,426 -2,706 1,132,861 10,963 1,143,824
17

DEME IFRS
Share capital and reservesThe share capital on December 31, 2016 was composed of 4,538,100 ordinary shares. These shares are without any nominal value. The owners of ordinary shares have the right to receive dividends and have one vote per share in Shareholders’ General Meetings. On March 14, 2017, the board of directors proposed a dividend 55,001,772 EUR, corresponding to 12.12 EUR gross per share. The final dividend is subject to shareholder approval in the Shareholders’ General Meeting. The appropriation of income was not included in the financial statements at December 31, 2016. The final dividend for the year ended 31 December 2015 was 60,002,758 EUR.
DEME IFRS
Summary of principal accounting policies
STATEMENT OF COMPLIANCE
To serve the needs of our shareholders, customers, banks and other stakeholders DEME chose to prepare an activity report accompanied by financial information that is prepared in accordance with the recognition and measurement principles of International Financial Reporting Standards (IFRS) as adopted by the EU. The underlying consolidated financial statements do not contain all the explanatory notes required by IFRS and are therefore not fully compliant with IFRS as adopted by the EU.
BASIS OF PREPARATION
The consolidated financial statements are presented in thousands of euros. They are prepared on the historical cost basis except for derivative financial instruments, investments held for trading and investments available-for-sale which are stated at fair value.
The consolidated financial statements are prepared as of and for the period ending December 31, 2016.
They are presented before the effect of the profit appropriation proposed to the general assembly of shareholders.
The Board of Directors authorised the publication of the Group’s consolidated financial statements on March 14, 2017.
The accounting principles used, IFRS as adopted by the EU, are the same as those used for the consolidated annual accounts at December 31, 2015.
New IFRS standards and interpretations that became effective for 2016 are improvements and amendments to IFRS 2010-2012 cycle, IFRS 2012-2014 cycle, IFRS 10,12 and IAS 28 investment entities applying the consolidation exception, IFRS 11 accounting for acquisitions of interests in joint operations, IAS 1 disclosure initiative, IAS 16 and IAS 38 clarification of acceptable methods of depreciation and amortisation and IAS 27 equity method in separate financial statements. The financial position and performance of the Group was not affected by the initial application of above standards and interpretations.
New IFRS standards and interpretations that are not yet effective, but available for early adoption are IFRS 9 financial instruments, IFRS 15 revenue from contracts with customers, IFRS 16 leases and improvements and amendments to IFRS 2014-2016 cycle, IFRS 2 classification and measurement of share-based payment transactions, IFRS 4 insurance contracts, IFRS 10 and IAS 28 investments in associates and joint ventures, IAS 40 transfers of investment property and IFRIC 22 foreign currency transactions and advance consideration. The Group did not perform any early adoption of above standards and interpretations but the potential impact of them on the consolidated accounts is being determined. The Group does not expect these changes to have a significant impact on the Group’s financial position and performance, with the exception of IFRS 15 and IFRS 16.
CONSOLIDATED FINANCIAL STATEMENTSDEME — Financial information 201618

The IASB published a new standard IFRS 15 revenue from contracts with customers. This standard will replace IAS 18 and IAS 11 construction contracts. IFRS 15 defines how and when a company should recognise revenues from its activities. An additional explanatory disclosure will have to be provided. As a consequence, the recognition of revenue from contracts with customers will be ruled by one standard based on a five-step model. The rule will be applicable as from January 1, 2018. To determine the impact of the implementation of the standard, the ongoing contracts will be analysed to identify the performance obligations as defined by IFRS 15. Although the financial impact from the implementation of IFRS 15 cannot be estimated at this point in time, the Group expects that revenue recognition can still be based on the principle of the percentage of completion. Timing of revenue recognition could however differ for a limited number of contracts.
IFRS 16 leases was published in January 2016. This standard, not yet endorsed by the EU, defines how a company will account, measure and disclose leases in the financial statements. The standard requires from the lessee to account in the consolidated balance sheet all assets and liabilities related to leases with a duration higher than 12 months, except for leased assets having a very low value. The Group’s obligations relating to non-cancellable operating leases are disclosed in note (13). The application of IFRS 16 will lead to an increase of assets and liabilities with the present value of future lease payments, an increase of the net financial debt and an increase of the EBITDA as a consequence of the presentation of the expenses from leases as depreciation and amortisations and as financial expenses instead of operating expenses.
SIGNIFICANT JUDGMENTS AND ESTIMATES
The preparation of financial statements under IFRSs requires estimates to be used and assumptions to be made that affect the amounts shown in those financial statements, particularly as regards the following items:
– the period over which non-current assets are depreciated or amortised;
– the measurement of provisions and pension obligations;
– the measurement of income or losses on construction contracts using the percentage of completion method;
– estimates used in impairment tests; – estimates used in the assessment of income taxes ; – the fair value measurement of derivatives; – the assessment of control.
These estimates assume the operation is a going concern and are made on the basis of the information available at the time. Estimates may be revised if the circumstances on which they were based alter or if new information becomes available. Actual results may be different from these estimates.
PRINCIPLES OF CONSOLIDATION AND LIST OF COMPANY’S SIGNIFICANT SUBSIDIARIES, ASSOCIATES AND JOINT VENTURES
The consolidated financial statements incorporate the financial statements of the Company and entities controlled by the Company and its subsidiaries.
Control is achieved when the Company:
– has power over the investee; – is exposed, or has rights, to variable returns from its
involvement with the investee; – has the ability to use its power to affect its returns.
The Company reassesses whether or not it controls an investee if facts and circumstances indicate that there are changes to one or more of the three elements of control listed above.
Consolidation of a subsidiary begins when the Company obtains control over the subsidiary and ceases when the Company loses control of the subsidiary. Specifically, income and expenses of a subsidiary acquired or disposed of during the year are included in the consolidated
19

statement of profit or loss and other comprehensive income from the date the Company gains control until the date when the Company ceases to control the subsidiary.
Profit or loss and each component of other comprehensive income are attributed to the owners of the Company and to the non-controlling interests. Total comprehensive income of subsidiaries is attributed to the owners of the Company and to the non-controlling interests even if this results in the non-controlling interests having a deficit balance.
When necessary, adjustments are made to the financial statements of subsidiaries to bring their accounting policies into line with the Group’s accounting policies.
All intragroup assets and liabilities, equity, income, expenses and cash flows relating to transactions between members of the Group are eliminated in full on consolidation.
Changes in the Group’s ownership interests in subsidiaries that do not result in the Group losing control over the subsidiaries are accounted for as equity transactions. The carrying amounts of the Group’s interests and the non-controlling interests are adjusted to reflect the changes in their relative interests in the subsidiaries. Any difference between the amount by which the non- controlling interests are adjusted and the fair value of the consideration paid or received is recognised directly in equity and attributed to owners of the Company.
When the Group loses control of a subsidiary, a gain or loss is recognised in profit or loss and is calculated as the difference between (i) the aggregate of the fair value of the consideration received and the fair value of any retained interest and (ii) the previous carrying amount of the assets (including goodwill), and liabilities of the subsidiary and any non-controlling interests. All amounts previously recognised in other comprehensive income in relation to that subsidiary are accounted for as if the Group had directly disposed of the related assets or liabilities of the subsidiary (i.e. reclassified to profit or loss
or transferred to another category of equity as specified/permitted by applicable IFRSs). An investment retained is initially measured at fair value. This fair value becomes the initial carrying amount at the date when control is lost and for the purposes of subsequently accounting for the retained interest as an associate, joint venture or financial asset.
Associated companies are those in which the DEME group has significant influence. The significant influence is the power to take part in financial and operating policies of a company without having a control or joint control on these policies.
A joint venture is a joint arrangement whereby the parties exerting joint control over the arrangement have rights to the net assets of the joint arrangement. Joint control is the contractually agreed sharing of control of an arrangement, which exists only when decisions about the relevant activities require unanimous consent of the parties sharing control.
Assets, liabilities, revenues and expenses from joint ventures and joint operations are accounted for under the equity method in the consolidated financial statements. Under the equity method, an investment in a joint venture or associate is firstly recorded at cost in the consolidated financial statement and then adjusted to record the share of the Group in the net result and in the comprehensive income of the associate or joint venture. When the Group’s share of losses of an associate or a joint venture exceeds the Group’s interest in that associate or joint venture (which includes any long-term interests that, in substance, form part of the Group’s net investment in the associate or joint venture), the Group discontinues recognising its share of further losses. Additional losses are recognised only to the extent that the Group has incurred legal or constructive obligations or made payments on behalf of the associate or joint venture. These losses are recorded as provisions on the balance sheet. At the acquisition of the interest, any surplus between the cost of the investment and the share in the fair value of net assets of the entity is recorded as goodwill included in the carrying amount of the investment. Any surplus between the share of the
CONSOLIDATED FINANCIAL STATEMENTSDEME — Financial information 201620

group in the fair value of net assets and the cost of the investment after remeasurement is immediately recorded in the income statement during the period of acquisition of the investment.
The Group continues to use the equity method when an investment in an associate becomes an investment in a joint venture or an investment in a joint venture becomes an investment in an associate. There is no remeasurement to fair value upon such changes in ownership interests.
When the Group reduces its ownership interest in an associate or a joint venture but the Group continues to use the equity method, the Group reclassifies to profit or loss the proportion of the gain or loss that had previously been recognised in other comprehensive income relating to that reduction in ownership interest if that gain or loss would be reclassified to profit or loss on the disposal of the related assets or liabilities.
When a group entity transacts with an associate or a joint venture of the Group, profits and losses resulting from the transactions with the associate or joint venture are recognised in the Group’s consolidated financial statements only to the extent of interests in the associate or joint venture that are not related to the Group. The gross amount on transactions with associates or joint ventures is not eliminated; only any gain or loss on these transactions is eliminated.
A joint operation is a joint arrangement in which the parties (joint operators) have direct rights over the assets and direct obligations with respect to the entity’s liabilities. Joint control is the contractually agreed sharing of control of an arrangement, which exists only when decisions about the relevant activities require unanimous consent of the parties sharing control. When a DEME Group entity starts activity in a joint operation, DEME recognises in relation to its interest in the joint operation:
– its assets, including its share of any assets held jointly;
– its liabilities, including its share of any liabilities incurred jointly;
– its revenue from the sale of its share of the output arising from the joint operation;
– its share of the revenue from the sale of its share of the output by the joint operation;
– its expenses, including its share of any expenses incurred jointly.
The Group accounts for the assets, liabilities, revenues and expenses relating to its interest in a joint operation in accordance with the IFRSs applicable to the particular assets, liabilities, revenues and expenses.
When a group entity transacts with a joint operation in which a group entity is a joint operator (such as a sale or contribution of assets), the Group is considered to be conducting the transaction with the other parties to the joint operation, and gains and losses resulting from the transactions are recognised in the Group’s consolidated financial statements only to the extent of other parties’ interests in the joint operation.
When a group entity transacts with a joint operation in which a group entity is a joint operator (such as a purchase of assets), the Group does not recognise its share of the gains and losses until it resells those assets to a third party.
A listing of the Company’s significant subsidiaries, jointly controlled entities and associates can be found on the next page.
21

MAIN SUBSIDIARIES (FULLY CONSOLIDATED)
A S O F D E C E M B E R 3 1 , 2 0 1 6
NAME PLACE COUNTRY % OF SHAREHOLDING
Dredging International, NV Zwijndrecht Belgium 100%Baggerwerken Decloedt en Zoon, NV Ostend Belgium 100%DEME Building Materials, NV Zwijndrecht Belgium 100%DEME Concessions, NV Zwijndrecht Belgium 100%DEME Coordination Center, NV Zwijndrecht Belgium 100%DEME Infrasea Solutions, NV Zwijndrecht Belgium 100%DEME Infra Marine Contractors, NV Zwijndrecht Belgium 100%GeoSea, NV Zwijndrecht Belgium 100%GeoSea Maintenance, NV Zwijndrecht Belgium 100%Global Sea Mineral Resources, NV Ostend Belgium 100%M.D.C.C. Insurance Brokers, NV Brussels Belgium 100%Agroviro, NV Zwijndrecht Belgium 74.90%DEME Environmental Contractors, NV Zwijndrecht Belgium 74.90%Ecoterres Holding, SA Gosselies Belgium 74.90%Ecoterres, SA Gosselies Belgium 74.90%Purazur, NV Zwijndrecht Belgium 74.90%DEME Blue Energy, NV Zwijndrecht Belgium 69.99%Scaldis Salvage & Marine Contractors, NV Antwerp Belgium 54.37%Combined Marine Terminal Operations Worldwide, NV Zwijndrecht Belgium 54.37%Grondrecyclagecentrum Kallo, NV Zwijndrecht Belgium 52.43%Dragagem Angola Serviços, Lda. Luanda Angola 100%Dredging International Australia Pty., Ltd. Brisbane Australia 100%GeoSea Australia, Pty., Ltd. Brisbane Australia 100%Dragabras Serviços de Dragagem, Ltda. Rio de Janeiro Brazil 100%Far East Dredging, Ltd. Hong Kong China 100%DEME Cyprus, Ltd. Nicosia Cyprus 100%Dredging International Services Cyprus, Ltd. Nicosia Cyprus 100%Novadeal, Ltd. Nicosia Cyprus 100%Energies du Nord, SAS Lambersart France 100%Société de Dragage International, SA Lambersart France 100%GeoSea Infra Solutions, GmbH Bremen Germany 100%Infrasea Solutions, GmbH & Co KG Bremen Germany 100%Nordsee Nassbagger- und Tiefbau, GmbH Bremen Germany 100%DEME Building Materials, Ltd. Weybridge, Surrey Great Britain 100%NewWaves Solutions, Ltd. Weybridge, Surrey Great Britain 100%DEME Environmental Contractors UK, Ltd. Weybridge, Surrey Great Britain 74.90%International Seaport Dredging, Pvt Ltd. Chennai India 86%Dredging International India, Pvt Ltd. New Delhi India 99.78%Sidra, Spa Rome Italy 100%Dredging International Luxembourg, SA Luxembourg Luxembourg 100%GeoSea Luxembourg, SA Luxembourg Luxembourg 100%GeoSea Procurement & Shipping, SA Luxembourg Luxembourg 100%Safindi, SA Luxembourg Luxembourg 100%Dredging International Mexico, SA Mexico D.F. Mexico 100%Dragamoz, Limitada Maputo Mozambique 100%Dredging International Services (Nigeria), Ltd. Lagos Nigeria 100%Dredging International de Panama, SA Panama Panama 100%Dragmorstroy, LLC. St. Petersburg Russia 100%Dredging International Asia Pacific Pte., Ltd. Singapore Singapore 100%Dredging International España, SA Madrid Spain 100%Tideway, BV Breda The Netherlands 100%DEME Infra Marine Contractors, BV Dordrecht The Netherlands 100%DEME Building Materials, BV Flushing The Netherlands 100%De Vries & van de Wiel Kust- en Oeverwerken, BV Amsterdam The Netherlands 87.45%De Vries & van de Wiel, BV Amsterdam The Netherlands 74.90%
CONSOLIDATED FINANCIAL STATEMENTSDEME — Financial information 201622

MAIN JOINT VENTURES AND ASSOCIATES (EQUITY METHOD)
A S O F D E C E M B E R 3 1 , 2 0 1 6
NAME PLACE COUNTRY % OF SHAREHOLDING
Power@Sea, NV Zwijndrecht Belgium 51.10%High Wind, NV Zwijndrecht Belgium 50.40%Blue Open, NV Zwijndrecht Belgium 49.94%Terranova, NV Zwijndrecht Belgium 43.73%Sédisol, SA Farciennes Belgium 37.45%Silvamo, NV Roeselare Belgium 37.45%Renewable Energy Base Ostend, NV Ostend Belgium 25.50%C-Power Holdco, NV Zwijndrecht Belgium 10%Otary RS, NV Ostend Belgium 18.89%Rentel, NV Ostend Belgium 18.89%C-Power, NV Ostend Belgium 6.46%DEME Brasil Serviços de Dragagem, Ltda. Rio de Janeiro Brazil 50%Guangzhou Coscocs DEME New Energy Engineering Co., Ltd Guangzhou China 50%Extract - Ecoterres, SA Villeneuve-le-Roi France 37.45%Merkur Offshore, GmbH Hamburg Germany 12,50%Normalux Maritime, SA Windhof Luxembourg 37.50%Middle East Dredging Company, Q.S.C. Doha Qatar 44.10%Mordraga, LLC. St. Petersburg Russia 40%Deeprock, CV Breda The Netherlands 50%Oceanflore, BV Kinderdijk The Netherlands 50%
BUSINESS COMBINATIONS
Acquisitions of businesses are accounted for using the acquisition method. The consideration transferred in a business combination is measured at fair value, which is calculated as the sum of the acquisition-date fair values of the assets transferred by the Group, liabilities incurred by the Group to the former owners of the acquiree and the equity interests issued by the Group in exchange for control of the acquiree. Acquisition-related costs are generally recognised in profit or loss as incurred.
At the acquisition date, the identifiable assets acquired and the liabilities assumed are recognised at their fair value, except that:
– deferred tax assets or liabilities, and assets or liabilities related to employee benefit arrangements are recognised and measured in accordance with IAS 12 income taxes and IAS 19 respectively;
– liabilities or equity instruments related to share-based payment arrangements of the acquiree or share-based payment arrangements of the Group entered into to
replace share-based payment arrangements of the acquiree are measured in accordance with IFRS 2 at the acquisition date;
– assets (or disposal groups) that are classified as held for sale in accordance with IFRS 5 non-current assets held for sale and discontinued operations are measured in accordance with that Standard.
Goodwill is measured as the excess of the sum of the consideration transferred, the amount of any non-controlling interests in the acquiree, and the fair value of the acquirer’s previously held equity interest in the acquiree (if any) over the net of the acquisition-date amounts of the identifiable assets acquired and the liabilities assumed. If, after reassessment, the net of the acquisition-date amounts of the identifiable assets acquired and liabilities assumed exceeds the sum of the consideration transferred, the amount of any non-controlling interests in the acquiree and the fair value of the acquirer’s previously held interest in the acquiree (if any), the excess is recognised immediately in profit or loss as a bargain purchase gain.
23

Non-controlling interests that present ownership interests and entitle their holders to a proportionate share of the entity’s net assets in the event of liquidation may be initially measured either at fair value or at the non-controlling interests’ proportionate share of the recognised amounts of the acquiree’s identifiable net assets. The choice of measurement basis is made on a transaction-by-transaction basis. Other types of non-controlling interests are measured at fair value or, when applicable, on the basis specified in another IFRS.
When the consideration transferred by the Group in a business combination includes assets or liabilities resulting from a contingent consideration arrangement, the contingent consideration is measured at its acquisition-date fair value and included as part of the consideration transferred in a business combination. Changes in the fair value of the contingent consideration that qualify as measurement period adjustments are adjusted retrospectively, with corresponding adjustments against goodwill. Measurement period adjustments are adjustments that arise from additional information obtained during the ‘measurement period’ (which cannot exceed one year from the acquisition date) about facts and circumstances that existed at the acquisition date.
The subsequent accounting for changes in the fair value of the contingent consideration that do not qualify as measurement period adjustments depends on how the contingent consideration is classified. Contingent consideration that is classified as equity is not remeasured at subsequent reporting dates and its subsequent settlement is accounted for within equity. Contingent consideration that is classified as an asset or a liability is remeasured at subsequent reporting dates in accordance with IAS 39, or IAS 37 provisions, contingent liabilities and contingent assets, as appropriate, with the corresponding gain or loss being recognised in profit or loss.
When a business combination is achieved in stages, the Group’s previously held equity interest in the acquiree is remeasured to its acquisition-date fair value and the resulting gain or loss, if any, is recognised in profit or loss.
Amounts arising from interests in the acquiree prior to the acquisition date that have previously been recognised in other comprehensive income are reclassified to profit or loss where such treatment would be appropriate if that interest were disposed of.
If the initial accounting for a business combination is incomplete by the end of the reporting period in which the combination occurs, the Group reports provisional amounts for the items for which the accounting is incomplete. Those provisional amounts are adjusted during the measurement period (see above), or additional assets or liabilities are recognised, to reflect new information obtained about facts and circumstances that existed at the acquisition date that, if known, would have affected the amounts recognised at that date.
BUSINESS COMBINATIONS BETWEEN ENTITIES UNDER COMMON CONTROL
As current IFRSs do not specify recognition and measurement principles in respect of business combinations between entities under common control (these are excluded from the scope of IFRS 3 business combinations), the Group applied generally the same principles as specified under IFRS 3 except that the assets and liabilities of the acquiree are initially recognised at their carrying amount (no fair value adjustment at acquisition date are recognised).
BUSINESS COMBINATIONS AND DISPOSALS IN THE COURSE OF 2016
In the course of 2016, the DEME Concessions Group has reduced its participation in C-Power Holdco NV from 19.67% to 10%. C-Power Holdco NV remains consolidated according to the equity method. The company Power@Sea Thornton NV was dissolved.
The Group acquired in 2016 a 50% stake in the newly created company Guangzhou Coscocs DEME New Energy Engineering Co. LTD and a 49.94% stake in the newly created company Blue Open NV.
CONSOLIDATED FINANCIAL STATEMENTSDEME — Financial information 201624

In 2016 the Group has participated in capital increases at some associates while DEME’s interest percentage did not change as other shareholders also participated in these capital increases pro rata their interest share.
The companies Geka Bouw BV and CFE Nederland BV, which are 100% held by the DEME Group have been merged and renamed DIMCO BV.
BUSINESS COMBINATIONS AND DISPOSALS IN THE COURSE OF 2015
On May 13, 2015, GeoSea, a 100% affiliate of DEME, acquired the additional 50% in HGO Infrasea Solutions GmbH & Co KG (HGO) from the German Group Hochtief, and became as such sole shareholder of HGO. This company is the owner of the jack-up vessel ‘Innovation’, the most powerful self elevating platform for offshore wind farm construction. Since April 1, 2015, HGO was fully consolidated. Next to the acquisition of the shares, the sale and purchase agreement also included the sale of 3 pontoons (‘Wismar’, ‘Bremen’ and ‘Stralsund’) and the legal position as lessee of the jack-up vessel ‘Thor’. A residual goodwill on the full transaction is booked for an amount of 1.26 million EUR, which was determined by comparing the consideration with the fair value of all identifiable assets and liabilities recognised at acquisition date. The fair value of the fleet was supported by a valuation report made by an independent valuator.
At the end of the financial year, the entities CFE Nederland BV and GEKA Bouw BV, direct subsidiaries of CFE NV, were repositioned under DEME Infra Marine Contractor NV (DIMCO). A residual goodwill of 3.5 million EUR was booked on this transaction.
At the end of 2015, DEME sold all of its shares, 50%, in the company FLiDAR N.V. to AXYS Technologies Inc., a Canadian company. FLiDAR N.V. was a joint venture established between 3E and OWA (DEME Group), to build, service and commercialise a floating LiDAR based measurement device.
FOREIGN CURRENCIESThe euro is used as presentation currency for the consolidated financial statements.
Financial statements of foreign entities whose functional currencies are other than the euro, are translated as follows:
– assets and liabilities are translated at the year-end rate; – income and expenses are translated at the average
exchange rate for the year; – shareholders’ equity accounts are translated at
historical exchange rates.
Exchange differences arising, if any, are recognised in other comprehensive income and accumulated in equity (and attributed to non-controlling interests as appropriate).
On the disposal of a foreign operation (i.e. a disposal of the Group’s entire interest in a foreign operation, a disposal involving loss of control over a subsidiary that includes a foreign operation, or a partial disposal of an interest in a joint arrangement or an associate that includes a foreign operation of which the retained interest becomes a financial asset), all of the exchange differences accumulated in equity in respect of that operation attributable to the owners of the Company are reclassified to profit or loss.
In addition, in relation to a partial disposal of a subsidiary that includes a foreign operation that does not result in the Group losing control over the subsidiary, the proportionate share of accumulated exchange differences are re-attributed to non-controlling interests and are not recognised in profit or loss. For all other partial disposals (i.e. partial disposals of associates or joint arrangements that do not result in the Group losing significant influence or joint control), the proportionate share of the accumulated exchange differences is reclassified to profit or loss.
25

Foreign currency transactions are accounted for at exchange rates prevailing at the date of the transactions. Monetary assets and liabilities denominated in foreign currencies are translated at the balance sheet date rate. Gains and losses resulting from the settlement of foreign currency transactions and from the translation of monetary assets and liabilities denominated in foreign currencies are recognised in the income statement. Non-monetary items that are measured in terms of historical cost in a foreign currency are not retranslated.
INTANGIBLE ASSETS
Acquired licences, patents and similar rightsThese intangibles that are separately acquired and that have a finite useful life are carried at cost less accumulated amortisation and accumulated impairment losses. Amortisation is recognised on a straight line basis over their estimated useful lives.
Research and developmentExpenditure on research activities is recognised in the income statement as an expense as incurred.
An internally-generated intangible asset arising from development (or from the development phase of an internal project) is recognised if, and only if, all of the following have been demonstrated:
– the technical feasibility of completing the intangible asset so that it will be available for use or sale;
– the intention to complete the intangible asset and use or sell it;
– the ability to use or sell the intangible asset; – how the intangible asset will generate probable future
economic benefits; – the availability of adequate technical, financial and
other resources to complete the development and to use or sell the intangible asset;
– the ability to measure reliably the expenditure attributable to the intangible asset during its development.
The amount initially recognised for internally-generated intangible assets is the sum of the expenditure incurred from the date when the intangible asset first meets the recognition criteria listed above. Where no internally-generated intangible asset can be recognised, development expenditure is recognised in profit or loss in the period in which it is incurred.
Subsequent to initial recognition, internally-generated intangible assets are reported at cost less accumulated amortisation and accumulated impairment losses, on the same basis as intangible assets that are acquired separately.
Exploration for and evaluation of mineral resourcesDEME has opted to expense costs incurred for the exploration and evaluation of mineral resources on the seabed.
GOODWILL
Goodwill arising from a business combination is recognised as an asset on the date on which control was obtained (the acquisition date). Goodwill is measured as the excess of the consideration transferred, the non-controlling interests in the acquired company and the fair value of the stake already owned by the Group in the acquired company (if any) over the net amount of identifiable assets acquired and liabilities assumed on the acquisition date.
Non-controlling interests are initially measured either at fair value, or at the non-controlling interests’ share of the acquiree’s recognised identifiable net assets. The basis of measurement is selected on a transaction-by-transaction basis.
Goodwill is not amortised, but is subject to impairment tests taking place annually or more frequently if there is an indication that the cash-generating unit to which it is allocated (generally a subsidiary) could have suffered a loss of value. Goodwill is stated on the balance sheet at cost
CONSOLIDATED FINANCIAL STATEMENTSDEME — Financial information 201626

less accumulated impairment losses, if any. Impairment of goodwill is not reversed in future periods. When a subsidiary is divested from the group, the resulting goodwill and other comprehensive income relating to the subsidiary are taken into account in determining the net gain or loss on disposal.
If, after reassessment, the net balance, at the acquisition date, of identifiable assets acquired and liabilities assumed is higher than the sum of the consideration transferred, non-controlling interests in the acquiree and the fair value of the stake in the acquiree previously owned by the Group (if any), the surplus is recognised immediately in the income statement as a gain from a bargain purchase.
PROPERTY, PLANT AND EQUIPMENT
Property, plant and equipment are stated at historical cost, less accumulated depreciation and impairment losses. Historical cost includes all direct costs and all expenditure incurred to bring the asset to its working condition and location as well as for its intended use. Historical cost includes the original purchase price, borrowing costs incurred during the construction period, and related direct costs. Dredging equipment consists of components with different useful lives that are accounted for as separate items.
Subsequent costs are included in the asset’s carrying amount or recognised as a separate asset, as appropriate, only when it is probable that future economic benefits associated with the item will flow to the group and the cost of the item can be measured reliably. The carrying amount of the replaced part is derecognised. The wear and tear of dredging equipment is highly dependent on project-specific combinations of soil conditions, material to be processed, maritime circumstances, and the intensity of the deployment of the equipment (factors that are difficult to predict). Due to these erratic and time-independent patterns, the maintenance and repair expenses for upkeep of the assets during the operation of the vessel are predominantly charged to the profit and loss account.
Dry-docking costs are recognised in the carrying amount of ships, rigs, etc. when incurred and depreciated over the period until the next dry-docking.
Depreciation is charged to the income statement on a straight-line basis over the useful lives at an estimated residual value as indicated in the table below. Land is not depreciated as it is deemed to have an infinite life, except for landfills used for sand production that are depreciated according to the tons extracted. Methods for depreciation, useful life and residual value are reassessed at the end of each financial year and amended if necessary.
At initial recognition, estimated useful lives and residual values are as follows: Equipment Useful life Residual
value
Buildings 25 years
Trailing suction hopper dredgers 18 years 5%
Cutter suction dredgers 18 years 5%
Fallpipe vessels 21 years 5%
Bucket dredgers 25 years 5%
Self-propelled hopper and transportation barges
25 years 5%
Backhoe dredgers and pontoons 18 years
Specific spare parts related to vessels
Identical to useful life
of related vessel
Other barges, auxiliaries and booster stations
18 years
Self-propelled jack-up platforms: pontoon part
20 years 5%
Self-propelled jack-up platforms: crane and jack-up system
10 years
Pilot boats 15 years 15%
Cranes 12 years 5%
Earth moving material 5 years
Pipelines 3 years
Site equipment and installations 5 years
Transportation equipment 3 years
Office equipment and furniture 10 years
Computers 3 years
27

Gains and losses on disposals are determined by comparing the proceeds with the carrying amount and are recognised within other operating income.
THE GROUP AS LESSEE
Finance leasesLeases under which the group assumes substantially all the risks and rewards of ownership are classified as finance leases. Property, plant and equipment acquired by way of finance lease are stated at an amount equal to the lower of their fair value and the present value of the minimum lease payments at inception of the lease, less accumulated depreciation and impairment losses. Each lease payment is allocated between the liability and finance charges so as to achieve a constant periodic rate of interest on the finance balance outstanding. The corresponding liability, net of finance charges, is presented as part of financial debt. The interest element is charged to the income statement as a finance charge over the lease period. The depreciation policy for leased assets is consistent with that for depreciable assets which are owned. However, when there is no reasonable certainty that ownership will be obtained by the end of the lease term, the asset is depreciated over the shorter of the lease term and its expected useful life.
Operating leasesLeases under which substantially all the risks and rewards of ownership are effectively retained by the lessor are classified as operating leases. Lease payments under an operating lease are recognised as an expense on a straight-line basis over the lease term.
INVENTORIES
Inventories are measured at the lower of cost and net realisable value. Cost is determined using the weighted average method. Net realisable value is the estimated selling price in the ordinary course of business, less the costs of completion and variable selling expenses.
AMOUNTS DUE FROM AND DUE TO CUSTOMERS UNDER CONSTRUCTION CONTRACTS
Due from customers concerns the gross amount yet to be charged which is expected to be received from customers for contractual work performed up to the reporting date (hereinafter: “work in progress”) and services rendered. Work in progress is valued at the cost price of the work performed, plus a part of the expected results upon completion of the project in proportion to the progress made and less progress billings, and potential provisions for losses. Provisions are recognised for expected losses on work in progress as soon as they are foreseen and if necessary, any profits already recognised are reversed. Revenues from additional work and claims are included in the overall contract revenues if the client has accepted the sum involved in any way. The cost price includes project costs, consisting of payroll costs, materials, costs of subcontracted work, rental charges and maintenance costs for the equipment used and other project costs. The rates used are based on the expected average occupation in the long run. The progress of a project is determined on the basis of the cost of the work done in relation to the expected cost price of the project as a whole. Profits are not recognised unless a reliable estimate can be made of the result on completion of the project. It is considered that no such reliable estimate can be made when actual cost of the work is less than 10% of the total expected cost price of the project. The balance of the value of work in progress is determined per project. For projects where the progress billings exceed the value of work in progress, the balance is recognised under current liabilities instead of under current assets. The respective balance sheet items are “due from customers” as a current asset and “due to customers” which is a current liability. In the DEME financial information brochure of last year the respective current asset was contracts in progress as part of the inventories and the respective current liability was invoices to receive as part of trade payables. The new presentation we use from 2016 onwards is also applied to the comparative figures of 2015 in this brochure. When there is any constraint on transferring cash from
CONSOLIDATED FINANCIAL STATEMENTSDEME — Financial information 201628

the working country to the head-office, the profit on a contract is only recognised on a cash basis.
TRADE AND OTHER RECEIVABLES
Trade and other receivables are stated initially at fair value and subsequently at amortised cost less accumulated impairment losses, such as doubtful debts. Amortised cost is determined using the effective interest rate.
CASH AND CASH EQUIVALENTS
Cash and cash equivalents consist of cash on hand and balances with banks and short-term investments. Cash, cash equivalents and short-term deposits are carried in the balance sheet at nominal value.
IMPAIRMENT TANGIBLE AND INTANGIBLE ASSETS INCLUDING GOODWILL
At the end of each reporting period, the Group reviews the carrying amounts of its tangible and intangible assets to determine whether there is any indication of impairment. If any such indication exists, the asset’s recoverable amount is estimated. For intangible assets that are not yet available for use, and for goodwill, the recoverable amount is estimated at each balance sheet date. An impairment loss is recognised whenever the carrying amount of an asset or its cash-generating unit (generally a subsidiary) exceeds its recoverable amount. Recoverable amount is the higher of fair value less costs of disposal and value in use. In assessing value in use, the estimated future cash flows are discounted to their present value using a pre-tax discount rate that reflects current market assessments of the time value of money and the risks specific to the asset for which the estimates of future cash flows have not been adjusted.
If the recoverable amount of an asset (or cash-generating unit) is estimated to be less than its carrying amount, the carrying amount of the asset (or cash-generating unit) is
reduced to its recoverable amount. An impairment loss is recognised immediately in profit or loss.
When an impairment loss subsequently reverses, the carrying amount of the asset (or a cash-generating unit) is increased to the revised estimate of its recoverable amount, but so that the increased carrying amount does not exceed the carrying amount that would have been determined had no impairment loss been recognised for the asset (or cash-generating unit) in prior years. A reversal of an impairment loss is recognised immediately in profit or loss. An impairment loss on goodwill is never reversed.
SHARE CAPITAL
Repurchase of share capitalWhen the company purchases its own shares the amount paid, including any directly imputable expenses, is recognised as a deduction in equity. Proceeds from selling shares are directly included in equity, with no impact on the income statement.
PROVISIONS
Provisions are recognised in the balance sheet when the Group has a presented obligation (legal or constructive) resulting from a past event, when it is probable (more likely than not) that an outflow of resources embodying economic benefits will be required to settle the obligation, and a reliable estimate of the amount of the obligation can be made.
The amount recognised as a provision is the best estimate of the consideration required to settle the present obligation at the end of the reporting period, taking into account the risks and uncertainties surrounding the obligation. When a provision is measured using the cash flows estimated to settle the present obligation, its carrying amount is the present value of those cash flows (when the effect of the time value of money is material).
29
EMPLOYEE BENEFIT OBLIGATIONS
Defined contribution plansContributions to defined contribution plans are recognised as an expense in the income statement when incurred.
Belgian defined contribution plans with guaranteed returnBy law, defined contribution pension plans in Belgium are subject to minimum guaranteed rates of return. Hence, strictly speaking, those plans classify as defined benefit plans. The IASB recognised that the accounting for such so-called contribution-based plans in accordance with the currently applicable defined benefit methodology is problematic. Considering as well the uncertainty with respect to the future evolution of the minimum guaranteed rates of return in Belgium, the Company until 2014 adopted a retrospective approach whereby the net liability recognised in the statement of financial position is based on the sum of the positive differences, determined by individual plan participant, between the minimum guaranteed reserves and the accumulated contributions based on the actual rates of return at the closing date (i.e. the net liability is based on the deficit measured at intrinsic value, if any).
As a result of the law of April 28, 2003 related to supplementary pension plans, the employer guaranteed a minimum rate of return on the employees’ contributions (i.e. 3.75%) and, in case of a defined contribution plan 3.25% on the employers’ contribution. As a result of the law of December 18, 2015 aiming to guarantee the sustainability and the social nature of the supplementary pension plans these minimum guaranteed rates of return have been adjusted. On contributions paid as from January 1, 2016 onwards, a new, variable minimum guaranteed rate of return is applicable. This percentage is calculated as 65% of the average 10 year OLO return considered over a period of 24 months, with a minimum of 1.75% and a maximum of 3.75%. In view of the overall low OLO returns over the last years, the current percentage is fixed at 1.75%. For the existing pensions plans at DEME, the old 3.25% and 3.75% guaranteed minimum rates
of return remain applicable on the cumulative reserves per December 31, 2015, until the employee leaves the company. The new guaranteed rate of return (1.75% per January 1, 2016) is only applicable on contributions made during 2016.
In view of the minimum guaranteed rates of return, these defined contribution plans classify as defined benefit plans
Based on an analysis of the pension plans, the immaterial difference between the cumulative reserves and the minimum reserves per December 31, 2015, and the immaterial difference between the minimum guaranteed rate of return applicable to DEME and the technical rate of return guaranteed by the insurers, it is assumed that application of the Projected Unit method to defined contribution plans, would not have a material impact. Accordingly, no provision has been accounted for in this respect in the financial information as of December 31, 2015. In the consolidated balance sheet as of December 31, 2016 a provision of 3.6 million EUR was recorded for the Belgian defined contribution plans with guaranteed return that are as such accounted for as defined-benefit plans.
Defined benefit plansFor defined benefit retirement benefit plans, the cost of providing benefits is determined using the projected unit credit method, with actuarial valuations being carried out at the end of each annual reporting period. Remeasurement, comprising actuarial gains and losses, the effect of the changes to the asset ceiling (if applicable) and the return on plan assets (excluding interest), is reflected immediately in the statement of financial position with a charge or credit recognised in other comprehensive income in the period in which they occur. Remeasurement recognised in other comprehensive income is reflected as a separate reserve in equity and will not be reclassified to profit or loss. Past service cost is recognised in profit or loss in the period of a plan amendment. Net interest is calculated by applying the discount rate at the beginning of the period to the net defined benefit liability or asset.
CONSOLIDATED FINANCIAL STATEMENTSDEME — Financial information 201630

Defined benefit costs are categorised as follows:
– service cost (including current service cost, past service cost, as well as gains and losses on curtailments and settlements);
– net interest expense or income; – remeasurement.
The Group presents the first two components of defined benefit costs in profit or loss. Curtailment gains and losses are accounted for as past service costs.
The retirement benefit obligation recognised in the consolidated statement of financial position represents the actual deficit or surplus in the Group’s defined benefit plans. Any surplus resulting from this calculation is limited to the present value of any economic benefits available in the form of refunds from the plans or reductions in future contributions to the plans.
BonusesBonuses received by company employees and management are based on financial key indicators and personal performance.
INTEREST-BEARING LOANS AND BORROWINGS
Interest-bearing loans and borrowings are recognised initially at fair value adjusted for the attributable transaction costs. Subsequent to initial recognition, interest-bearing loans and borrowings are stated at amortised cost with any difference between the proceeds (adjusted for transaction costs) and redemption value being recognised in the income statement over the period of the loan or borrowings on an effective interest rate basis.
TRADE AND OTHER PAYABLES
Trade and other payables are stated at nominal value.
INCOME TAXES
Income taxes are classified as either current or deferred taxes. Income tax is recognised in the income statement except to the extent that it relates to items recognised directly in equity, in which case it is recognised in equity.
Current income taxes include expected tax charges based on the accounting profit for the current year and adjustments to tax charges of prior years.
Deferred taxes are calculated using the liability method, on temporary differences arising between the tax bases of assets and liabilities and their carrying amounts in the financial statements. The principal temporary differences arise from depreciation of property, plant and equipment, provisions for defined benefit plans, fair value measurement of derivatives and tax losses carried forward.
Deferred taxes are measured using the tax rates expected to apply to taxable income in the years in which those temporary differences are expected to be realised or settled, based on tax rates enacted or substantively enacted by the balance sheet date. Deferred tax assets are recognised to the extent that it is probable that future taxable profit will be available against which the temporary differences can be utilised; this criterion is reassessed at each balance sheet date.
INVESTMENT TAX CREDITS
Investment tax credits are excluded from the scope of IAS 12 income taxes and IAS 20 accounting for government grants and disclosure of government assistance. In accordance with IAS 8 accounting policies, changes in accounting estimates and errors, the Group defined an accounting policy in respect of investment tax credits by making an analogy to IAS 12 income taxes. By making this analogy a credit will be recognised in profit or loss, and the related asset in the statement of financial position recognised in the line item Deferred tax assets, when the entity satisfies the criteria to receive the credit.
31
DERIVATIVE FINANCIAL INSTRUMENTS AND HEDGING
DEME uses derivative financial instruments to hedge its exposure to foreign exchange, interest-rate and commodity price risks (mainly fuel) arising from operational, financing and investment activities. The exposure of all subsidiaries is managed on a centralised basis, in accordance with the aims and principles laid down by general management. As a policy, the Group does not engage in speculative or leveraged transactions, nor does it hold or issue financial instruments for trading purposes.
Derivative financial instruments are initially recognised and subsequently measured at fair value. Recognition of any resulting unrealised gain or loss depends on the nature of the item being hedged.
It is the policy of the Group to use cash flow hedges to cover all operational currency risks that mainly relate to future cash flows from contracts that are highly probable to be realised and that are denominated in currencies other than the relevant functional currency. Fuel price risks and interest rate risks in future cash flows can be hedged from time to time using specific derivatives.
Hedge accounting is applied to the majority of cash flow hedges as follows. On initial designation of the hedge, the Group formally documents the relationship between the hedging instrument(s) and hedged item(s), including the risk management objectives and strategy in undertaking the hedge transaction, together with the methods that will be used to assess the effectiveness of the hedging relationship. The Group makes an assessment, both at the inception of the hedge relationship as well as on an ongoing basis, whether the hedging instruments are expected to be effective in offsetting the changes in the fair value or cash flows of the respective hedged items during the period for which the hedge is designated, and whether the actual results of each hedge are within a range of 80 to 125 percent. For a cash flow hedge of
a forecast transaction, the transaction should be highly probable to occur and should present an exposure to variations in cash flows that could ultimately affect reported net income.
The application of hedge accounting means that movements in the market value of cash flow hedges not yet settled – including results realised on the rolling forward of existing hedges as a result of differences between the duration of the hedges concerned and the underlying cash flows – will be directly added or charged to the hedging reserve in group equity, taking taxation into account. If a cash flow hedge added or charged to the group equity either expires, is closed or is settled, or the hedge relation with the underlying cash flows can no longer be considered effective, the accumulated result will continue to be recognised in group equity as long as the underlying cash flow is still expected to take place.
When the underlying cash flow actually takes place, the accumulated result is included directly in the income statement. Movements in the market value of cash flow hedges to which no hedge accounting is applied (ineffective cash flow hedges and the ineffective portion of effective cash flow hedges) are included in the income statement for the reporting period.
Results from settled effective cash flow hedges and the movements in the market value of ineffective cash flow hedges insofar these relate to non-current receivables, loans and other borrowings are recognised as finance income and finance expenses and otherwise in the related items within operating result. The purchase or sale of financial instruments is generally recorded at transaction rate. Derivatives are stated at fair value; attributable transaction costs are recognised in the income statement as incurred. Subsequent to initial recognition, derivatives are measured at fair value, and changes therein are accounted for as described.
CONSOLIDATED FINANCIAL STATEMENTSDEME — Financial information 201632

REVENUE
Revenue from construction contractsRevenue from a construction contract includes the initial amount of revenue agreed in the contract and variations in the work specified by the contract, claims and performance bonuses to the extent that the client has accepted the sum involved in any way.
Contract revenue is measured at the fair value of the consideration received or receivable.
When the outcome of a construction contract can be estimated reliably, revenue and costs are recognised by reference to the stage of completion of the contract activity at the end of the reporting period, measured based on the proportion of contract costs incurred for work performed to date relative to the estimated total contract costs, except where this would not be representative of the stage of completion. A correction is made for the cost of material (e.g. steel) that is purchased but not yet manufactured or in production process at reporting date. This material cost will be accounted for as inventory. When the outcome of a construction contract cannot be estimated reliably, contract revenue is recognised to the extent of contract costs incurred that it is probable will be recoverable. Contract costs are recognised as expenses in the period in which they are incurred.
When it is probable that total contract costs will exceed total contract revenue, the expected loss is recognised as an expense immediately.
See also above for the accounting policy on amounts due from and due to customers.
Rendering of ServicesThe accounting policy applied is very similar to revenue from construction contracts.
Financial IncomeFinancial income comprises interest income, dividend income, foreign exchange gains and gains on financial derivatives that are recognised in the income statement.
Interest income is accrued on a time basis, by reference to the principal outstanding and at the effective interest rate applicable. Dividend income is recognised when the shareholder’s right to receive payment has been established (provided that it is probable that the economic benefits will flow to the Group and the amount of income can be measured reliably).
EXPENSES
Financial expensesFinancial expenses comprise interest expense on borrowings, foreign exchange losses, and losses on hedging instruments that are recognised on the income statement.
All interest expense and other costs incurred in connection with borrowings, except those which were eligible to be capitalised, are taken to profit or loss as financial expenses. The interest expense is recognised in the income statement using the effective interest rate method.
Research and development, advertising and promotional costs and IT systems development costs Research, advertising and promotional costs are expensed in the year in which they are incurred. Development costs and IT systems development costs are expensed in the year in which they are incurred if they do not meet the criteria for capitalisation.
33

DEME IFRS
Explanatory notes to the consolidated financial statements
Note 1 — Other operating income and expensesBalance at December 31
(in thousands of EUR) 2016 2015
Gain on sale of property, plant and equipment and intangible assets 2,479 18,581
Other operating income 42,587 15,086
Total other operating income 45,066 33,667
Loss on sale of property, plant and equipment and intangible assets 123 642
Other operating expenses 17,143 15,184
Movement in amounts written off inventories and trade receivables 1,332 919
Total other operating expenses 18,598 16,745
Note 2 — EmploymentBalance at December 31
Average number of persons employed during the year (in FTE) 2016 2015
Workers 2,223 2,135
Employees and management personnel 2,009 1,964
Total 4,232 4,099
Personnel expenses (in thousands of EUR) 2016 2015
Remuneration and social charges 361,213 348,651
Pension expenses 2,793 7,002
Total 364,006 355,653
CONSOLIDATED FINANCIAL STATEMENTSDEME — Financial information 201634

Note 3 — Intangible assets
(in thousands of EUR) Research and development
expenses
Concessions, patents,
licences, etc.
Other intangible
assets
Total
Acquisition cost at January 1, 2016 2,012 28,868 10,022 40,902
Movements during the year:
Acquisitions, including fixed assets, own production 1,266 1,479 0 2,745
Sales and disposals – -6,209 -1,394 -7,603
Transfers from one heading to another – – – –
Translation differences 19 156 – 175
Acquisitions through business combinations – – – –
At December 31, 2016 3,297 24,294 8,628 36,219
Cumulative depreciation and impairment at January 1, 2016 2,010 17,930 8,584 28,524
Movements during the year:
Recorded 1,284 3,244 1,438 5,966
Written down after sales and disposals – -6,209 -1,394 -7,603
Transfers from one heading to another – – – –
Translation differences – 189 – 191
Acquisitions through business combinations – – – –
At December 31, 2016 3,296 15,154 8,628 27,078
Net book value at the end of the year 1 9,140 – 9,141
Note 4 — GoodwillBalance at December 31
(in thousands of EUR) 2016 2015
Balance at January 1 18,732 17,055
Movements during the year:
Acquisitions through business combinations – 4,792
Disposals – –
Impairment losses – -3,115
Balance at December 31 18,732 18,732
35

Note 5 — Property, plant and equipment
(in thousands of EUR) Land and buildings
Floating and other
constructionequipment
Furnitureand vehicles
Other tangible
assets
Assets under construction
Total property,
plant and
equipment
Acquisition cost at January 1, 2016 79,380 2,930,975 23,987 13,381 87,319 3,135,042
Movements during the year:
Acquisitions, including fixed assets, own production 6,123 104,582 1,403 152 65,321 177,581
Sales and disposals -2,899 -157,556 -949 -12,075 -1 -173,480
Transfers from one heading to another 12,959 14,887 – – -27,846 –
Translation differences -431 1,869 -455 373 102 1,458
Acquisitions through business combinations – – – – – –
At December 31, 2016 95,132 2,894,757 23,986 1,831 124,895 3,140,601
Cumulative depreciation and impairment at January 1, 2016 36,359 1,414,054 19,130 13,001 – 1,482,543
Movements during the year:
Recorded 3,237 209,019 2,136 75 – 214,467
Written down after sales and disposals -1,968 -155,849 -916 -12,075 – -170,808
Transfers from one heading to another 1,885 -1,885 – – – –
Translation differences -351 2,447 -346 374 – 2,125
Acquisitions through business combinations – – – – – –
At December 31, 2016 39,162 1,467,786 20,004 1,375 – 1,528,327
Net book value at the end of prior year 33,182 1,526,761 4,857 380 87,319 1,652,499
Net book value at the end of the year 46,130 1,436,811 3,982 456 124,895 1,612,274
In 2015, the DEME Group started building six new vessels and begin 2017 an order for two additional vessels, ‘Spartacus’ and ‘Orion’, was confirmed.At December 31, 2016 a remaining amount of 808,684 thousand EUR from assets under construction still has to be invested in the coming years.At December 31, 2016 an amount of 290,395 thousand EUR mortgage on vessels is outstanding compared to 526,499 thousand EUR at December 31, 2015.The net carrying amount of finance lease assets amounts to 109,536 thousand EUR (2015: 112,554 thousand EUR). These finance leases mainly relate to vessels.The recorded depreciations of 214,467 thousand EUR include impairment losses for an amount of 5,267 thousand EUR.
CONSOLIDATED FINANCIAL STATEMENTSDEME — Financial information 201636
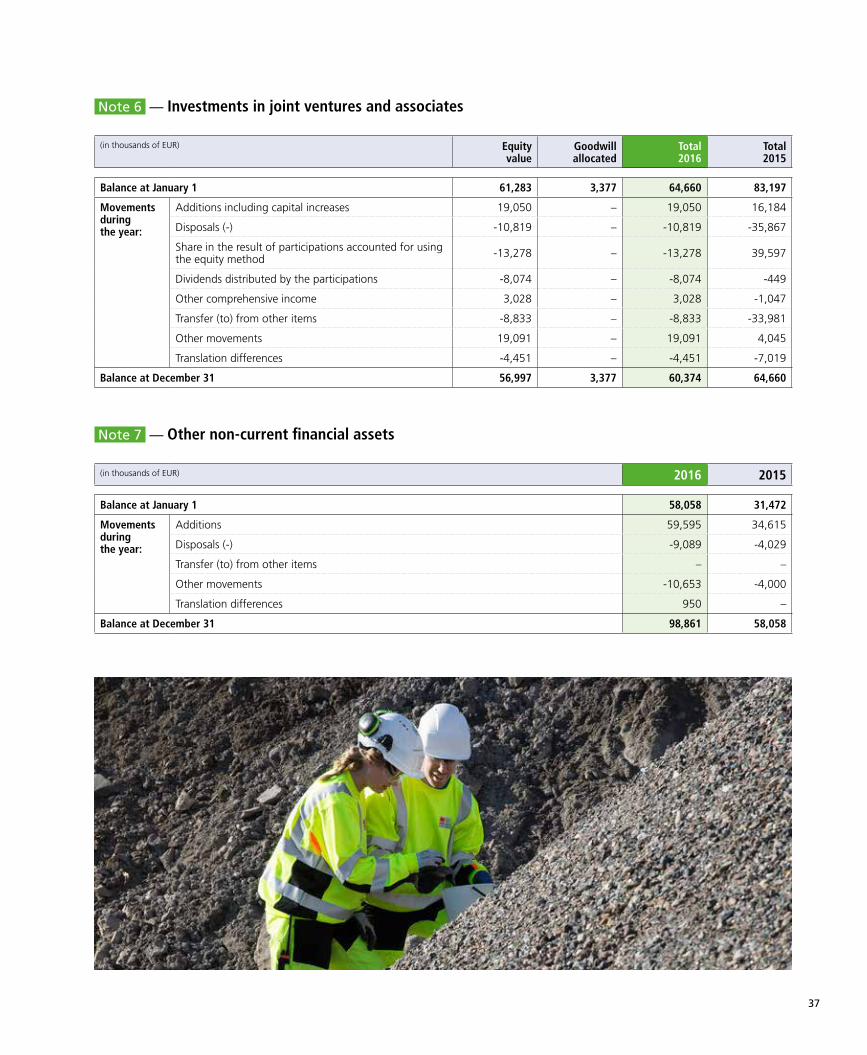
Note 6 — Investments in joint ventures and associates
(in thousands of EUR) Equity value
Goodwill allocated
Total 2016
Total 2015
Balance at January 1 61,283 3,377 64,660 83,197
Movements during the year:
Additions including capital increases 19,050 – 19,050 16,184
Disposals (-) -10,819 – -10,819 -35,867
Share in the result of participations accounted for using the equity method -13,278 – -13,278 39,597
Dividends distributed by the participations -8,074 – -8,074 -449
Other comprehensive income 3,028 – 3,028 -1,047
Transfer (to) from other items -8,833 – -8,833 -33,981
Other movements 19,091 – 19,091 4,045
Translation differences -4,451 – -4,451 -7,019
Balance at December 31 56,997 3,377 60,374 64,660
Note 7 — Other non-current financial assets
(in thousands of EUR) 2016 2015
Balance at January 1 58,058 31,472
Movements during the year:
Additions 59,595 34,615
Disposals (-) -9,089 -4,029
Transfer (to) from other items – –
Other movements -10,653 -4,000
Translation differences 950 –
Balance at December 31 98,861 58,058
37

Note 8 — Financial derivatives
(in thousands of EUR) Non-current
asset
Non-current liability
Currentasset
Currentliability
Total net balance
Market value
Notionalamount
Exchange rate instruments (forward sales/purchase agreements) 452 -661 1,592 -10,313 -8,930 248,962
Interest rate swaps 58 -8,598 – -4,917 -13,457 793,601
Fuel hedges – -9,216 719 -8,272 -16,769 73,506
Balance at December 31, 2016 510 -18,475 2,311 -23,502 -39,156
Exchange rate instruments (forward sales/purchase agreements) 1,381 -94 8,514 -4,795 5,006 610,244
Interest rate swaps – -8,517 – -7,323 -15,840 744,823
Fuel hedges – -24,748 – -22,489 -47,237 118,967
Balance at December 31, 2015 1,381 -33,359 8,514 -34,607 -58,071
Note 9 — Deferred tax assets and liabilities
Carrying amount(in thousands of EUR) Deferred tax assets Deferred tax liabilities
2016 2015 2016 2015
Balance at January 1 96,984 102,930 109,049 81,732
Recognised in the income statement 14,537 566 -2,839 28,518
Charged to equity 5,624 -2,077 – –
Acquisition of subsidiary or change in% – – – 3,211
Disposal of subsidiary or change in% – – – –
Translation differences – – 615 23
Other items 6,141 23,073 6,141 23,073
Netting of deferred taxes (*) -586 -27,508 -586 -27,508
Balance at December 31 122,700 96,984 112,380 109,049
Recognised deferred tax assets and liabilities
Deferred tax assets and liabilities are attributable to the following items(in thousands of EUR):
Deferred tax assets Deferred tax liabilities
2016 2015 2016 2015
Property, plant and equipment and intangible assets 12,287 11,257 82,765 84,771
Employee benefits 13,477 9,348 – –
Financial derivative instruments 5,978 4,690 – 88
Working capital items 57,913 42,656 6,935 10,991
Tax losses and tax credits 85,257 80,659 – –
Other items – – 74,892 64,825
Netting of deferred taxes (*) -52,212 -51,626 -52,212 -51,626
TOTAL 122,700 96,984 112,380 109,049
(*) The tax netting item reflects the netting of deferred tax assets and liabilities per entity.
CONSOLIDATED FINANCIAL STATEMENTSDEME — Financial information 201638

Note 10 — Inventories and construction contractsBalance at December 31
(in thousands of EUR) / (-) is credit balance 2016 2015
Inventories
Raw materials and consumables 25,261 11,259
Construction contracts
Advances received -104,477 -44,160
Amounts due from customers 287,646 233,421
Amounts due to customers -43,214 -35,048
Balance 244,432 198,373
Cumulative incurred costs plus profit in proportion to progress less provisions for losses 2,978,895 3,313,185
Progress billings -2,734,463 -3,114,812
Balance 244,432 198,373
The payments due from customers include amounts which will be paid subject to specified conditions from third parties. The determination of the profits in proportion to the stage of completion and the provision for losses is based on estimated costs and revenues of the relating projects. These estimates contain uncertainties.
Note 11 — Trade and other operating receivablesBalance at December 31
(in thousands of EUR) 2016 2015
Trade receivables 396,301 482,166
Corporation taxes and VAT 41,626 23,211
Other operating receivables 41,795 43,655
Total trade and other operating receivables 479,722 549,032
39

Note 12 — Interest-bearing debt and net financial debt
Net financial debt as defined by the Group
(in thousands of EUR) / (-) is debit balance Non-current Current Total 2016 Non-current Current Total 2015
Balance at December 31
Subordinated loan 1,294 – 1,294 – – 0
Bond 199,853 – 199,853 199,780 – 199,780
Finance Leases 41,215 46,604 87,819 86,028 13,799 99,827
Credit institutions 281,438 102,343 383,781 252,545 95,102 347,647
Other loans 3,246 – 3,246 675 – 675
Short term credit facilities – 3,000 3,000 – – –
Other current financial liabilities – – – – – –
Total Interest-bearing debt 527,046 151,947 678,993 539,028 108,901 647,929
Cash and cash equivalents – -527,778 -527,778 – -378,464 -378,464
Total net financial debt 527,046 -375,831 151,215 539,028 -269,563 269,465
Debt maturity schedule of total long-term financial liabilities
(in thousands of EUR) More than 5 years
Between 1 and 5 years
Less than 1 year
Total
Subordinated loan – 1,294 – 1,294
Bond – 199,853 – 199,853
Finance Leases 16,652 24,563 46,604 87,819
Credit institutions 55,588 225,850 102,343 383,781
Other loans – 3,246 – 3,246
Total 72,240 454,806 148,947 675,993
Credit facilities and bank term loansAt December 31, 2016, DEME has confirmed bank credit facilities of 95 million EUR which are not drawn at year end 2016. Moreover, DEME has confirmed long-term credit facilities of 425 million EUR, which are not drawn at year end 2016, intended to finance the development of its fleet.
Financial covenantsBilateral loans are subject to specific covenants. At December 31, 2016 the Group complies with the solvency ratio, the debt/equity ratio, the debt/ebitda ratio and the interest cover ratio that were agreed upon within the contract loans.
CONSOLIDATED FINANCIAL STATEMENTSDEME — Financial information 201640

Note 13 — Finance and operating lease
Finance lease (in thousands of EUR) More than
5 yearsBetween 1 and
5 yearsLess than
1 yearTotal 2016 Total 2015
Gross lease payments 17,646 27,578 48,361 93,585 109,544
Interest payments -994 -3,015 -1,757 -5,766 -9,717
Finance lease present value 16,652 24,563 46,604 87,819 99,827
Lease payments per class of property, plant and equipment(in thousands of EUR) Total 2016 Total 2015
Land and buildings 323 358
Floating and other construction equipment 87,496 99,469
Total finance leases 87,819 99,827
Operating lease (in thousands of EUR) More than
5 yearsBetween 1 and
5 yearsLess than
1 yearTotal 2016 Total 2015
Future lease payments under non-cancellable operating leases 10,447 10,144 8,361 28,952 29,212
41

Note 14 — Employee benefit obligations
The DEME Group contributes to pension and early retirement plans in several of the countries in which it operates.These benefits are recognised in accordance with IAS 19.
Employee benefit obligations (in thousands of EUR) 2016 2015
Retirement benefit obligations 40,761 29,715
Other employee benefits 1,623 1,316
Balance at December 31 42,384 31,031
Retirement benefit obligations (in thousands of EUR) 2016 2015
Present value of wholly or partially funded obligations 179,120 113,014
Fair value of plan assets -138,359 -83,299
Net funded benefit obligation as recorded in the balance sheet 40,761 29,715
Movement of retirement benefit obligations (in thousands of EUR) 2016 2015
Balance at January 1 29,715 27,014
Charges recognised in income 2,473 3,499
Charges recognised in other comprehensive income 18,110 3,462
Contributions from employer -9,537 -4,260
Balance at December 31 40,761 29,715
Charges recognised in income
Current service cost 8,885 3,148
Past service cost (**) -6,941 -251
Interest cost 2,907 2,408
Interest income on plan assets (-) -2,378 -1,806
Total charges recognised in income 2,473 3,499
Charges recognised in other comprehensive income
Actuarial (gains)/losses 38,682 4,778
Return on plan assets (-) (excluding interest income) -20,572 -1,316
Total charges recognised in other comprehensive income 18,110 3,462
(**) In 2016, the caption ‘past service cost’ includes the impact of the curtailment effect which is a consequence from the closing of some defined-benefit plans in the Netherlands.
CONSOLIDATED FINANCIAL STATEMENTSDEME — Financial information 201642

Movement in employee benefit plan obligations and assets (in thousands of EUR) 2016 2015
Employee benefit plan obligations balance at January 1 113,014 107,407
Current service cost 8,885 3,148
Interest cost 2,907 2,408
Contributions from employees 468 442
Benefits paid to beneficiaries -4,008 -4,440
Remeasurement of liabilities resulting in actuarial gains/losses 38,683 4,780
due to changes to demographic assumptions (***) 13,492 –
due to changes to financial assumptions 22,329 3,680
due to experience adjustments 2,862 1,100
Past service cost (**) -6,941 -251
Other movements -1,131 -480
Reclassification of Belgian defined contribution plans (*) 27,243 –
Employee benefit plan obligations balance at December 31 179,120 113,014
Employee benefit plan assets balance at January 1 83,299 80,393
Return on plan assets (+) (excluding interest income) 20,572 1,316
Interest income on plan assets (+) 2,378 1,806
Contributions from employer/employees 10,005 4,702
Benefits paid to beneficiaries -4,008 -4,440
Reclassification of Belgian defined contribution plans (*) 27,229 –
Other movements -1,116 -478
Employee benefit plan assets balance at December 31 138,359 83,299
(*) According to the change in the Belgian law at year end 2015, the defined contribution plans financed by insurance companies under ‘class 21’ are accounted as defined-benefit plans. This induced also an increase of ‘service cost’ in 2016.(**) In 2016, the caption ‘past service cost’ includes the impact of the curtailment effect which is a consequence from the closing of some defined-benefit plans in the Netherlands(***) Actuarial gains and losses resulting from changes to demographic assumptions shows in 2016 the consequences of the increase in life’s expectancies and the increase of the average age of retirement.
Note 15 — Other current liabilitiesBalance at December 31
(in thousands of EUR) 2016 2015
Other current taxes 38,999 59,286
Other amounts payable 23,550 18,117
Accruals and deferred income 20,036 18,495
Other current liabilities 82,585 95,898
43
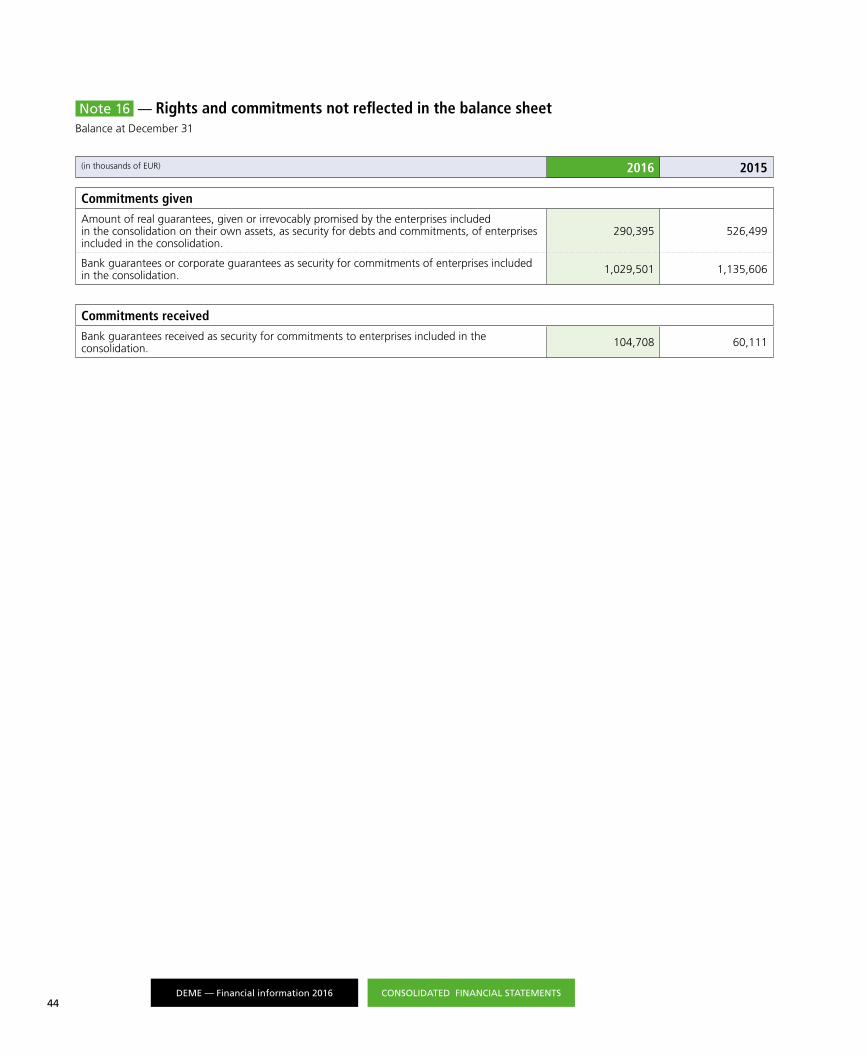
Note 16 — Rights and commitments not reflected in the balance sheetBalance at December 31
(in thousands of EUR) 2016 2015
Commitments given
Amount of real guarantees, given or irrevocably promised by the enterprises included in the consolidation on their own assets, as security for debts and commitments, of enterprises included in the consolidation.
290,395 526,499
Bank guarantees or corporate guarantees as security for commitments of enterprises included in the consolidation. 1,029,501 1,135,606
Commitments received
Bank guarantees received as security for commitments to enterprises included in the consolidation. 104,708 60,111
CONSOLIDATED FINANCIAL STATEMENTSDEME — Financial information 201644

To the board of directors
In accordance with our engagement letter dated December 6, 2016, we are pleased to report to you on the audit assignment which you have entrusted to us. This report includes our report on the consolidated financial statements. These consolidated financial statements comprise the consolidated balance sheet as at December 31, 2016, the consolidated income statement, the consolidated statement of comprehensive income, the consolidated statement of changes in equity and the consolidated statement of cash flows for the year then ended, as well as the summary of principal accounting policies and a selection of explanatory notes.
Report on the consolidated financial statements – Unqualified opinion
We have audited the consolidated financial statements of Dredging Environmental & Marine Engineering NV (“the company”) and its subsidiaries (jointly “the group”), prepared in accordance with the recognition and measurement principles of International Financial Reporting Standards as adopted by the European Union. The consolidated statement of financial position shows total assets of 3,288,676 (000) EUR and the consolidated income statement shows a consolidated profit (group share) for the year then ended of 155,334 (000) EUR.
Independent auditor’s report
DREDGING ENVIRONMENTAL & MARINE ENGINEERING NV
Statutory auditor’s report on the consolidated financial statements F O R T H E Y E A R E N D E D D E C E M B E R 3 1 , 2 0 1 6
Widening of Panama Canal Pacific Access Channel, Panama
45

Board of directors’ responsibility for the preparation of the consolidated financial statements
The board of directors is responsible for the preparation and fair presentation of consolidated financial statements in accordance with International Financial Reporting Standards (IFRS) as adopted by the European Union, and for such internal control as the board of directors determines is necessary to enable the preparation of consolidated financial statements that are free from material misstatement, whether due to fraud or error.
Statutory auditor’s responsibility
Our responsibility is to express an opinion on these consolidated financial statements based on our audit. We conducted our audit in accordance with International Standards on Auditing (ISA), as adopted in Belgium. Those standards require that we comply with ethical requirements and plan and perform the audit to obtain reasonable assurance about whether the consolidated financial statements are free from material misstatement.
An audit involves performing procedures to obtain audit evidence about the amounts and disclosures in the consolidated financial statements. The procedures selected depend on the statutory auditor’s judgment, including the assessment of the risks of material misstatement of the consolidated financial statements, whether due to fraud or error. In making those risk assessments, the statutory auditor considers internal control relevant to the group’s preparation and fair presentation of consolidated financial statements in order to design audit procedures that are appropriate in the circumstances, but not for the purpose of expressing an opinion on the effectiveness of the group’s internal control.
An audit also includes evaluating the appropriateness of accounting policies used and the reasonableness of accounting estimates made by the board of directors, as well as evaluating the overall presentation of the consolidated financial statements. We have obtained from the group’s officials and the board of directors the
explanations and information necessary for performing our audit.
We believe that the audit evidence we have obtained is sufficient and appropriate to provide a basis for our opinion.
Unqualified opinion
In our opinion, the consolidated financial statements of Dredging Environmental & Marine Engineering NV as of December 31, 2016 are prepared, in all material respects, in accordance with the recognition and measurement principles of International Financial Reporting Standards as adopted by the European Union and with the legal and regulatory requirements applicable in Belgium.
Emphasis of Matter
We draw the attention to the ‘Basis of Preparation’ note of the consolidated financial statements that details the basis of preparation of the consolidated financial statements. The consolidated financial statements are based on the recognition and measurement principles of International Financial Reporting Standards as adopted by the European Union, but do not contain all the explanatory notes required by those standards and do not constitute a complete set of financial statements established in accordance with International Financial Reporting Standards as adopted by the European Union.
Antwerp – 18.04.2017
The statutory auditor DELOITTE Bedrijfsrevisoren /
Reviseurs d’Entreprises
BV o.v.v.e. CVBA / SC s.f.d. SCRLRepresented by
Luc Van Coppenolle
CONSOLIDATED FINANCIAL STATEMENTSDEME — Financial information 201646

MeyGen offshore tidal energy project, United Kingdom
Parent company financial statementsDEME NV
IntroductionThe statutory annual accounts of Dredging Environmental & Marine Engineering NV (DEME NV) are prepared in accordance with Belgian Generally Accepted Accounting Principles. The entire version of the statutory annual
accounts of DEME NV, along with the annual report and the report of the statutory auditor, will be deposited within the legal time frame at the National Bank of Belgium and can be obtained for free through the website of the company (www.deme-group.com).
The statutory auditor has issued an unqualified auditor’s report on the statutory annual accounts of DEME NV.
47

DEME NV
Balance sheetA S O F D E C E M B E R 3 1 ( A C C O R D I N G T O B E L G I A N G A A P )
(in thousands of EUR) 2016 2015
AssetsFIXED ASSETS 351,532 351,628
Formation expenses 147 220
Intangible assets 682 1,098
Property, plant and equipment 35,516 19,774
Land and buildings – –
Plant, machinery and equipment 1,224 1,702
Furniture and vehicles – –
Leasing and other similar rights – –
Other tangible fixed assets – –
Assets under construction and advance payments 34,292 18,072
Financial assets 315,187 330,536
Affiliated enterprises 308,466 326,514
Participating interests 277,884 296,882
Amounts receivable 30,582 29,632
Other enterprises linked by participating interests 6,699 4,000
Participating interests 6,699 4,000
Amounts receivable – –
Other financial assets 22 22
Shares 22 22
Amount receivable and cash guarantees
CURRENT ASSETS 168,000 165,832
Amounts receivable after more than one year 149,000 151,177
Trade receivables – –
Other amounts receivable 149,000 151,177
Inventories and contracts in progress – –
Amounts receivable within one year 18,888 14,592
Trade receivables 13,961 9,533
Other amounts receivable 4,927 5,059
Own shares and other investments – –
Cash at bank and in hand 112 60
Deferred charges and accrued income – 3
TOTAL ASSETS 519,532 517,460
PARENT COMPANY FINANCIAL STATEMENTSDEME — Financial information 201648

DEME NV
Balance sheetA S O F D E C E M B E R 3 1 ( A C C O R D I N G T O B E L G I A N G A A P )
(in thousands of EUR) 2016 2015
LiabilitiesCAPITAL AND RESERVES 155,649 189,169
Capital 31,110 31,110
Issued capital 31,110 31,110
Uncalled capital (-) – –
Share premium account 5,645 5,645
Revaluation surplus – –
Reserves 35,644 35,697
Legal reserves 3,111 3,111
Reserves not available for distribution – –
Untaxed reserves 29,262 29,315
Reserves available for distribution 3,271 3,271
Profit carried forward 83,251 116,718
PROVISIONS AND DEFERRED TAXES 175 202
Provisions for liabilities and charges – –
Deferred tax liabilities 175 202
CREDITORS 363,708 328,089
Amounts payable after more than one year 221,393 200,000
Financial liabilities 221,393 200,000
Subordinated loans – –
Bond 200,000 200,000
Finance leases – –
Credit institutions – –
Other long term financial liabilities 21,393 –
Amounts payable within one year 135,002 120,776
Current portion of amounts payable after more than one year 6,435 –
Financial liabilities – –
Credit institutions – –
Other current financial liabilities – –
Trade payables 17,423 5,099
Advances received on contracts in progress – –
Taxes, remuneration and social security 262 712
Taxes – 286
Remuneration and social security 262 426
Other amounts payable 110,882 114,965
Accrued charges and deferred income 7,313 7,313
TOTAL LIABILITIES 519,532 517,460
49
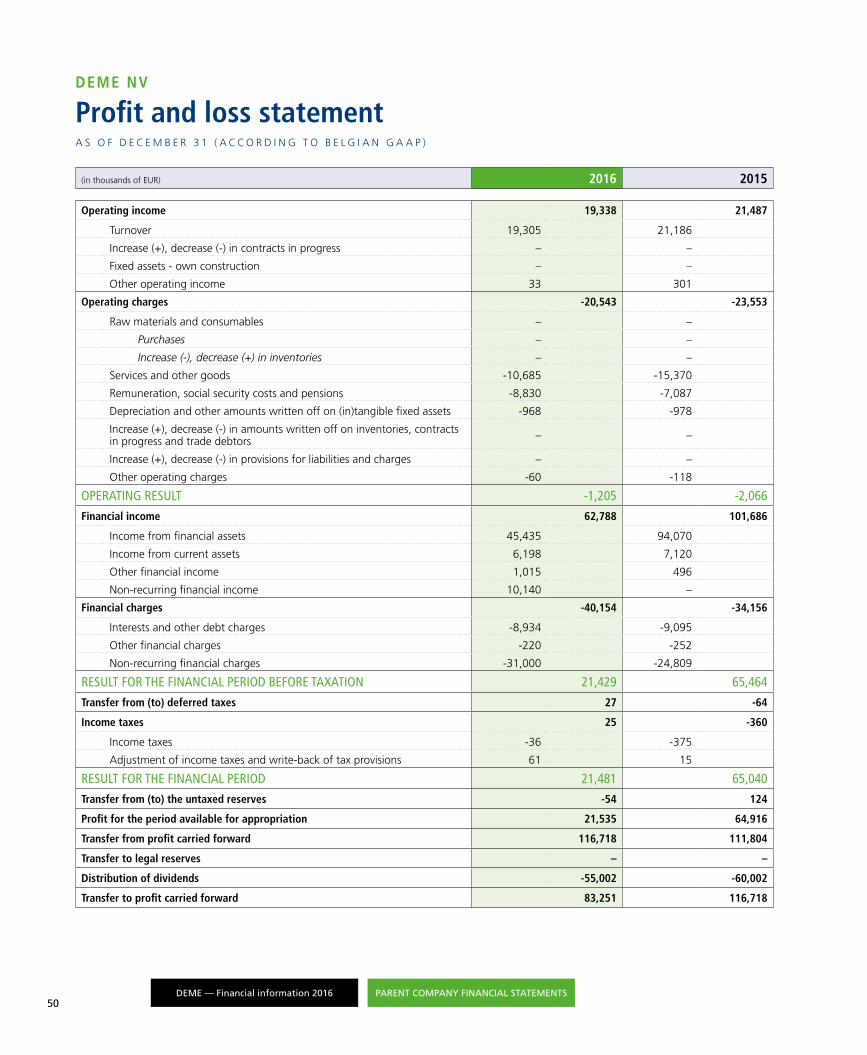
DEME NV
Profit and loss statementA S O F D E C E M B E R 3 1 ( A C C O R D I N G T O B E L G I A N G A A P )
(in thousands of EUR) 2016 2015
Operating income 19,338 21,487
Turnover 19,305 21,186
Increase (+), decrease (-) in contracts in progress – –
Fixed assets - own construction – –
Other operating income 33 301
Operating charges -20,543 -23,553
Raw materials and consumables – –
Purchases – –
Increase (-), decrease (+) in inventories – –
Services and other goods -10,685 -15,370
Remuneration, social security costs and pensions -8,830 -7,087
Depreciation and other amounts written off on (in)tangible fixed assets -968 -978
Increase (+), decrease (-) in amounts written off on inventories, contracts in progress and trade debtors – –
Increase (+), decrease (-) in provisions for liabilities and charges – –
Other operating charges -60 -118
OPERATING RESULT -1,205 -2,066
Financial income 62,788 101,686
Income from financial assets 45,435 94,070
Income from current assets 6,198 7,120
Other financial income 1,015 496
Non-recurring financial income 10,140 –
Financial charges -40,154 -34,156
Interests and other debt charges -8,934 -9,095
Other financial charges -220 -252
Non-recurring financial charges -31,000 -24,809
RESULT FOR THE FINANCIAL PERIOD BEFORE TAXATION 21,429 65,464
Transfer from (to) deferred taxes 27 -64
Income taxes 25 -360
Income taxes -36 -375
Adjustment of income taxes and write-back of tax provisions 61 15
RESULT FOR THE FINANCIAL PERIOD 21,481 65,040
Transfer from (to) the untaxed reserves -54 124
Profit for the period available for appropriation 21,535 64,916
Transfer from profit carried forward 116,718 111,804
Transfer to legal reserves – –
Distribution of dividends -55,002 -60,002
Transfer to profit carried forward 83,251 116,718
PARENT COMPANY FINANCIAL STATEMENTSDEME — Financial information 201650

COMPLIED AND COORDINATED BY DEMEFinance DepartmentInternal & External Communication
FINAL EDITINGHilde Vermeire & Els Verbraecken
DESIGN AND REALISATIONComfi
PHOTOSWe wish to thank all members of our personnel who provided us with pictures of the works. Special thanks to photographers Tom D’Haenens, Colin Turner and Ulrich Wirrwa.

Haven 1025, Scheldedijk 30
2070 Zwijndrecht - BELGIUM
+32 3 250 52 11
www.deme-group.com