Embed Size (px)
Citation preview

1
British Cohort Study
2004 Follow Up
Guide to
Child Assessment Data
Samantha Parsons
First Edition
November 2006
Centre for Longitudinal Studies Bedford Group for Lifecourse & Statistical Studies
Institute of Education, University of London

2
Contents
Background.............................................................................................................................................3 Introduction to the British Ability Scales II.........................................................................................4
Selection of particular subscales..........................................................................................................5 Table 1 - Selected BAS II subscales................................................................................................................6
Adapting BAS II for Interviewer Administration ................................................................................6 Interviewer Materials...........................................................................................................................6 How many children did the assessments?............................................................................................7 BAS II Early Years assessments..........................................................................................................7
Naming Vocabulary................................................................................................................................8 Rules and administration .....................................................................................................................8
Fig. 1 - BAS II Naming Vocabulary Image and CAPI Screen ........................................................................ 9 Fig. 2 - Distribution of ability scores for children completing the BAS Naming Vocabulary exercise ......... 10 Fig 3 - Comparing BCS70 cohort members’ children’s average ability scores in the BAS II Naming Vocabulary scale with BAS II age-equivalent ability scores......................................................................... 11
Early Number Concepts.......................................................................................................................12 Rules and administration ...................................................................................................................12
Fig. 4 - BAS II Early Number Concepts Image............................................................................................. 13 Fig. 5 - Distribution of ability scores for children completing the BAS II Early Number Concepts exercise14 Fig. 6 - Comparing BCS70 cohort members’ children’s average ability scores in the BAS II Early Number Concepts scale with BAS II age-equivalent ability scores............................................................................. 15
Copying .................................................................................................................................................15 Rules and administration ...................................................................................................................15
Fig. 7 - Example of a Completed Copying Booklet....................................................................................... 16 BAS II School Age Assessments ..........................................................................................................17
Introduction .......................................................................................................................................17 Word Reading....................................................................................................................................17
Rules and administration ............................................................................................................................... 17 Fig. 8 - BAS II Word Reading List ............................................................................................................... 18 Fig. 9 - Distribution of ability scores for children completing the BAS II Word Reading exercise .............. 19 Fig. 10 - Comparing BCS70 cohort members’ children’s average ability scores in the BAS II Word Reading scale with BAS II age-equivalent ability scores ............................................................................................ 21
Spelling..............................................................................................................................................21 Rules and administration ............................................................................................................................... 21 Fig. 11 - Revised BAS Spelling Exercise ...................................................................................................... 23 Fig. 12 - Distribution of (rescaled) raw scores for children completing the revised BAS Spelling exercise, by age ................................................................................................................................................................. 24 Fig. 13 - Average (rescaled) raw scores for children completing the revised BAS Spelling exercise, by age....................................................................................................................................................................... 25
Number Skills ....................................................................................................................................25 Rules and administration ............................................................................................................................... 25 Fig. 14 - Examples of modified BAS II formats............................................................................................ 26 Fig. 15 - Distribution of ability scores for children completing the BAS Number Skills exercise ................ 27 Fig. 16 - Comparing BCS70 cohort members’ children’s average ability scores in the BAS II Number Skills scale with BAS II age-equivalent ability scores ............................................................................................ 28
Appendix A1 - Naming Vocabulary....................................................................................................29 Appendix A2 - Early Number Concepts.............................................................................................30 Appendix A3 - Copying Task ..............................................................................................................32
Scoring the Copying task .............................................................................................................................. 32 Appendix A4 - Word Reading .............................................................................................................33 Appendix A5 - Spelling (revised).........................................................................................................34 Appendix A6 - Number Skills..............................................................................................................35

3
Background In the BCS70 2004 survey, information was gathered on a representative sample of cohort members and their resident natural or adopted children including assessment of the children’s cognitive skills. This element of the 2004 survey was the Parent and Child Survey1. This document provides details and background information on the individual assessments that children of different ages completed. The Parent and Child Survey largely replicated a similar intergenerational study, the ‘Mother and Child Survey’, which was carried out in 1991 on a representative sample of the National Child Development Study (NCDS) cohort, when they were age 33. The comparable age of the BCS70 cohort in 2004 (34) to that of the NCDS cohort in 1991 (33) offered the opportunity to compare cognitive development at similar parental ages across the twelve years separating the births of the two cohorts. This identified the first of a number of requirements for the BCS70 child assessments: cognitive development measures comparable to those used in the NCDS age 33 survey;
• continuity from, and comparability with, the assessment of cohort members’ own cognitive development and educational performance when they were children, and with the measures of their adult literacy and numeracy;
• applicability across the full anticipated age range expected for the cohort members’ children. This and other attributes of the children could only be effectively established by the interviewer when arranging the main interview;
• ability to be administered in the twenty minutes available for each child’s assessment in the survey. (This was partly on the grounds of survey cost and partly on the grounds of minimising ‘respondent burden’.)
The British Ability Scales Second Edition (BAS II) was found to be the most appropriate instrument to meet the survey’s purposes and was adopted2. The main reasons were as follows.
1 In addition to the CAPI and CASI interview that all 9665 cohort members completed, the 2004 Survey also assessed their literacy and numeracy skills. This part of the survey was funded through the UK Government’s Skills for Life strategy, and the research programme of the National Research and Development Centre for adult literacy and numeracy (NRDC) that was set up to support it. Additional funding secured from the European Social Fund (ESF) by NRDC in turn funded all components of the ‘Parent and Child Survey’. 2 Other assessments considered were The Stanford-Binet intelligence scale: Terman, L. M. and Merrill, M. A. (l96l). Stanford-Binet Intelligence Scale, 3rd ed. Harrap. The Wechsler pre-school and primary scale of intelligence: Wechsler, D. (1999). Wechsler Abbreviated Scale of Intelligence (WASI). Psychological Corporation, U.K. Wechsler, D. (1976). Wechsler Intelligence Scale for Children - Revised (WISC-R). NFER-NELSON, 2nd (British) ed. The Snijders-Oomen non-verbal intelligence scales: Snijders, J. Th. and Snijders-Oomen, N. (c. 1987). Snijders-Oomen Non-Verbal Intelligence Scale. Netherlands: Wolters-Noordhoff. Ages 2:6 - 7 years. Snijders, J. Th., Tellegen, P. J. and Laros J. A. (1989, 1996). Snijders-Oomen Non-Verbal Intelligence Scale (SON-R). Netherlands: Walters-Noordhoff (Manual) and Swets and Zeitlinger.Ages: 5.6 years to 17 years. The Peabody Individual Achievement Test (PIAT) and the Peabody Picture Vocabulary Test - Revised (PPVT-R): Dunn, L. and Dunn, L (1981) PPVT-R Manual. Circle Pines, MN: American Guidance Service. Dunn, L and Markwardt, Jr. C. (1970) Peabody Individual Achievement Test Manual. Circle Pines, MN: American Guidance Service. The Bracken test: Bracken, B. A. (1998). Bracken Basic Concept Scale – Revised (BBCS-R). Psychological Corporation.

4
Using the BAS II would offer intergenerational comparison opportunities as BCS70 cohort members were assessed using aspects of the BAS in 1980, when age 10. MCS3 cohort members were assessed with an individual BAS II scale when 3 years old. BAS II contains modules designed to capture a measure of a child’s literacy and numeracy development. By using such subscales, the extent to which education and skills problems and attainments are repeated across the generations within families and the modifying influences on them could be investigated, in line with the Skills for Life Survey BAS II was among the few major assessment tools available that offered assessment of children aged 3 to16 years. Appropriate BAS II scales were estimated to take 20 minutes (on average) to complete. This was in line with the project requirements to minimise burden on the children and with the overall time the interviewer had available to spend in the household.
Introduction to the British Ability Scales II The British Ability Scales Second Edition (BAS II) is a battery of individually administered tests of cognitive abilities and educational achievement, published by the NFER-NELSON Publishing Company Ltd4. The BAS II consists of two elements: the cognitive element and the achievement element. It is suitable for use with children and adolescents aged from 2 years, 6 months (2:6) to 17 years, 11 months (17:11), and is organised into two age-specific batteries: the Early Years Battery for pre-school children and the School Years Battery for children of school age. The Early Years Battery is composed entirely of cognitive scales and is generally used for children under 6:0 years old (but can be used for children from 6:0 to 7:11 years who will have difficulty with the School Age Battery). Several of the subscales 3 Millennium Cohort Study (MCS) is the fourth British cohort study, which began collecting information on more than 18,000 babies born over a 12 month period from September 2000. 4 The initial research that led to the publication of the original BAS in 1979 started in 1965, and has developed fairly continuously since. A revised version, the BAS-R, was published in 1983. The battery of individual scales that make up the BAS II, published in 1997, therefore has more than 30 years of development behind it. The BAS was initially developed to provide professionals in a number of different clinical settings, and who assessed children with a wide range of learning and developmental needs, with a tool that gave information at a finer yet broader level of detail than could be attained from an IQ score. As such, various theoretical perspectives have been drawn on and accommodated in the development of BAS II. However, educational application remains the principal goal of BAS II, primarily to evaluate children who, in the broadest sense, demonstrate learning difficulties. The battery of individual scales that make up the BAS II objectively, reliably and economically measure a child’s strengths and weaknesses, providing a comprehensive assessment of their current intellectual functioning and basic educational progress. Generalisation is the key feature upon which all tests are based. Much of human behaviour is not specific to a particular setting and more lasting and general characteristics of a child can therefore be interpreted from an achieved score in an individual test. For example, vocabulary testing is an index of general language skills.

5
can be used from age 2:6 upwards; others start from age 3:0, 3:6 or 4:0. These scales use appealing artwork and manipulable objects to assess reasoning, perception and memory, together with an understanding of basic quantitative concepts. The School Years Battery comprises both cognitive and achievement scales that have been normed from 5:0 to 17:11 years (some of the scales will prove demanding for 5 and 6 year olds). The cognitive scales have been designed to assess reasoning, perception, processing speed and memory, using verbal, numerical and figurative materials. The achievement element comprises scales measuring word reading, spelling and number skills.
Selection of particular subscales To complement the assessment of cohort members’ literacy and numeracy skills which had also been funded by NRDC and the UK Government’s Skills for Life strategy, it was necessary to use subscales that supplied a measure (direct or indirect) of a child’s literacy and numeracy. After consultation with experts from the London Institute of Education and NFER-NELSON, the ‘Naming Vocabulary’ and ‘Early Number Concepts’ tests were selected from the Early Years Battery for children age 3:0 to 5:11. For children age 6:0 to 16:11 the achievement element of the School Years Battery was selected, ie, Word Reading, Spelling and Number Skills subscales. In addition, younger children (age 3:0 to 5:11) also completed the ‘Copying Designs’ task that had been used previously in BCS705. The abilities measured by all these assessments or scales are detailed in Table 1. A problem to bear in mind with the selected assessments is their datedness. As the BAS II was last revised in 1997, some of the images and pictures included in the Early Years Battery are showing their age. A picture of a telephone looks particularly outmoded. Some of the children in the survey will have only ever seen a mobile phone, not a push-button landline. Perhaps of more concern is the inability of such an assessment to keep pace with the (evolving) national curriculum. This was particularly apparent for the Number Skills scale of the School Years Battery. However, a definite advantage of using the BAS II scales is that these tests have been widely used and scores have been standardised on large populations. This means that the results obtained in the BCS70 follow-up survey can be benchmarked, and if necessary standardised, against the BAS test norms.
5 Copying skills are a strong predictor of literacy and numeracy competence in adult life (see Bynner and Steedman, 1994; Parsons and Bynner, 1998). For the assessment itself see: Osborn, A.F., Butler, N. R. and Morris, A. C. (1984). The Social Life of Britain’s Five Year Olds. A report of the Child Health and Education Study. London: Routledge and Kegan Paul.

6
Table 1 - Selected BAS II subscales Age 3:0 to 5:11 years (Early Years Battery) Scale Abilities measured Naming Vocabulary Expressive language; knowledge of names Early Number Concepts Knowledge of, and problem-solving using, pre-
numerical and numerical concepts Copying* (not a BAS II subscale)
Visual-perceptual matching and fine-motor coordination in copying line drawings
Age 6:0 to 16:11 years (School Years Battery) Scale Abilities measured Number Skills Recognition of printed numbers and performance of
arithmetic operations Spelling Knowledge and recall of spellings Word Reading Recognition (decoding) of printed words
Adapting BAS II for Interviewer Administration The standard BAS II is designed to be administered, scored and interpreted by people with a relevant psychology background, with formal training in the individual administration and interpretation of cognitive test batteries for children and adolescents of the age range covered by this test. The goal of the BAS II is to obtain an accurate score by administering a sufficient number of items appropriate for the child’s level of developmental ability. Items that are moderately difficult for the child provide the most information about his / her ability; little is learned from administering items that prove extremely easy or extremely difficult. Children of different ages therefore usually start and stop at different points on each scale. These starting and stopping points are flexible rather than fixed, in response to a child’s performance. The administration of each scale is therefore not straightforward. To minimise the number of decisions interviewers had to make in response to a child’s performance, the ‘rules’ of each selected scale were programmed into CAPI. The interviewers coded a child’s answer as (usually) correct or incorrect and then the CAPI directed the interviewer to the next question suited to the child’s level of ability. In this way, the interviewer could concentrate on a child’s performance, which made the experience present less like a ‘test’ to the child, while being assured that the standard BAS II instructions were followed.
Interviewer Materials As only two scales from the Early Years and three scales from the School Age batteries were administered with the aid of CAPI, standard BAS II stimuli and interviewer recording booklets needed to be revised.

7
For young children, new stimulus booklets used for the Naming Vocabulary and the Early Number Concepts scale were produced. Additional material included sets of green tiles for the Early Number Concepts scale and specially produced answer booklets for the Copying scale (see Appendix 1). For older children, specially produced answer booklets for all three scales administered (see Appendix 2).
How many children did the assessments? Of the 5207 children about whom cohort members provided information in the Parent and Child interview:
• 25.5% (1326) were aged between 0 and 2:11 years and were not eligible for assessment;
• 26.1% (1359) were aged between 3 and 5:11 years and were eligible for two BAS Early Years assessments and the Copying Designs assessment. Of the 1359, 92% (1249) completed at least one of the three assessments. Four year olds were slightly less likely (89%) to have participated.
• 48.4% (2522) were aged between 6 and 16:11 years and were eligible for three BAS School Age assessments. Of the 2522, 89% (2248) completed at least one of these assessments. Unsurprisingly, 15 and 16 year olds were the least likely to have taken part (77%).
BAS II Early Years assessments The two BAS II assessments were completed by 1359 children aged between 3 and 5:11 years. Raw scores are constructed from answers given to each individual question attempted6. As children take different sets of items, their raw scores on a scale cannot be compared directly. Raw scores are converted to an ability score, which is an estimate of a child’s level on the ability being measured by an individual scale. The ability score reflects both the raw score and the difficulty of the items being administered. A given raw score on a set of easy items (suitable for younger children) will yield a lower ability score than will the same raw score on a set of more difficult items (suitable for older children). The ability scores for each scale start with a value of 10, which reflects a raw score of 0 on the easiest possible set of items in a scale. The upper limit of ability scores varies from scale to scale; consequently comparing ability scores across them is not meaningful. We show the average ability scores for children in the 2004 survey by age and compare these with the age-equivalent ability scores provided in the BAS II Administration and Scoring Manual (Figures 3 and 6). In line with the BAS II, the youngest children had the lowest mean (average) scores and the oldest children had the highest mean (average) scores in both the Naming Vocabulary and Early Number Concepts exercise. Although lower than the correlation between the adult multiple-choice literacy and numeracy scores, even after controlling for age, a reasonably strong correlation between performance in the two BAS exercises (0.44, p<.001) was found. 6 Individual variables and derived total score variables are listed in the Appendix.

8
Naming Vocabulary
Rules and administration For this exercise, the child was shown a series of pictures presented in the stimulus booklet and asked to say what it was, e.g. a picture of a shoe, chair or pair of scissors. There were 36 pictures in total, but the number of items a child answered depended on his / her performance. There were different starting and stopping points dependent upon age and performance, but on the whole, the better they did, the more items they were administered (detailed instructions are provided in Appendix A3). Interviewers could not provide anything but neutral encouragement to a child during the task, except for the first two items administered. These were ‘teaching’ items. The interviewer provided specific feedback, i.e., ‘yes, that’s right’, etc, but also gave the correct response if the child had not answered correctly or had not understood the question. All alternative answers a child might give that were included in the BAS II manual were also presented for interviewers on the CAPI screen. Figure 1 gives an example of a Naming Vocabulary image and accompanying CAPI screen. In this exercise a child’s answer was either
• ‘correct’ – the standard name of the pictured object, e.g. ’shoe’ • ‘acceptable’ – responses other than the standard name of a pictured object,
such as overly specific names, e.g. ‘trout’ for ‘fish’ • ‘incorrect (probe further)’ - such responses included the description of the
function, materials or parts of the object pictured (e.g. ‘put on your foot’ for ‘shoe’), too general responses (e.g. ‘animal’ for ‘horse’) and names of related objects (e.g. ‘stool’ instead of ‘chair’)
• ‘incorrect (other)’ – responses that were just plain wrong, e.g. ‘tree’ for ‘shoe’. Interviewers had to write the child’s response into the CAPI verbatim.

9
Fig. 1 - BAS II Naming Vocabulary Image and CAPI Screen7
Figure 2 shows the distribution of children’s scores for each age group from 3 to 5 years. As we can see, the distribution of the scores in each age group is roughly ‘normal’, with the ‘bell’ of the distributions incorporating higher scores as the children’s average age increases. The exercise successfully distinguished between children with different capabilities as revealed by the test, providing opportunities to compare them.
7 © nferNelson. This example from the BAS II Naming Vocabulary Scale has been reproduced with the kind permission of nferNelson.

10
Fig. 2 - Distribution of ability scores for children completing the BAS Naming Vocabulary exercise
0
10
20
30
40
10 20 30 40 50 60 70 80 90 100
110
120
130
140
150
150+
Naming Vocabulary Ability Score
Perc
ent
All age 3 age 4 age 5
In the BAS II Administration and Scoring Manual age-equivalent ability scores for children age 3, 4 or 5 years are spaced at three-month intervals. For example, for children age 3 years these are:
3:1 (for children age 3 years 0 months to 3 years 2 months); 3:4 (for children age 3 years 3 months to 3 years 5 months); 3:7 (for children age 3 years 6 months to 3 years 8 months); 3:10 (for children age 3 years 9 months to 3 years 11 months).

11
To be able to compare ability scores achieved by the children of cohort members with BAS II age-equivalent ability scores, we grouped the children of cohort members in accordance with these age groups. In Figure 3 we can see that average scores in the Naming Vocabulary scale increased with age and that cohort members’ children had marginally higher scores than the BAS II age-equivalents8 in every age group (bar the very youngest). This reflects the fact that these younger children of cohort members had older and, most likely, more educated parents than the average 3 to 5:11 year old in the wider population.
Fig 3 - Comparing BCS70 cohort members’ children’s average ability scores in the BAS II Naming Vocabulary scale with BAS II age-equivalent ability scores
50
70
90
110
130
150
3.1 3.4 3.7 3.10 4.1 4.4 4.7 4.10 5.1 5.4 5.7 5.10Age Group (years + months)
Ave
rage
BA
S A
bilty
Sco
re
BCS70 2004 BAS Age Equivalent Scores
8 It is usual that, for each age group, the BAS II age-equivalent ability scores fell across a narrow score range. For example, for children in the age group 3:7, the age-equivalent ability score range for the Naming Vocabulary scale was 82-84 and, for the Early Number Concepts scale, 95-100. The mid-point of each score range was plotted in all figures. See Table 5.7 on page 477-78 of the BAS II Administration and Scoring Manual.

12
Early Number Concepts
Rules and administration For this exercise, the child answered questions about number, size, or other numerical concepts. Stimuli used for the exercises included ten green plastic tiles and a series of pictures presented in the same easel as for the Naming Vocabulary scale. There were 30 questions in total, but there was no standard number of items for a child to try and answer. As for Naming Vocabulary, there were different starting and stopping points dependent upon age and performance (see Appendix A4). A number of questions were asked for each of the pictures. For example, three questions went with the ‘ladybirds’ displayed in Figure 4. The interviewer would indicate the yellow ladybirds, point to one in particular, and then ask the child to point to all of the red ladybirds that had the same number of spots as the particular yellow one, i.e. two, four or six spots. Interviewers could not provide anything but neutral encouragement to a child during the task, except for the designated teaching items where the interviewer provided specific feedback, e.g. ‘yes, that’s right’, etc, but they also gave the correct response if the child had not answered correctly or had not understood the question. For this exercise, interviewers had to code a child’s answer as 1 ’correct’, and 2 ‘incorrect’ on the CAPI screen. (The exception to this was Item 3, as detailed in Appendix A4).

13
Fig. 4 - BAS II Early Number Concepts Image9
Figure 5 shows the distribution of scores for children in each age group taking part in the main survey. As found with the Naming Vocabulary scores, the distribution of the scores in each age group is roughly ‘normal’. The exercise successfully distinguished between children with different abilities as revealed by the test, providing opportunities to compare those with high and low ability scores. 9 © nferNelson. This example from the BAS II Early Number Concepts Scale has been reproduced with the kind permission of nferNelson.
14
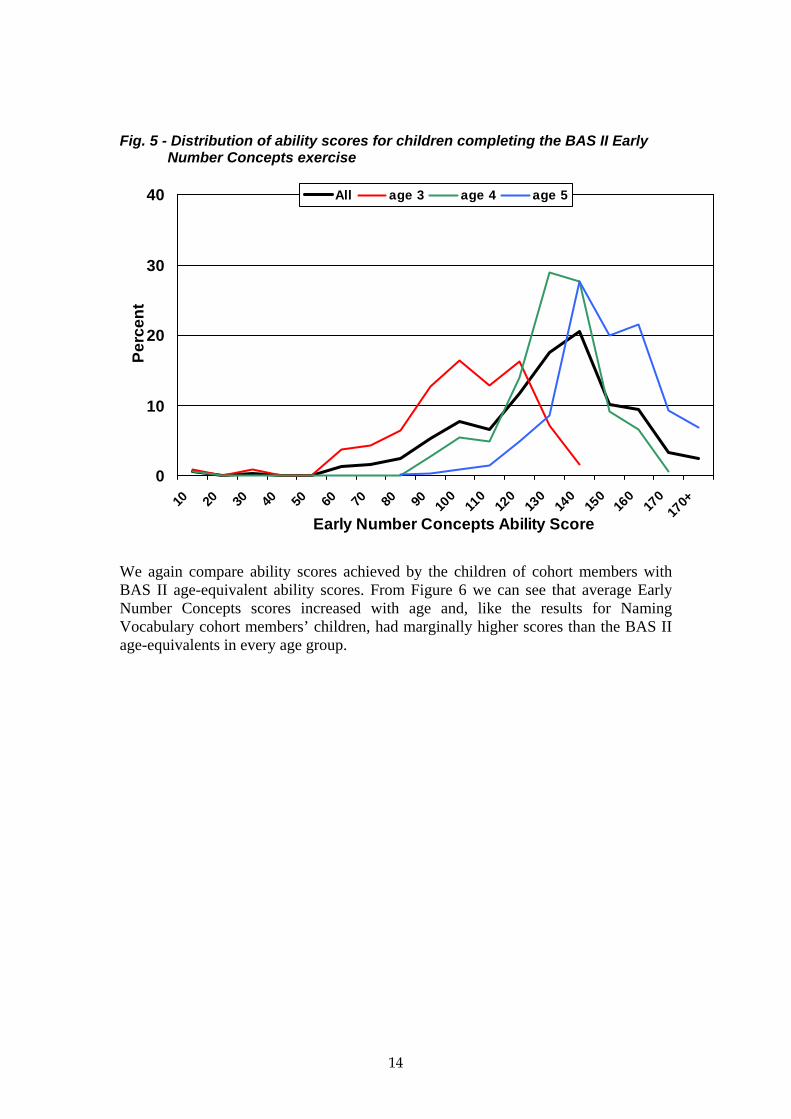
Fig. 5 - Distribution of ability scores for children completing the BAS II Early Number Concepts exercise
0
10
20
30
40
10 20 30 40 50 60 70 80 90 100
110
120
130
140
150
160
170
170+
Early Number Concepts Ability Score
Perc
ent
All age 3 age 4 age 5
We again compare ability scores achieved by the children of cohort members with BAS II age-equivalent ability scores. From Figure 6 we can see that average Early Number Concepts scores increased with age and, like the results for Naming Vocabulary cohort members’ children, had marginally higher scores than the BAS II age-equivalents in every age group.

15
Fig. 6 - Comparing BCS70 cohort members’ children’s average ability scores in the BAS II Early Number Concepts scale with BAS II age-equivalent ability scores
60
80
100
120
140
160
3.1 3.4 3.7 3.10 4.1 4.4 4.7 4.10 5.1 5.4 5.7 5.10Age Group (years + months)
Ave
rage
BA
S A
bilty
Sco
re
BCS70 2004 BAS Age Equivalent Scores
Copying
Rules and administration In this exercise, the Copying Designs task used previously in BCS7010, a child had to copy eight drawings twice on two consecutive pages of a specially produced booklet. Figure 7 shows a completed booklet (the designs that the child had to copy are in the left hand column of each page). The instructions for this task appeared on the CAPI; the interviewers were directed to point to each design in turn and ask the child ‘see if you can make one just like this – here’, at the same time pointing to the space beside the design. There were no discontinuation rules, interviewers were asked to encourage the child to attempt all eight designs, but should stop if the child was distressed or if he / she stopped attempting to copy. Details of how performance is scored are given in Appendix A5.
10 Osborn, A.F., Butler, N. R. and Morris, A. C. (1984). The Social Life of Britain’s Five Year Olds. A report of the Child Health and Education Study. London: Routledge and Kegan Paul.

16
Fig. 7 - Example of a Completed Copying Booklet First page Second page
17
BAS II School Age Assessments
Introduction These three assessments were completed by 2248 children aged between 6 and 16:11 years. As for the younger children, to be able to compare performance of children of different ages with BAS average age-equivalent ability scores, raw scores were converted into ability scores (Figures 10 and 16). However, as the Spelling exercise was modified, this comparison was not possible (details of the revisions made to the Spelling assessment are provided on page 23). However, as children of different ages were required to spell a different number of words and to enable comparison of these scores, they were re-scaled so that all fell within the range 0 to 100. For example, if a child spelt ten out of 20 words correctly, the revised score would be 50 out of 100. In both Reading and Number Skills the youngest children (age 6) had the lowest mean scores. The oldest children (age 15 to 16) had the highest mean Reading scores but, in the Number Skills task, children age 14 recorded the best performance. In the revised Spelling task, performance was minimally related to age. Even when age was controlled, there was a strong correlation between performance in the Reading and Spelling exercises (0.76, p<.001) that was larger than the correlation between the Reading and Number Skills tasks (0.58, p<.001). Correlations were lower again between performances in the Spelling and Number Skills tasks (0.48). Interestingly, the relationship between ‘literacy’ and ‘numeracy’ skills (as shown by the correlation coefficients) was stronger for the school age children (0.58) than for the younger children (0.44), but slightly lower than for literacy and numeracy recorded for their parents (0.64). For the exercises in the School Age Battery for older children, no teaching items were included and no interviewer feedback, other than neutral encouragement, was allowed. The order in which the three scales were administered was: Word Reading, Spelling and Number Skills.
Word Reading
Rules and administration In this exercise, the child read aloud a series of words presented on a card. The child had to correctly pronounce words within locally accepted standards, with emphasis on the correct syllable or syllables. There were 90 words on the card, arranged in 9 blocks of 10 words each, but there was no standard number a child had to answer – the total number read out by the child depended on his / her performance. On the whole, the better they did the more words they read (see Appendix A6 for full details of starting and stopping points).

18
Instead of using a separate show card, the list of words to be read was included in the specially designed booklet. The format of the words to be read, i.e., font type, font size, setting, etc, was as close to the standard BAS II format as possible, as shown in Figure 8.
Fig. 8 - BAS II Word Reading List11
For the interviewers, the CAPI screen showed each of the words the child was to read out in turn. As in the original BAS II interviewer booklet, the screen included a 11 © nferNelson. The Word Reading card has been reproduced in its entirety with the kind permission of nferNelson.

19
phonetic pronunciation of the word. The symbol ‘/’ and ‘//’ within words was used to indicate individual phonemes and syllables, respectively, with the accented syllables in bold. For example,
cup k/uh/p
light l/iy/t
chaos k/ay//os
Interviewers had the option to code the word as 1 ‘correct’ or 2 ‘incorrect’. As stated, words read with a regional accent or any type of speech impediment, e.g. a lisp, was coded as correct. Whether the child understood the word or had seen it before did not matter in terms of coding a correct or incorrect pronunciation. However, the word was to be coded as correct only if the child read the word fluently, i.e., it was not just broken down into separate syllables / constituent parts. Figure 9 shows the distribution of scores by each age group for the children of BCS70 cohort members between age 6:0 and 16:11 years taking part in the main fieldwork. For each age band, the distribution is normal, though forming a wider ‘bell’ shape than the scores provided by the younger children.
Fig. 9 - Distribution of ability scores for children completing the BAS II Word Reading exercise
0
10
20
30
40
20 40 60 80 100 120 140 160 180 200 200+Word Reading Ability Score
Perc
ent
All age 6-7 age 8-9 age 10-11 age 12-13 age 14-16
In the BAS II Administration and Scoring Manual the age-equivalent ability scores for children age 6 and 7 are spaced at three-month intervals (as for the Early Years Scales) and the age-equivalent ability scores for children age 8 to 16 are spaced at six-month intervals. For example, for children age 10 years these are:

20
10:3 (for children age 10 years 0 months to10 years 5 months): 10:9 (for children age 10 years 6 months to 10 years 11 months).
To be able to compare ability scores achieved by the children of cohort members with BAS II age-equivalent ability scores (as for the children who completed the two scales from the Early Years Battery of assessments), we grouped the children of cohort members in accordance with these age groups. In Figure 10 we can see that the average scores increased with age, but that differences between average scores achieved by cohort members’ children and the BAS II age-equivalents reversed as the age of the children increased. For younger children, those aged between 6 and 9, cohort members’ children had higher average ability scores than the BAS II age-equivalents, whereas for older children, those aged between 12 and 16, cohort members’ children had lower average scores than the BAS II age-equivalents. However, less confidence and reliability can be attached to the performance of older children as there were fewer than 200 children in each age group from age 12, dropping to just over 70 children at age 15 or 1612. It was only for children around age 10 or 11 that scores were nearly identical to the mid-point of the expected range of the BAS II age-equivalent scores13. These results suggest that our sample of children is not biased, but rather reflect the fact that older children in our sample are a product of young motherhood, and young mothers are more likely to have less education and associated qualifications – hence the reduction in the older children’s test scores.
12 For further details see…….. 13 It is usual that for each age group the BAS II age-equivalent ability scores fell across a narrow score range. For example, for children in the age group 10.3, the age-equivalent ability score range for the Word Reading scale was 139-143 and, for the Number Skills scale, 112-119. The mid-point of each score range was plotted in all figures. See Table 5.7 on page 478 of the BAS II Administration and Scoring Manual.

21
Fig. 10 - Comparing BCS70 cohort members’ children’s average ability scores in the BAS II Word Reading scale with BAS II age-equivalent ability scores
60
80
100
120
140
160
180
200
6.1 6.4 6.7 6.10 7.1 7.4 7.7 7.1
0 8.3 8.9 9.3 9.9 10.3
10.9
11.3
11.9
12.3
12.9
13.3
13.9
14.3
14.9
15.3
15.9
16.3
16.9
Age Group (years + months)
Ave
rage
BAS
Abi
lty S
core
BCS70 2004 BAS Age Equivalent Scores
Spelling
Rules and administration The original BAS II Spelling exercise was modified following interviewer feedback from the pilot survey14. In the original exercise, there were 75 words in total, arranged in eight blocks of ten words and one block of five words; the interviewer administered full blocks to the child. There was no standard number of blocks for a child to complete – the number of items the child had to answer depended on his / her modify the BAS II exercise so that all children within a defined age band received a fixed number of words. The first step involved reducing the total number of words in the revised assessment by half: the first five words within each block of ten were selected, three words from the final block of five. In order to minimise stress and to avoid disappointment if too many words were failed, a stopping rule of five failures in a row was applied. After attempting to spell a word, a child read out their answer to the interviewer who then entered ‘correct or ‘incorrect’ into the CAPI and could apply stopping rules when / if necessary. Figure 11 displays the revised spelling exercise. The number and range of words children within different age ranges attempted to spell were: 14 See Parsons, S. and Bynner, J. (2005). Measuring Basic Skills for Longitudinal Study: The design and development of instruments for use with cohort members in the age 34 follow-up in the 1970 British Cohort Study (BCS70).London: National Research and Development Centre for adult literacy and numeracy.

22
Children aged 6:0 – 6:11 would be asked to spell 15 words: words 1 - 15 Children aged 7:0 – 8:11 would be asked to spell 20 words: words 6 - 25 Children aged 9:0 – 10:11 would be asked to spell 20 words: words 11 - 30 Children aged 11:0 – 16:11 would be asked to spell 28 words: words 11 – 38
Children in the last age band (11:0 - 16:11) began from an earlier starting point than the one suggested by BAS II. The main reason for this was that as the latter age band is relatively wide a wider range of skills would potentially be presented by the children. Even if the first few words were too easy for many of the children, getting them right would only boost their confidence.
23
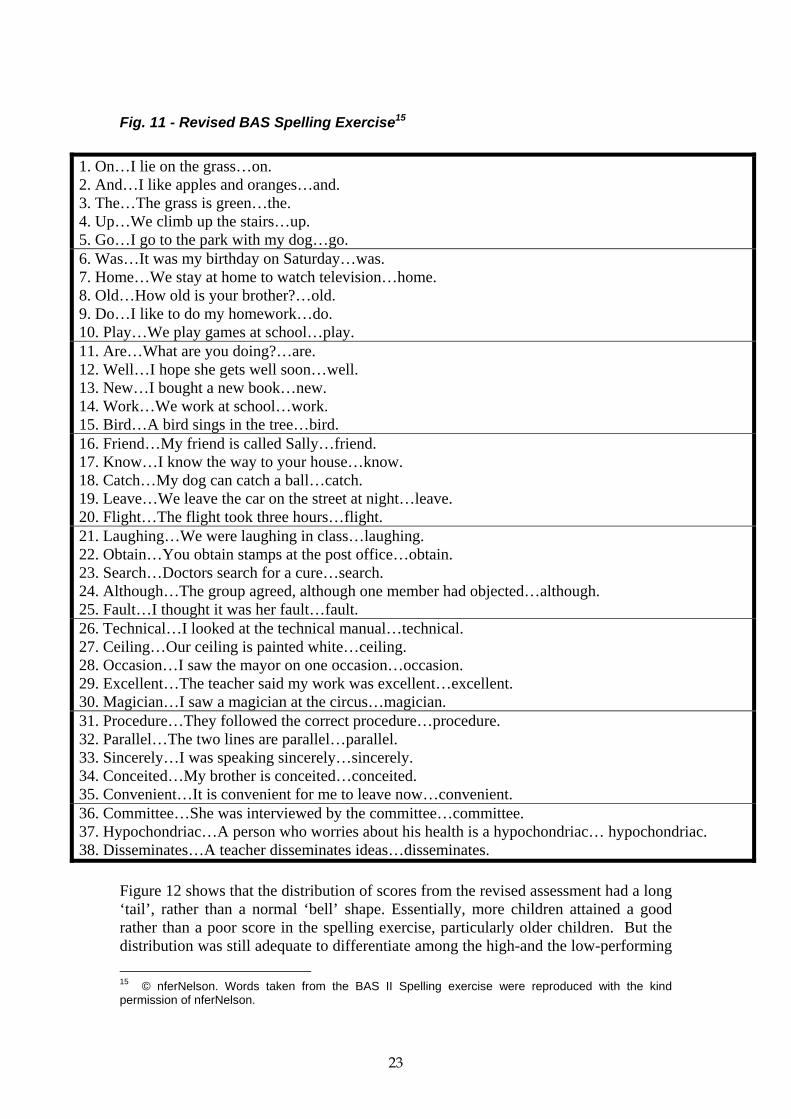
Fig. 11 - Revised BAS Spelling Exercise15
1. On…I lie on the grass…on. 2. And…I like apples and oranges…and. 3. The…The grass is green…the. 4. Up…We climb up the stairs…up. 5. Go…I go to the park with my dog…go. 6. Was…It was my birthday on Saturday…was. 7. Home…We stay at home to watch television…home. 8. Old…How old is your brother?…old. 9. Do…I like to do my homework…do. 10. Play…We play games at school…play. 11. Are…What are you doing?…are. 12. Well…I hope she gets well soon…well. 13. New…I bought a new book…new. 14. Work…We work at school…work. 15. Bird…A bird sings in the tree…bird. 16. Friend…My friend is called Sally…friend. 17. Know…I know the way to your house…know. 18. Catch…My dog can catch a ball…catch. 19. Leave…We leave the car on the street at night…leave. 20. Flight…The flight took three hours…flight. 21. Laughing…We were laughing in class…laughing. 22. Obtain…You obtain stamps at the post office…obtain. 23. Search…Doctors search for a cure…search. 24. Although…The group agreed, although one member had objected…although. 25. Fault…I thought it was her fault…fault. 26. Technical…I looked at the technical manual…technical. 27. Ceiling…Our ceiling is painted white…ceiling. 28. Occasion…I saw the mayor on one occasion…occasion. 29. Excellent…The teacher said my work was excellent…excellent. 30. Magician…I saw a magician at the circus…magician. 31. Procedure…They followed the correct procedure…procedure. 32. Parallel…The two lines are parallel…parallel. 33. Sincerely…I was speaking sincerely…sincerely. 34. Conceited…My brother is conceited…conceited. 35. Convenient…It is convenient for me to leave now…convenient. 36. Committee…She was interviewed by the committee…committee. 37. Hypochondriac…A person who worries about his health is a hypochondriac… hypochondriac. 38. Disseminates…A teacher disseminates ideas…disseminates.
Figure 12 shows that the distribution of scores from the revised assessment had a long ‘tail’, rather than a normal ‘bell’ shape. Essentially, more children attained a good rather than a poor score in the spelling exercise, particularly older children. But the distribution was still adequate to differentiate among the high-and the low-performing 15 © nferNelson. Words taken from the BAS II Spelling exercise were reproduced with the kind permission of nferNelson.

24
children. As the test had been revised, we were not able to convert raw scores into BAS II ability scores and compare with the expected age-equivalent ability scores. As such, Figure 13 displays the average rescaled raw scores (range 0 to 100) achieved by children at each age from 6 to 16 years. Unlike the BAS II Word Reading ability scores, the average scores of older children were not so distinctively higher than the average scores of the younger children, possibly because of the slight restriction at the upper end of the performance range.
Fig. 12 - Distribution of (rescaled) raw scores for children completing the revised BAS Spelling exercise, by age
0
10
20
30
40
10 20 30 40 50 60 70 80 90 100(rescaled) Spelling Score
Perc
ent
All age 6-7 age 8-9 age 10-11 age 12-13 age 14-16

25
Fig. 13 - Average (rescaled) raw scores for children completing the revised BAS Spelling exercise, by age
6052 52
6759
6760 60
64 6772 70
0
20
40
60
80
100
all 6 7 8 9 10 11 12 13 14 15 16Age of Child
Rev
ised
Raw
Sco
re
Number Skills
Rules and administration In this exercise, the child performed various number-based tasks, such as pointing to orally presented numbers, naming visually presented numbers and written calculations. There were 46 items in total, arranged in six blocks (A to F); the first four blocks consisted of eight items each, and the last two blocks had seven items each. As with the other scales, the number of blocks a child attempted depended on the child’s performance (see Appendix A8 for details and the different starting and stopping points for children of different ages). The numerical tasks were presented in the specially designed answer booklet. The format (font type, font size, setting etc.) of the numbers / words used was as close as possible to the standard BAS II format, but blocks A, B, C and D were each presented on a separate page, whereas in the standard BAS II version, Blocks A and B were on the same page, as were Blocks C and D. From the pilot study, interviewers reported that some children were not familiar with the way some of the sums were written. For example, younger children often learn to do sums in a ‘horizontal format’, but in the BAS II they were written out in ‘vertical format’. Older children had similar problems with the long division sign. Following the feedback, education professionals were approached in order to clarify why children were not familiar with the ways several of the items were written. It was found that the Curriculum had changed since the latest

26
version of the BAS II had been produced. To fairly assess what the children actually knew, the symbols and layout were changed, as detailed in Figure 14.
Fig. 14 - Examples of modified BAS II formats16
BAS II format BCS70 survey format 14 + 2
14 + 2 =
17 – 3
17 – 3 =
3 × 5
3 × 5 =
847
84 ÷ 7 =
4(1.3 + 5.7) =
4×(1.3 + 5.7) =
Interviewers could also ask children in advance whether they recognised the way the sums were written. If they didn’t, they either invited the child to write them as they were taught at school, or they offered to write them instead. When interviewers saw a child was struggling, they asked the child if they had done the sums at school; if they hadn’t, they then moved them to the next item, and this was a more sympathetic way of legitimising their failure. Figure 15 shows the distribution of the scores for each age band for the children of BCS70 cohort members age 6:0 to 16:11 who completed the Number Skills exercise. As for the Word Reading exercise, the distribution was normal but, unlike the distribution of scores in the Word Reading exercise where the ‘tail’ of the scores was in the direction of low scores, scores in the Number Skills exercise ‘tailed’ slightly towards high scores. This reflects the fact that more children, as adults, have difficulties with numbers than they do with reading.
16 Not original BAS II items.

27
Fig. 15 - Distribution of ability scores for children completing the BAS Number Skills exercise
0
10
20
30
40
50
60
20 40 60 80 100 120 140 160 180 200 200+Number Skills Ability Score
Perc
ent
All age 6-7 age 8-9 age 10-11 age 12-13 age 14-16
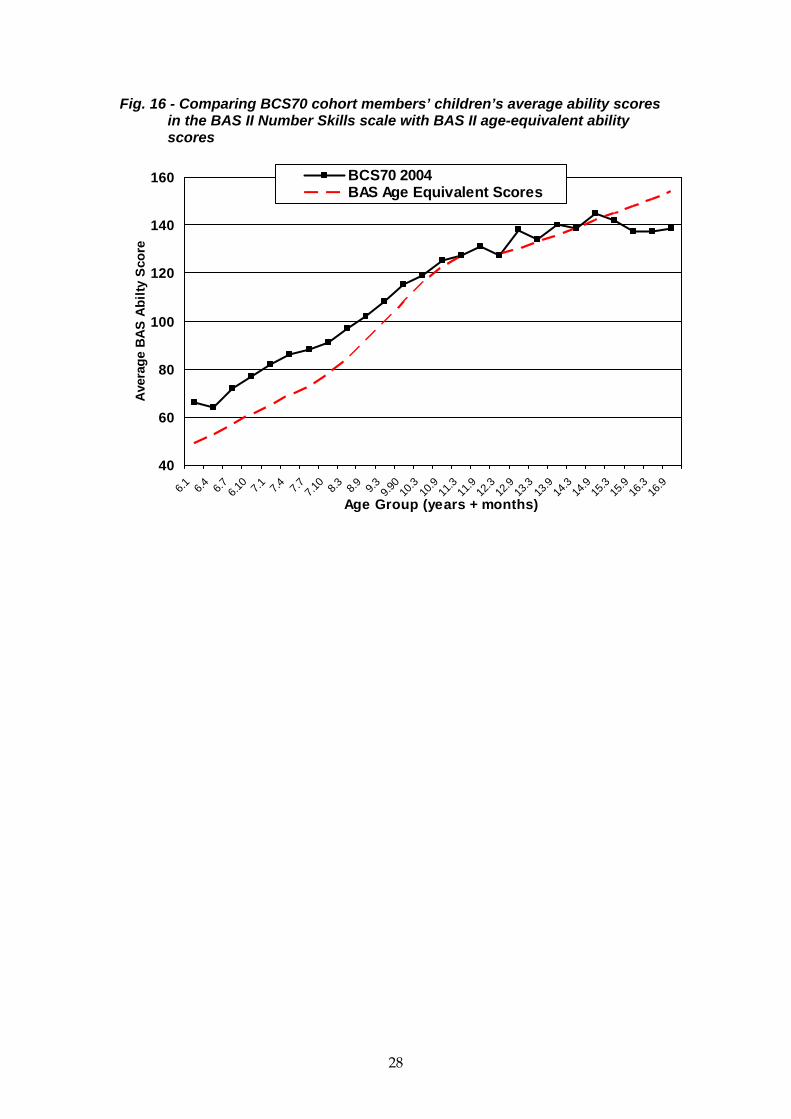
In Figure 16 we can see that, once again, the average scores increased with age and, as for the Word Reading scale, differences between average scores achieved by cohort members’ children and the BAS II age-equivalents reversed as the children’s age increased. The younger children, aged between 6 and 10, had higher scores than the BAS II age-equivalents whereas older children, aged 15 to16 years, had lower scores than the BAS II age-equivalent scores. Children between 11 and 14 years had scores that fell on or around the mid-point of the expected range of the BAS II age-equivalent scores. It is important to remember that older children in our sample are a product of young motherhood, and young mothers are more likely to have less education and associated qualifications. However the smaller samples of less than n = 200 for the oldest age groups (age 12 and upwards), and only just over 70 for children at age 15 and 16, also need to be taken into account. This is shown by the observation that the smooth line of average scores becomes increasingly jagged as average scores are calculated from the performance of fewer children. This was not so apparent from the children’s performance in the Word Reading scale, perhaps reflecting the greater diversity in an individual’s grasp of numbers and mathematics compared to a grasp of reading. However, the overall impression is that cohort members’ children aged between 15 and 16 had lower average scores than the BAS II age-equivalents, reflecting the younger than average age at which their (generally less educated) mothers gave birth to them.
28
Fig. 16 - Comparing BCS70 cohort members’ children’s average ability scores in the BAS II Number Skills scale with BAS II age-equivalent ability scores
40
60
80
100
120
140
160
6.1 6.4 6.7 6.10 7.1 7.4 7.7 7.1
0 8.3 8.9 9.3 9.90
10.3
10.9
11.3
11.9
12.3
12.9
13.3
13.9
14.3
14.9
15.3
15.9
16.3
16.9
Age Group (years + months)
Ave
rage
BAS
Abi
lty S
core
BCS70 2004 BAS Age Equivalent Scores

29
Appendix A1 - Naming Vocabulary i) Starting and stopping points for children of different ages. These ‘rules’ were programmed into the computer to minimise the decisions interviewers had to make on the spot. Children aged 3:0 – 4:5 start at item number 1. When they reach item 16, there are two options: (a) If they have failed 3 or more items, the exercise is stopped (b) If they have failed fewer than 3 items, they continue to item 30. At that point, there are two options again: (a) If they have failed 3 or more items in total, the exercise is stopped (b) If they have failed fewer than 3 items in total, they continue to item 36. The exercise is stopped at any point where the child has made 5 consecutive errors. Children aged 4:6 – 5:11 start at item number 12. When they reach item 30, there are two options: (a) If they have failed 3 or more items, they then go back to Item 1 (b) If they have failed fewer than 3 items, they continue to item 36. If at any point the child makes 5 consecutive errors, there are two options: (a) If at least 3 items have been passed on the scale, the exercise is stopped. (b) If fewer than 3 items have been passed on the scale, then the child goes back to Item 1. ii) Naming Vocabulary Variables Individual Variables basnv01 basnv02 basnv03 basnv04 basnv05 basnv06 basnv07 basnv08 basnv09 basnv10 basnv11 basnv12 basnv13 basnv14 basnv15 basnv16 basnv17 basnv18 basnv19 basnv20 basnv21 basnv22 basnv23 basnv24 basnv25 basnv26 basnv27 basnv28 basnv29 basnv30 basnv31 basnv32 basnv33 basnv34 basnv35 basnv36 Derived Variables basnvR (raw score) basnvA (ability score) **add in datafile name and syntax file??
30
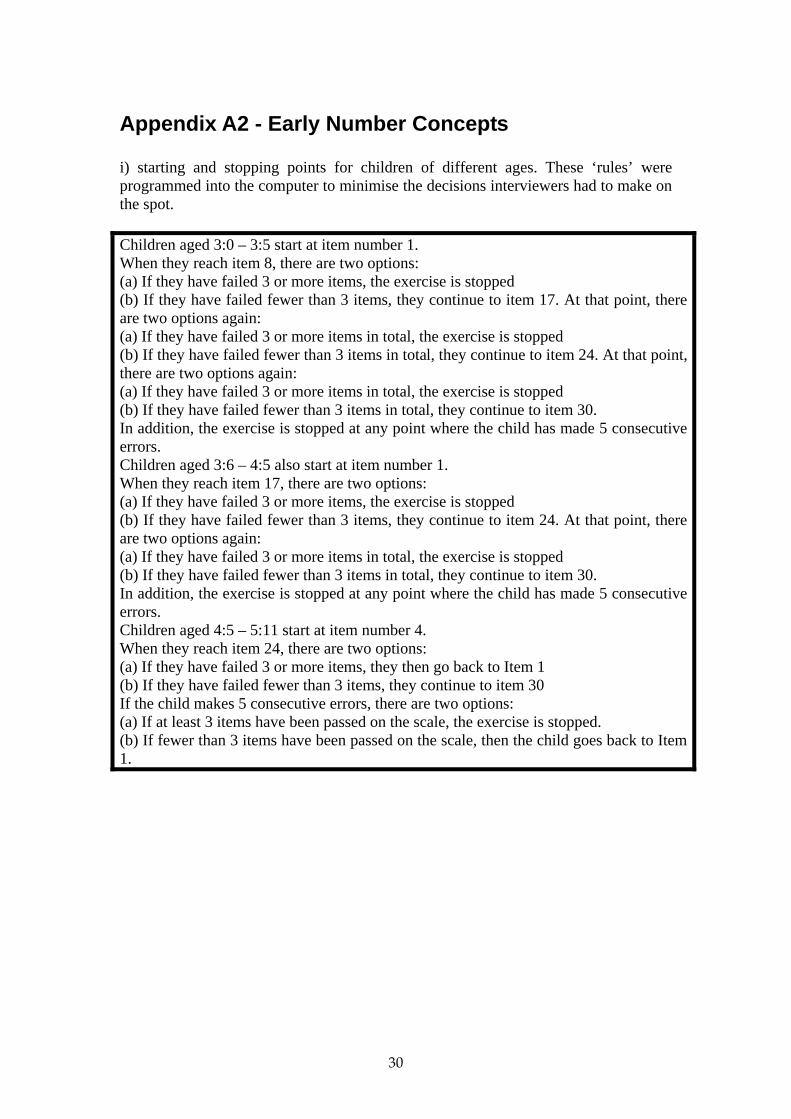
Appendix A2 - Early Number Concepts i) starting and stopping points for children of different ages. These ‘rules’ were programmed into the computer to minimise the decisions interviewers had to make on the spot. Children aged 3:0 – 3:5 start at item number 1. When they reach item 8, there are two options: (a) If they have failed 3 or more items, the exercise is stopped (b) If they have failed fewer than 3 items, they continue to item 17. At that point, there are two options again: (a) If they have failed 3 or more items in total, the exercise is stopped (b) If they have failed fewer than 3 items in total, they continue to item 24. At that point, there are two options again: (a) If they have failed 3 or more items in total, the exercise is stopped (b) If they have failed fewer than 3 items in total, they continue to item 30. In addition, the exercise is stopped at any point where the child has made 5 consecutive errors. Children aged 3:6 – 4:5 also start at item number 1. When they reach item 17, there are two options: (a) If they have failed 3 or more items, the exercise is stopped (b) If they have failed fewer than 3 items, they continue to item 24. At that point, there are two options again: (a) If they have failed 3 or more items in total, the exercise is stopped (b) If they have failed fewer than 3 items in total, they continue to item 30. In addition, the exercise is stopped at any point where the child has made 5 consecutive errors. Children aged 4:5 – 5:11 start at item number 4. When they reach item 24, there are two options: (a) If they have failed 3 or more items, they then go back to Item 1 (b) If they have failed fewer than 3 items, they continue to item 30 If the child makes 5 consecutive errors, there are two options: (a) If at least 3 items have been passed on the scale, the exercise is stopped. (b) If fewer than 3 items have been passed on the scale, then the child goes back to Item 1.

31
Specific Administration rules for Item 3 For item 3, the child is asked to count out loud a row of ten green tiles while simultaneously pointing to them. A score of 0 to 3 points is given for reciting numbers in correct sequence, and a score of 0 to 3 points is given for pointing to the squares in one-to-one correspondence with reciting. Thus, the total item score ranges from 0 to 6 points. Points are awarded as follows:
Child recites to number 1-3 4-6 7-9 10 Child recites and points to number 1-3 4-6 7-9 10 Score 0 1 2 3
For example, if the child says ‘one, two, three, four, five, six, seven, nine, twelve, two’ and points to the first four squares in one-to-one correspondence with saying their numbers, he / she receives a total of 3 points, made up as follows: for recitation only, the child receives 2 points for reciting correctly up to seven; for coordinated recitation and pointing to the first four squares the child receives 1 point. If the score on the first attempt is less than a perfect score of 6, a second attempt is given. The final item score is the better of the two scores for reciting plus the better of the scores for pointing in correspondence with reciting. ii) Early Number Concepts Variables Individual Variables basenc01 basenc02 basenc04 basenc05 basenc06 basenc07 basenc08 basenc09 basenc10 basenc11 basenc12 basenc13 basenc14 basenc15 basenc16 basenc17 basenc18 basenc19 basenc20 basenc21 basenc22 basenc23 basenc24 basenc25 basenc26 basenc27 basenc28 basenc29 basenc30 Derived Variables basencR (raw score) basencA (abilty score) **add in datafile name and syntax file??

32
Appendix A3 - Copying Task
Scoring the Copying task The child is asked to make two copies of each shape. No time limit is given. For each drawing a score of 0 or 1 is allocated. As not all children complete two copies, a score of 1 is allocated if at least one good copy is made of a given design. The total score is the sum of the scores for the individual drawings. The test is used to assess the child’s ability to reproduce shapes and the neatness of the drawing is therefore irrelevant. For all of the drawings the following principles apply: the drawings must have the right general shape and look like what it is supposed to be it should be approximately symmetrical angles should not be rotated the drawing should not be rotated, i.e. the point of the triangle should be uppermost angles must be approximately opposite each other (except for the triangle) slight bowing or irregularity of lines is allowed as long as the other criteria are met, neatness is not important lines should meet approximately, but as long as other criteria are met small gaps in junctions are acceptable slight crossing and overlapping of lines is permitted. **This exercise has not been coded
33
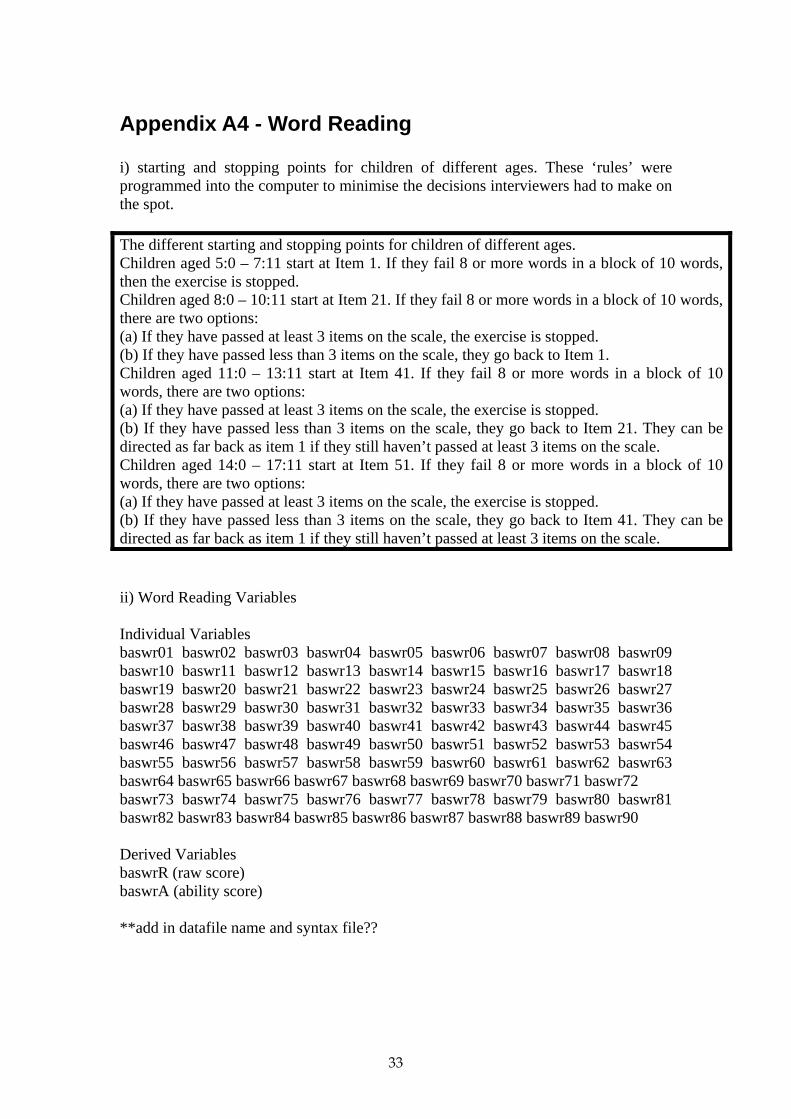
Appendix A4 - Word Reading i) starting and stopping points for children of different ages. These ‘rules’ were programmed into the computer to minimise the decisions interviewers had to make on the spot. The different starting and stopping points for children of different ages. Children aged 5:0 – 7:11 start at Item 1. If they fail 8 or more words in a block of 10 words, then the exercise is stopped. Children aged 8:0 – 10:11 start at Item 21. If they fail 8 or more words in a block of 10 words, there are two options: (a) If they have passed at least 3 items on the scale, the exercise is stopped. (b) If they have passed less than 3 items on the scale, they go back to Item 1. Children aged 11:0 – 13:11 start at Item 41. If they fail 8 or more words in a block of 10 words, there are two options: (a) If they have passed at least 3 items on the scale, the exercise is stopped. (b) If they have passed less than 3 items on the scale, they go back to Item 21. They can be directed as far back as item 1 if they still haven’t passed at least 3 items on the scale. Children aged 14:0 – 17:11 start at Item 51. If they fail 8 or more words in a block of 10 words, there are two options: (a) If they have passed at least 3 items on the scale, the exercise is stopped. (b) If they have passed less than 3 items on the scale, they go back to Item 41. They can be directed as far back as item 1 if they still haven’t passed at least 3 items on the scale. ii) Word Reading Variables Individual Variables baswr01 baswr02 baswr03 baswr04 baswr05 baswr06 baswr07 baswr08 baswr09 baswr10 baswr11 baswr12 baswr13 baswr14 baswr15 baswr16 baswr17 baswr18 baswr19 baswr20 baswr21 baswr22 baswr23 baswr24 baswr25 baswr26 baswr27 baswr28 baswr29 baswr30 baswr31 baswr32 baswr33 baswr34 baswr35 baswr36 baswr37 baswr38 baswr39 baswr40 baswr41 baswr42 baswr43 baswr44 baswr45 baswr46 baswr47 baswr48 baswr49 baswr50 baswr51 baswr52 baswr53 baswr54 baswr55 baswr56 baswr57 baswr58 baswr59 baswr60 baswr61 baswr62 baswr63 baswr64 baswr65 baswr66 baswr67 baswr68 baswr69 baswr70 baswr71 baswr72 baswr73 baswr74 baswr75 baswr76 baswr77 baswr78 baswr79 baswr80 baswr81 baswr82 baswr83 baswr84 baswr85 baswr86 baswr87 baswr88 baswr89 baswr90 Derived Variables baswrR (raw score) baswrA (ability score) **add in datafile name and syntax file??
34
Appendix A5 - Spelling (revised) i) (revised) Spelling Variables Individual Variables bassp01 bassp02 bassp03 bassp04 bassp05 bassp06 bassp07 bassp08 bassp09 bassp10 bassp11 bassp12 bassp13 bassp14 bassp15 bassp16 bassp17 bassp18 bassp19 bassp20 bassp21 bassp22 bassp23 bassp24 bassp25 bassp26 bassp27 bassp28 bassp29 bassp30 bassp31 bassp32 bassp33 bassp34 bassp35 bassp36 bassp37 bassp38 Derived Variables basspR (raw score) bassp1hr (revised score – maximum of a100) **add in datafile name and syntax file??
35
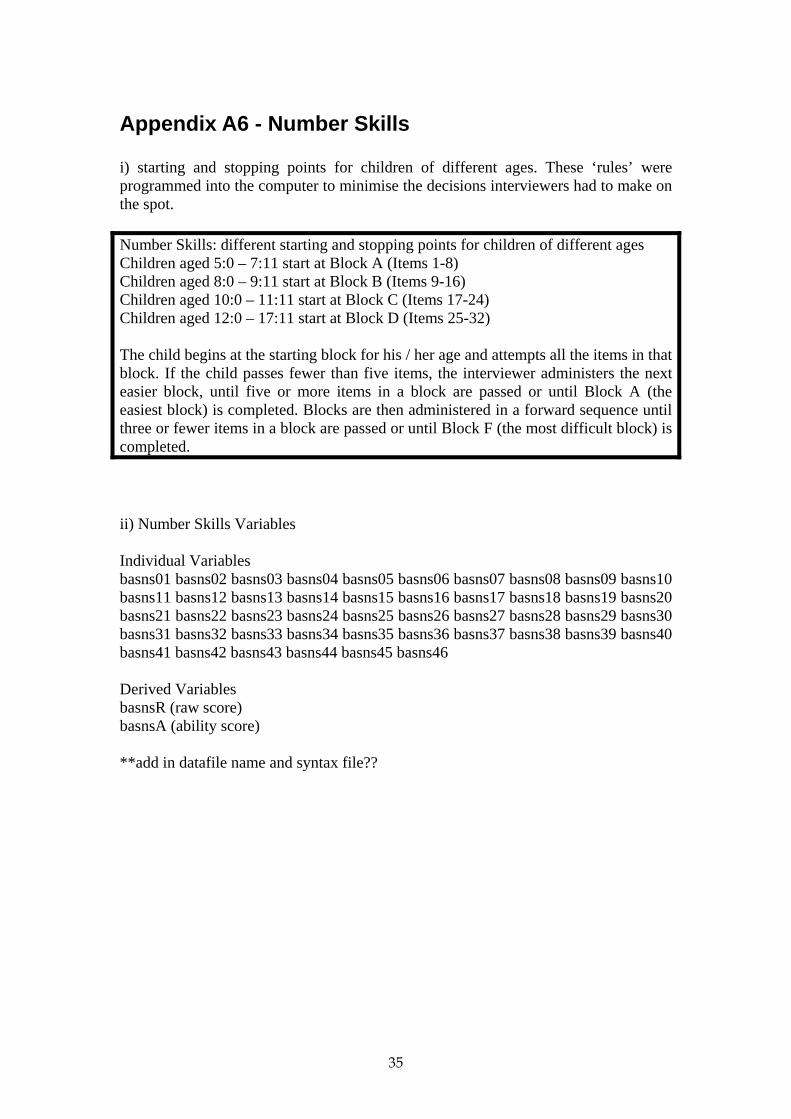
Appendix A6 - Number Skills i) starting and stopping points for children of different ages. These ‘rules’ were programmed into the computer to minimise the decisions interviewers had to make on the spot. Number Skills: different starting and stopping points for children of different ages Children aged 5:0 – 7:11 start at Block A (Items 1-8) Children aged 8:0 – 9:11 start at Block B (Items 9-16) Children aged 10:0 – 11:11 start at Block C (Items 17-24) Children aged 12:0 – 17:11 start at Block D (Items 25-32) The child begins at the starting block for his / her age and attempts all the items in that block. If the child passes fewer than five items, the interviewer administers the next easier block, until five or more items in a block are passed or until Block A (the easiest block) is completed. Blocks are then administered in a forward sequence until three or fewer items in a block are passed or until Block F (the most difficult block) is completed. ii) Number Skills Variables Individual Variables basns01 basns02 basns03 basns04 basns05 basns06 basns07 basns08 basns09 basns10 basns11 basns12 basns13 basns14 basns15 basns16 basns17 basns18 basns19 basns20 basns21 basns22 basns23 basns24 basns25 basns26 basns27 basns28 basns29 basns30 basns31 basns32 basns33 basns34 basns35 basns36 basns37 basns38 basns39 basns40 basns41 basns42 basns43 basns44 basns45 basns46 Derived Variables basnsR (raw score) basnsA (ability score) **add in datafile name and syntax file??