Embed Size (px)
Citation preview

B.Com. Semester-II
Advance Financial Management
1. Accounting process and principles, financial, cost and management accounting.
2. Elements of book keeping, Journal, cash and handbook, Book
reconciliation statement, Ledger, trial balance, profit and loss accounts, final accounts of proprietary and partnership concern and balance sheet.
3. Cost accounting – Objectives, elements of cost, understanding of
the different methods of costing.
4. Financial Management – Meaning, scope and role, a brief study of functional areas of financial management. Introduction to various FM tools: Ration Analysis
Meaning
Basis of comparison
Types of ratios
5. Working Capital Management: Theory of Working Capital Management: Introduction, Nature of Working Capital, Concepts and Definitions of Working Capital, Need for Working Capital, Permanent and Temporary Working Capital, Changes inn Working Capital, Determinants of Working Capital.
6. Budgeting – budgets, purpose, budgetary control, preparation of budgets, master budget, fixed and flexible budgeting.
Reference Books:
1. “Book Keeping and Accountancy” Choudhari, Chopde.
2. “Cost Accounting”: Choudhari, Chopde.
3. “Financial Management” Text and Problems: M.Y.Khan, P.K. Jain.
4. “Financial Management Theory & Practice” Prasanna Chandra Tata McGraw Hill.
5. Managerial Economics & Financial Analysis, Siddiqui S.A. Siddiqui
A.S. New Age.

2
1
ACCOUNTING PROCESS AND PRINCIPLES, FINANCIAL, COST AND MANAGEMENT ACCOUNTING
Unit Structure:
1.0 Objectives
1.1 Introduction
1.2 Meaning of Accounting
1.3 Accounting Principles
1.4 Branches of Accounting
1.5 Accounting process
1.6 Funds Flow Statement
1.7 Cash Flow Statement
1.8 Distinction between Funds Flow Statement and Cash Statement
Flow
1.9 Exercises
OBJECTIVES
After studying the unit the students will be able to:
Understand the meaning of Accounting.
Explain the Accounting Principles and Concepts.
Know the Process of Accounting.
Understand and explain the process of Accounting.
INTRODUCTION
Every person performs some kind of economic activity. A worker daily works and get wages and he spends to buy goods, cloths and some part of earnings saves for future. A business man purchases goods and sales it. He incurred various expenses like salaries, rent etc. A partner in firm contributes towards capital in the firm which carries on business may be trading in goods. Similarly companies, Governments are also carries on some financial

3
activities. All are carrying some kind of economic activities. Such economic activities are performed through transactions and / or events. Thus the business transactions include purchase, sale of goods, rendering various services, receipts and payments for such transactions. In a business concerns the transactions are numerous.
The details of all transactions cannot be remembered by the business man. Therefore it is necessary to keep written records of all such transactions. The records of written transaction will help business to settle disputes and also possible to provide valuable information to the owner of business. Book-keeping disciple has been developed to serve this purpose. The aim of Book-keeping is to provide the information
needed by the businessmen and also it helps him to take decisions.
MEANING OF ACCOUNTING
The American Institute of Certified Public Accounts (AICPA) defined Accounting as “Accountancy is the art of recording classifying and summarizing in a significant manner and in terms of money transactions and events which are in part of at least a financial characters and interpreting the result there of”.
Again in 1966, AICPA defines Accounting as “The process of
identifying, measuring and communicating economic information to permit; informed judgement and decisions by the uses of accounts”.
Thus accounting may be defined as the process of recording,
classifying, summarizing, analysing and interpreting the financial transactions and communicating the results. There of to the persons
interested in such information.
The utility of accounting information is greatly increased when it is compiled in a systematic manner and financial statements are prepared at periodic intervals.
There is difference between the terms “Book keeping” and
“Accounting”. Book keeping is merely concerned with orderly record keeping and recording business transactions and financial Accounting is border in scope than book keeping. Accounting involves analysis and judgements at different stages such as recording of transactions, classification, summarization and interpretation.
ACCOUNTING PRINCIPLES
The basis aims of book-keeping and accountancy are to record the business transactions and events in a summarised form. Transactions are recorded in chronological order in proper books of

4
accounts book-keeping. Accountancy and science based or fundamental truth and rules or conducts or procedures which are universally accepted. These rules of conducts to record business transactions are called accounting principles. These principles are developed over long period of time.
The classification of accounting principles is as under:
Accounting Principles
Accounting Concepts Accounting Conventions
a) Business entity a) Disclosure
b) Going Concern b) Materiality
c) Money Measurement c) Consistency
d) Cost Concept d) Conservatism
e) Accounting period
f) Duel aspect
g) Accrual Concept
h) Matching Cost
i) Realisation
Accounting Concepts:
Concepts mean a general idea which conveys certain meaning. Accounting concepts may be considered as basis assumption or conditions on which the science of accounting is based. Concepts are based on logical consideration. Accounts and Financial statements are always interpreted in light of concepts which govern accounting method.
Different accounting concepts are discussed as follows:
a. Business Entity Concepts
According to Entity concept, business is treated as a unit of entity form separate from its Owner, Creditors and Management etc. Accounts are kept for business entity as distinguished form a person
associated with it. All business transactions are recorded in the books of Accounts from the point of view of business only. Every type of business organisation is treated as separate Accounting entity.

5
The failure to recognise the business as separate accounting entity would make it extremely difficult to evaluate the performance of business alone.
The overall effect of adopting this concept is –
1) Only the business transactions are reported and not the personal
transactions of the owners.
2) Profit is the property of business unless distributed to the owners.
3) The personal assets of the owners are not considered while recording and reporting the assets of the business entity.
b. Going Concern
Business transactions are recorded on the assumption that the business will continue for a long time. There is neither the intention nor the necessity to liquate the particular business in near future. Therefore, it would be able to meet its contractual obligation and use its resources
according to the plans and predetermined goals. Therefore, Fixed Assets are recorded at cost and depreciation is calculated on cost / written down value. Similarly prepaid expenses are treated as Assets on the presumption that the business will continue and these expenses will be utilized in future.
When an enterprise liquidates a branch or one division or one
segment of its business, the ability of the enterprise to continue as a going concern is not imparted.
In case of enterprise going to liquidate or become insolvent.
Then the enterprise cannot be considered as a going concern.
c. Money Measurement Concept
A unit of exchange and measurement is necessary to account for business transaction in a uniform manner. Money is common denominator in terms of which the exchange ability of goods and services are measured. Only such transactions and events as can be interpreted in terms of money are recorded.
Non monetary events like public political contract, location of
business; certain disputes, efficient Sales Force etc. can not be recorded in the books of Accounts even through these have great effects.
However, a unit of money measurement over period of time has
its own drawbacks. Money has time value, which can not be considered. Time value of money is affected seriously by economic differences etc. System of accountancy treats all units of money same irrespective of time of original and settlement of it say after

6
two years. It will be the same amount. However value of Money true sense will be less. This is a great drawback. This leads to the introduction of inflation accounts.
d. Cost Concepts
According to cost concept the various assets acquired by enterprise should be recorded on the basis of actual cost incurred. The cost concept does not mean that the basis for all subsequent
accounting for the assets. As per cost concept Fixed Assets are shown at cost less depreciation charged from year to year. It may be noted that if nothing has been paid for acquiring something it would not be shown/recorded in the books of accounts maintain.
Financial statement based on historical cost may not be much
relevant for investors and other users because they are more interested in knowing what the business actually worth today rather than the original cost.
e. Accounting Period Concept
It is customary that the life of the business is divided into appropriate parts or segments of analysing the results shown by the business. Each part divided is known as an accounting period. It is an internal of time at end of which the income statement and balance sheet are prepared. Normally the accounting period consists of twelve months.
f. Duel Aspect Concept
This concept based on double Entry book-keeping which means that Accounting system is set up in such a way that a record is made of the two aspects of each transaction that affects the record. The recognition of the two aspects of every transaction is known as duel aspects concept. Modern Financial Accounting considers both aspects of every transaction.
One entry consists of debit to one or more accounts and another
effect consist of credit to some other one or more accounts. However, the total amount debited is always equal to the total amount credited. Therefore at any point of time total assets of a business are equal to its total liabilities. Liabilities to outsider are known as liabilities, liabilities to the owner are referred to as capital.
Assets = Liabilities + Capital Therefore,
Capital = Assets – Liabilities
Assets referred to valuable things owned by the business, Capital refers to the owner’s contribution to the business.

7
g. Accrual Concept
This accounting concept states that revenue is recognised when they are earned and when they are not received similarly, cost are recognised as and when they are incurred and not when they are paid. This concept implies that the income should be measured as difference between revenues and expenses rather that the difference between
cash received and disbursements. Therefore certain adjustments are required while preparing Final Accounts. In case of revenue accounts; prepaid expenses, out standing expenses, Income received in advance / Receivable are adjusted. These adjustments have their impact on both the income statement and the Balance sheet.
h. Matching Cost Concept
This concept is based on accounting period concept for determining accurate profit / Income has to compare the revenues of the business with the cost that is incurred to earn that revenue. The term “Matching” means appropriate association of related revenues and expenses. According to this concept adjustments should be made for all outstanding expenses, income receivable, prepaid expenses, Income received in advance, depreciation etc. While preparing final accounts at the end of accounting period.
i. Realisation Concept
This accounting concept explains that sell is supposed to be
completed only when ownership of goods are passed on from the seller to the buyer. Income is considered to be earned on the date when sales take place. No profit is supposed to accrue on the acquisition of any thing, however, income earned / realised will be earn only when goods are sold at a profit. Therefore closing stock is valued at cost or market
price whichever is less. It prevents business Firms from inflecting their profits by recording income that is expected in future.
Accounting Conventions:
The term ‘Convention’ denotes customs or traditions or practice based on general agreement between the accounting bodies which guide the accountant while preparing the financial statements.
a. Disclosure
According to convention of full disclosure, accounting must
disclose all the material facts and informations so that interested parties after reading such accounting report can get a clear view of the state of affairs of the business. All information which are of

8
material interest to proprietors, creditors and investors should be disclosed in accounting statement.
The Companies Act makes various provisions for disclosure of
essential information that their is no chance of any material information being left out.
b. Materiality
The term material means “relative importance”, Accounting to the convention of materiality; account should report only what is material and ignore insignificant details while the preparing the final accounts. Materiality will differ or changed with nature, size and tradition of the business. What is material for one enterprise may be immaterial for another enterprise. This is because otherwise accounting will unnecessarily be overburdened with minute details. It is not possible to lay down any fixed standard by which Materiality can be judged. The decision is to be made by the accountant or the Auditor based on their professional experience.
c. Consistency
This accounting convention state that ones a particular accounting practice, method or policy is adopted to prepare accounts, statements and Reports. It should be continued for years together and should not charge unless it is forced to change it. Accounting practices should remain the same from one year to another. The results of different years will be comparable only when accounting rules are continuously adhered to from years to years
i.e. Valuation of stock in trade, method of depreciation, treatment of
approval sale etc. Since methods of accounting consistence the financial statements are reliable to the people who use it.
d. Conservatism
Financial Statements are usually drawn up on a conservative basis. Their are two principles which stem directly from conservatism.
a) The accountant should not anticipate income and should provide all possible losses, and
b) Faced with the choice between two methods of valuing an asset the
accountant should choose a method which leads to the lesser value.
It is also called “Principles of prudence”. Therefore, provision for bad and doubtful debts is also permitted and made every year. Accounting convention must be followed continuously. If not followed continuously it would result into understatement of incomes, assets and overstatement of liabilities and provisions and expenses.

9
BRANCHES OF ACCOUNTING
Accounting has forms of branches as under
Accountancy
Financial Cost Management Tax
Accounting Accounting Accounting Accounting
Financial Accounting
It is concerned with record keeping directed towards the preparation of Trial balance, profit and loss account and balance sheet.
Cost Accounting
Cost Accounting is the process of accounting for costs. It shows classification and analysis of cost on the basis of functions process, products etc. It also deals with cost computation, cost saving, cost reduction etc. In cost accounting cost per unit of output produced or services rendered is ascertained. It helps management in the control of cost of output or services rendered.
Management Accounting
It deals with the processing of data sentenced in financial accounting and cost accounting for managerial decision making. It also deals with application of managerial economic concepts for decision making for the efficient running of the business and thus in maximising profits.
Tax Accounting
This branch of accounting is becoming important because of complex tax laws governing income-tax, Excise duty, value added tax etc. Tax planning is now a days is very important as well to save tax, Account for tax deducted at sources, payment of advance tax, Filing of various tax returns in time as well as taking Cenvat credit for various taxes whenever is available.

10
Preparation of Final A/cs
ACCOUNTING PROCESS
The process of accounting involves recording classifying and summarizing of past events and transactions of financial nature, with a view to enabling the user of accounts to interpret the resulting summary.
The utility of accounting information is greatly increased when it
is complied in a systematic manner and financial statements prepared
at periodic intervals.
The Accounting Process
STEP I
STEP II
STEP III
STEP IV
STEP V
STEP VI
STEP VII Profit & Loss A/c
Balance Sheet
Fund Flow Statement
Cash Flow Statement
Note: As final Accounts are separately explains in subsequent chapter,
here only fund flows & cash flows statements are explained.
Passing Adjusting Entries
Preparation of Trial Balance
Posting to ledger
Recording of Transaction in Journal
Preparation of Documents
Identification of Transaction

11
CHECK YOUR PROGRESS
Define the following terms:
1. Cost Concept
2. Business entity concept
3. Going concern concept
4. Duel aspect concept
Explain the following Accounting conventions:
1. Disclosure
2. Consistency
Draw the chart showing Accounting Process.
FUND FLOW STATEMENT
The fund flow statement reflects movement of fund during particular period i.e. movement of working capital. Funds means working capital and not only cash/Bank balances. Sources consider of the transactions that increases net working capital and their applications consist of transactions that decrease working capital.
Specimen of funds flow statement
Funds flow statement for the year ended.....
Sources Applications
Issue of Share Capital x Redemption of preference
shares
x
Issue of Debentures x Redemption Debentures x
Sale of Fixed Assets x Repayment of loan Term
loans
x
Sale of Investments x Purchased of Fixed
Assets
x
Long term Loans x Purchased of Investment x
Decrease in working
capital
x Dividend paid x
Funds from operations
(Cash Trading Profit)
x Income Tax paid x
Buy-Back of Equity shares x
Increase in working capital x
xx xx
In short fund flows statement indicates various sources of
working capital and its applications.
12
CASH FLOW STATEMENT
Cash flow statement shows inflows and outflows of cash/ cash equivalent. It is prepared as per A.S-3.
As per A.S-3, the cash flow statement should report cash flows
during the period classified as operating, Investing and financing activities.
Activities that do not require use of cash / cash equivalents
should be excluded from a cash flow statement. e.g. Issue of Bonus shares conversion of Debentures into new Debentures / Shares.
Cash flow statement can be prepared by Direct method or
Indirect method.
Under direct method, major classes of gross cash receipts and
gross cash payments are obtained for showing it in funds from operations.
Indirect method, cash flow operating activities is calculated by
adjusting net profit. Net profit is adjusted, with non cash transaction
such as depreciation, Goodwill w/off etc, result figure indicates cash operating profit, which further adjusted with net increases / decreases in current Assets / Current liabilities. The final amount resulted indicates cash flows operating activities.
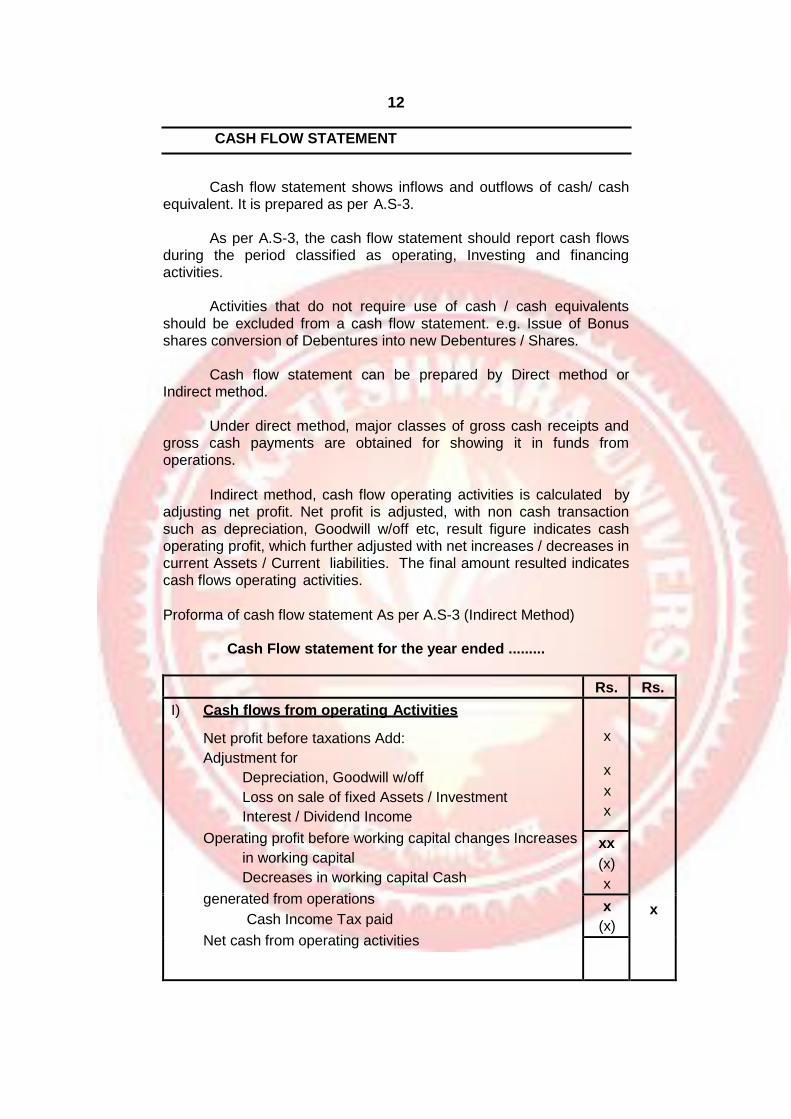
Proforma of cash flow statement As per A.S-3 (Indirect Method)
Cash Flow statement for the year ended .........
Rs. Rs.
I) Cash flows from operating Activities
Net profit before taxations Add:
Adjustment for
Depreciation, Goodwill w/off
Loss on sale of fixed Assets / Investment
Interest / Dividend Income
Operating profit before working capital changes Increases
in working capital
Decreases in working capital Cash
generated from operations
Cash Income Tax paid
Net cash from operating activities
x
x
x
x
x
xx
(x)
x
x
(x)
13
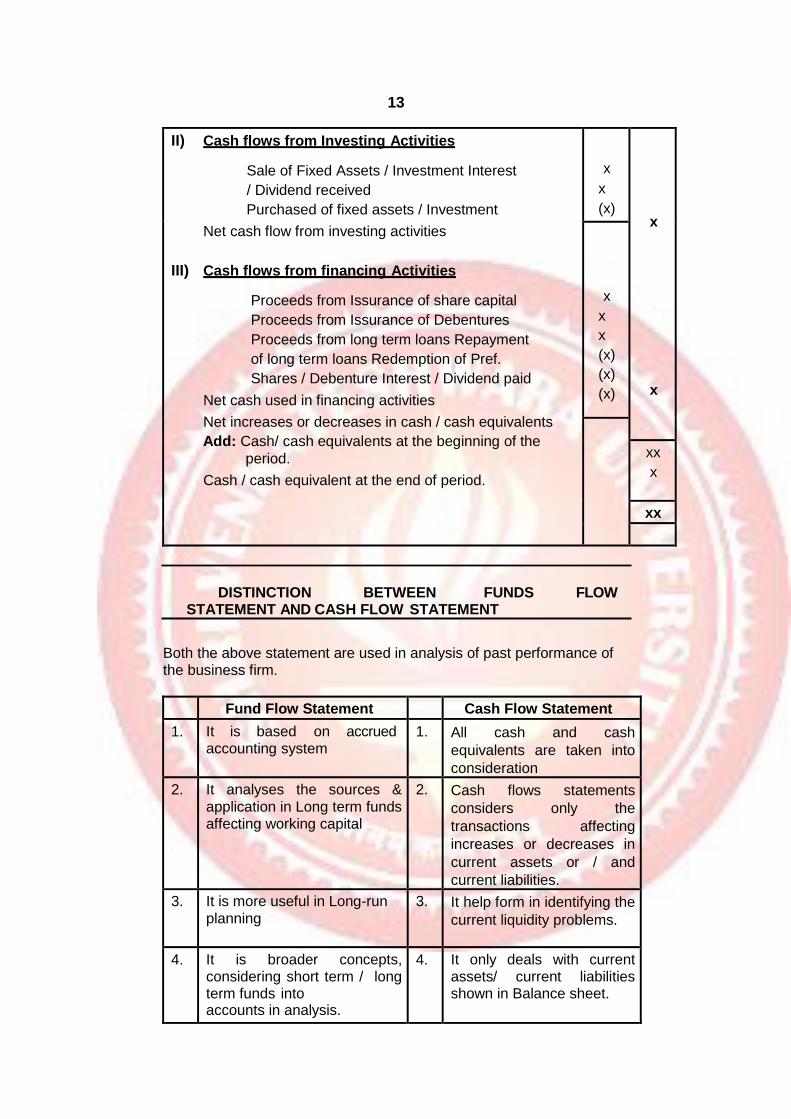
II) Cash flows from Investing Activities
Sale of Fixed Assets / Investment Interest
/ Dividend received
Purchased of fixed assets / Investment
Net cash flow from investing activities
III) Cash flows from financing Activities
Proceeds from Issurance of share capital
Proceeds from Issurance of Debentures
Proceeds from long term loans Repayment
of long term loans Redemption of Pref.
Shares / Debenture Interest / Dividend paid
Net cash used in financing activities
Net increases or decreases in cash / cash equivalents
Add: Cash/ cash equivalents at the beginning of the
period.
Cash / cash equivalent at the end of period.
x
x
(x)
x
x
x
x
x
(x)
(x)
(x)
xx
x
xx
DISTINCTION BETWEEN FUNDS FLOW
STATEMENT AND CASH FLOW STATEMENT
Both the above statement are used in analysis of past performance of the business firm.
Fund Flow Statement Cash Flow Statement
1. It is based on accrued accounting system
1. All cash and cash
equivalents are taken into
consideration
2. It analyses the sources &
application in Long term funds affecting working capital
2. Cash flows statements
considers only the
transactions affecting
increases or decreases in
current assets or / and
current liabilities.
3. It is more useful in Long-run
planning
3. It help form in identifying the
current liquidity problems.
4. It is broader concepts, considering short term / long term funds into accounts in analysis.
4. It only deals with current assets/ current liabilities shown in Balance sheet.

14
5. It tallies the funds generated from various sources with various uses to which they are put.
5. It shows in increases or decreases in cash/ cash equivalent during the period, which tallies with difference in opening / closing cash / Bank balances.
6. It shows the funds generated
and applied as regards long
term assets & liabilities.
6. It shows the cash flows from operating, financing and
investing activities.
EXERCISES :
1. Are the accounting concepts and conventions necessary?
2. Explain meaning of:
a) Accounting concepts
b) Accounting conventions
c) Accounting principles
3. Explain accounting conventions of:
a) Conservatism
b) Consistency
c) Disclosure
d) Materiality
4. Define and explain:
a) Concept of entity
b) Concept of continuity
c) Cost concept
d) Cost attach concept
e) Periodic matching of costs and revenues
5. Explain different branches of Accounting.

15
2
ELEMENT OF BOOK-KEEPING, JOURNAL, CASH AND BANK BOOK-I
Unit Structure:
Objectives
Meaning of Book-keeping
Objective of Book-keeping
Utility of Book-keeping
Book-keeping and Accountancy
Accounting system
Account
Classification of Accounts
Rules of Debit & Credit
Books of Accounts
A conceptual framework of financial accounting
Journal
Solved Problems
Exercises
OBJECTIVES
After studying the unit the students will be able to:
Know the Meaning, utility and objectives of Book keeping.
Explain the Accounting system.
Know the Classification of Accounts.
Understand the rules of Debit and Credit.
Explain the Meaning and Utility of Journal.
Journalise the Business transactions.
MEANING OF BOOK-KEEPING
The oxford dictionary defines Book-keeping as “The
activities of keeping records of financial dealings”.

16
J.R. Batiboi defines book-keeping as, “Book-keeping is the art of recording business dealings in set of Books”.
R.N. Carter defines book-keeping as “The science and art of correctly recording in the books of accounts. All those business transactions and events inset of books, as and when such transactions
take place. It is a systematic recording interms of money in set of books.”
OBJECTIVES OF BOOK-KEEPING
The main objectives of Book-keeping are given below:
1. To maintain the permant records of the business transactions.
2. To ascertain the profit earned or loss suffered during accounting
period.
3. To know various business Assets and liabilities apart from the above main objectives.
4. To know amount due to businessman from his customers.
5. To know amount payable to Suppliers.
6. To know various taxes and duties payable to government.
7. To defect and prevent errors and frauds committed by
employees and other person.
8. To provide valuable informations for taking for taking various decisions.
9. To take decision on significant business matters.
10. To compare and measure the optional efficiency of his business
with other firm, companies in same type of Industry.
11. To review the progress of the business from year to year.
12. To maintain permanent record of all transactions of business for
future reference.
13. To excise effective control on various expenses, incomes earned over business assets, business liabilities.
14. Other firms, Companies and within the firm compare current year with previous years. Such comparison is known as infra-firm comparison.
UTILITY OF BOOK- KEEPING
Utility means usefulness. The utilities to different persons
and entities are as under:
1) Businessman:
17
The owner who invest his money and assets into his business. He must know the profitabilities, financial stability. The owner can take various decisions on the basis of the valuable information obtained from books of accounts.
2) Evidence:
Books of Accounts can be produced as evidence in a court of law in case of disputes.
3) Book-keeping ensures proper calculation of Income Tax, Sales Tax, VAT and other tax liabilities.
4) Lenders:
On the basis of information from books, it is possible to obtain additional finance for business and working capital. On the basis of such information, lender can be provided any additional information along with various financial statements.
5) Trade Union:
On the basis of financial statement Trade union can insist like in Wages, Bonus etc.
6) Prospective Investors:
Prospective Investor can take investment decision by studying financial statements.
7) Comparative Study:
Financial statement of business enterprise may be compared over a period of years inter firm and can be compared with two or more business enterprise in same type of Business over period of years. This is known as inter firm comparison. Such comparison helps businessman to judge profitabilities and efficient of his business.
BOOK- KEEPING AND ACCOUNTANCY
Book-keeping and Accounting they are differ from each other. Book-keeping is mainly concern with recording of financial data relating to business operations in a significant and orderly manner. It is mechanical and repetitive.
Accounting is a broader and more analytical subject. It includes
the design of accounting system which book-keepers use to preparation of financial statement, audit, cost studies, Income tax, value added tax etc. Analysis and interpretation of accounting information for internal and external end users as on aid to making
business decision. Book-keeping provides the basis of accounting.

18
ACCOUNTING SYSTEM
There are two accounting system of keeping records.
Accounting System
Single Entry Double Entry System
System
Cash System Accrual System
Single Entry System:
The single entry system appears to be time saving and economical but it is unscientific, having number of defects. Under single Entry system only few personal accounts are kept, as nothings; Expenses / Income accounts are totally ignored. This system is followed by sole proprietor, having total control on cash as well as on goods. However this system is not generally followed by any trader.
Double Entry System:
The Double entry system is based on scientific principle and is used universally by most of business organisations. This system recognises the fact that every transaction has two aspects and records both aspects of each and every transaction. Every business transaction involves exchange of equal values or benefits. Exchange means the act of giving or receiving one thing in return of the other thing
or service or benefit. Thus every transaction has two aspects i.e. receiving and giving. The receiving aspect is also known as the incoming aspect (Debit) and going aspect is known as the outgoing aspect (credit).
Under double entry system books of accounts can be
maintained by either cash basis or accrual basis.
Cash System of Accounting
Under cash system of accounting entries are made only when
cash is received or paid. No entry is made when amount is due for receipts or payments. Income is received is accounted irrespective of period for which relates. Similarly expenses are restricted to the actual payments made in cash, during the current

19
period is immaterial whether the payments have been made for previous year or subsequent year.
The financial statement prepare under this system do not
present a true and fair view of Income, operating results of enterprise.
However it is suitable in following cases.
i) For very small business organisation.
ii) For individual to record his own transactions.
iii) For professionals like Doctors, Lawyers, Chartered Accountant etc.
In cash system financial statements are prepared on the basis of
Receipts and payments accounts.
Accrual System of Accounts
This is also known as mercantile system of accounts. Under this system business transactions are recorded as and when it take place
irrespectful of amount / cash received or paid. Income earned as well as expenses incurred are recorded related to the Particular period. The following are the essential features of accrual basis.
a) Revenue is recognised on it is earned irrespective of whether cash is received or not.
b) Costs are matched against revenues on the basis of relevant time period to determined periodic income.
c) Costs which are not charged to income are carried forward. Any
cost that lost its utility is written off as a loss.
ACCOUNT
An account is summarised record or statement of all
transactions relating to a particular person or to a Assets or liability or income or expense.
According to Kohler’s Dictionary for accounts, An account has
been defined as a formal record of a particular type of transaction expressed in money.
Each account is divided into two parts by the vertical line drawn
in the middle.
Dr. ...............Account Cr.
Date Particulars JF Amount Date Particulars JF Amount

20
The left hand side is termed as Debit (Dr.) side and the right hand side is termed as credit (cr.) side.
In order to keep full record of all the transactions the
business has to keep.
i) An account of each head of expenses or income earned by the
business and
ii) An account of each property which belongs to the business and
iii) An account of each party with whom business deals.
CLASSIFICATION OF ACCOUNTS :
Accounts are classified into two classes:
Personal Accounts
Impersonal Accounts
Impersonal Accounts are further sub divided into
1. Real Accounts
2. Nominal Accounts
3. Valuation Accounts
Thus all accounts can be classified into Personal, Real and
Nominal Accounts.
Personal Accounts:
These accounts show the transactions with customers, suppliers, Money lenders, the banks and the owner.
For example: Mohan’s A/c, Rajesh’s A/c, M/s XY and Co. Reliance Industries Ltd., Apna Bazar Co-operative Society Ltd., Mumbai University, Dena Bank etc.
Real Accounts:
Real accounts may be the following types.
a) Tangible real Accounts: These are accounts of such things which
are tangible i.e. which can be seen touched or felt physically. Example: Land, Building, Furniture, Cash etc.
b) Intangible real Accounts: These accounts represent such things
which cannot be touched, seen or felt physically.
Example: Goodwill, Trade marks, Patent right etc.
Nominal Accounts:

21
Nominal Accounts includes accounts of all expenses, losses, incomes and gains. Nominal Accounts represent only services or uses.
Valuation Accounts:
Valuation accounts are accounts open to adjust values of assets
e.g. provision for Depreciation, Stock Reserve, Provision for doubtful debt A/c.
Accounts
Relating to persons or Institutions decite Shinde A/c, Anil’s A/c, Sunil’s A/c, Bank A/c, University, School, Company Firm etc.
Relating to
Assets or property Examples: Land
& Building A/c, Cash A/c, Debtors A/c, Stock A/c, Goodwill A/c etc.
Relating to
expenses and Incomes. Examples: Salaries A/c, Rent A/c, Commission A/c, Discount A/c etc.
CHECK YOUR PROGRESS:
Draw the chart showing the classification of Accounts.
Define the following terms:
1. Account
2. Personal Accounts
3. Tangible Real Accounts
4. Valuation Accounts
5. Single Entry System
6. Accrual System of Account
7. Book Keeping
RULES OF DEBIT AND CREDIT :
The two sides of any account are arbitrarily distinguished. The left hand side of an Account is called Debit side and Right hand side is called the Credit side.
Impersonal A/c Personal A/c
Nominal A/cs Real A/cs
22
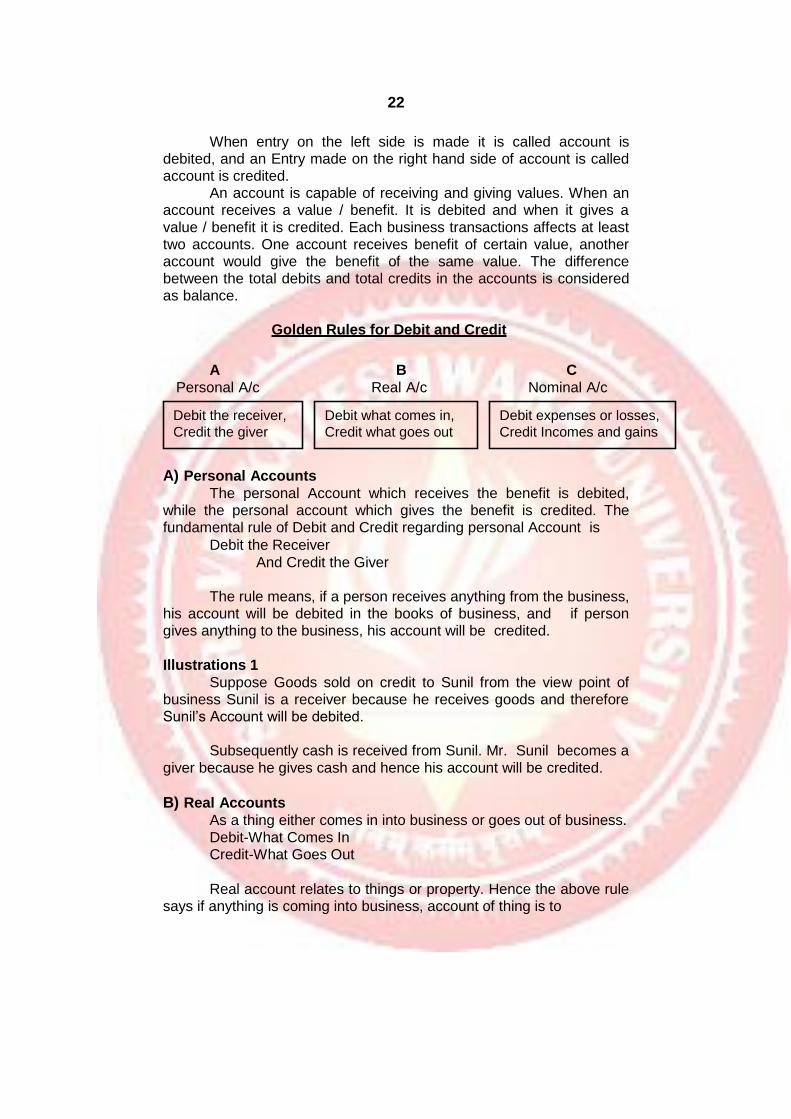
When entry on the left side is made it is called account is debited, and an Entry made on the right hand side of account is called account is credited.
An account is capable of receiving and giving values. When an account receives a value / benefit. It is debited and when it gives a
value / benefit it is credited. Each business transactions affects at least two accounts. One account receives benefit of certain value, another account would give the benefit of the same value. The difference between the total debits and total credits in the accounts is considered as balance.
Golden Rules for Debit and Credit
A B C
Personal A/c Real A/c Nominal A/c
A) Personal Accounts
The personal Account which receives the benefit is debited, while the personal account which gives the benefit is credited. The fundamental rule of Debit and Credit regarding personal Account is
Debit the Receiver
And Credit the Giver
The rule means, if a person receives anything from the business,
his account will be debited in the books of business, and if person gives anything to the business, his account will be credited.
Illustrations 1
Suppose Goods sold on credit to Sunil from the view point of business Sunil is a receiver because he receives goods and therefore Sunil’s Account will be debited.
Subsequently cash is received from Sunil. Mr. Sunil becomes a
giver because he gives cash and hence his account will be credited.
B) Real Accounts
As a thing either comes in into business or goes out of business.
Debit-What Comes In Credit-What Goes Out
Real account relates to things or property. Hence the above rule
says if anything is coming into business, account of thing is to
Debit the receiver,
Credit the giver
Debit what comes in,
Credit what goes out
Debit expenses or losses,
Credit Incomes and gains

23
be debited and anything is going out of business account of that thing is to be credited.
In the Illustration goods are sold to Mr. Sunil on credit. Goods
are going out of business and therefore ‘Goods A/c’ is to be credited
subsequently cash is received from Sunil. Cash is comes in therefore cash Account is to be debited.
C) Nominal Accounts
Being the accounts of losses and expenses or gains and
incomes. Debit Expenses and Losses Credit Incomes and Gains.
Dr. Nominal Accounts Cr.
The accounts of expenses or losses of the business are to be debited where as the accounts of Incomes or profits are to be credited Exp. Paid salaries.
Here Salary is on expenditure of the business and there fore
Salary account is to be debited.
In the transaction “Received Interest from A & Co” Interest is an
Income of the business and hence Interest Account is to be credited.
Illustration. 2
State the names of the accounts to be debited or credited in the
following transactions.
No. Transactions Name of
accounts affected
Classification
of account
Application
of the rules
Answers
1. Sujit
Commenced business with cash
Sujit’s
Capital A/c
Personal A/c Credit the
giver Credit
Cash A/c Real A/c Cash
comes in Debit what comes in
Debit
2. Purchased goods for cash
Goods A/c
Real A/c Goods are comes in
Debit
Credit Incomes and Gains
Interest Discount etc. Commission. Received Payment of Salary, rent loss
on sale of Assets. Bad Debts etc
Debit losses and expenses.

24
Cash A/c Real A/c Cash is goes out
Credit

25
3. Sold goods on credit to Mr. Avinash
Avinash’s A/c
Personal A/c Avinash is receiver
Debit
Goods A/c
Real A/c Goods are goes out
Credit
4. Cash received from Mr.
Avinash
Cash A/c Real A/c Cash comes In
Debit
Avinash’s A/c
Personal A/c Avinash is giver
Credit
5. Cash deposited into the Bank
Cash A/c Real A/c Cash goes out
credit
Bank A/c Personal A/c Bank is receiver
Debit
BOOKS OF ACCOUNTS :
A business organisations maintains three types books of
Accounts; namely,
Cash Book:
To record cash receipts and payments including receipts and Payments through Bank. A separate cash book is kept to record petty expenses.
Journal:
To record non cash transactions like credit sales, credit
purchases, Sales Returns, Purchase Returns. These Books are called Subsidiary books.
Ledger:
Ledger contains a classified summary of all transactions recorded in cash book and journal. All personal, Real and Nominal Accounts are prepared into the ledger.
Few additional books of account may be maintained as per
requirement of business organisation e.g. Stock Register, Members Register etc.

26
Ledger
For credit transaction Journal
For Cash transaction Cash Book
Balance Sheet Assets & Liabilities
Fund Flow Statement
A CONCEPTUAL FRAMEWORK OF FINANCIAL
ACCOUNTING :
Posted to
JOURNAL :
Meaning:
It is essential in a business to record each and every transaction immediately after it takes place. To record credit transaction a separate book, called ‘Journal’ is maintain, Journal can be defined as, ‘a subsidiary book in which all day-to-day
Financial Accounting
Principle : Double Entry System
Out put: Trial Balance
Adjustments
Profit & Loss A/c, Income & Expenditure
Out put
Cash Flow Statement
For Analysis

27
monetary transactions of business are recorded first as and when they take place in chronological order (i.e. date wise), in debit and credit form and in a systematic manner. Journal is also known as ‘Prime entry’ or ‘Original entry’ book. Because transactions are first entered in this book and then they are posted in the Ledger.
As Business transactions are numerous and large in size, the
Journal may be split up into number of separate Journals to record particular type of transaction. These journal are known as the subsidiary books. Some of the subsidiary books are:
i) Purchase Book
ii) Purchase Return Book
iii) Sales Book
iv) Sales Return Book
v) Bills Receivable Book
vi) Bills Payable Book
vii) Journal Proper
Necessity or Utility of Journal
1. Direct recording of transactions in the ledger may result in
committing errors and omissions and it would be difficult to correct them later on. Hence, Journal is necessary.
2. A complete record (i.e. Debit and credit aspects of each transaction) is available at one place.
3. As the transactions are recorded date wise, it facilitates quick and easy reference to any transaction, whenever necessary.
4. Narration to Journal entry explains the purpose of the entry and
helps in understanding the transaction recorded.
5. Entries in the ledger can be made at leisure by the clerk concerned according to his convenience.
6. Cross checking between Journal and Ledger is facilitated to check the accuracy.
7. As the entries in the Journal are made from basic documents
like invoices. Vouchers, receipts etc. The court considers the entries in the Journal as proof of transactions.

28
Specimen of Journal:
Date Particulars Voucher No.
LF Dr. Amt. (Rs.)
Cr. Amt. (Rs.)
Journalising: The act of recording a transaction in the Journal in
the form required is called Journalising.
How to Journalise the Transactions
1. First find out the two accounts involved in a transaction.
2. Ascertain the types of those accounts and then decide by applying rules of Debit and Credit as to which account is to be debited and which account is to be credited.
3. The name of the account is to be debited is to be written first under ‘Particulars’ column. It is written close to the first margin line and the name of the account to be credited is to be proceeded by the word “To” and is to be written on the Second line.
4. The amount involved in the transactions is written under the “Dr” and “Cr” columns against the names of debit and credit accounts respectively.
5. A brief explanation of the entry is given in the bracket just below the
entry. It is called “narration”.
6. A line is drawn below each Journal Entry from first margin line to the second margin line to keep the entries of the transaction separate from one another.
7. Ledger folio (L.F.): It means page number in the ledger. The page on which the particular account is opened in the “Ledger” is stated under “L.F.” column to facilite easy reference.
8. Date: The date of the transaction is written under the column “Date”.

29
Debit note and Credit note:
Debit Note:
When goods are received from the supplier, the Supplier
account is credited. When goods are returned from him the supplier account is debited, so in case of purchase returns a debit note is prepared. It should contain all the details of purchase returns. Generally
a debit note will be made in duplicate, one copy will be sent to the customer and other will be kept as office copy.
Credit Note:
It is a statement sent by the seller to his customer intimating
that, his account has been credited with the amount of goods return by him or any other allowances granted to him.
SOLVED PROBLEMS
Illustration 1
Journalise the following transactions in the books of “Ketan”. 2009 Jan. 1 Purchased goods from Nalini on Credit Rs. 1000/-. Jan. 2 Sold goods to Mr. Sharma on credit Rs. 2,500/- Jan. 3 Purchased furniture for cash Rs. 10,000/- Jan. 4 Received interest Rs. 800 Jan.
5 Paid salaries Rs. 3,500/-
After deciding the accounts to be debited and accounts to be credited the Journal Entries are passed as shown below.
In the Books of Ketan
Journal Entreis
Date Particulars L.F. Dr. Rs.
Cr. Rs.
2009
Jan.1 Purchases A/c .................. Dr.
To Nalini’s A/c
(Being goods purchased on
credit from Nalini)
1,000
1,000
2 Mr. Sharma’s A/c .............. Dr.
To Sales A/c
(Being goods sold on credit to
Mr. Sharma)
2,500
2,500
3 Furniture A/c ..................... Dr.
To Cash A/c
(Being furniture purchased for
Cash)
10,000
10,000

30
4 Cash A/c ........................... Dr.
To Interest A/c
(Being interest received)
800
800
5 Salaries A/c ...................... Dr.
To Cash A/c (Being
Salaries paid)
3,500
3,500
Total 17,800 17,800
Illustration 2
Journalise the following transactions in the books of Shri. More. 2009
Dec. 1 Shri More started business with cash Rs. 15000.
2 Purchased goods from Mr. Singh Rs. 30,000 3
Deposited cash into the Bank Rs. 4,000
4 Sold goods to Mr. Gujar Rs. 2,500
5 Purchased furniture of Rs. 2,500 from furniture and Co. 6
Paid to Mr. Singh by cheque Rs. 1,000
7 Received a cheque from Mr. Gujar Rs. 1,200 8
Paid Interest Rs. 450
9 Withdraw cash Rs. 3,000 for personal use
10 Cheque received from Mr. Gujar Deposited into the Bank. 11
Returned goods to Mr. Singh Rs. 500
12 Received goods returned by Mr. Gujar Rs. 300
13 Paid salary by cheque Rs. 4,000
14 Received a cheque for rent Rs. 900. The cheque is deposited
into the Bank.
15 Withdraw cash Rs. 3,000 from Bank for office use.
16 Returned Furniture of Rs. 400 to Furniture and company.
In the books of Shri. More.
Journal Entries
Date Particulars L.F. Dr. Rs.
Cr. Rs.
2009
Dec.1 Cash A/c ............................ Dr.
To Capital A/c
(Being started business with
cash)
15,000
15,000
2 Purchases A/c .................... Dr
To Mr. Singh’s A/c
(Being credit purchases from Mr.
Singh)
30,000
30,000

31
3 Bank A/c ............................ Dr.
To Cash A/c
(Being Cash deposited in the
bank)
4,000
4,000
4 Gujar’s A/c ........................ Dr.
To Sales A/c
(Being goods sold on credit to
Mr. Gujar)
2,500
2,500
5 Furniture A/c ....................... Dr.
To Furniture & Co. A/c
(Being furniture purchased on
credit)
2,500
2,500
6 Singh’s A/c......................... Dr.
To Bank A/c
(Being issued a cheque to Mr.
Singh)
1,000
1,000
7 Cash A/c ............................ Dr.
To Mr. Gujar’s A/c
(Being Cheque received from
Mr. Gujar)
1,200
1,200
8 Interest A/c .......................... Dr.
To Cash A/c (Being
Interest paid)
450
450
9 Drawings A/c ....................... Dr.
To Cash A/c
(Being Mr. More withdraw
cash for personal use)
3,000
3,000
10 Bank A/c ............................. Dr.
To Cash A/c
(Being cheque deposited into
the Bank)
1,200
1,200
11 Mr. Singh’s A/c ................. Dr.
To Purchase Return A/c
(Being Goods returned to Mr.
Singh)
500
500
12 Sales Return A/c ................. Dr.
To Mr. Gujar’s A/c
(Being Goods returned by
Mr. Gujar)
300
300
13 Salaries A/c ....................... Dr.
To Bank A/c
(Being cheque issued for
Salaries)
4,000
4,000

32
14
15
16
Bank A/c ........................... Dr.
To Rent A/c
(Being a cheque from the subtenant in payment of Rent and the cheque is deposited into the Bank)
900
3,000
400
900
3,000
400
Cash A/c ........................... Dr.
To Bank A/c
(Being cash withdrawn from
Bank for office use)
Furniture and Co’s A/c ........ Dr.
To Furniture A/c (Being
Furniture returned to
Furniture and Co’s A/c)
Total 69,950 69,950
The students will note that the total Debits is always equal to total of credits.
The entries in which there are more than one debit or more than
one credit are called compound Entries.
Illustration 3
Journalise the following transactions in the books of Mr. Ashok. March, 2009
March 1 Mr. Ashok commenced business with Rs. 10,000 of his own and Rs. 5,000 borrowed from his friend Pramod.
2 Opened a current account in the Bank of Maharashtra by depositing Rs. 4000.
3 Purchased goods worth Rs. 3,000 from Anil and Co. subject to the 2% Trade Discount.
4 Credit Sales of Rs. 4,000 to Mr. Desai.
5 Cash Sales of Rs. 6,000 to Mr. Kulkarni.
6 Purchased furniture costing Rs. 4,000 of which furniture of
Rs. 600 was for residential use of Mr. Ashok.
7 Received cash from Mr. Desai Rs. 3,800 and he was allowed cash discount Rs. 200.
8 Cash purchases of Rs. 1,000 paid carriage Rs. 300.
8 Withdrew from Bank Rs. 2,000 for office use.
10 Returned goods to Anil and Co. Rs. 100.

33
15 Paid cash to Anil & Co Rs. 980, who allowed us discount Rs. 20.
16 Received a cheque for Rs. 300 in exchange of cash from
Raju.
18 Received Interest from M/s Shah and Sons Rs. 800. 20
Sale og goods to Kadam Rs. 500.
21 Distributed goods of Rs. 500 as free samples.
22 Goods of Rs. 500 were used by Ashok for his private purposes.
25 Paid Rs. 400 to Manan on behalf of our creditor, Anil and co.
30 Our debtor Ketan paid our office Rent Rs. 800.
30 Received goods returned by Kadam Rs. 100.
31 Ashok brought into business sale proceeds of his personal Furniture Rs. 7,000.
31 Invested Rs. 10,000 in the shares of ABB Co. Ltd. 31
Received Rs. 360 in full settlement of Kadam dues.
In the Books of Ashok
Journal
Date Particulars L.F. Dr. Rs.
Cr. Rs.
2009
Mar. 1 Cash A/c ............................ Dr.
To Pramod Loan A/c To
Capital A/c
(Being Ashok Started business
with cash Rs. 10,000 of his own and Rs. 5,000 borrowed from Pramod)
15,000
10,000
5,000
2 Bank of Maharashtra A/c Dr.
To Cash Ac
(Being Cash is deposited into
Bank)
4,000
4,000
3 Purchases A/c ................... Dr.
To Anil and Co’s A/c
(Being Purchased goods from Anil
& Co.)
2,940
2,940
4 Mr. Desai’s A/c .................. Dr.
To Sales A/c
(Being goods Sold on credit)
4,000
4,000

34
5 Cash A/c ............................. Dr.
To Sales A/c
(Being goods Sold for cash)
6,000
6,000
6 Furniture A/c ....................... Dr.
Drawings A/c ...................... Dr.
To cash A/c
(Being Furniture purchased for
office use and personal use)
3,400
600
4,000
8 Cash A/c ............................. Dr.
Discount A/c ....................... Dr.
To Mr. Desai’s A/c
(Being cash received from Mr.
Desai)
3,800
200
4,000
8 Purchases A/c ..................... Dr.
Carriage A/c ........................ Dr.
To Cash A/c
(Being Goods purchased for cash and carriage paid thereon)
1,000
300
1,300
9 Cash A/c ............................. Dr.
To Bank A/c
(Being cash withdrawn from
Bank)
2,000
2,000
10 Anil and Co’s A/c ................. Dr.
To Goods A/c (Pur. Return)
(Being Goods returned to Anil and
Co.)
100
100
15 Anil and Co’s A/c ................. Dr.
To Cash A/c
To Discount A/c
(Being cash paid to Anil and Co and received discount from him)
1,000
980
20
18 Cash A/c ................................ Dr.
To Interest A/c
(Being interest received from
Shah and Co.)
800
800
20 Kadam’s A/c .......................... Dr.
To Sales A/c
(Being goods sold for credit to
Kadam)
500
500

35
21 Advertisement A/c.................. Dr.
To Goods A/c
(Being Goods distributed as
free samples)
500
500
22 Drawings A/c ........................ Dr.
To Goods A/c
(Being Goods withdrawn by
proprietor for personal use)
500
500
25 Anil and Co’s A/c ................. Dr.
To Cash A/c
(Being cash paid to Manan of
behalf of Anil and Co’s A/c)
400
400
30 Rent A/c ................................. Dr.
To Ketan’s A/c
(Being Ketan paid rent behalf of
us)
800
800
30 Goods A/c / Sales Return A/c
...... Dr.
To Kadam’s A/c
(Being Goods returned by
Kadam)
100
100
31 Cash A/c ............................. Dr.
To Capital A/c
(Being Proprietor introduced
additional capital into the
business)
7,000
7,000
31 Investment’s / Shares A/c Dr.
To Cash A/c
(Being investment made in
shares of ABB Co. Ltd)
10,000
10,000
31 Cash A/c ............................... Dr.
Discount A/c ......................... Dr.
To Kadam’s A/c
(Being cash received from Kadam and allowed him to Discount)
360
40
400
Total 65,340 65,340
Note: Transaction dated 16 march, 2009 does not require Journal
Entry as cash exchanged for a cheque. It is not a transaction.

36
Illustration 4
Journalise the following transactions in the books of Dhawal 2008.
Rs.
Mar. 2 Commenced business with cash 2,50,000
4 Purchased furniture for cash 20,000
4 Cash purchases 1,45,000
5 Deposited with bank 30,000
6 Bought from Z 40,000
Sold to Natu for cash 14,300
7 Stationery purchased 1,050
7 Bought from Mona 20,000
7 Sold to Rakesh 8,000
9 Rent for two years paid in advance 14,000
9 Drawings by the proprietor for household
Expenses
Goods taken out by the proprietor for
4,000
domestic use 1,500
9 Cash withdrawn from Bank 25,000
10 Sold to A & Co on credit 9,000
11 Purchases made, payment through cheque 2,900
14 Cash received from Z on account 10,000
14 Cash paid to Mona after deduction of
discount Rs. 130
3,870
17 Cash received from A & Co. in full
settlement of his account 8,750
28 Purchase of office furniture 40,000
30 Sold goods to Agarwal for cash 8,000
Sold to Nana 3,000
31 Cartage paid in cash 150
Solution:
Journal in books of Dhawal
Date Particulars L.F. Dr. Rs.
Cr. Rs.
2008
Mar. 2 Cash A/c ....................... Dr.
To Capital A/c
(For cash brought in by
proprietor as his capital)
2,50,000
2,50,000
4 Furniture A/c ................. Dr.
To Cash A/c
(For purchase of furniture for
cash)
20,000
20,000

37
4 Purchases A/c............... Dr.
To Cash A/c
(For purchase of goods in
trade for cash)
1,45,000
1,45,000
5 Bank A/c ......................Dr.
To Cash A/c
(For cash deposited in bank)
30,000
30,000
6 Purchases A/c............... Dr.
To Z’s A/c
(Goods purchased from Z on
credit)
40,000
40,000
6 Cash A/c ....................... Dr.
To Sales A/c
(For cash sales made to Natu)
14,300
14,300
7 Stationery A/c ............... Dr.
To Cash A/c
(For purchase of stationery for
cash)
1,050
1,050
7 Purchases A/c............... Dr.
To Mona’s A/c
(For credit purchases of goods to
Mona)
20,000
20,000
7 Rakesh’s A/c ..........................Dr.
To Sales A/c
(For credit sales of goods to
Rakesh)
8,000
8,000
9 Rent paid in Advance A/c ..Dr.
To Cash A/c
(For rent paid in advance)
14,000
14,000
9 Drawings A/c ................ Dr.
To Cash A/c
To Purchases A/c
(For drawings in cash and
goods made by the proprietor)
5,500
4,000
1,500
9 Cash A/c ....................... Dr.
To Bank A/c
(For cash withdrawn from
Bank)
25,000
25,000
10 A & Co’s A/c ................. Dr.
To Sales A/c
(For sales to Mathur on credit)
9,000
9,000

38
11 Purchases A/c............... Dr.
To Bank A/c
(For purchases of goods, payment made by means of cheque)
2,900
2,900
14 Cash A/c ....................... Dr.
To Z’s A/c
(For cash received from Z)
10,000
10,000
14 Mona’s A/c ............................ Dr.
To Cash A/c
To Discount A/c
(For cash paid to Mona and
discount received from him)
4,000
3,870
130
17 Cash A/c ....................... Dr.
Discount A/c ................. Dr.
To A & Co. A/c
(For cash received from A & Co.
and discount allowed)
8,750
250
9,000
28 Furniture A/c ......................... Dr.
To Cash A/c
(For purchase of a scooter)
40,000
40,000
30 Cash A/c ....................... Dr.
Nana A/c ...................... Dr.
To Sales A/c
(For sales made in cash and
Nana on credit on this day)
8,000
3,000
11,000
31 Cartage A/c ................... Dr.
To Cash A/c (Cartage
paid)
150
150
Illustration 5
Shri Sona started his business with cash Rs. 35,000 and furniture of Rs. 5,000 on 1st April 2009.
April. 4 Paid cash into Bank Rs. 10,000
6 Purchased furniture and issued a cheque Rs. 4,000.
8 Credit purchases from Ketan Rs. 20,000 less 5% trade
discount.
14 Returned goods to Ketan Rs. 400 19
Cash Sales Rs. 10,000
39
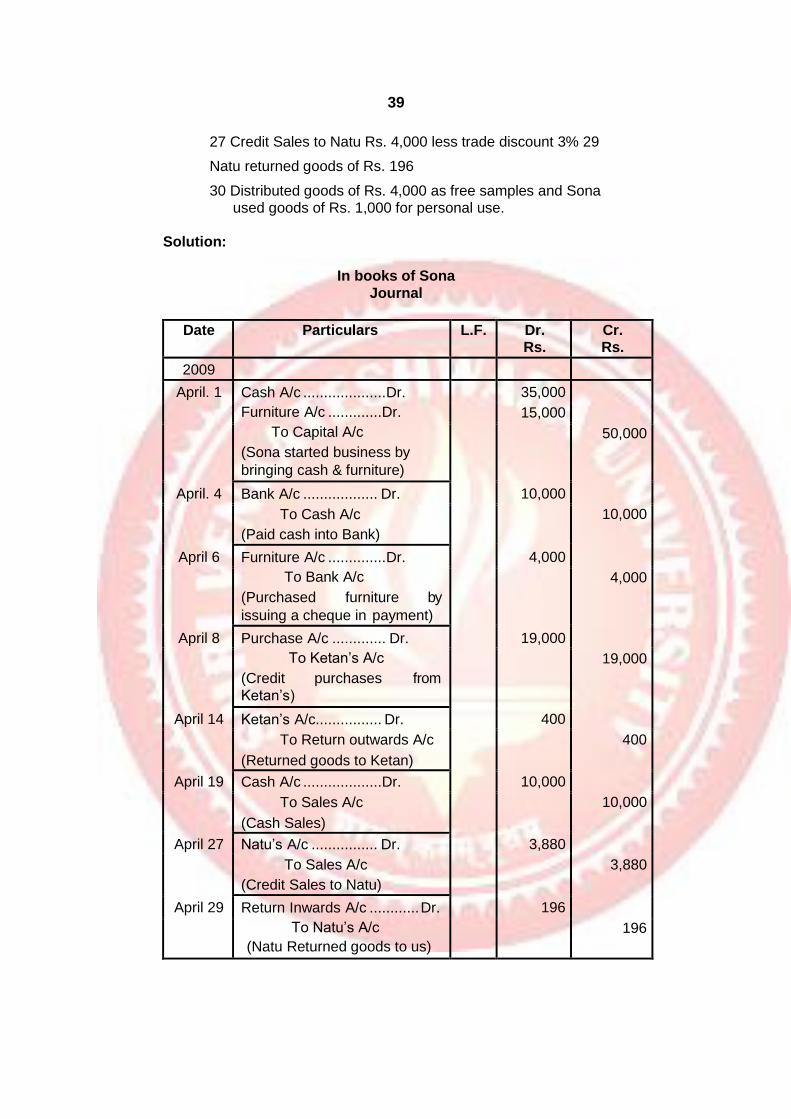
27 Credit Sales to Natu Rs. 4,000 less trade discount 3% 29
Natu returned goods of Rs. 196
30 Distributed goods of Rs. 4,000 as free samples and Sona used goods of Rs. 1,000 for personal use.
Solution:
In books of Sona
Journal
Date Particulars L.F. Dr. Rs.
Cr. Rs.
2009
April. 1 Cash A/c .................... Dr.
Furniture A/c .............Dr.
To Capital A/c
(Sona started business by
bringing cash & furniture)
35,000
15,000
50,000
April. 4 Bank A/c .................. Dr.
To Cash A/c
(Paid cash into Bank)
10,000
10,000
April 6 Furniture A/c .............. Dr.
To Bank A/c
(Purchased furniture by
issuing a cheque in payment)
4,000
4,000
April 8 Purchase A/c ............. Dr.
To Ketan’s A/c
(Credit purchases from
Ketan’s)
19,000
19,000
April 14 Ketan’s A/c................ Dr.
To Return outwards A/c
(Returned goods to Ketan)
400
400
April 19 Cash A/c ...................Dr.
To Sales A/c
(Cash Sales)
10,000
10,000
April 27 Natu’s A/c ................ Dr.
To Sales A/c
(Credit Sales to Natu)
3,880
3,880
April 29 Return Inwards A/c ............ Dr.
To Natu’s A/c
(Natu Returned goods to us)
196
196

40
April 30 Advertisement A/c ...............Dr.
Drawings A/c
To Purchases A/c
(Distributed goods as free
samples & Madhav took goods for personal use)
4,000
1,000
5,000
EXERCISE
Theory Questions
1. Explain term ‘Book Keeping.
2. What is Account?
3. Distinguish between:
a) Book-keeping and Accountancy
b) Personal Accounts and impersonal Accounts
c) Real Accounts and Nominal Accounts
d) Single Entry system and Double Entry system
e) Cash system of Accounts and Accrual system of Accounts.
4. Discuss the principles of debit and credit of Accounts.
5. Explain Journal & its utility.
6. “By sub-division of journal, there will be a division of labour”. Explain.
Practical Problems
1) Journalise the following transactions in the books of Ram for the month of March 2010.
March 1 Ram commenced business with cash Rs. 60,000.
2 Purchased furniture for Rs. 5,000.
4 Purchased goods for cash Rs. 2,000.
7 Bought goods from M/s. Raj & Co. for Rs. 4,000. 10
Sold goods costing Rs. 3,000 on cash.
15 Purchased stationery for office use Rs. 1,000.
19 Received cash Rs. 1,250 from Mr. Ketan in full settlement of his account for Rs. 1,500.
20 Paid salaries by cheque Rs. 1,500.
25 Introduced additional capital Rs. 20,000.
27 Paid to Raj Rs. 3,250 in full settlement of Rs. 3,500 29
Sold goods for Rs. 15,000 to Mr. Dohi.
31 Deposited Rs. 3,000 into the Bank.
41
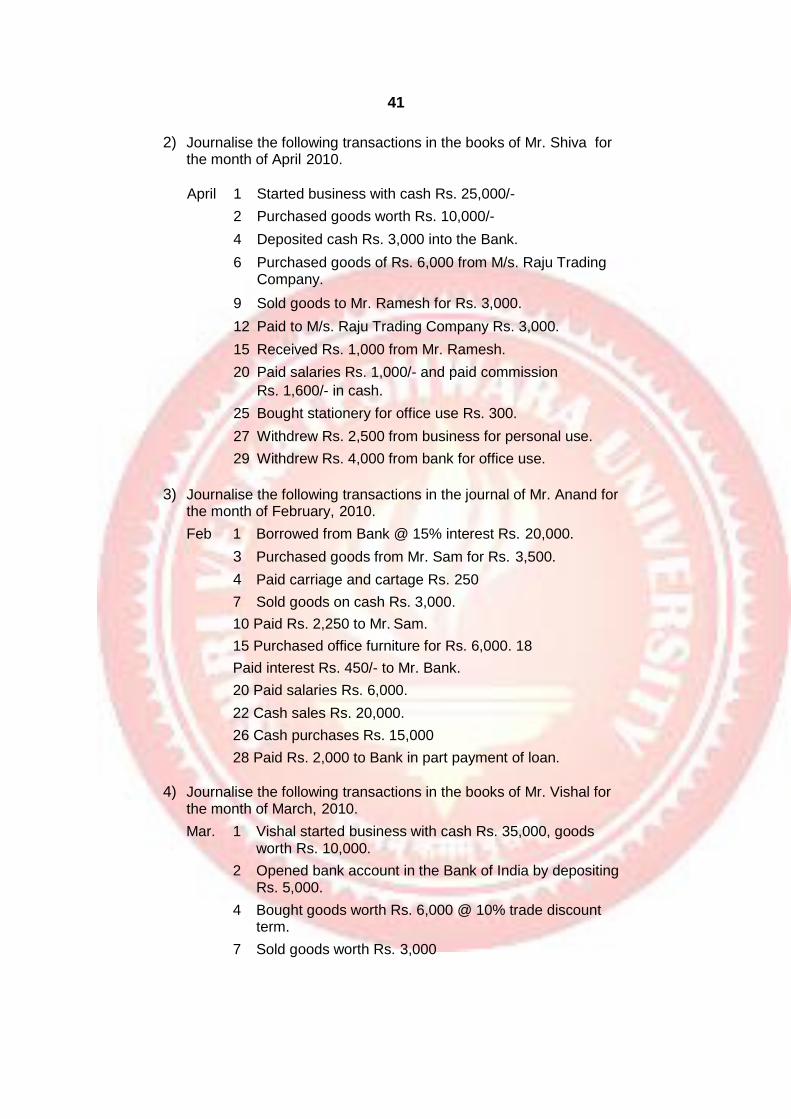
2) Journalise the following transactions in the books of Mr. Shiva for the month of April 2010.
April 1 Started business with cash Rs. 25,000/-
2 Purchased goods worth Rs. 10,000/-
4 Deposited cash Rs. 3,000 into the Bank.
6 Purchased goods of Rs. 6,000 from M/s. Raju Trading Company.
9 Sold goods to Mr. Ramesh for Rs. 3,000.
12 Paid to M/s. Raju Trading Company Rs. 3,000.
15 Received Rs. 1,000 from Mr. Ramesh.
20 Paid salaries Rs. 1,000/- and paid commission
Rs. 1,600/- in cash.
25 Bought stationery for office use Rs. 300.
27 Withdrew Rs. 2,500 from business for personal use.
29 Withdrew Rs. 4,000 from bank for office use.
3) Journalise the following transactions in the journal of Mr. Anand for the month of February, 2010.
Feb 1 Borrowed from Bank @ 15% interest Rs. 20,000.
3 Purchased goods from Mr. Sam for Rs. 3,500.
4 Paid carriage and cartage Rs. 250
7 Sold goods on cash Rs. 3,000.
10 Paid Rs. 2,250 to Mr. Sam.
15 Purchased office furniture for Rs. 6,000. 18
Paid interest Rs. 450/- to Mr. Bank.
20 Paid salaries Rs. 6,000.
22 Cash sales Rs. 20,000.
26 Cash purchases Rs. 15,000
28 Paid Rs. 2,000 to Bank in part payment of loan.
4) Journalise the following transactions in the books of Mr. Vishal for the month of March, 2010.
Mar. 1 Vishal started business with cash Rs. 35,000, goods worth Rs. 10,000.
2 Opened bank account in the Bank of India by depositing Rs. 5,000.
4 Bought goods worth Rs. 6,000 @ 10% trade discount term.
7 Sold goods worth Rs. 3,000

42
9 Purchased furniture of Rs. 4,000 for office use and furniture of Rs. 1,000 for home use.
14 Withdrawn goods of Rs. 1,000 for self use.
17 Received Rs. 2,400 from Mr. Ravindra in full
settlement of Rs. 2,450.
19 Paid salaries Rs. 500 to office clerk and paid electricity
bill of Rs. 750 in cash.
24 Paid Mr. Raj Rs. 1,960 in full settlement of Rs. 2,000. 26
Paid insurance premium of Rs. 1,200 on the life of Mr.
Vishal, a proprietor.
29 Cash sales Rs. 3,000.
30 Withdrew Rs. 4,000 from bank for office use.
5) Draft journal entries for the business transactions given below. Apr.
1 Mr. Atul started business with cash Rs. 5,000/-, goods
Rs. 7,500 and furniture Rs. 2,500/-
3 Purchased goods worth Rs. 4,500 from Mr.
Kamalakar.
5 Cash sales Rs. 6,000
8 Purchased stationery for office use Rs. 500.
10 Paid to Mr. Kamalakar Rs. 4,350 in full settlement of Rs. 4,500.
13 Deposited Rs. 1,000 into the Bank. 16
Received Rs. 500 from Mr. Kiran.
19 Withdrawn Rs. 200 from business for self use.
23 Paid Rs. 150 for commission and paid Rs. 450 for rent.
27 Paid wages Rs. 600 in cash, and paid sundry expenses Rs. 200/- by cheque.
29 Borrowed Rs. 5,000 from wife for business purpose.
30 Cash purchases Rs. 1,000.

43
3
ELEMENT OF BOOK-KEEPING, JOURNAL, CASH AND BANK BOOK-II
Unit Structure:
Objectives
Cash Book Cash Discounts Petty Cash Book Three Column Cash Book Exercises
OBJECTIVES
After studying the unit the students will be able to:
Know the Meaning of Cash book.
Understand the meaning of Cash discount and effect of cash discount.
Understand the types of Cash Book.
Record the transactions in the Cash Book.
CASH BOOK
This records all receipts of and payments in cash. Usually the
deposits into bank accounts maintained by the business, withdrawals from such accounts and cheques payments are also recorded in the Cash Book. Sometimes a separate book for recording receipts and payments by cheques / DDs etc., is kept known as the Bank Book. A Cash Book which is used to record both cash and bank transactions is
referred to as a Two-column Cash Book. The format of this cash book is given below:

44
Illustration 1 Cash Book of Anand & Co.
Dr. Cr.
Date
Receipts Ledger Folio
Cash
Bank
Date
Payments Ledger Folio
Cash Bank
2008
2008
July
1
To Balance b/f
11,5
00
13,000
July
2
By Wages
150
6 To Sales 1,800
5 By Electricity
800
7 To Z & Co. 7,000 8 By Salaries 4,400
11
30
To R.K.
Corporation To
Sales
2,500
2,000 15
22
By O Ltd
By Plant
4,000
11,200
31 By Balance c/f
7,250 10,000
15,800
22,000
15,800
22,000
CASH DISCOUNTS
Sometimes, in order to encourage early payments due from
customers, a company may offer a certain percentage of the amount as a discount. For example, if a customer owes the company Rs. 11,000, the company may allow 3% discount if the payment is made before a certain date. In such a case, the customer would pay an
actual cash of Rs. 10,670 only (Rs. 11000-3% of Rs. 11,000) and Rs. 330 would be treated as discount expense by the company. A cash discount may be distinguished from a trade discount which is given on the invoice price, especially when orders for large quantities are placed. The trade discount is therefore reflected as a reduction in the sale price itself. Therefore Trade discount not recorded in books of
Accounts.
A cash book can also be used to record the cash discounts that
are allowed to customers for prompt payments and the cash discounts that are earned on payments made to suppliers within a stipulated time
period. Since discounts will be allowed to customers at the time of receipt of money and received from suppliers at the time of payment of dues, it is convenient to maintain the column for discounts allowed on the receipts side of the cash book and the column for discounts received on the payments side. A cash book in which the cash and bank transactions and the details of cash discounts are recorded is
referred to as a Three-column cash book. An illustrative format of this type of cash book is given below:

45
Illustration 2
Cash Book of Anand & Co.
Dr. Cr.
Date
Receipts Discount allowed
Cash
Bank Date
Payments Discount received
Cash Bank
2010
2010
April
1
To Balance b/f
11,50
0
6,50
0
April
1
By Salaries
6,200
6 To Sales 8,000 3 By Wages 2,500
7 To Z & Co. 100 10,000
5 By Printing 4,000
11 To Balu Corpn.
100 600 22,350
8 By Repairs
4,000
20 To Sales 1,500 15
20
By K Ltd
By Drawings
100 12,700
1,000
10,900
4,000
30 By Balance c/f
1,40
0 13,750
200 21,600
38,850
100 21,600
38,850
Illustration: 3
Enter the following transactions in simple cash book.
April, 2010
1 Started business with Cash Rs. 50,000 3
Made Cash purchases Rs. 8,000
4 Made Cash Sales Rs. 12,000
6 Purchased furniture Rs. 4,000
7 Received Cash from Mr. Kulkarni Rs. 8,000 8
Paid Salaries Rs. 5,000
46
Cash Book Dr. Cr.
Date
Particulars V. No.
JF No
Rs. Date
Particulars V. No.
JF No
Rs.
2010
2010
April, Apri
l,
1 To Capital A/c
50,000
3 By Purchases A/c
8,000
4 To Sales A/c 12,000
6 By Furniture A/c
4,000
7 To Kulkarni’s A/c
8,000 8 By Salaries A/c
5,000
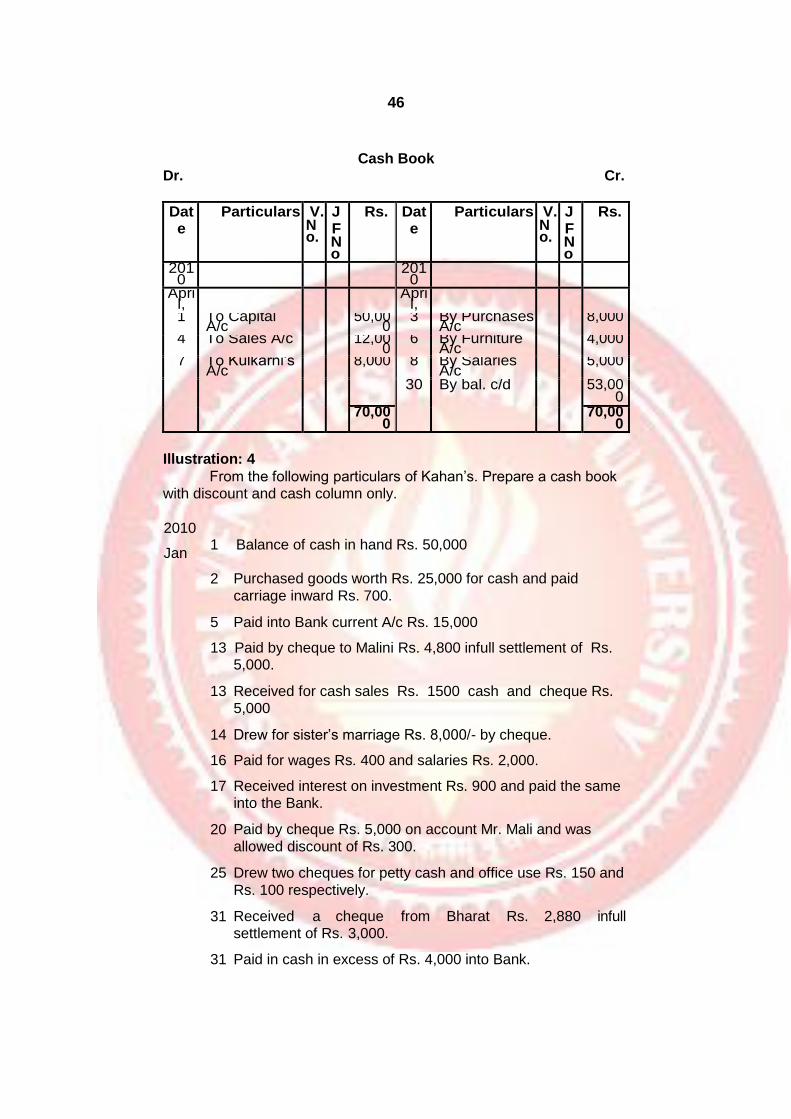
30 By bal. c/d 53,000
70,000
70,000
Illustration: 4
From the following particulars of Kahan’s. Prepare a cash book with discount and cash column only.
2010
Jan
1
Balance of cash in hand Rs. 50,000
2 Purchased goods worth Rs. 25,000 for cash and paid
carriage inward Rs. 700.
5 Paid into Bank current A/c Rs. 15,000
13 Paid by cheque to Malini Rs. 4,800 infull settlement of Rs. 5,000.
13 Received for cash sales Rs. 1500 cash and cheque Rs. 5,000
14 Drew for sister’s marriage Rs. 8,000/- by cheque.
16 Paid for wages Rs. 400 and salaries Rs. 2,000.
17 Received interest on investment Rs. 900 and paid the same into the Bank.
20 Paid by cheque Rs. 5,000 on account Mr. Mali and was
allowed discount of Rs. 300.
25 Drew two cheques for petty cash and office use Rs. 150 and
Rs. 100 respectively.
31 Received a cheque from Bharat Rs. 2,880 infull settlement of Rs. 3,000.
31 Paid in cash in excess of Rs. 4,000 into Bank.

47
Solution: Cash Book
Receipts Payments
Date Particulars R. No
LF No
Dis. Rs. Cash
Date Particulars R. No.
2010 2010
Jan.1 To bal b/d - 50,000 Jan. 2 By Purchases A/c
13 To Sales A/c - 6,500 By Carriage Inward A/c
15 To Bank A/c - 4,800 5 By Bank A/c
14 To Bank A/c - 8,000 13 By Malini’s A/c
17 To Interest A/c - 900 14 By Drawings A/c
20 To Bank A/c - 5,000 16 By Wages A/c
25 To Bank A/c - 250 By Salaries A/c
31 To Bharat’s A/c 120 2,880 17 By Bank A/c
20 By Mali A/c
25 By Petty Cash
31 By Bank A/c
By Bal c/d
120 73,530

48
PETTY CASH BOOK
When the petty cash fund is operated as an imprest fund, the recording of the petty expenses paid will be made in the petty cash
book. This would also avoid recording too many small value transactions in the main cash book. The petty cash book would contain a number of analytical columns for grouping the various expenses under a few classifications which would facilitate subsequent posting into the General Ledger. A specimen petty cash book is given below:
Illustration 1:
Analytical Petty Cash Book of Anand & Co.
Amo
unt
Recei
ved
Date Particulars
Tota
l
Amo
unt
paid
Postage &
Telegrams
Printin
g &
Statio
nery
Carriage
Travel
ing
Expen
ses
Sund
ry
Expen
ses
2010
April, 1 To Bank A/c
(Cheque
encashed)
By Postal
stamp
s By
Statione
ry By
Carriag
e
By Auto fare
of
salesman
By
Telegra
ms By
Carriage
By
Stationer
y
By Balance c/d
3000
April, 7 190 190
April, 10
232 232
April, 15
616 616
April, 20
400 400
April, 22
10 10
April, 27
110 110
April, 30
206 206
1764 200 438 616 400 110
April, 30
1236
3000
3000
2010 1236 May, 1
1764 May, 1

49
To
Balance
b/d To
Bank A/c
(Cheque encashed)
Separate Petty Cash A/c is open in Ledger & total Exp. credited
to Petty Cash A/c. Individual expenses total is debited to concerned expenses A/c in the Ledger.
THREE COLUMN CASH BOOK
Cash book with Discount, cash and bank column is known as
three column cash-book. In this cash book along with cash transactions banking transactions are also recorded.

50
Dr. Receipts Cash book Payments Cr.
Date
Particulars
R No.
LF No.
Disc ount
Cash Rs.
Bank Rs
Date
Particulars
R No.
LF No.
Disc ount
Cash Rs.
Bank Rs
Journal Entries for cash and Banking Transactions
Accounting Entry
1) Investment of capital in cash by proprietor Cash A/c ............. Dr.
To Capital A/c
2) Sale of goods on cash basis Cash A/c .............. Dr.
To sales A/c
3) Receipt of Income in cash Cash A/c .............. Dr.
To Income A/c
4) Cash deposited in to the Bank Bank A/c.............. Dr.
To Cash A/c
5) Cash withdrawn from Bank for office use Cash A/c ............ Dr.
To Bank A/c
6) Sale of goods and amount received by
Cheque and same cheque is deposited into
Bank immediately.
Bank A/c.............. Dr.
To Sales A/c
7) When bearer cheque is received from outside party.
Cash A/c ............. Dr.
To Party’s A/c
8) When order or crossed cheque received from
outside party. Bank A/c.............. Dr.
To Party’s A/c
9) When cheque received from outside Party
and deposited in into the bank on the same
day
Bank A/c.............. Dr.
To Party’s A/c
10) Cheque received on earlier day and
deposited to day Bank A/c.............. Dr.
To Cash A/c
11) Cheque issued to other Party Dishonoured Bank A/c ............... Dr.
To Party’s A/c
12) When customer directly deposits the amount into the Bank
Bank A/c.............. Dr.
To Customers A/c

50
13) When bank collects our income and deposit
into our account
Bank A/c............... Dr.
To Incomes A/c
14) Cheque received, deposited and then
dishonoured
Party’s A/c ............. Dr.
To Bank A/c
15) Purchase of goods on cash basis / cash
purchase
Purchases A/c ....... Dr.
To Cash A/c
16) Payment of expenses in cash Expenses A/c ........Dr.
To Cash A/c
17) Entry for Bank charges and commissions Bank charges A/c..Dr.
Commission A/c ..Dr
To Bank A/c
18) Transfer of amount from current A/c to Fixed
Deposit or savings A/c Fixed Deposit A/c .Dr
Savings A/c ...........Dr.
To Bank A/c
19) When cheque is issued to outside Party Party’s A/c ............ Dr.
To Bank A/c
Illustration 2:
During January 2010 Ram transacted the following business:
2010 Jan
Rs.
1. Commenced business with cash 20,000
2. Purchased goods on credit from Nadu. 1,00,000
3. Purchased goods for cash 4,000
4. Paid Gopal an advance for goods ordered 10,000
5. Received cash from Maruti as advance for 6,000
goods ordered by him
6. Purchased furniture, office use for cash 2,000
7. Paid Rent 1,000
8. Received commission (in cash) 1,600
9. Goods returned to Nadu 2,000
10. Goods sold to Kishore 10,000
11. Paid for postage and telegrams 200
13. Goods returned by Kishore 2,000
14. Purchase furniture (amount cheque paid) 16,000
15. Paid for stationery 1,200
18. Paid into Bank 5,000

51
20. Goods sold for cash 27,750
22. Bought goods for cash 3,000
25. Paid salaries by cheque 3,200
28. Paid rent 1,000
31. Drew cash for personal use 4,000
31. Deposited cash into Bank 12,000
Journal Entries in the books of Ram
Date Particulars L.F. Dr. Rs.
Cr. Rs.
2010
Jan. 1 Cash A/c .................... Dr.
To Ram’s Capital A/c
(Being the cash brought into
business as capital)
20,000
20,000
Jan. 2 Purchase A/c ............. Dr.
To Nandu’s A/c
(Being the goods purchased
on credit)
1,00,000
1,00,000
Jan. 3 Purchases A/c ............ Dr.
To Cash A/c
(Being the goods purchased
for cash)
4,000
4,000
Jan. 4 Gopal A/c ................... Dr.
To Cash A/c
(Being the amount paid to
Gopal)
10,000
10,000
Jan. 5 Cash A/c .................... Dr.
To Maruti A/c
(Being the cash received
from Maruti)
6,000
6,000
Jan. 6 Furniture A/c .............. Dr.
To Cash A/c
(Being the furniture purchased
for office use for cash)
2,000
2,000
Jan. 7 Rent A/c .................. Dr.
To Cash A/c (Being
the wages paid)
1,000
1,000

52
Jan. 8 Cash A/c .................... Dr.
To Commission Received A/c
(Being the commission
received)
1,600
1,600
Jan. 9 Nandu A/c .................. Dr.
To Purchase return A/c
(Being goods returned to
Nandu)
2,000
2,000
Jan. 10 Kishore A/c ............... Dr.
To Sales A/c
(Being goods sold to Kamal on
credit)
10,000
10,000
Jan. 12 Postages & Telegrams A/c..Dr
To Cash A/c
(Being the amount paid for
postages & Telegrams)
200
200
Jan. 13 Sales returns A/c ...Dr.
To Kishore’s A/c
(Being the goods returned by
Kamal)
2,000
2,000
Jan. 14 Furniture A/c ...................... Dr.
To Bank A/c
(Being cheque issued for
purchase of Furniture)
16,000
16,000
Jan. 15 Stationery A/c ........... Dr.
To Cash A/c
(Being the amount paid for
stationery)
1,200
1,200
Jan. 18 Bank A/c .................... Dr.
To Cash A/c
(Being the amount deposited
into the Bank)
5,000
5,000
Jan. 20 Cash A/c .................... Dr.
To Sales A/c
(Being the goods sold
cash)
for
27,750
27,750
Jan. 22 Purchases A/c ............ Dr.
To Cash A/c
(Being the goods purchased
for cash)
3,000
3,000

53
Jan. 25 Salaries A/c ................ Dr.
To Bank A/c
(Being the amount paid as
salaries)
3,200
3,200
Jan. 28 Rent A/c ..................... Dr.
To Cash A/c
(Being the rent paid)
1,000
1,000
Jan. 31 Ram Drawings A/c ..Dr.
To Cash A/c
(Being the cash drawn for
personal use)
4,000
4,000
Jan. 31 Bank A/c ................... Dr.
To Cash A/c (Being
cash deposited)
12,000
12,000
Posting in the Ledger Accounts:
Now let us prepare the ledger accounts based on the entries
passed earlier. A separate account is opened in ledger for each account. All the debit entries and credit entries are duly entered. At the end, the accounts are properly balanced. In other words, the total of all debit entries is adjusted against the total of credit entries and balance is carried forward to the next accounting period.
In the Books of Ram
Cash Book, Subsidiary Books and General Ledger Cash Book
(Three Column)
Date Receipts L.F.
Ca
sh
Rs
.
Ba
nk
Rs
.
Date
Payments
L.F.
Ca
sh
Rs
.
Ba
nk
Rs
.
2010 2010
Jan.1
To Capital A/c
20,000
Jan. 3
By Purchases A/c
4,000
Jan. 5
To Maruti’s A/c
6,000 Jan. 4
By Gopal A/c
10,000
Jan. 8
To Commission A/c
1,600 Jan. 6
By Furniture A/c
2,000
Jan. 18
To Cash A/c C - 5,000 Jan. 7
By Rent A/c 1,000
Jan. 20
To Sales A/c 27,750
Jan. 12
By Postage A/c
200
Jan. 31
To Cash A/c C - 12,000
Jan. 14
By Furniture A/c
16,000
Jan. 15
By Stationery A/c
1,200

54
Jan. 18
By Bank A/c C 5,000
Jan. 22
By Purchases A/c
3,000
Jan. 25
By Salaries A/c
3,200
Jan. 28
By Rent A/c 1,000
Jan. 31
By Bank A/c C 12,000
Jan. 31
By Drawings A/c
4,000
Jan. 31
By Balance c/d
11,950
12,000
55,350
17,000
55,350
17,000

55
Note: The letter ‘C’ in the Ledger Folio column denotes a ‘contra entry’.
That is an entry for which the debit and credit aspects are found in the Cash Book itself.
Purchases Book
Date Name of Supplier Ledger
Folio
Inward
Invoice No.
Amount
Rs.
2010
Jan.2 Nandu 1,00,000
Total 1,00,000
Purchase Returns Book
Date Name of Supplier Ledger
Folio
Debit Note
No.
Amount
Rs.
2010
Jan.9 Nandu 2,000
Total 2,000
Sales Book
Date Name of Customer
Ledger Folio
Outward Invoice No.
Amount Rs.
2010
Jan.10 Kishore 10,000
Total 10,000
Sales Returns Book
Date Name of Customer
Ledger Folio
Credit Note No.
Amount Rs.
2010
Jan.13 Kishore 2,000
Total 2,000
General Ledger
Dr.
Ram’s Capital A/c Cr.
Date Particulars JF
No Amoun
t Rs.
Date Particulars JF No
Amount
Rs. 2010 2010
Jan.31
To Balance c/d
20,000 Jan.1
Feb.1
By Cash A/c
By Balance b/d
20,000
20,000 20,000
20,000

56
Dr.
Nandus A/c Cr.
Date
Particulars JF No
Amount
Rs.
Date Particulars JF No
Amount
Rs. 2010
2010
Jan.9
Jan.3
1
To Purchase Returns A/c
To Balance c/d
2,000
98,000
Jan.2
Feb.1
By Purchases A/c
By Balance b/d
1,00,000
1,00,000
1,00,000
98,000
Purchases A/c Dr.
Date Particulars JF No
Amount
Rs.
Date Particulars JF No
Amount
Rs. 2010 2010 Jan.2 To Nandu’s
A/c 1,00,00
0 Jan.31
By Balance c/d
1,07,000
Jan.3 To Cash A/c 4,000 Jan.22
To Cash A/c 3,000
1,07,000
1,07,000
Feb.1 To Balance b/d
1,07,000
Dr.
Dr.
Sales A/c
Purchase Return A/c
Cr.
Cr.
Date
Particulars JF No
Amount
Rs.
Date Particulars JF No
Amount
Rs. 2010
2010
Jan.31
To Balance c/d
2,000 Jan.9
Feb.1
By Nandu’s A/c
By Balance
2,000
2,000 2,000
2,000
Cr.
Date Particulars JF No
Amount Rs.
Date Particulars JF No
Amount Rs.
2010 2010
Jan.31 To Balance c/d 37,750 Jan.13 Jan.20
Feb.1
By Kishore’s A/c By Cash A/c
By Balance b/d
10,000
27,750
37,750 37,750
37,750

57
b/d

56
Sales Return A/c Dr. Cr.
Date
Particulars JF No
Amount
Rs.
Date Particulars JF No
Amount
Rs. 2010
2010
Jan.13
Feb.1
To Kishore’s A/c
To Balance b/d
2,000 Jan.31
By Balance c/d
2,000
2,000 2,000
2,000
Dr.
Dr.
Dr.
Gopal’s A/c
Rent A/c
Commission Received A/c
Cr.
Cr.
Cr.
Date
Particulars JF No
Amount
Rs.
Date Particulars JF No
Amount
Rs. 2010
2010
Jan.1 To Balance c/d
1,600 Jan.31
Feb.1
By Cash c/d By Balance b/d
1,600
1,600 1,600
1,600
Date Particulars JF No
Amount Rs.
Date Particulars JF No
Amount Rs.
2010 2010
Jan.6
Feb.1
To Cash A/c
To Balance b/d
10,000 Jan.31 By Balance c/d 10,000
10,000 10,000
10,000
Date Particulars JF No
Amount Rs.
Date Particulars JF No
Amount Rs.
2010 2010
Jan.7
Feb.1
To Cash A/c
To Balance b/d
1,000 Jan.31 By Balance c/d 1,000
1,000 1,000
1,000

57
Dr.
Dr.
Dr.
Dr.
Kishore’s A/c
Postage & Telegram A/c
Stationery A/c
Salaries A/c
Cr.
Cr.
Cr.
Cr.
Date
Particulars JF No
Amount
Rs.
Date Particulars JF No
Amount
Rs. 2010
2010
Jan.25
Feb.1
To Bank A/c
To Balance b/d
3,200 Jan.31
By Balance c/d
3,200
3,200 3,200
3,200
Date Particulars JF No
Amount Rs.
Date Particulars JF No
Amount Rs.
2010 2010
Jan.10
Feb.1
To Sales A/c
To Balance b/d
10,000 Jan.31
Jan.31
By Sales
Returns A/c
By Balance c/d
2,000
8,000
10,000 10,000
8,000
Date Particulars JF No
Amount Rs.
Date Particulars JF No
Amount Rs.
2010 2010
Jan.12
Feb.1
To Cash A/c
To Balance b/d
200 Jan.31 By Balance c/d 200
200 200
200
Date Particulars JF No
Amount Rs.
Date Particulars JF No
Amount Rs.
2010 2010
Jan.15
Feb.1
To Cash A/c
To Balance b/d
1,200 Jan.31 By Balance c/d 1,200
1,200 1,200
1,200

58
Dr.
Dr.
Dr.
Dr.
Rent A/c
Drawings A/c
Maruti’s A/c
Furniture A/c
Cr.
Cr.
Cr.
Cr.
Date
Particulars JF No
Amou nt Rs.
Date Particulars JF No
Amou nt Rs.
2010
2010
Jan.6
Feb. 1
To Cash A/c
To Balance b/d
2,000 Jan.31
By Balance c/d
2,000
2,000 2,000
2,000
Illustration 3:
Enter the following transactions in Raj’s Cash show ‘Discount Allowed’ and ‘Discount Received A/c’. March 2010.
1 Cash on hand Rs. 2,400 and bank overdraft Rs. 500.
Date Particulars JF No
Amou nt Rs.
Date Particulars JF No
Amou nt Rs.
2010 2010
Jan.28
Feb. 1
To Cash A/c
To Balance b/d
1,000 Jan.31 By Balance c/d 1,000
1,000 1,000
1,000
Date Particulars JF No
Amou nt Rs.
Date Particulars JF No
Amou nt Rs.
2010 2010
Jan.31
Feb.1
To Cash A/c
To Balance b/d
4,000 Jan.31 By Balance c/d 4,000
4,000 4,000
4,000
Date Particulars JF No
Amou nt Rs.
Date Particulars JF No
Amou nt Rs.
2010 2010
Jan.31 To Balance c/d 6,000 Jan.5
Feb.1
By Cash A/c
By Balance b/d
6,000
6,000 6,000
6,000
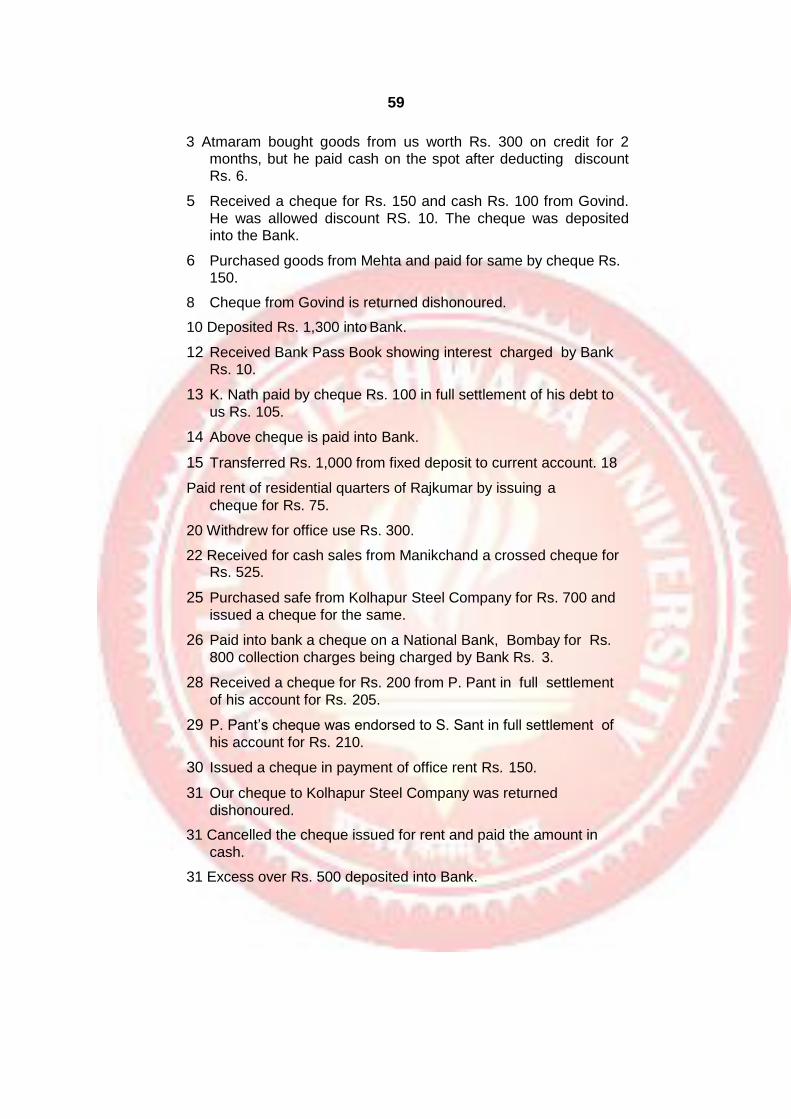
59
3 Atmaram bought goods from us worth Rs. 300 on credit for 2 months, but he paid cash on the spot after deducting discount Rs. 6.
5 Received a cheque for Rs. 150 and cash Rs. 100 from Govind.
He was allowed discount RS. 10. The cheque was deposited into the Bank.
6 Purchased goods from Mehta and paid for same by cheque Rs. 150.
8 Cheque from Govind is returned dishonoured.
10 Deposited Rs. 1,300 into Bank.
12 Received Bank Pass Book showing interest charged by Bank Rs. 10.
13 K. Nath paid by cheque Rs. 100 in full settlement of his debt to
us Rs. 105.
14 Above cheque is paid into Bank.
15 Transferred Rs. 1,000 from fixed deposit to current account. 18
Paid rent of residential quarters of Rajkumar by issuing a
cheque for Rs. 75.
20 Withdrew for office use Rs. 300.
22 Received for cash sales from Manikchand a crossed cheque for Rs. 525.
25 Purchased safe from Kolhapur Steel Company for Rs. 700 and
issued a cheque for the same.
26 Paid into bank a cheque on a National Bank, Bombay for Rs.
800 collection charges being charged by Bank Rs. 3.
28 Received a cheque for Rs. 200 from P. Pant in full settlement
of his account for Rs. 205.
29 P. Pant’s cheque was endorsed to S. Sant in full settlement of
his account for Rs. 210.
30 Issued a cheque in payment of office rent Rs. 150.
31 Our cheque to Kolhapur Steel Company was returned
dishonoured.
31 Cancelled the cheque issued for rent and paid the amount in
cash.
31 Excess over Rs. 500 deposited into Bank.

60
Solution:
Date Particulars R. No.
L.F. Discount Rs.
Cash Rs.
Bank Rs.
Date Particulars R N
2005 2005
Mar. 1 To Balance b/d 2,400 Mar.1 By Balance b/d
3 To Sales (Cash Sales &
Cash discount)
6 294 6 By Purchases (Issue
Cheque No.)
5 To Govind (Received
cheque, cash & discount, allowed,
cheque is paid into
Bank)
10 100 150 8 By Govind (Cheque
received is dishonored, dis.
Allowed cancelled).
10 To Cash (Deposited into Bank)
C 1,300 10 By Bank (Deposited into Bank)
13 To K. Nath (Cheque
received & Discount allowed)
5 100 12 By Interest (Bank
charged Interest)
14 To Cash (Cheque
deposited)
C 100 14 By Bank (Cheque
deposited)
15 To Fixed deposit (Transferred from fixed
deposit).
1,000 18 By Drawings (Issued cheque No. for rent of
residence.)
20 To Bank (Withdrew for
office use.)
C 300 20 By Cash (Withdrew for
office use.)

61
20 To Sales (A
crossed cheque
received from,
Manikchand for
Cash sales.)
525 25
By Furniture
(Issued cheque
No. for purchase
of safe.)
26 To Cash (Paid cheque)
C 800 26
By Bank (Paid into
Bank) 28 To P. Pant
(Received 5 200 2
6 By Bank Charges
cheque.) (Collection charges.)
30 To Kolhapur Steel Co.
700 29
By S. Sant (Cheque
(Cheque No. endorsed.)
dishonoured.)
31 To Rent (Cancelled
150 30
By Rent (Paid by
cheque No.) cheque.)
31 To Cash (Paid into C 344 31
By Rent (Paid cash in
Bank) cancellation of
cheque.) 3
1 By Bank (Paid into
Bank). 3
1 By Balance c/d
26 3,394 5,069
1-4 To Balance b/d 500 3,031

62
Illustration: 4
Enter the following transactions in a cash book with 3 columns that is Discount, Cash and Bank in the books Yashshri for the month of
June, 2010.
2010
Jan 1 Cash in hand Rs. 8,000 and at Bank Rs. 10,000
2 Sold goods to Swami and Co. for Rs. 6,000 and received a cheque of Rs. 2,000 as part payment.
3 Purchased goods from Patel for Rs. 8,000 less trade
discount 2% and paid the amount by issue of cheque.
5 Transferred Rs. 5,000 from Private Banking A/c to Business Bank A/c.
10 Issued a cheque for Rs. 3,000 to furniture mart for the
furniture purchased for last month in full settlement of Rs. 3,200
12 Withdrew for personal use from Bank Rs. 8,000
14 Issued a cheque to petty cashier for Rs. 2,000 15
Withdrew for office use Rs. 4,000
16 Swami and Co. infored that they paid directly into our Bank A/c in; the remaining balance amounting Rs. 4,000.
19 Bank collected Dividend and credited to our Account to Rs.
1,400.
20 Paid Insurance premium for goods Rs. 3,000, by cheque. 20
Cash sales Rs. 8,000.
25 Paid Salaries by cheque Rs. 800
30 Purchased Govt. securities of Rs. 900.
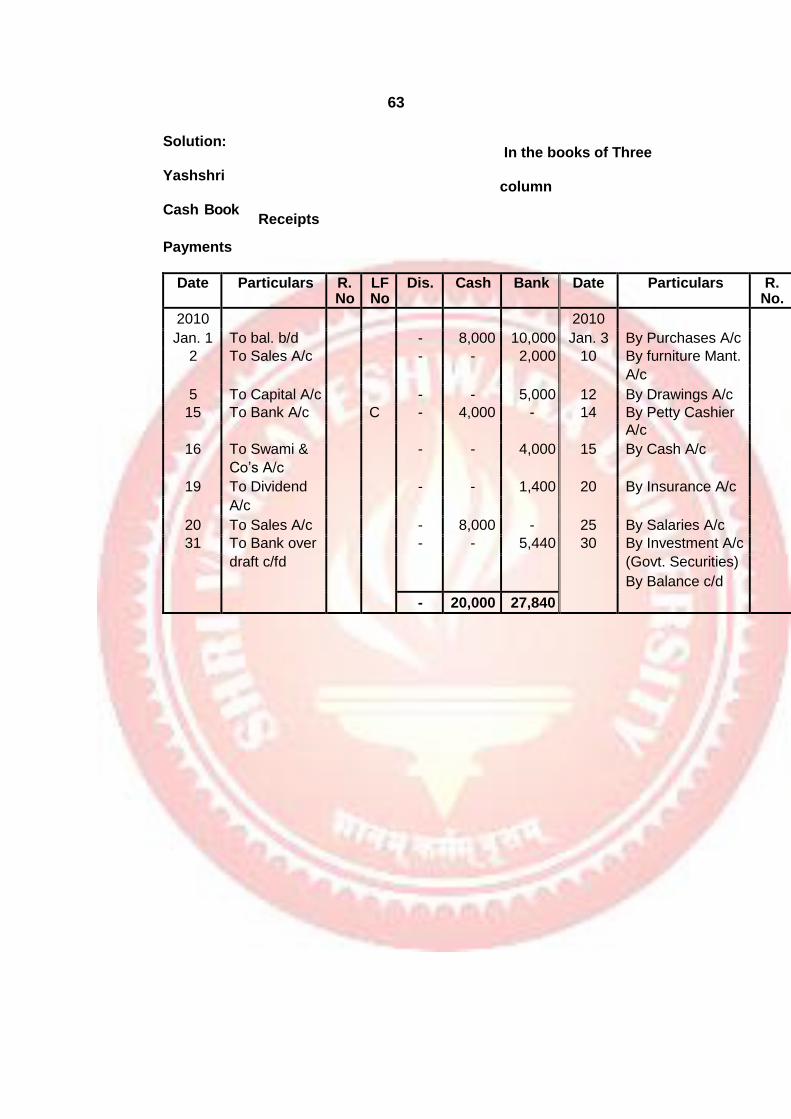
63
Solution:
Yashshri
Cash Book
Payments
Receipts
In the books of Three
column
Date Particulars R. No
LF No
Dis. Cash Bank Date Particulars R. No.
2010 2010
Jan. 1 To bal. b/d - 8,000 10,000 Jan. 3 By Purchases A/c
2 To Sales A/c - - 2,000 10 By furniture Mant.
A/c
5 To Capital A/c - - 5,000 12 By Drawings A/c
15 To Bank A/c C - 4,000 - 14 By Petty Cashier
A/c
16 To Swami & - - 4,000 15 By Cash A/c
Co’s A/c
19 To Dividend - - 1,400 20 By Insurance A/c
A/c
20 To Sales A/c - 8,000 - 25 By Salaries A/c
31 To Bank over - - 5,440 30 By Investment A/c
draft c/fd (Govt. Securities)
By Balance c/d
- 20,000 27,840
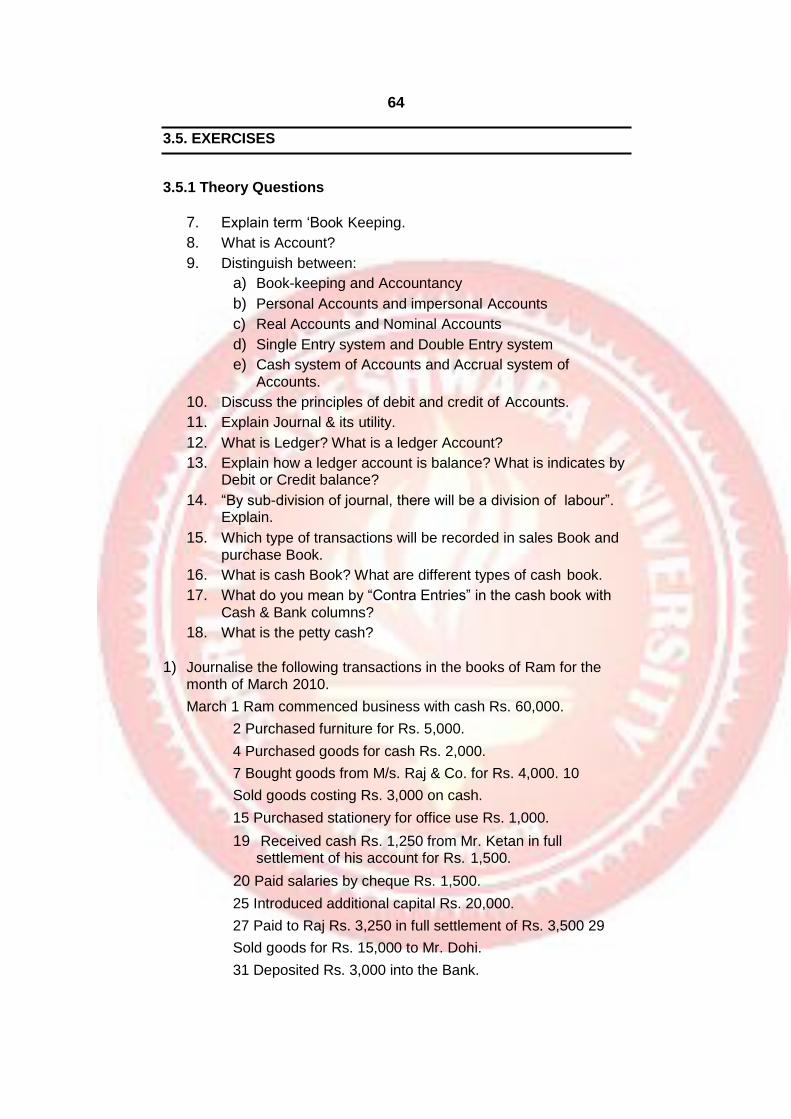
64
3.5. EXERCISES
3.5.1 Theory Questions
7. Explain term ‘Book Keeping.
8. What is Account?
9. Distinguish between:
a) Book-keeping and Accountancy
b) Personal Accounts and impersonal Accounts
c) Real Accounts and Nominal Accounts
d) Single Entry system and Double Entry system
e) Cash system of Accounts and Accrual system of
Accounts.
10. Discuss the principles of debit and credit of Accounts.
11. Explain Journal & its utility.
12. What is Ledger? What is a ledger Account?
13. Explain how a ledger account is balance? What is indicates by Debit or Credit balance?
14. “By sub-division of journal, there will be a division of labour”. Explain.
15. Which type of transactions will be recorded in sales Book and purchase Book.
16. What is cash Book? What are different types of cash book.
17. What do you mean by “Contra Entries” in the cash book with
Cash & Bank columns?
18. What is the petty cash?
1) Journalise the following transactions in the books of Ram for the month of March 2010.
March 1 Ram commenced business with cash Rs. 60,000.
2 Purchased furniture for Rs. 5,000.
4 Purchased goods for cash Rs. 2,000.
7 Bought goods from M/s. Raj & Co. for Rs. 4,000. 10
Sold goods costing Rs. 3,000 on cash.
15 Purchased stationery for office use Rs. 1,000.
19 Received cash Rs. 1,250 from Mr. Ketan in full settlement of his account for Rs. 1,500.
20 Paid salaries by cheque Rs. 1,500.
25 Introduced additional capital Rs. 20,000.
27 Paid to Raj Rs. 3,250 in full settlement of Rs. 3,500 29
Sold goods for Rs. 15,000 to Mr. Dohi.
31 Deposited Rs. 3,000 into the Bank.

65
2) Journalise the following transactions in the books of Mr. Shiva for the month of April 2010.
April 1 Started business with cash Rs. 25,000/-
6 Purchased goods worth Rs. 10,000/-
4 Deposited cash Rs. 3,000 into the Bank.
6 Purchased goods of Rs. 6,000 from M/s. Raju Trading Company.
9 Sold goods to Mr. Ramesh for Rs. 3,000.
12 Paid to M/s. Raju Trading Company Rs. 3,000.
15 Received Rs. 1,000 from Mr. Ramesh.
20 Paid salaries Rs. 1,000/- and paid commission
Rs. 1,600/- in cash.
25 Bought stationery for office use Rs. 300.
27 Withdrew Rs. 2,500 from business for personal use.
29 Withdrew Rs. 4,000 from bank for office use.
3) Journalise the following transactions in the journal of Mr. Anand for the month of February, 2010.
Feb 1 Borrowed from Bank @ 15% interest Rs. 20,000.
7 Purchased goods from Mr. Sam for Rs. 3,500.
8 Paid carriage and cartage Rs. 250
9 Sold goods on cash Rs. 3,000.
11 Paid Rs. 2,250 to Mr. Sam.
16 Purchased office furniture for Rs. 6,000. 19
Paid interest Rs. 450/- to Mr. Bank.
20 Paid salaries Rs. 6,000.
22 Cash sales Rs. 20,000.
26 Cash purchases Rs. 15,000
28 Paid Rs. 2,000 to Bank in part payment of loan.
4) Journalise the following transactions in the books of Mr. Vishal for the month of March, 2010.
Mar. 1 Vishal started business with cash Rs. 35,000, goods
worth Rs. 10,000.
4 Opened bank account in the Bank of India by depositing Rs. 5,000.
4 Bought goods worth Rs. 6,000 @ 10% trade discount term.
7 Sold goods worth Rs. 3,000

66
9 Purchased furniture of Rs. 4,000 for office use and furniture of Rs. 1,000 for home use.
14 Withdrawn goods of Rs. 1,000 for self use.
17 Received Rs. 2,400 from Mr. Ravindra in full
settlement of Rs. 2,450.
19 Paid salaries Rs. 500 to office clerk and paid electricity bill of Rs. 750 in cash.
24 Paid Mr. Raj Rs. 1,960 in full settlement of Rs. 2,000. 26
Paid insurance premium of Rs. 1,200 on the life of Mr.
Vishal, a proprietor.
29 Cash sales Rs. 3,000.
30 Withdrew Rs. 4,000 from bank for office use.
5) Draft journal entries for the business transactions given below. Apr.
1 Mr. Atul started business with cash Rs. 5,000/-, goods
Rs. 7,500 and furniture Rs. 2,500/-
5 Purchased goods worth Rs. 4,500 from Mr. Kamalakar.
9 Cash sales Rs. 6,000
10 Purchased stationery for office use Rs. 500.
10 Paid to Mr. Kamalakar Rs. 4,350 in full settlement of Rs. 4,500.
13 Deposited Rs. 1,000 into the Bank. 16
Received Rs. 500 from Mr. Kiran.
19 Withdrawn Rs. 200 from business for self use.
23 Paid Rs. 150 for commission and paid Rs. 450 for
rent.
27 Paid wages Rs. 600 in cash, and paid sundry expenses Rs. 200/- by cheque.
29 Borrowed Rs. 5,000 from wife for business purpose.
30 Cash purchases Rs. 1,000.
6) On 1st July, 2010, Mr. X commenced business with cash Rs. 25,000, Bank balance Rs. 25,000, Stock Rs. 43,000 & Computer Rs. 18,000.
July 2 Borrowed Rs. 20,000 from Mr. Y for business purpose.
6 Sold goods to Mr. Z for Rs. 10,000 @ 5% T.D.
7 Paid for business stationery by cheque Rs. 500.
7 Sold goods to Mr. A on credit Rs. 5,000.

67
9 Sold goods to Mr. B on cash Rs. 10,000 and amount deposited into the bank.
11 Received cheque from Mr. Z in payment for goods sold to him on 4th July less 5% C.D. and deposited into the bank.
13 Mr. A paid us cash Rs. 4,900 for goods sold to him on 7th July.
15 Bought printer for Rs. 2,000 and amount paid by cheque.
18 Withdrawn Rs. 600 from Bank to pay insurance premium on the life policy.
19 Withdrawn goods of Rs. 500 from stock for private use.
22 Purchased second hand car for Rs. 15,000 for business purpose and amount paid by cheque.
25 Paid monthly wages Rs. 1,000 in cash.
26 Purchased 1,500 shares of M/s. ABC Co. Ltd. at Rs. 10 per share.
27 Transferred Rs. 10,000 from Current A/c to Fixed Deposit A/c.
28 Issued a cheque to chartered accountant for auditing Rs. 800.
30 Deposited into Bank Rs. 6,000.
You are required to prepare three columns cash book and balance the same.
7) Record the following transactions in a cash book with cash, bank and discount columns and balance the same.
Aug. 1 Mr. Arvind kumar started business with cash
Rs. 30,000.
2 He opened a Current A/c into the city Co-operative Bank by depositing Rs. 20,000.
4 He received a cheque from Mr. Ram for Rs. 5,000 for goods sold to him, which was deposited in Bank.
6 Paid by cheque an amount of Rs. 11,500 to Mr. Shah for goods purchased from him for Rs. 12,000 (cheque is issued for full settlement)
11 Bank informed that Ram cheque is dishonoured, and our account is debited by Rs. 50 for bank charges.
17 Paid salaries Rs. 1,600, commission Rs. 1,000 and rent Rs. 1,000 by cheque.

68
18 Bank informed that our account is credited by Rs. 3,000 for receipt of dividend and debited our account for payment of insurance premium for Rs. 1,600.
23 Purchased key board for Rs. 3,000 for home use and a computer for Rs. 40,000 for office use, total amount paid by cheque.
24 Borrowed Rs. 7,500 from our business friend Mr. Sam for
business purpose.
27 Bought stationery worth Rs. 500 for business purpose and fan for home use for Rs. 2,000. Both the payments were made by cheques.
28 Mr. Kishor deposited Rs. 1,750 into our bank account directly.
29 Issued a cheque to Art & Creative Co. for advertisement
Rs. 12,500/-
8) Compile a Cash Book having cash, discount and bank columns from the following transactions for the month of May, 2010 and balance the same.
May. 1 Cash in Cash Box Rs. 20,000 and Bank balance Rs. 25,000.
2 Deposited into the bank Rs. 7,500.
4 Cheque of Rs. 14,000 received from Mr. Arjun in full settlement of Rs. 15,000.
6 Mr. Arjun’s cheque deposited into the bank along with cash Rs. 1,500/-
7 Amount of Rs. 1,000 directly deposited into the our Bank A/c by Mr. Anu.
9 Paid to M/s. Z and sons by cheque Rs. 1,090 and earned discount of Rs. 10.
12 Cash sales Rs. 2,520 and allowed cash discount of Rs. 30.
14 Cash purchases Rs. 6,000 and amount paid by issuing
across cheque for the same amount.
16 Bank informed that Mr. Arjun’s cheque is dishonoured and he is paid Rs. 13,500 immediately to settle his account.
19 Purchased stationery for Rs. 250 and office furniture for Rs. 2,250.
20 Paid commission Rs. 1,000 and Staff salaries Rs. 1,000 through bank.
24 Withdrawn cash Rs. 750 from office for self use and
cash Rs. 1,500 from bank for petty expenses.

69
26 Received a crossed cheque of Rs. 14,500 from Mr. Ashok.
28 Endorsed a cheque received from Mr. Ashok in favour of Mrs. Jani.
29 Borrowed from wife Rs. 20,000 for business purpose. 30
Mr. Ashok’s cheque endorsed to Mrs. Jani was dishonoured.
31 Transferred Rs. 10,000 from Current A/c to Fixed Deposit A/c.
9) Prepare the three column cash book from the following details and balance the same.
June 1 Cash office Rs. 40,500/- and Overdraft Bank balance
Rs. 16,600/-.
2 Purchased goods worth Rs. 15,000/- @ 10% T.D. and 5% C.D. from M/s. Randhir and Sons. 50% of the amount paid immediately and balance after 15 days.
4 Bought office furniture for Rs. 15,000 and paid Rs.
12,500 as first installment.
6 Purchased stationery for office use costing Rs. 400.
7 Sold goods worth Rs. 20,000 @ 2% C.D. and amount deposited into Bank.
9 Received a cheque of Rs. 12,000 from Mr. Anand on account.
11 Deposited Mr. Anand’s cheque into the Bank.
13 Paid Mr. Ramesh by cash Rs. 1,500 and by cheque Rs. 750 in full settlement of his account of Rs. 2,400.
14 Gave loan of Rs. 10,000 to wife by issuing cheque.
16 Cheque issued to Mr. Ramesh returned dishonoured and cash Rs. 1,000 paid to him.
18 Transferred Rs. 20,000 from Fixed deposit A/c. to Current A/c.
20 Withdrawn from bank cash Rs. 4,000 for office use and
withdrawn from office cash Rs. 10,000 for daughter’s marriage.
22 Issued a cheque of Rs. 6,700 to M/s. Randhir and Sons and earned discount of Rs. 50.
25 Bank has debited our account by Rs. 550 for payment of insurance premium.
28 Issued a cheque of Rs. 2,500 for payment of salaries. Paid office rent Rs. 1,600 in cash.
29 Deposited into Bank all the cash in excess of Rs.
1,400.

70
10) From the following information prepare cash book with cash, bank and discount column and balance the Cash Book.
Mar. 1 Opening balance of cash Rs. 21,000 and at bank Rs. 16,000
3 Received from Jayant Rs. 12,900 and allowed
discount Rs. 100.
5 Paid to Babar by cheque Rs. 2,910 in full settlement of their account for Rs. 2,930.
10 Sanjay deposited directly into our bank account Rs. 3,000.
15 Received a cheque of Rs. 2,000 for interest on
investments which was deposited into the bank.
20 Drew cheque for personal use Rs. 5,000.
24 Paid salaries Rs. 2,250 and rent Rs. 4,000 by cheque.
26 Sold goods costing Rs. 18,000 at 25% profit on cost and received half the amount in cash and half by cheque which is deposited into the bank.
28 Bank pass book shows that bank has debited our account
by Rs. 200 for bank charges and credited account by Rs. 1,000 for interest on investment.
30 Transferred Rs. 5,000 from savings account to current account.
11) From the following details prepare three column cash book and balance the same.
Jan 1 Opening cash balance Rs. 20,000 and bank balance Rs. 25,000.
5 Received cash from Kaka Rs. 9,500 and allowed discount Rs. 500.
8 Received a cheque from Anil for Rs. 7,000 and
immediately deposited into bank.
10 Paid to Suresh by cheque Rs. 3,000 for rent.
14 Paid salary by cash Rs. 3,000 and by cheque Rs. 10,000.
16 Received by cheque Rs. 14,000 and cash Rs. 6,000 from
Nagori and deposited the same cheque into the bank immediately.
20 Paid to Rakesh Rs. 4,000 by cash and Rs. 1,500 by cheque on account.
22 Paid to Narayan by cheque Rs. 4,500 and received discount Rs. 500.
25 Cash sales Rs. 20,000 at 5% C.D.
27 Cash purchases Rs. 20,000 at 5% C.D.

71
28 Paid to Nagori on account Rs. 5,000 by cheque.
29 Received from Arun Rs. 4,500 towards full settlement of Rs. 5,000.
30 Paid telephone bill by cheque Rs. 450.
12) Enter the following transactions in a three column cash book and balance the same.
May 1 Opening cash balance Rs. 30,000 and bank balance Rs.
42,500.
2 Cash purchases Rs. 20,000 at 3% C.D.
5 Cash sales Rs. 25,000 at 3% C.D.
9 Received cash from ABC Co. Rs. 5,900 and allowed
discount Rs. 100.
11 Received a cheque from Delta Co. for Rs. 2,000 and deposited it into the bank immediately.
13 Paid rent by cash Rs. 1,000 and by cheque Rs. 5,000.
15 Paid to XYZ Co. Rs. 2,000 by cash and Rs. 4,000 by cheque.
18 Received cash Rs. 9,750 from Bata & Co. and allowed
a discount of Rs. 250.
22 Deposited into bank Rs. 5,000.

72
4
BANK RECONCILIATION STATEMENT
Unit Structure:
Objectives
Meaning
Reasons for differences in Bank balance of Cash Book with Pass
Book
Prepares of Bank Reconciliation Statement
Chart for solving the problems
Specimen of Bank Reconciliation Statement
Bank Overdraft
Importance of Bank Reconciliation Statement
Illustrations
Exercises
OBJECTIVES
After studying the unit the students will be able to:
Define and explain bank reconciliation statement.
Know the reasons of disagreement of the balances of cash book and bank statement.
Prepare the format of the statement.
Prepare bank reconciliation statement.
MEANING
A customer of the bank opens a Bank Account in his Cash book to record all his bank transactions. Similarly a bank maintains a Customer’s Account in its ledger, and gives a Bank Pass Book to the customer. From the entries in the pass book a customer can have knowledge of the transactions recorded by the bank in his account.
When we make entries on the debit side of Bank Account the bank makes entries on the credit side of our account for the same transactions and vice versa. As a result when the Bank Account shows debit balance, the pass book shows credit balance and vice-versa.

73
As a matter of fact balance shown by the Bank Account and by the bank pass book on a particular day must tally. But in actual practice they differ due to reasons given below. It is therefore, becomes necessary to reconcile the difference to ascertain that there are no mistakes committed. Thus a Bank Reconciliation Statement is a
statement prepared to reconcile the difference between the balances as shown by the Bank Account in a Cash Book and by the Bank Pass Book.
REASONS FOR DIFFERENCES IN BANK BALANCE OF CASH BOOK WITH PASS BOOK
Some of the transactions are entered in the Cash Book (Bank column only) whereas some are entered only in the Pass Book. In addition to this there may be some mistakes committed, either in the Cash book or in the Pass Book.
A) Transactions entered in the Cash Book (Bank Column) or in the pass book.
i) Cheques issued: When a cheque is issued, Bank Account is at once credited, but the Customers Account is debited by the Banker only when the payment of that cheque is effected by the
Bank.
ii) Cheques paid or deposited into the Bank : When a cheque is received and paid into the bank, the customer debits at once the Bank Account in his Cash Book, but the Customer’s Account is credited by the Banker only when the cheque is collected by the bank.
B) Generally the following transactions are entered first in the Pass Book and subsequently they are entered in the Cash Book from the Pass Book.
1. Bank Charges
2. Interest allowed or charged by Bank
3. Dividend, Interest on Investment collected by Bank on behalf of a customer.
4. Dishonour of cheque paid into Bank and credited to Customer’s
Account by Bank.
5. Amount collected or paid for Bills of Exchange by Bank, Sale of Securities on behalf of a customer.
6. Payment by Bank, such as Club Subscription, Insurance Premium,
Purchases of Securities on behalf of a customer.

74
PREPARATION OF BANK RECONCILIATION
STATEMENT
In actual practice, we have both Cash Book (Bank Account) and the Bank Pass Book on hand, to compare the entries in them during a particular period. As the entries which are made in both the books do not cause the difference in balance, they are to be left out. The entries which are recorded only in one of the two books are taken into
consideration.
Generally, Bank balance either as per Cash Book or as per Pass
Book of a particular date is given and the balance as per other book is
required to be traced out.
A) First ascertain balance that is whether a debit balance or a credit balance.
B) Out of the transactions given, those which are recorded in both the books that is Cash Book and Pass Book before the date of reconciliation are not to be considered.
C) Transaction which is recorded in only one of two books either in the
Cash Book or in the Pass Book is to be considered.
Bank Reconciliation Statements helps the customer to know
which cheques are yet to be realized and which cheques are not yet encashed.
It reduces the chances of misappropriation by the Bank
employees.
CHART FOR SOLVING THE PROBLEMS
The following charts will help the students in solving the problems:
Transactions
Given Bank
balance as per Cash Book or overdraft as
per Pass Book
Given Bank
balance as per Pass Book or overdraft as
per Cash Book
1. Cheques issued but not encashed recorded in the Cash Book only.
Add
Less
2. Interest allowed or collected by Bank, Sale of Investments recorded in Pass Book only.
Add
Less
3. Direct payment into bank by our customer etc.
Add Less

75
4. Wrong amount taken in Cash Book
i) Short Amount Add Less
ii) Excess Amount Less Add
5. Cheque paid into Bank but not credited by Bank.
Less Add
6. Bank Charges, Interest charged by Bank or dishonour of cheque etc. are recorded in Pass Book only.
Less
Add
7. Bank charges, Interest charged by Bank or dishonour of cheqe etc. are recorded in Pass Book only.
Less
Add
8. Payment by bank for insurance premium, club subscription, Purchase of Securities etc. are recorded in Pass Book only.
Less
Add
SPECIMEN OF BANK RECONCILIATION STATEMENT
Particulars Rs. Rs.
Balance as per Cash / Pass Book given
Add : The transaction that would increase the
balance in the other Book. Less : The transaction that would reduce the
balance of the other book
Balance as per Cash / Pass Book (i.e. other book) as on
XX
XX
XX
XX
(XX)
XXX
BANK OVERDRAFT
Normally, Traders keeps depositing cash into Bank Account and withdraws by issuing cheques to various parties. However, trader makes arrangement with the bank, to withdraw more than his bank balance. This is known as Bank Overdraft. The upper limit of such overdraft is fixed in advance. When there is overdraft Bank Account in trader’s books shows credit balance and in the books of Bank, trader’s account will show debit balance, and he is a debtor.

76
For preparing reconciliation statement, taking Bank overdraft as base, it will be exact opposite that of Bank Balance, add items will become Less and less items will be Add.
IMPORTANCE OF BANK RECONCILIATION
STATEMENT
After getting Bank Statement / Pass Book, businessmen,
compares entries in Cash Book (recorded by trader) and Bank Statement (recorded by bank in relation to businessmen) and prepare Bank Reconciliation. While preparing reconciliation statement, numbers of entries are not matching with each other these discrepancies may lead to notice frauds, errors, misappropriation of cash, by cashier. It reduces the charges of misappropriation by the employees, so timely
action may be taken. At the same time, it is possible that Bank might have made wrong entry of deposit or withdrawal, businessmen can be inform bank to correct it.
It presents sinero, of e-banking of increasing use of credit card /
debit card facilities / Net banking. Their may be number of transaction are not recorded in time which can be brought to notice. For wrong entry by bank, immediate action can be taken, asking bank to verify the mistake(s).
CHECK YOUR PROGRESS
Give the examples of various transactions which are generally entered first in the Pass Book.
If the Bank balance as per Cash Book is given, how the following transactions affect:
1. Interest allowed or collected by Bank, Sale of
Investments recorded in Pass Book only.
2. Cheque paid into Bank but not credited by Bank.
3. Payments by bank for insurance premium, club subscription,
Purchase of Securities etc. are recorded in Pass Book only.
4. Direct payment into bank by our customer.
5. Bank Charges, Interest charged by Bank or dishonour of
cheque etc. are recorded in Pass Book only.
ILLUSTRATIONS
Illustration 1 : On 31st December 2010, M/s. M.D. & Co.’s bank
column of Cash Book showed a debit balance Rs.17,800/- from the

77
following particulars prepare a Bank Reconciliation Statement showing the balance as per Bank Pass Book as on 31st December 2010.
1. Cheques deposited into the Bank but not cleared and credited before 31st December amounted to Rs.8,950/-.
2. Cheques issued on 31st December but presented for payment on
the 7th January 2011 amounted to Rs.6,750/-.
3. Purchases of securities of Rs.4,000/- by the Bank on behalf of M/s. M.D. & Co. appeared in Pass Book only.
4. Interest Rs.95/- was credited in the Pass Book but was entered in the Cash Book as Rs.59/-.
5. Bank charges Rs.45/- were recorded in the Pass Book but no entry was made in the Cash Book.
Bank Reconciliation Statement as on 31-12-2010
Particulars Rs. Rs.
Balance at the bank as per Cash Book as on
31-12-2010.
17,800
Add :
(i) Cheques issued on 31st December but not cashed upto 31st December 2010.
(ii) Interest recorded in the Cash Book as Rs.59/- instead of Rs.95/-, hence the difference.
6,750
36
6,786
24,586
Less :
(i) Cheques paid into Bank but not cleared upto 31st December 2010.
(ii) Payment made by Bank for purchase of securities not entered in the Cash Book.
(iii) Bank charges appearing in the Pass Book.
8,950
4,000
45
(6,390)
Balance as per Pass Book as on 31st December 2010.
8,710
Illustration 2 : On 30th June, 2010 the Cash Book of M/s. Patil & Co.
showed a Bank balance of Rs.12,000/-.
1. Cheques sent to Bank for collection of Rs.10,000/- before 30- 06-2010 but only one cheque of Rs.4,000/- is credited in June 2010.
2. Cheque issued for Rs.5,000/- in the month of June, but cheques of Rs.2,500/- presented for payment in July 2010.
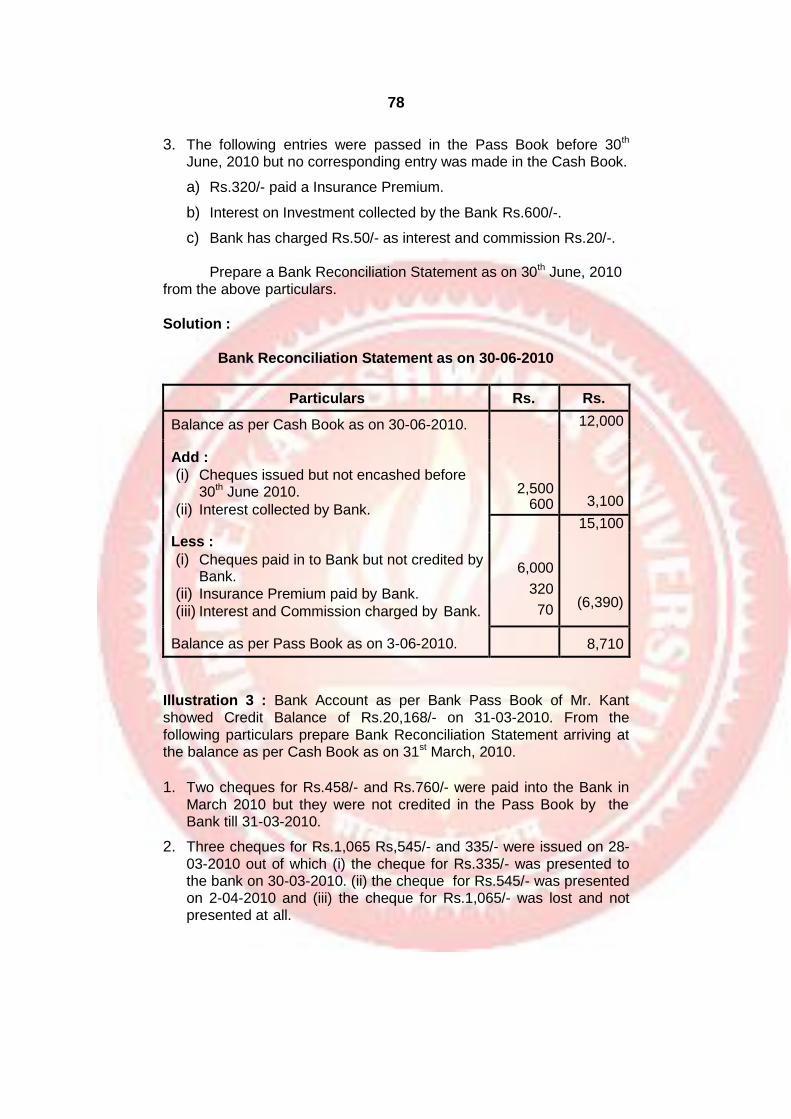
78
3. The following entries were passed in the Pass Book before 30th June, 2010 but no corresponding entry was made in the Cash Book.
a) Rs.320/- paid a Insurance Premium.
b) Interest on Investment collected by the Bank Rs.600/-.
c) Bank has charged Rs.50/- as interest and commission Rs.20/-.
Prepare a Bank Reconciliation Statement as on 30th June, 2010
from the above particulars.
Solution :
Bank Reconciliation Statement as on 30-06-2010
Particulars Rs. Rs.
Balance as per Cash Book as on 30-06-2010.
2,500
600
12,000
Add :
(i) Cheques issued but not encashed before 30th June 2010.
(ii) Interest collected by Bank.
3,100
15,100
Less :
(i) Cheques paid in to Bank but not credited by Bank.
(ii) Insurance Premium paid by Bank.
(iii) Interest and Commission charged by Bank.
6,000
320
70
(6,390)
Balance as per Pass Book as on 3-06-2010.
8,710
Illustration 3 : Bank Account as per Bank Pass Book of Mr. Kant
showed Credit Balance of Rs.20,168/- on 31-03-2010. From the
following particulars prepare Bank Reconciliation Statement arriving at the balance as per Cash Book as on 31st March, 2010.
1. Two cheques for Rs.458/- and Rs.760/- were paid into the Bank in
March 2010 but they were not credited in the Pass Book by the Bank till 31-03-2010.
2. Three cheques for Rs.1,065 Rs,545/- and 335/- were issued on 28-
03-2010 out of which (i) the cheque for Rs.335/- was presented to the bank on 30-03-2010. (ii) the cheque for Rs.545/- was presented on 2-04-2010 and (iii) the cheque for Rs.1,065/- was lost and not presented at all.

79
3. The Bank has charged Rs.5/- as Bank charges and has credited interest of Rs.30/-. The bank has also collected interest on investment on behalf of Mr. Kant Rs.100/-. These are not recorded in the Cash Book.
4. A customer of Mr. Kant has paid Rs.500/- directly in the Bank Account of Mr. Kant has paid Rs.500/- directly in the Bank Account
of Mr. Kant on 31-03-2010 of which Mr. Kant has no intimation.
Solution :
Bank Reconciliation Statement as on 31-03-2010
Particulars Rs. Rs.
Balance as per Pass Book as on 31-03-2010. 20,168
Add :
(i) Cheques paid into Bank but to credited by Bank upto 31-03-2010.
(ii) Bank charges entered in Pass Book.
1,218
5
1,223
Less :
(i) Cheques issued but not presented for payment upto 31-03-2010.
(ii) Interest credited by Bank.
(iii) Interest on investments collected & credited by Bank.
(iv) Direct payment into Bank by a customer.
1,610
30
100
500
21,391
(2,240)
Balance as per Cash Book as on 31-03-2010. 19,151
Illustration 4 : On 31st December 2010 the Pass Book of Dr. Raj
showed a credit balance of Rs.11,000/-. On comparing it with Cash Book, following differences were discovered.
(i) Cheaues deposited with Bank before 31-12-2010, but not yet collected Rs.1,400/-.
(ii) Cheque issued upto 31-12-2010 but not yet presented for payment
Rs.450/-.
(iii) The Bank has collected dividend Rs.250/- and has charged Rs.15/- as collection charges. Entries of these transactions do not appear in Cash Book.
(iv) The Bank has paid his electricity bill Rs.410/- for the month of
November 2010. This transaction appears only in Pass Book.

80
(v) The debit column of Bank Account in Cash Book is added shorted by Rs.40/-.
Prepare Bank Reconciliation Statement.
Solution :
Bank Reconciliation Statement as on 31-12-2010
Particulars Rs. Rs.
Balance as per Pass Book as on 31-12-2010. 11,000
Add :
(i) Cheques paid into Bank but to collected and credited by Bank.
(ii) Bank Charges not entered in Cash Book.
(iii) Payment of electricity bill by Bank not entered in Cash Book.
1,400
15
410
1,825
Less :
(i) Cheques issued but not encashed
(ii) Collection of dividend by bank not entered in Cash Book.
(iii) Undercasting of debit column of Bank Account in Cash Book.
450
250
40
12,825
(740)
Bank Balance as per Cash Book as on 31-12- 2010.
12,085
Illustration 5 : On 31st December 2010 the Bank Pass Book of a
company showed an overdraft of rss.12,060/-. Comparison of the Pass Book and the Cash Book showed the following.
a) The company had sent to the Bank three cheques on 28th December 2010. The cheques were for Rs.4,100/-, Rs.900/-, and Rs.560/- of these only the cheque for Rs.4,100/- was credited by the Bank before 31st December 2010.
b) The company had issued on 27th December, 2010 cheques for Rs.800/-, Rs.500/- and Rs.1,760/-. The cheque for Rs.1,760/- was paid before 31st December, 2010. The other cheques were paid on 3rd January, 2011.
c) The Bank had debited the company with Rs.120/- as Bank charges and with Rs.5,120/- as interest. The entries had not yet been made in the Cash Book.
d) A customer had deposited in Company’s Account Rs.1,500/- but the fact was not recorded in the Cash Book.
Prepare Bank Reconciliation Statement as on 31st December, 2010.

81
Solution :
Bank Reconciliation Statement as on 31-12-2010
Particulars Rs. Rs.
Balance as per Pass Book as on 31-12-2010.
12,060
Add :
(i) Cheques issued but not encashed before 31- 12-2010 (Rs.800/- + Rs.500/-)
(ii) Direct payment into Bank by the customer not recorded in Cash Book.
1,300
1,500
2,800
Less :
(i) Cheques paid into Bank but not credited by Bank before 31-12-2010 (Rs.560/- + Rs.900/-).
(ii) Bank charges and interest not recorded in Cash Book as on 31-12-2010 (Rs.120/- + Rs.5,120/-)
1,460
5,240
14,800
(6,700)
Balance as per Cash Book as on 31-12-2010.
8,160
Illustration 6 : On 1st January, 2010 the Cash Book of Dayand showed
a Bank balance overdrawn to the extent of Rs.3,117/-. On comparing his Cash Book with the Pass Book he finds that :
1. A Cheque for Rs.125/- sent to Shah has not been entered in the
Cash Book.
2. Bank charges of Rs.47/- at 31st December, 2010 were not entered in
the Cash Book at all.
3. The Bank has debited Dayand’s Account with a cheque for Rs.410/- received from Damodar which had been returned dishonoured. The fact of dishonour was not shown in the Cash Book.
4. The Bank column on the receipt side of the Cash Book was found to
be under cast by Rs.70/-.
5. Unpresented cheques amounted to Rs.1,450/-.
Prepare a Bank Reconciliation Statement of Doyand as on
1st January 2010.

82
Solution :
Bank Reconciliation Statement as on 1-1-2010
Particulars Rs. Rs.
Overdraft as per Pass Book as on 1-1-2010. 3,117
Add :
(i) Bank charges not entered in Cash Book
(ii) Entry for dishonour of cheque not recorded in Cash Book
(iii) Cheque issued to Shah and encashed is not entered in the Cash Book.
47
410
125
582
Less :
(i) Undercasting of the debit side of Bank column.
(ii) Cheques issued but not presented for payment till 01-01-2011.
70
1,450
3,699
(1,520)
Bank Balance as per Pass Book as on 1-1-2011. 2,179
Different Periods:
Sometimes entries in the Pass Book and in the Cash Book (Bank Account) are given. But they are not for the same month but they are two different months. In such a case following entries only in the Cash Book are to be considered for preparation of Reconciliation Statement.
Cash Book entries which appear also in the Pass Book; common entries in the both Books are to be consider for preparation of Reconciliation.
Illustration 7 Prepare Bank Reconciliation Statement as on 30-04-
2010 from the following.
Cash Book (Bank Column)
2010
April Receipts Rs.
2010
April Payments Rs.
1 To Balance b/d 500 5 By Wages A/c 100
10 To Kasab A/c 100 15 By Shanti A/c 200
15 To Interest 50 20 By Pawar A/c 150
20 To Sales A/c 200 25 By Purchases A/c 100
22 To Ashok A/c 300 30 By Balance c/d 600
1,050 1,050

83
Pass Book
2010
May Particulars Rs.
2010
May Particulars Rs.
To Shanti A/c 200 1 By Balance b/d 550
To Pawar A/c 150 2 By Kasab A/c 100
To Charges A/c 25 3 By Sales A/c 200
To Kulkarni A/c 100 10 By Jani A/c 1,100
To Mane A/c 1,010
Common entries in both book are consider in reconciliation.
Uncommon month, common entries appear in Reconciliation.
Solution
Bank Reconciliation Statement as on 30th April 2010
Particulars Rs. Rs.
Bank balance as per Cash Book 600
Add :
(i) Cheques issued but not presented Shanti Pawar
200
150
350
Less :
(i) Cheques deposited but not cleared Kasab Sales
(ii) Cash Book payment total over casted
100
200
100
950
(400)
Bank Balance as per Pass Book as on 1st May
2010.
550
Illustration 8 :
Cash Book (Bank column only) Dr. Cr.
Date Receipts Rs. Date Payments Rs.
2010 2010
Mar 2 To Sales A/c 6,200 Mar 1 By Balance b/d 6,010
4 To A & Co. A/c 1,200 2 By Salaries A/c 7,200
6 To Data’s A/c 3,000 4 By Wages A/c 2,100
10 To Moti’s A/c 6,300 10 By Zandu A/c 4,200

84
14 To Cash A/c 7,000 15 By Commission A/c 1,400
19 To Malini’s A/c 3,000 19 By Drawings A/c 6,100
24 To Sales A/c 1,200 24 By Furniture A/c 3,000
26 To Ketan’s A/c 7,000 29 By Purchases A/c 6,750
30 By Balance c/d 7,160
43,940 43,940
Pass Book (Extract only)
Dr. Cr.
Date Particulars Rs. Date Particulars Rs.
2010 2010
Apr 1 To Balance b/d 9,630 Apr 1 By A & Co. A/c 1,200
6 To Rakesh A/c 1,000 2 By Z & Co. A/c 3,100
7 To Joshi A/c 620 4 By RK & Co. A/c 1,420
9 To Salaries A/c 7,200 9 By Moti’s A/c 6,300
10 To Wages A/c 15,000 10 By Ketan’s A/c 7,000
16 To Furniture A/c 3,000 20 By Plant A/c 7,950
19 To Purchase A/c 6,750 25 By Drawings A/c 1,650
20 To Suresh A/c 1,350
Bank Reconciliation Statement as on 31.03.2010
Particulars Rs. Rs.
Bank balance as per Cash Book
7,200 3,000 6,750
7,180
Add :
(ii) Cheques issued but not presented Salaries Furniture Purchases
16,950
24,130
Less :
(ii) Cheques deposited but not cleared A & Co. Moti Ketan
1,200
6,300
7,000
(14,500)
Bank Balance as per Pass Book as on 1st April
2010.
9,630
Note : When Cash Book & Pass Book are different month, common
entry should be taken in Reconciliation Statement.
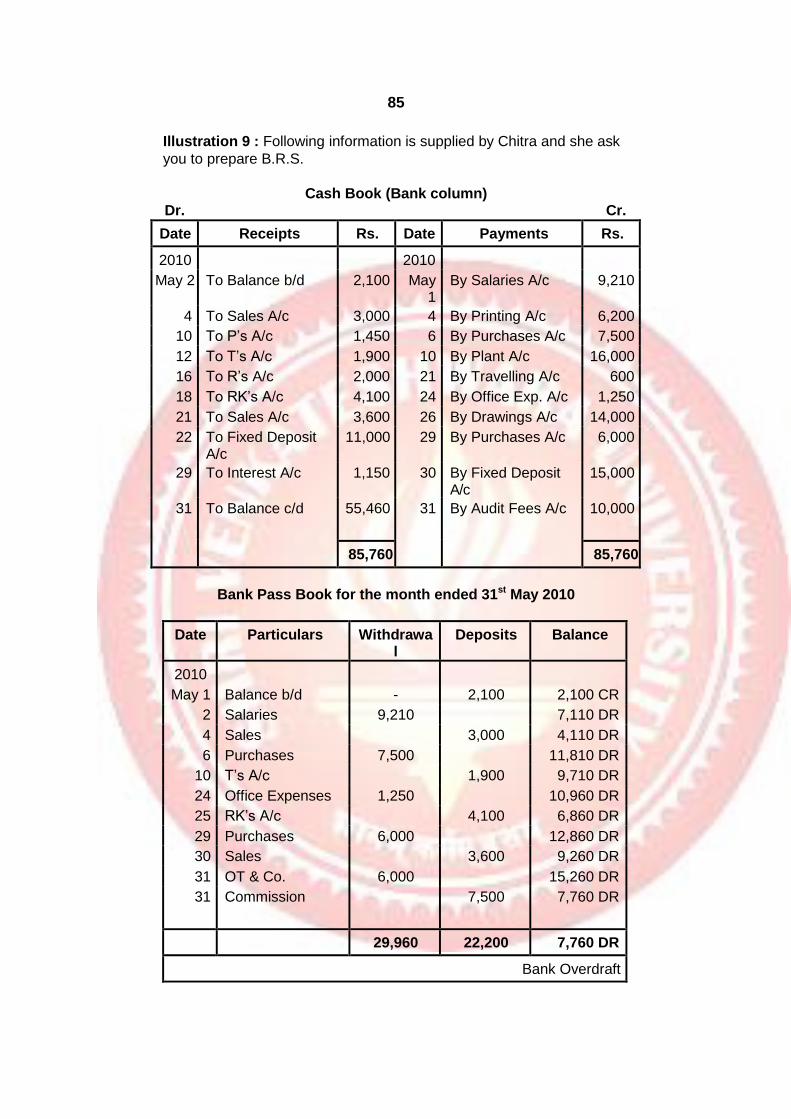
85
Illustration 9 : Following information is supplied by Chitra and she ask
you to prepare B.R.S.
Cash Book (Bank column)
Dr. Cr.
Date Receipts Rs. Date Payments Rs.
2010 2010
May 2 To Balance b/d 2,100 May 1
By Salaries A/c 9,210
4 To Sales A/c 3,000 4 By Printing A/c 6,200
10 To P’s A/c 1,450 6 By Purchases A/c 7,500
12 To T’s A/c 1,900 10 By Plant A/c 16,000
16 To R’s A/c 2,000 21 By Travelling A/c 600
18 To RK’s A/c 4,100 24 By Office Exp. A/c 1,250
21 To Sales A/c 3,600 26 By Drawings A/c 14,000
22 To Fixed Deposit A/c
11,000 29 By Purchases A/c 6,000
29 To Interest A/c 1,150 30 By Fixed Deposit A/c
15,000
31 To Balance c/d 55,460 31 By Audit Fees A/c 10,000
85,760 85,760
Bank Pass Book for the month ended 31st May 2010
Date Particulars Withdrawal
Deposits Balance
2010
May 1 Balance b/d - 2,100 2,100 CR
2 Salaries 9,210 7,110 DR
4 Sales 3,000 4,110 DR
6 Purchases 7,500 11,810 DR
10 T’s A/c 1,900 9,710 DR
24 Office Expenses 1,250 10,960 DR
25 RK’s A/c 4,100 6,860 DR
29 Purchases 6,000 12,860 DR
30 Sales 3,600 9,260 DR
31 OT & Co. 6,000 15,260 DR
31 Commission 7,500 7,760 DR
29,960 22,200 7,760 DR
Bank Overdraft

86
Solution :
Chitra
Bank Reconciliation Statement as on 31st May 2010
Particulars Rs. Rs.
Bank overdraft as per Cash Book as on 31st May
1,450 2,000
11,000
1,150
6,000
55,460
2010.
Add :
(i) Cheques deposited but not presented P R Fixed Deposit Interest
(ii) Cheques issued to OT & Co. not accounted in Cash Book. 21,600
Less :
6,200 16,000
600 14,000 15,000
10,000
7,500
77,060
(i) Cheques issued but not presented Printing Plant Travelling Expenses Drawings Transferred to Fixed Deposits Audit Fees Commission received but not accounted in
Cash Book (69,300)
7,760
EXERCISES
Theory Questions :
i) What is Bank Reconciliation Statement?
ii) What are different reasons for disagreement between Bank balance as per Cash Book & Pass Book / Bank Statement?
iii) Discuss procedure for preparation of Bank Reconciliation
Statement.
iv) A Trader feels that it is not necessary to prepare Bank Reconciliation Statement, do you as Finance Manager agrees with trader? Why?
v) Discuss need of preparing Bank Reconciliation Statement.

87
Practical problems:
1) The Cash Book of Mr. Raj shows a balance of Rs.26,700/- on 31st October, 2011. From the following information you are required to
prepare a Bank Reconciliation Statement as on 31st October, 2010.
i) A cheque of Rs.5,000/- received from Miss Varma, deposited into the Bank but not yet credited in the Pass Book by the
bank.
ii) A cheque of Rs.6,000/- drawn in favour of Miss Meena, had not
been presented into the Bank.
iii) As per our instruction the bank had a promissory note of Rs.1,000/-. It is not yet recorded in the Cash Book.
iv) A cheque of Rs.7,500/- received from Mr. Madhu recorded in the Cash Book, but the same cheque was sent to the bank on 1st
November, 2010.
v) Bank collected proceeds of Bill Receivable amounted to
Rs.5,500/- and credited in the Pass Book but not yet recorded in the Cash Book.
vi) Post dated cheque amounted to Rs.10,500/- issued to Mr.
Shanti, recorded in the Cash Book but not yet presented to the bank.
vii) Pass Book shows credit entries in respect of Rs.4,500/- as interest collected on investment and Rs.2,000/- as dividend collected by bank. These were not recorded in the Cash Book.
2) Prepare Bank Reconciliation Statement as on 31st January, 2011 from the following particulars.
i) Bank balance as per Cash Book Rs.22,510/-.
ii) Cheque amounted to Rs.13,500/- sent to the bank for collection as on 28th January, 2010 but collected by the bank as on 2nd February, 2010.
iii) Bank column of Cash Book credit side cast short by Rs.2,250/-.
iv) Cheques of Rs.7,500/- deposited into the bank and collected by the bank and credited in the Pass Book but recorded twice in the Cash Book.
v) Cheques of Rs.16,000/- issued in favour of Mr. Rane returned
dishonoured for lack of fund. Dishonour of cheque not yet
recorded in the Cash Book.

88
vi) Proprietor has closed his savings account and transferred the balance of Rs.9,500/- to current account, not recorded in Cash Book.
vii) Bank Pass Book shows debit entry for payment of electricity
charges of Rs.1,800/- and credit entry of Rs.9,500/- for collection of salaries. Corresponding entries were not found in the Cash Book.
3) On 31st December, 2010 the Cash Book showed an overdraft of Rs.16,600/-. From the following particulars, prepare Bank Reconciliation Statement as on 31st December, 2010.
i) Cheques paid into the bank but not cleared Rs.4,040/-.
ii) Cheques drawn but not cashed for Rs.3,100/-.
iii) A Bill Receivable for Rs.1,500/- previously discounted with the bank had been dishonoured and debited in the Pass Book
along with bank charges Rs.100/-.
iv) Pass Book debit total undercasted by Rs.100/- whereas credit
total of Cash Book under.
v) Interest on Bank overdraft amounting Rs.6,750/- not accounted in Cash Book.
vi) ECS claring for telephone charges Rs.710 not accounted in
Cash Book.
vii) Debit total of Cash Book Page No. 11 = Rs.3,100/- wrongly carried on credit side of Cash Book.
4) Prepare a Bank Reconciliation Statement from the following
particulars as on 31st March 2010.
i) Cash Book showed an overdraft of Rs.41,000/- as on 31st
March, 2010.
ii) Cheques deposited worth Rs.6,500/- into the bank out of which
only Rs.5,500/- were credited.
iii) Cheques issued worth Rs.3,000/- were not presented until 4th
April, 2010.
iv) The bank has entered in the Pass Book the interest collected on
investment Rs.2,500/- and bank charges Rs.400/-, but same were not entered in the Cash Book.
v) Rs.1,050/- in respect of dishonour of issued cheques appears in the Pass Book and not in the Cash Book.

89
5) Prepare Bank Reconciliation Statement as on 28th February, 2010.
i) Credit balance as per Cash Book was Rs.10,000/- on 28th
February, 2010.
ii) Interest charged by bank Rs.125/- was recorded in the Pass
Book only.
iii) Dividend on shares Rs.1,750/- was collected by bank but not recorded in cash.
iv) Cheques paid into the bank Rs.2,000/- but cheques of
Rs.1,000/- were only cleared and credited by the bank.
v) Two cheques of Rs.4,000/- and Rs.4,200/- were issued, but only the cheque of Rs.4,100/- was presented for payment before the end of month.
6) The Cash Book of Mr. Kamat shows a credit balance of Rs.10,350/-. Prepare the Bank Reconciliation Statement as on 30th April, 2010.
i) Cheques of Rs.4,250/- received and deposited in the bank, but
same were not collected upto 30th April, 2010.
ii) Cheques of Rs.850/- issued, but not presented for payment.
iii) Interest on investment Rs.275/- and dividend of Rs.510/-
collected by the bank and recorded only in the Pass Book.
iv) Cheques of Rs.2,250/- deposited in the bank and collected by the bank but recorded twice in the Cash Book.
v) Cheques of Rs.1,502/- issued and presented for payment, but entered in the Pass Book as Rs.1,052/-.
7) Cash Book of Mr. Dinesh shows a credit balance of Rs.30,000/- on 31st January, 2010. However, his Pass Book shows a different balance. You are therefore, requested to prepare a Bank Reconciliation Statement as on 31st January, 2010 from the following information :
i) Cheques amounting to Rs.15,000/- issued to supplier Mr. Rane, not yet presented for payment.
ii) Cheques amounting to Rs.14,000/- deposited into the bank but
not yet collected by the bank.
iii) Bank has charged Rs.450/- as interest on overdraft for six months ending 31st December, 2010 and also charged Rs.100/- as bank charges for above period. Same were not recorded in the Cash Book.
iv) Total of Cash Book at credit side cast short by Rs.520/-.

90
v) Cheque amounted to Rs.10,525 issued and presented into the bank for payment but recorded in the Pass Book as Rs.10,652/-.
vi) Transfer of Rs.15,000/- from fixed deposit account to current
account, not recorded in the Cash Book.
8) The following are the extracts given from the Cash Book (Bank column only) and bank Pass Book of Mr. V. S. K. You are required
to prepare a Bank Reconciliation Statement as on 31st December, 2010.
Cash Book (Bank column only)
Dr. Cr.
Date Receipts Rs. Date Payments Rs.
2010 2010
Dec16 To Interest A/c 900 Dec15
By Wages A/c 4,400
19 To Vichare & Sons 7,800 18 By Interest A/c 2,700
25 To D.D. Sharma A/c
2,200 22 By Sunder & Sons 1,500
30 To Mukesh’s A/c 2,600 31 By Kishore & Sons 2,100
31 By Balance c/d 2,800
13,500 13,500
2011
Jan 1 To Balance b/d 2,800
Pass Book (Extract only)
Dr. Cr.
Date Particulars Rs. Date Particulars Rs.
2010 2010
Dec18 To Wages A/c 2,400 Dec19
By Interest A/c 900
21 To Interest A/c 1,700 22 By Vichare A/c 7,800
25 To Sunder & Sons 1,500 28 By D.D. A/c 2,200
27 To Janata Trader 400 29 By Jaya A/c 2,020
29 To Service Charges 20
31 To Balance c/d 6,900
12,920 12,920
2011
Jan 1 By Balance c/d 6,900

91
9) From the following extracts of Cash Book and Pass Book, prepare a Bank Reconciliation Statement as on 30.06.2010.
Cash Book (Bank column only)
Dr. Cr.
Date Receipts Rs. Date Payments Rs.
2010
To Balance b/d
To Madhav A/c
To White & Co. A/c
To M/s. Ram Ratan
& Sons A/c
To Commission
A/c To Bhave &
Sons To Govind
A/c
2010
June 1 1,070 une 3 By Keshav & Sons 1,400
5 1,650 9 By Drawing 150
7 1,340 12 By Lala & Sons 1,810
14 19 By Nutan Stores 360
180 20 By Salary 1,350
17 2,250 23 By Vivek & Co. 1,150
22 1,985 29 By Shinde 600
26 1,000 30 By Balance c/d 2,655
9,475
9,475
Bank Pass Book (Extract only)
Dr. Cr.
Date Particulars Rs. Date Particulars Rs.
2010
2010
Jun 1 To Keshav & Sons 1,400 Jun 1 By Balance b/d 1,070
9 To Drawings A/c 150 9 By Madhav A/c 1,650
18 To Lala & Sons A/c 1,810 11 By Dividend A/c 175
25 To Nutan Stores A/c
360 17 By Commission A/c
2,250
27 To Salary A/c 1,350 23 By White & Co. A/c
1,340
29 To Bank Charges 16 29 By Interest A/c 78
30 To Balance c/d 2,477
6,563
6,563

92
10) From the following extracts of Cash Book and Pass Book prepare a Bank Reconciliation Statement as on October 31, 2010.
Cash Book (Bank column)
Dr. Cr.
Date Receipts Rs. Date Payments Rs.
2010 2010
Oct 1 To Balance b/d 4,250 Oct 3 By Salary A/c 2,600
6 To Mr. A A/c 2,000 7 By Commission A/c 175
9 To Mr. B A/c 1,200 10 By Mr. Pal A/c 1,930
16 To Mr. C A/c 2,000 17 By Mr. Bal A/c 1,190
28 To Mr. D A/c 1,600 29 By Mr. Lal A/c 2,500
29 To Mr. E A/c 1,075 30 By Mr. Jal A/c 1,300
31 To Mr. F A/c 1,300 31 By Mr. Dal A/c 1,150
31 By Balance c/d 1,705
Bank Pass Book
Dr. Cr.
Date Particulars Debit Rs.
Credit Rs.
Balance Rs.
2010
Oct 1 By Balance 2,600 1,250
4 To Salary 175 1,350
8 To Commission 2,000 1,525
9 By Mr. A 1,200 475
12 By Mr. B 1675
13 To Mr. Pal 1,930 255
18 By Mr. C 200 55
19 To Mr. Bal 1,190 1,245
26 By Interest 145 1,100
28 By Dividend on Share 12,200 11,100
29 To Subscription to a Club 450 10,650
30 To Life Insurance Premium 450 10,200

93
11) Prepare a Bank Reconciliation Statement for the month of September i.e. as on 30.09.10 from the following.
Cash Book (Bank column)
Dr. Cr.
Date Receipts Rs. Date Payments Rs.
2010
2010
Sep 1 To Balance b/d 400 Sep 2 By Wages A/c 900
To PZ A/c 300 By Purchases A/c 300
To Sales A/c 800 By MO A/c 200
To Interest A/c 150 By KT A/c 250
To Commission A/c 50 By Rent A/c 200
To IT A/c 200 29 By Drawings A/c 100
30 To Balance c/d 50
1,950
1,950
Bank Pass Book
Dr. Cr.
Date Particulars Rs. Date Particulars Rs.
2010
To Wages A/c
To N Cheque
dishonoured A/c
To KT A/c
To MO A/c
To Charges A/c
To Drawings A/c
To Balance c/d
2010
By Balance b/d
By S A/c
By Interest A/c
By B/R
By Sale of
Investment A/c
By T A/c
Sep 2 900 Sep 1 300
100
90 150
250 550
200 28
10 29 300
30 100 200
50
1,600
1,600

94
12) Set out below are extracts from Cash Book (Bank column) & Bank Pass Book of A. Prepare Bank Reconciliation Statement as on 31st March, 2010.
Cash Book
Date Receipts Rs. Date Payments Rs.
2010
2010
Mar 1 To Balance b/d 500 Mar 5 By Salaries A/c 100
5 To Kaju A/c 100 8 By S. A/c 200
10 To Interest A/c 50 11 By S. Pawar A/c 50
15 To Sales A/c 200 12 By Purchases A/c 100
15 By Balance c/d 400
850
850
Bank Pass Book (A’s A/c)
Dr. Cr.
Date Payments Rs. Date Receipts Rs.
2010
To Salaries A/c
To S. A/c
To Purchases A/c
To Commission
A/c To Insurance
Premium A/c
2010
Mar 5 100 Sep By Soman A/c 400
9 200 1 By Balance b/d 200
12 100 6 By Kaju A/c 100
13 25 9 By Interest A/c 50
15 12 By Kulkarni A/c 50
775 15 By Balance c/d 400
1,200
1,200
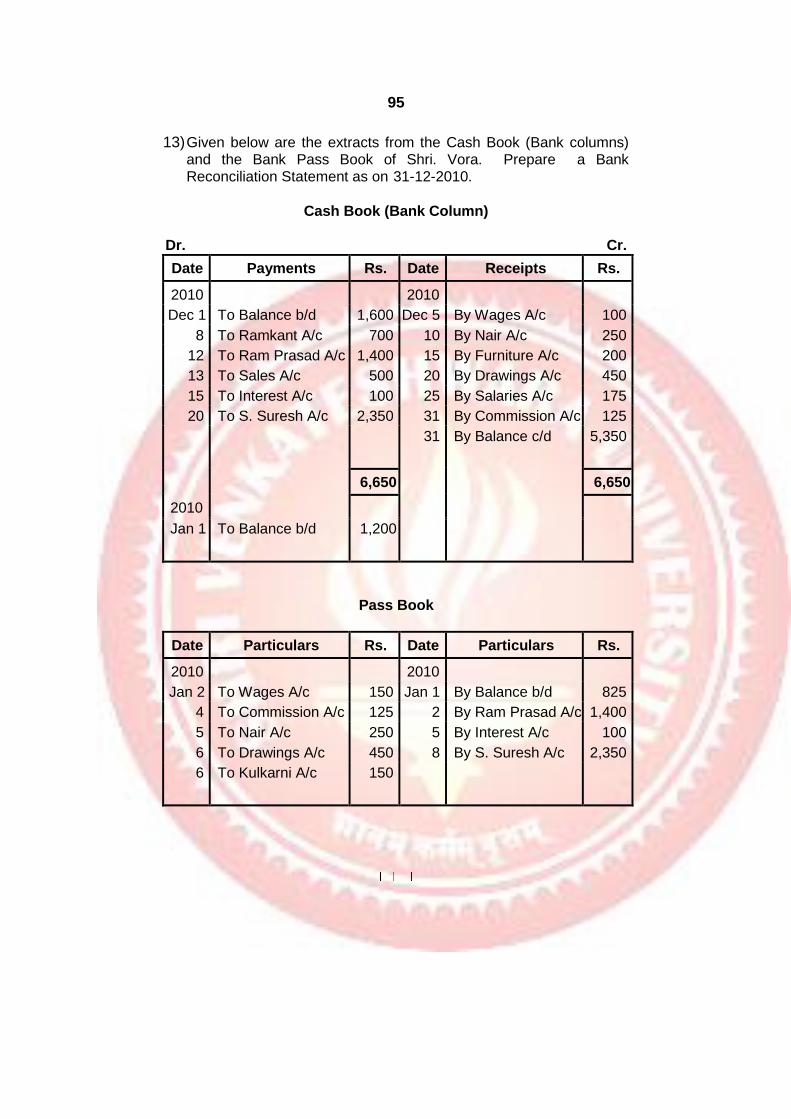
95
13) Given below are the extracts from the Cash Book (Bank columns) and the Bank Pass Book of Shri. Vora. Prepare a Bank Reconciliation Statement as on 31-12-2010.
Cash Book (Bank Column)
Dr. Cr.
Date Payments Rs. Date Receipts Rs.
2010 2010
Dec 1 To Balance b/d 1,600 Dec 5 By Wages A/c 100
8 To Ramkant A/c 700 10 By Nair A/c 250
12 To Ram Prasad A/c 1,400 15 By Furniture A/c 200
13 To Sales A/c 500 20 By Drawings A/c 450
15 To Interest A/c 100 25 By Salaries A/c 175
20 To S. Suresh A/c 2,350 31 By Commission A/c 125
31 By Balance c/d 5,350
6,650 6,650
2010
Jan 1 To Balance b/d 1,200
Pass Book
Date Particulars Rs. Date Particulars Rs.
2010 2010
Jan 2 To Wages A/c 150 Jan 1 By Balance b/d 825
4 To Commission A/c 125 2 By Ram Prasad A/c 1,400
5 To Nair A/c 250 5 By Interest A/c 100
6 To Drawings A/c 450 8 By S. Suresh A/c 2,350
6 To Kulkarni A/c 150

96
5
LEDGER AND TRIAL BALANCE
Unit Structure:
Objectives
Meaning
How to open an Account in the ledger
Posting
Balance and Balancing of Accounts
Meaning of Balances
Illustrations-1
Trial Balance
Some important items and their balance
Illustrations-2
Exercises
OBJECTIVES
After studying the unit the students will be able to:
Know the meaning of Ledger.
Understand the process of opening a Ledger Account.
Prepare a Ledger Account from the given information.
Explain the types of Trial Balance.
Prepare the Trial Balance from the balances given.
MEANING
The ledger is the principal book of accounts relating to a particular person or property or revenue or expenses are recorded in summarized form. It is a set of accounts. It contains all accounts of the business enterprise whether real, nominal or personal. The main function of a ledger is to classify or sort out all items appearing in the journal or other subsidiary books under their appropriate accounts & that at the end of the accounting period

97
each account will contain the entire information of all the transactions relating to in a summarized or condensed form.
All the transactions are recorded first in the journal and then from the journal they are posted in the respective accounts in the ledger. Ledger is a book where in all the transactions would ultimately
find their place under the respective heads of accounts. Ledger is a book of final entry.
HOW TO OPEN AN ACCOUNT IN THE LEDGER :
The pages of all books of accounts must be numbered to facilitate reference. The page is divided into two parts by vertical line in
between. The left hand side is used as a debit side of an account and the right hand side is used as a credit side.
Name (Account)
Dr. Cr.
Date Particulars J.F. Amt. Date Particulars J.F. Amt.
POSTING :
Every transaction is first recorded in the book of original entry and then it is posted into the ledger. Posting is made to the debit side account which is debited in the journal entry and to the credit side of an account which is credited in the journal entry. Name of the credit account is written on the debit account and the name of debit account is
written on the credit side of account. Entry on the debit side of an account starts with “To” whereas on the credit side starts with “By”.
BALANCE AND BALANCING OF ACCOUNTS :
The object of recording the business transactions in various ledger accounts to enable a trader to ascertain balance in account easily at any time. For the preparation of Trial balance all accounts are to be closed.

98
Each account in the ledger may have same entries on the debit side and some entries on the credit side of an account. Find out difference between totals of each side. The difference in the total of both the side is termed as Balance of an account. The process of extracting the balance and inserting it on lesser side of an account is
called balancing or closing of an account.
Types of Balances
A) Debit Balance : If the debit side of an account is heavier than its
credit side, the balance is called debit balance.
B) Credit Balance : If the credit side of an account is heavier than its
debit side, the balance is called credit balance.
MEANING OF BALANCES :
Personal Accounts : Personal Accounts may have debit or credit
balance.
Debit balance shows that person owes to the firm. He is debtors.
Credit balance shows that persons owed to him. He is creditor.
Real Accounts : Real accounts always have debit balance. These
are value of Assets, properties owned by businessmen.
Nominal Accounts : Nominal Account may have debit or credit
balance debit balances shows total expenses / losses for the period. Credit balances shows total income / gain for the period.
At the end of accounting period balances of nominal accounts
transferred to Trading, Profit & Loss Account, whereas balances shown of Personal Accounts & Real accounts in the Balance Sheet, and next year these balances considered as opening balances.
CHECK YOUR PROGRESS
Fill in the blanks:
1. If the debit side of an account is heavier than its credit side, the balance is called ----------------------------------- --.
2. The left hand side of a Ledger Account is used as a ---------
----- and the right hand side is used as a ---------------------- --.
3. -----------------and ---------------- Accounts may have debit or
credit balance.

99
4. Debit balance of the -----------Account shows that person owes to the firm. It means he is the ----------------------- of the firm.
5. Credit balances of the Nominal Account shows total --------- -----------------for the period.
6. Real accounts always have ----------------- balance.
Define Ledger and draw the proforma of Ledger Account.
ILLUSTRATIONS-1 :
Illustration 1: Enter the following transactions in the proper subsidiary
books and post them to the Ledger Accounts and balance the Account 30 June 2010.
1 Commenced business with Cash Rs.5,000/- (of which
Rs.2,000/- borrowed from friend Ram) and furniture Rs.1,400/-
2 Purchased goods from Kanta Rs.1,800/- less 5%. Trade Discount.
6 Sold goods to Ketual costing Rs.400/- at 10% Profit.
7 Cash purchases Rs.500/-.
8 Cash sales – Rs.1,200/-.
9 Purchased goods from Baba Rs.500/-.
9 Paid into Bank Rs.2,000/-.
10 Returned to Kanta goods worth Rs.150/-.
11 Purchased office furniture for Rs.1,200/- and paid for same by
cheque.
16 Issued a cheque to Kanta for Rs.910/-.
21 Invoiced goods to Ketual Rs.5,000/- less 2% Trade discount.
23 Ketual paid cash Rs.400/- and returned goods of Rs.140/-.
24 Purchased goods from Kanta Rs.1,300/-.
28 Returned damaged goods to Janta Rs.160/- & to Baba Rs.150/-.
28 Sold goods to Kant Rs.1,200/-.
29 Received a cheque for Rs.1,100/- from Kant and banked the
same.
30 Kant, who owes us Rs.100/- pays rent Rs.100/- to our landlord on our behalf.
30 We paid Rs.75/- to Raju on instructions from our creditor Kanta
on his behalf.

100
Solution : Journal
Date Particulars L.F. Debit Rs.
Credit Rs.
2010
June 1
Furniture A/c ................................. Dr.
To Capital A/c
(Furniture brought in by Proprietor.)
1,400 1,400
30 Rent A/c ........................................ Dr.
To Kant A/c
(Rent paid by Kant on our behalf.)
100
100
Purchases Book
Date Name of Supplier Inward Invoiced No.
L.F. Amount Rs.
2010
June 2 Kanta - - 1,710
9 Baba - - 500
24 Kanta - - 1,300
Total 3,510
Returns Outward Book
Date Particulars Debit Note No.
L.F. Amount Rs.
2010
June 10
Kanta - - 150
28 Kanta - - 160
28 Baba - - 150
Total 460
Sales Book
Date Particulars Debit Note No.
L.F. Amount Rs.
2010
June 6 Ketual - - 440
21 Ketual - - 4,900

101
28 Kant - - 1,200
Total 6,540
Returns Inward Book
Date Particulars Credit Note No.
J.F. Amount Rs.
2010
June 23
Ketual
-
-
140
Total 140
Cash Account
Dr. Cr.
Date Particulars L.F. Bank Cash Date Particulars L.F. Bank Cash
2010 To Capital
A/c To Ram
Loan
A/c
To Sales A/c
To Cash A/c
To Ketual
A/c To Kant’s
A/c
To Balance b/d
2010 By Purchases
A/c
By Bank A/c
By Furniture
A/c By Kanta
A/c By Kanta
A/c By
Balance c/d
June 1
3,000 June 7
1 9 500
8 2,000 11 C 2,000
9 1,200 16 1,200
23 C 2,000 30 910
29 400 30 75
1,100 990 4,025
3,100 6,600 3,100 6,600
July 1 990 4,025
Capital Account
Dr. Cr.
Date Particulars J.F.
Rs. Date Particulars J.F.
Rs.
2010
June 30
To Balance c/d
4,400
2010
June 1
July 1
By Cash A/c
By Furniture A/c
By Balance b/d
3,000
1,400
4,400 4,400
4,400
Furniture Account
Dr. Cr.
Date Particulars J.F
Rs. Date Particulars J.F.
Rs.
2010 2010
June 30
To Capital A/c 1,400 June 30
By Balance c/d
2,600

102
11 To Bank A/c 1,200

103
July 1
To Balance b/d
2,600 2,600
2,600
Purchases Account Dr. Cr.
Date Particulars J.F.
Rs. Date Particulars J.F.
Rs.
2010 2010
June 7
To Cash A/c 500 June 30
By Balance c/d
4,010
30 To Sundries A/c
3,510
(as per purchase
Book)
4,010 4,010
July 1 To Balance b/d 4,010
Sales Account
Dr. Cr.
Date Particulars J.F.
Rs. Date Particulars J.F.
Rs.
2010 2010
June 30
To Balance c/d
7,740 June 8 By Cash A/c 1,200
30 By Sundries A/c 6,540
7,740 7,740
July 1 By Balance b/d 7,740
Return Outward Account
Dr. Cr.
Date Particulars J.F.
Rs. Date Particulars J.F.
Rs.
2010
June 30
To Balance c/d
460
2010
June 30
July 1
By Sundries A/c
(as per R. O. Book) By Balance b/d
460
460 460
460
Return Inward Account
Dr. Cr.
Date Particulars J.F.
Rs. Date Particulars J.F.
Rs.
104
2010
June 30
To Balance c/d
140
2010
June 1
By Balance c/d
140
140 140

105
July 1 To Balance b/d
140
Ram’s Loan Account Dr. Cr.
Date Particulars J.F.
Rs. Date Particulars J.F.
Rs.
2010
June 10
To Balance c/d
2,000
2010
June 1
July 1
By Cash A/c
By Balance b/d
2,00
0
2,000 2,000
2,000
Kanta’s Account Dr. Cr.
Date Particulars J.F.
Rs. Date Particulars J.F.
Rs.
2010 To Return
Outward
A/c To Bank
A/c To
Returns
Outward
A/c To Cash
A/c To
Balance c/d
2010
June 10
June 2 By Purchases A/c
1,710
150 24 By Purchases A/c
1,300
19 910
28
160
30 75
30 1,715
3,010 3,010
July 1 By Balance b/d 1,715
Ketual’s Account
Dr. Cr.
Date Particulars J.F.
Rs. Date Particulars J.F.
Rs.
2010 2010 By Return
Inward A/c
By Cash A/c
By Bal. c/d
June 6 To Sales A/c 440 June 23
21 To Sales A/c 4,900 140
400
4,800
5,340 5,340
July 1 To Balance b/d
4,800
Rent Account

106
Dr. Cr.
Date Particulars J.F.
Rs. Date Particulars J.F.
Rs.

107
2010
June 30
To Kant A/c
100
2010
June 30
By Balance c/d
100
100 100
Baba’s Account
Dr. Cr.
Date Particulars J.F.
Rs. Date Particulars J.F.
Rs.
2010
June 28
30
To Return
Outward
A/c To
Balance c/d
150
350
2010
June 9
30
By Purchases A/c
500
500 500
July 1 By Balance b/d 350
Kant’s Account
Dr. Cr.
Date Particulars J.F.
Rs. Date Particulars J.F.
Rs.
2010
June 28
To Sales A/c
1,200
2010
June 29
By Bank A/c
By Rent A/c
1,10
0
100
1,200 1,200
Illustration 2 : M. D. as on 1st March 2010
Debit Balance
Rs. Credit Balance Rs.
Cash A/c 15,000 Capital A/c 60,000 Bank A/c 12,000 Mr. Chandra A/c 9,000 Stock A/c 14,000 ZaCo A/c 28,000
2010
March 2 Borrowed Rs.30,000/- from sister Maya for business purpose.
4 Bought goods from Mr. Chandra for Rs.6,000/- @ 5% trade discount.
7 Sold goods worth Rs.15,000/- to Mr. ZaCo @ 2% trade discount.
9 Received Rs.7,000/- from Mr. ZaCo.
10 Cash deposited into Bank Rs.7,000/-.
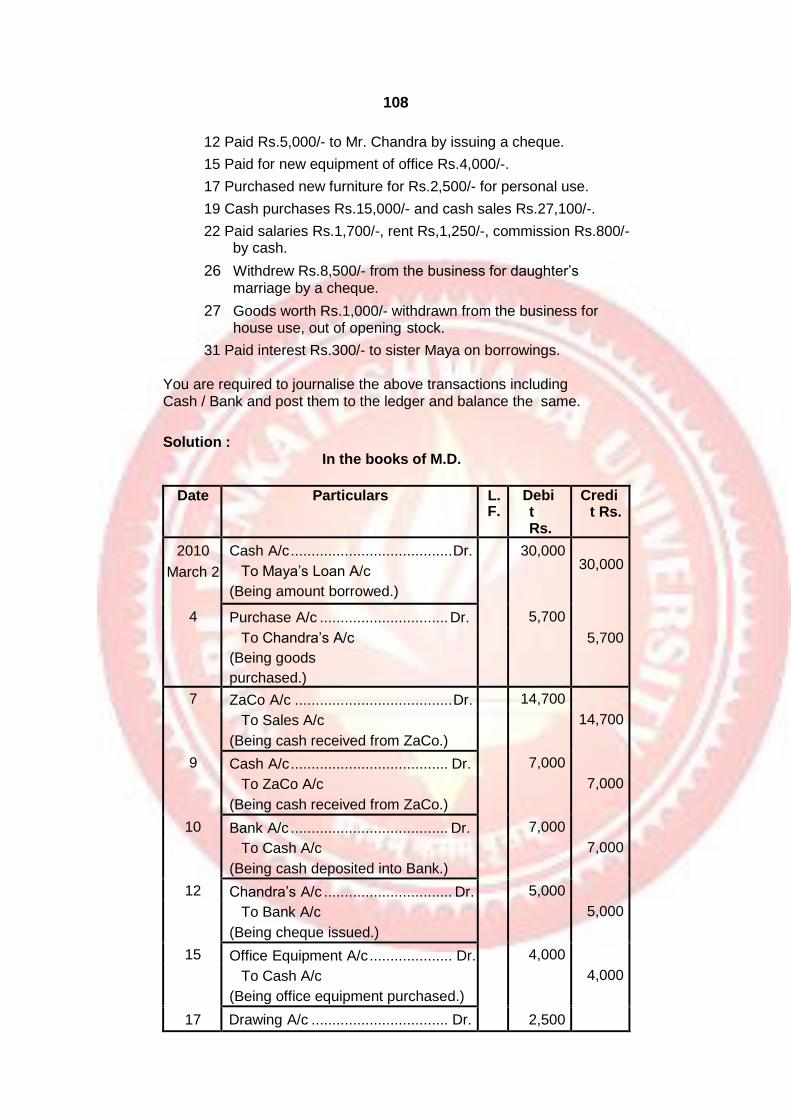
108
12 Paid Rs.5,000/- to Mr. Chandra by issuing a cheque.
15 Paid for new equipment of office Rs.4,000/-.
17 Purchased new furniture for Rs.2,500/- for personal use.
19 Cash purchases Rs.15,000/- and cash sales Rs.27,100/-.
22 Paid salaries Rs.1,700/-, rent Rs,1,250/-, commission Rs.800/- by cash.
26 Withdrew Rs.8,500/- from the business for daughter’s
marriage by a cheque.
27 Goods worth Rs.1,000/- withdrawn from the business for house use, out of opening stock.
31 Paid interest Rs.300/- to sister Maya on borrowings.
You are required to journalise the above transactions including Cash / Bank and post them to the ledger and balance the same.
Solution : In the books of M.D.
Date Particulars L. F.
Debit Rs.
Credit Rs.
2010
March 2
Cash A/c ....................................... Dr.
To Maya’s Loan A/c
(Being amount borrowed.)
30,000 30,000
4 Purchase A/c ............................... Dr.
To Chandra’s A/c
(Being goods
purchased.)
5,700
5,700
7 ZaCo A/c ...................................... Dr.
To Sales A/c
(Being cash received from ZaCo.)
14,700
14,700
9 Cash A/c ...................................... Dr.
To ZaCo A/c
(Being cash received from ZaCo.)
7,000
7,000
10 Bank A/c ...................................... Dr.
To Cash A/c
(Being cash deposited into Bank.)
7,000
7,000
12 Chandra’s A/c ............................... Dr.
To Bank A/c
(Being cheque issued.)
5,000
5,000
15 Office Equipment A/c .................... Dr.
To Cash A/c
(Being office equipment purchased.)
4,000
4,000
17 Drawing A/c ................................. Dr. 2,500

109
To Cash A/c
(Being furniture purchased for personal use.)
2,500

110
19 Purchases A/c .............................. Dr.
To Cash A/c
(Being goods purchased.)
15,000
15,000
19 Cash A/c ...................................... Dr.
To Sales A/c
(Being goods sold.)
27,100
27,100
22 Salaries A/c ................................. Dr.
Rent A/c ....................................... Dr.
Commission A/c ........................... Dr.
To Cash A/c
(Being Salaries, Rent & Commission paid.)
1,700
1,250
800
3,750
26 Drawing A/c ................................. Dr.
To Bank A/c
(Being amount withdrawn by cheque
for personal use.)
8,500
8,500
27 Drawing A/c .................................. Dr.
To Stock A/c
(Being goods taken for personal use.)
1,000
1,000
31 Interest A/c ................................... Dr.
To Cash A/c
(Being interest paid on Maya’s loan.)
300
300
Ledger Accounts Cash Account
Dr. Cr.
Date Particulars J.F.
Rs. Date Particulars J.F.
Rs.
2010 To Bal b/d
To Maya’s
Loan
A/c To
ZaCo A/c
To Sales
A/c
To Balance b/d
2010
By Cash A/c
By Office
Equipment
A/c By
Drawings A/c
By Purchases
A/c By Salaries
A/c By Rent A/c
By Commission A/c
By Interest A/c
By Balance c/d
Mar 1 15,000 Mar 10 7,000
2 30,000 15
17 4,000
7,000 19 2,500
19 27,100 22 15,000
22 1,700
22 1,250
31 800
31
300
46,550
79,100 79,100
Apr 1 46,550

111
Bank Account
Dr. Cr.
Date Particulars J.F.
Rs. Date Particulars J.F.
Rs.
2010 2010
Mar 1 To Bal b/d 12,000 Mar 12 By Chandan’s A/c
5,000
10 To Cash A/c 7,000 26 By Drawings A/c
8,500
37 By Balance c/d 5,500
19,000 19,000
Apr 1 To Balance b/d
5,500
Stock Account Dr. Cr.
Date Particulars J.F.
Rs. Date Particulars J.F.
Rs.
2010 2010
Mar 1 To Bal b/d 14,000 Mar 27 By Drawings A/c
1,000
31 By Balance c/d 13,000
14,000 14,000
Apr 1 To Balance b/d
13,000
Purchase Account Dr. Cr.
Date Particulars J.F.
Rs. Date Particulars J.F.
Rs.
2010 To Chandra’s
A/c
To Cash A/c
To Bal b/d
2010
Mar 1 5,700 Mar 31 By Bal c/d 20,700
19 15,000
20,700 20,700
Apr 1 20,700
Sales Account Dr. Cr.
Date Particulars J.F.
Rs. Date Particulars J.F.
Rs.
2010 2010
Mar 31 To bal c/d 41,800 Mar 1 By ZaCo A/c 14,700
31 By Cash A/c 27,100

112
41,800 41,800
Apr 1 By Balance b/d 41,800

109
Salaries Account Dr. Cr.
Date Particulars J.F.
Rs. Date Particulars J.F.
Rs.
2010
Mar 22
Apr 1
To Cash A/c
To Balance b/d
1,700
2010
Mar 31
By Balance c/d
1,700
1,700 1,700
1,700
Rent Account Dr. Cr.
Date Particulars J.F.
Rs. Date Particulars J.F.
Rs.
2010
Mar 22
Apr 1
To Cash A/c
To Balance b/d
1,250
2010
Apr 1
By Balance c/d
1,250
1,250 1,250
1,250
Commission Account
Dr. Cr.
Date Particulars J.F.
Rs. Date Particulars J.F.
Rs.
2010 Mar 22
Apr 1
To Cash A/c
To Balance b/d
800
2010 Apr 1
By Balance c/d
800
800 800
800
Interest Account
Dr. Cr.
Date Particulars J.F.
Rs. Date Particulars J.F.
Rs.
2010
Mar 31
Apr 1
To Cash A/c
To Balance b/d
300
2010
Apr 1
By Balance c/d
300
300 300
300

110
ZaCo’s Account
Dr. Cr.
Date Particulars J.F.
Rs. Date Particulars J.F.
Rs.
2010 2010
Mar 1 To Balance b/d
28,000 Mar 9 By Cash A/c 7,000
7 To Sales A/c 14,700 31 By Bal c/d 35,700
42,700 42,700
Apr 1 To Balance b/d
35,700
Capital Account
Dr. Cr.
Date Particulars J.F.
Rs. Date Particulars J.F.
Rs.
2010
Mar 31
To bal c/d
60,000
2010
Mar 1
Apr 1
By Balance b/d
By Balance b/d
60,00
0
60,000 60,000
60,000
Mr. Chandra’s Account
Dr. Cr.
Date Particulars J.F.
Rs. Date Particulars J.F.
Rs.
2010 2010
Mar 12 To Bank A/c 5,000 Mar 1 By Balance b/d 9,000
31 To Balance c/d
9,700 2 By Purchase A/c
5,700
14,700 14,700
Apr 1 To Balance b/d 9,700
Maya’s Loan Account
Dr. Cr.
Date Particulars J.F.
Rs. Date Particulars J.F.
Rs.
2010
Mar 31
To Balance c/d
30,000
2010
Apr 1
Apr 1
By Cash A/c
To Balance b/d
30,00
0
30,000 30,000
30,000

111
Office Equipment Account
Dr. Cr.
Date Particulars J.F.
Rs. Date Particulars J.F.
Rs.
2010
Mar 15
Apr 1
To Cash A/c
To Balance b/d
4,000
2010
Mar 31 By Balance c/d
4,000
4,000 4,000
4,000
Drawings Account Dr. Cr.
Date Particulars J.F.
Rs. Date Particulars J.F.
Rs.
2010 To Cash A/c
To Bank A/c
To Goods
A/c
(stock)
To Balance b/d
2010
Mar 17 2,500 Mar 31 By Balance c/d
12,000
26 8,500
27 1,000
12,000 12,000
Apr 1 12,000
TRIAL BALANCE
Introduction :
The fundament principle of double entry book keeping is that
debit must be equal to credit. In other words, debit aspect of any transaction is always equal to its credit aspect.
All ledger accounts are balances. A debit balance in a general ledger account indicates an excess of debit side over credit side of the
account. A credit balance in a ledger account indicates the excess of credit side over debit side of the account. A trial balance is a summary of all the ledger balances outstanding as on particular date. List of debit balances and credit balances should be equal. It said that Trial balance is tallied. When trial balance tallies is establishes the arithmetical accuracy of record. It is a statement prepared before
preparing the final accounts. It is a link between books of account and final accounts i.e. the Trading & Profit & Loss A/c and Balance Sheet.
Types of trial balances
Trial balances are of two types.
1) Gross Trial Balance
2) Net Trial Balance

112
1 Gross Trial Balance :
Gross Trial Balance is prepared by taking all ledger account debit total and credit total, instead of considering ledger balances, as on a particular date.
Illustration 3 : Gross Trial Balance can be as under –
Sr.
No. Name of Account
Total debit
side (Rs.)
Total credit
side (Rs.)
1 Ketan’s Capital 5,000 76,000
2 Opening Stock 10,000 -
3 Purchases 2,10,000 2,000
4 Sales 2,000 3,05,000
5 Sales Return 18,000 -
6 Expenses 27,000 -
7 Customers 1,20,000 26,000
8 Suppliers 12,000 80,000
9 Cash 6,000 -
10 U. C. Bank 96,000 17,000
5,06,000 5,06,000
2 Net Trial balance :
Net trial balance is list of debit & credit balance, taken from
ledger accounts on particular date. Normally, net trial balance is prepare, since it is transferred to final accounts and personal and real accounts balance are carried forward from current year to subsequent year.
Illustration 4 : Trial Balance as on 31st March 2010.
Sr.
No. Name of Account
Total debit
side (Rs.)
Total credit
side (Rs.)
1 Opening Stock 12,000 -
2 Capital - 1,02,000
3 Purchases 2,10,000 -
4 Purchase Return - 6,000
5 Sales - 3,11,000
6 Sales Return 4,000 -
7 Expenses 28,000 -
8 Plant & Machinery 1,20,000 -
9 Customers 80,000 -
10 Suppliers - 62,000
11 Cash 6,000 -
12 Bank balance 21,000 -
4,81,000 4,81,000

113
SOME IMPORTANT ITEMS AND THEIR
BALANCES
1. Capital : Credit balance
2. Drawings : Debit balance
3. Purchases : Debit balance
4. Expenses : Debit balance
5. Incomes : Credit balance
6. Carriage Inwards : Debit balance
7. Carriage Outwards : Debit balance
8. Stock (opening) : Debit balance
9. Loan taken : Credit balance
10. Interest paid : Debit balance
11. Loan given : Debit balance
12. Interest received : Credit balance
13. Assets : Debit balance
14. Suppliers : Credit balance
15. Sales Return : Debit balance
16. Purchases : Debit balance
17. Return Outwards : Credit balance
18. Investments : Debit balance
19. Goodwill : Debit balance
20. Cash : Debit balance
Note : Closing stock should not be taken in trial balance. However, it
Gross Profit is given in trial balance then it should be taken as Debit balance.
ILLUSTRATIONS-2
Illustration 5 : From the following prepare Gross Trial balance and net
Trial balance as on 31st March 2010.
Particulars Totals
Cash (Dr.) 21,500
Bank (Dr.) 13,000
Furniture (Dr.) 21,000
Creditors (Dr.) 13,700
Debtors (Dr.) 22,000
Rent (Dr.) 5,500
Salaries (Dr.) 2,900
Cash (Cr.) 14,300

114
Capital (Cr.) 10,000
Bank (Cr.) 2,900
Furniture (Cr.) 400
Creditors (Cr.) 14,000
Debtor (Cr.) 4,800
Rent (Cr.) 900
Solution :
(A) Gross Trial Balance as on 31.03.2010
Particulars
(i.e. Names of Accounts)
Debit Total
(Rs.)
Credit Total
(Rs.)
Cash 21,500 14,300
Bank 13,000 2,900
Furniture 21,000 400
Creditors 13,700 14,000
Debtors 22,000 4,800
Rent 5,500 900
Salaries 2,900 -
Capital - 62,300
99,600 99,600
(B) Net Trial Balance
Particulars Debit
Balance (Rs.)
Credit
Balance (Rs.)
Cash (Dr. – Cr.) 7,200 -
Bank (Dr. – Cr.) 10,100 -
Furniture (Dr. – Cr.) 20,600 -
Creditors (Cr. – Dr.) - 300
Debtors (Dr. – Cr.) 17,200 -
Rent (Dr. – Cr.) 4,600 -
Salaries 2,900 -
Capital - 62,300
62,600 62,600

115
Illustration 6 : Prepare a Trial Balance from the following items :
Particulars Totals
Capital 7,63,050
Furniture & Fixture 40,000
Land & Building 4,03,000
Plant & Machinery 2,00,000
Drawings 60,000
Patents 20,000
Stock 4,00,000
Purchases 9,50,000
Wages 50,000
Salaries 72,000
Sundry Debtors 3,50,000
Sales 13,20,000
Sales Returns 61,000
Purchases Returns 10,000
Loan from Ketan 4,00,000
Rent, Rates & Taxes 48,000
Bad Debts 4,000
Sundry Creditors 2,24,000
Discount received 9,000
Trade Expenses 700
Interest on Loan 4,500
Insurance 6,500
Traveling Expenses 3,000
Cash in Hand 2,100
Cash at Bank 51,250
Solution :
Trial balance
Particulars Debit (Rs.) Credit (Rs.)
Capital - 7,63,050
Furniture & Fixture 40,000 -
Land & Building 4,03,000 -
Plant & Machinery 2,00,000 -
Drawings 60,000 -
Patents 20,000 -

116
Stock 4,00,000 -
Purchases 9,50,000 -
Wages 50,000 -
Salaries 72,000 -
Sundry Debtors 3,50,000 -
Sales - 13,20,000
Sales Returns 61,000 -
Purchases Returns - 10,000
Loan from Ketan - 4,00,000
Rent, Rates & Taxes 48,000 -
Bad Debts 4,000 -
Sundry Creditors - 2,24,000
Discount received - 9,000
Trade Expenses 700 -
Interest on Loan 4,500 -
Insurance 6,500 -
Traveling Expenses 3,000 -
Cash in Hand 2,100 -
Cash at Bank 51,250 -
27,26,050 27,26,050
Illustration 7 : Prepare Trial balance from ledger Account open in
Illustration No. 1.
Solution : Trial balance as on 31st June 2010
Sr. No.
Particulars L.F. Debit
(Rs.)
Credit
(Rs.)
1 Cash 990 -
2 Bank 4,025 -
3 Capital - 4,400
4 Furniture 2,600 -
5 Purchases 4,010 -
6 Sales - 7,740
7 Return Outwards - 460
8 Return Inwards 140 -
9 Ram’s Loan - 2,000
10 Kanta’s A/c - 1,715

117
11
12
13
Ketual’s A/c
Rent A/c
Baba’s A/c
4,800
100
-
-
-
350
16,665 16,665
Illustration 8 : Prepare Trial balance from ledger accounts opened in
illustration No. 2.
Solution : Trial balance as on 31st March 2010
Sr.
No. Particulars L.F.
Debit
(Rs.)
Credit
(Rs.)
1 Cash 46,550 -
2 Bank 5,500 -
3 Stock 13,000 -
4 Purchases 20,700 -
5 Sales - 41,800
6 Salaries 1,700 -
7 Rent 1,250 -
8 Commission 800 -
9 Interest 300 -
10 ZaCo 35,700 -
11 Capital - 60,000
12 Chandras - 9,700
13 Maya’s Loan - 30,000
14 Office Equipment 4,000 -
15 Drawings 12,000 -
1,41,500 1,41,500
EXERCISES :
Theory questions :
1. What is ledger?
2. How entries from Journal posted to Ledger?
3. Why Real Account have always debit balance or nil balance.
4. What are different types of Trial Balance?

118
5. Why Trial Balance tallies?
6. Distinguish between Gross Trial Balance and Net Trial Balance.
7. Why Trial Balance prepared?
Practical Problems :
Prepare a Trial balance from the following as on March 31st, 2010.
Particulars Totals
Stock 60,000
Purchases 1,50,000
Capital 70,000
Drawings 22,000
Sales 2,50,000
Traveling Expenses 1,320
Salaries 11,200
Rent, Taxes & Insurance 5,600
Returns Outwards 2,600
Advertising 840
Wages 7,000
Bank Overdraft 20,000
General Trade Expenses 1,350
Returns Inwards 5,400
Discount allowed 600
Interest & Commission paid 430
Bad Debts 800
Sundry Creditors 60,000
Cash in hand 2,060
Sundry Debtors 92,000
Furniture 10,000
Plant & Machinery 20,000
Buildings 12,000

119
Following are the balances extracted from the ledger of Shri. Ketan.
Prepare a Trial Balance as on 31st Dec. 2010.
Particulars Rs. Particulars Rs.
Capital A/c 40,000 Purchases 26,500
Drawings A/c 4,000 Printing & Stationery 3,000
Sundry Creditors 18,440 Rent & Taxes 2,500
Motor Car Expenses 3,000 Office Expenses 7,000
Sales 29,560 Commission paid 5,000
Trade Expenses 8,500 Sundry Debtors 18,000
Insurance 1,030 Discount Allowed 2,970
Opening Stock 8,500 Interest Received 2,000
The following balances appeared in the ledger of M/s. Tata Traders
as on 1st July 2010.
Debit Balance Rs. Credit Balance Rs.
Cash A/c 35,000 Capital A/c 80,000
Bank A/c 30,000 Kamath’s A/c 5,000
Goods A/c 35,000 10% Term Loan 20,000
Mehta’s & Son’s A/c 15,000
1,05,000
1,05,000
2010
July1 Borrowed Rs.25,000/- from wife for expansion of the
business and deposited Rs.20,000/- in Bank.
4 Deposited Rs.15,000/- into the Bank.
6 Received from Mr. Mehta and Sons Rs.9,550/- in part
payment of Rs.10,000/-.
8 Paid Rs.1,900/- to Mr. Kamath in part payment of Rs.2,000/-
.
20 Withdrew from bank Rs.5,000/- for office use and Rs.4,000/- for private use.
24 Cash sales Rs.20,000/-.
25 Paid Salaries Rs.1,250/-, rent Rs.1,400/- and received commission Rs.2,600/- in cash.

120
28 Paid Rs.20,000/- for part payment of wife’s loan. Also interest of Rs.1,250/- due on loan.
31 Deposited Rs.11,500/- into the Bank.
From the above transactions, draft journal entries, post them to respective ledger accounts and balance them, also prepare Trial Balance.
The following balances appeared in the ledger of Shri as on 1st
March 2010.
Debit Balance Rs. Credit Balance Rs.
Cash A/c 25,000 Capital A/c 60,000
Bank A/c 10,000 Mr. Nair A/c 16,000
Goods A/c 35,000
Govinda’s A/c 6,000
2010
Mar.1 Introduced further capital in cash Rs.25,000/-.
2 Deposited Rs.15,000/- into the bank.
4 Received Rs.3,000/- from Mr. Govind.
7 Paid Rs.4,000/- to Mr. Nair.
9 Bought goods costing Rs.17,500/- on credit from Nair.
15 Sold goods to Mr. Govind for Rs.16,000/-.
20 Bought goods from Mr. Nair for Rs.40,000/-.
24 Withdrew Rs.12,000/- from bank for office use.
25 Good costing Rs.20,000/- sold @ 25% Profit.
26 Rent paid by cheque Rs.6,000/-.
27 Salaries paid Rs.10,000/- a wages Rs.2,000/-.
29 Received cash from Govind Rs.9,000/- and allowed him
discount Rs.100/-.
30 Withdrawn cash Rs.4,000/- and Rs.6,000/- by cheque for
personal use.
You are required to journalise above transaction and prepare necessary ledger accounts and prepare trial balance.

121
Following balances appeared in the ledger of Mr. Raman as on 1st
March, 2010.
Debit Balance Rs. Credit Balance Rs.
Cash A/c 15,000 Capital A/c 60,000
Goods A/c 10,000 M/s. Godreja Co. 14,000
Bank A/c 30,000
Mr. H.O.’s A/c 5,000
Furniture A/c 14,000
Transactions during the month ending 31.03.2010.
2010
Mar.1 Introduced cash Rs.40,000/- into the business as capital.
6 Bought goods worth Rs.15,000/- from Mr. Ketan @ 5% trade discount.
14 Cash purchases Rs.10,500/-.
20 Sold goods worth Rs.10,500/- to Mr. H.O. @ 2% trade discount.
21 Paid carriage Rs.100/-.
22 Cash sales Rs.35,000/-.
24 Paid Rs.7,000/- to Mr. Godreja Co. and earned discount
Rs.100/-.
27 Received Rs.6,900/- from H.O. in full settlement of
Rs.7,200/-.
29 Purchase goods from David costing Rs.25,000/-.
30 Half of goods purchased were return to David.
31 Balance due to David paid @ 10% discount.
Pass necessary journal entries, open necessary ledger
accounts & prepare Trial balance as on 31st March 2010.

122
6
FINAL ACCOUNTS OF A SOLE TRADER
Unit Structure:
Objectives
Introduction
Trading Account
Profit & Loss Account
Balance Sheet
Marshalling of Balance Sheet
Classification of Assets
Classification of Liabilities
Limitations of Balance Sheet
Adjustments.
Illustrations
Exercises
OBJECTIVES
After studying the unit the students will be able to:
Know the meaning of Final Accounts and proforma of Final Accounts.
Explain the Classification of Assets and Liabilities.
Make the adjustment entries.
Prepare Final Accounts from the given Trial Balance.
INTRODUCTION
The transactions of a business are first recorded in Journal / subsidiary books, then posted there form to the Ledger and at the end of accounting year, Trial balance is prepare to test accuracy, both the aspects of the transactions have been correctly recorded in the books of accounts of original entry as well as in the Ledger. The last stage in accounting process is the preparation of final Accounts.

123
From given trial balance a Trading, Profit & Loss A/c & Balance Sheet is prepared.
A Trading, Profit & Loss A/c is prepared to determine the Profit
or Loss made during a particular year, and Balance Sheet is prepare
which consists of all assets, Liabilities and Capital of proprietor.
For preparing Final Accounts from Trial Balance following procedure should be followed.
i) Debit Account balances :-
Balances appearing on the debit column of the trial balance may represent - (a) assets (b) Expenses and Losses. Assets are shown on right hand side of the balance sheet while expenses and loss are debited either to the Trading A/c or to the Profit & Loss A/c, depending upon nature of expenditure or loss.
ii) Credit Account balances :-
Credit items in the trial balance represents (a) Capital, Liabilities,
expenses. These items are entered on the left hand side of the balance sheet (b) Income and gains. These are either credited to Trading A/c or
Profit and Loss A/c.
TRADING ACCOUNT :-
Trading A/c is prepared to ascertain the Gross Profit. Gross
Profit is difference between net sales and cost of goods sold. A specimen of Trading Account is given below:
Trading A/c for the year ended…
Dr. Cr.
Particulars Rs. Particulars Rs.
To Opening Stock
To Purchases X
X By Sales X
Less: Returns (X)
X
X Less: Returns (X) X
X
X
X
X
By Closing Stock
To Carriage Inwards
To Wages
To Direct Expenses
To Gross Profit
XX XX

124
However, Gross Profit is the balancing figure, in case debit side total exceeds the credit side, then balance will be Gross Loss, it is shown on credit side of Trading A/c as ‘By Gross Loss’.
PROFIT AND LOSS ACCOUNT
Profit and Loss A/c is prepared to calculate the net profit or net loss. The balance of Trading A/c i.e. Gross profit / Gross loss is transferred to the Profit and Loss Account. Therefore, all those
expenses and Losses are debited to the Profit and Loss A/c. Other income / gains are credited to this A/c e.g. commission received, discount earn etc.
The Profit and Loss accounts measures net profit by matching
revenues and expenses according to the accounting principles, Net profit is the excess of revenue over total expenses. It should be kept in mind that all expenses / incomes must be adjusted in respect of outstanding / prepaid / paid or received in advance. Expenses or incomes are considered on mercantile basis. At end Net Profit or Net
Loss transferred to Capital Account in the balance sheet.
A specimen of Profit & Loss Account is given below :
Profit & Loss Account for the year ended…
Dr. Cr.
Particulars Rs. Particulars Rs.
To Salaries X By Gross Profit b/d X
To Rent, Rates & Taxes X By Discount earned X
To Insurance X By Commission received X
To Printing & Stationery X By Interest earned X
To Legal Exp X By Profit on sale of assets
X
To Audit Fees X
To Discount allowed X
To Interest paid on Loans
X
To Bad debts X
To Carriage outwards X
To Advertising expenses X
To Depreciation on assets
X
To Loss due to fire X
To Net Profit X
[transferred to capital]
XX XX

125
It may be noted that:
1) Direct Expenses which are debited to Trading A/c are not debited again to Profit & loss A/c.
2) Personal expenses are not debited to this account.
3) Income Tax, Wealth Tax or Life insurance premium paid are
personal expenses of proprietor / partners.
4) Items shown in Trial Balance should be given one effect and
adjustment given below Trial Balance should be given two effects.
5) It should be noted that:
Trading Account and Profit & Loss Account are not prepares
separately as shown above but they are prepared as one account split up into two sections. As such the combined heading is given
as ‘Trading and Profit & Loss A/c for the year ended…’
BALANCE SHEET
Balance Sheet is a statement which shows the financial position
of a business entity on a given date. It is prepared from trial balance, after all nominal accounts and accounts relating to Trading, Profit & Loss account. Accounts left out are Real accounts and personal accounts. Accounts having debit balances transferred to Assets side of balance sheet and account having credit balance transferred to Liabilities side of Balance Sheet, in some cases credit balances may be
deducted from particular asset. e.g. provision for depreciation deducted from Fixed Asset; Reserve for
bad & doubtful, is deducted from sundry debtors. Balances shown in Balance Sheets are carried forward for next year.
The Balance Sheet has also two sides. The Left hand side is
headed as ‘Liabilities’ and Right hand side is headed as ‘Assets’. It is not an account, therefore in no ‘To’ or ‘By’ proceeding the names of the Account recorded in the Balance Sheet.
Balance Sheet shows financial position as on a particular date
and not for the year. Therefore the heading of Balance Sheet is worded as
“Balance Sheet of ….. as on …..”
MARSHALLING OF BALANCE SHEET
[Order of Assets and Liabilities]
1) Assets are arranged in order of their Liquidity i.e. in order in which they can be converted into cash and Liabilities they are

126
payable. As assets which can be immediately converted into cash will be taken first and then in order will follow the others. Similarly, Liability which is to be paid off immediately will be taken first and then next and so on.
2) The assets & liabilities are arranged in exactly the reverse order of
the above arrangement.
A specimen of Balance Sheet is given below :
Balance Sheet of ….. as on …..
[According to Liquidity order]
Liabilities Rs. Assets Rs.
Outstanding Expenses X Cash in hand X
Sundry Creditors X Bank Balance X
Bills Payable X Investments X
Bank Overdrafts X Sundry Debtors X
Loans X Bills Receivable X
Capital X Outstanding Income X
Stock in trade X
Loose tools X
Prepaid Expenses X
Patents, Trade Marks X
Furniture X
Plant & Machinery X
Building X
Land X
Goodwill X
XXX XXX
The totals of the two sides of the balance sheet must agree
because of the equation
Assets = Liabilities + Capital
CLASSIFICATION OF ASSETS
Fixed Assets :-
These assets are acquired for long use in the business itself and not for sale. e.g. Building, Plant & Machinery etc.
Current or Floating Assets :-
These assets are to be converted into cash as soon as possible. e.g. stock of goods, Sundry Debtors, Bills Receivable.

127
Liquid / Quick Assets :-
These assets can be converted into cash as quickly as possible, without undue Loss. e.g. Sundry Debtors, Bank Balance, short term govt. securities.
Wasting Assets :-
Are those fixed assets which have fixed content like coal in coal
mine.
Intangible Assets :-
Are those Fixed Assets which can not be seen or touched or felt, i.e. having no physical existence, e.g. Goodwill.
Fictitious Assets :-
Are worthless assets but shown as assets in the Balance Sheet.
E.g. preliminary expenses, Discount on issue of debentures.
CLASSIFICATION OF LIABILITIES
Fixed and Long-term Liabilities :-
Are those Liabilities which are payable after a long period of time e.g. Bank Loan, Debentures.
Current Liabilities :-
These are short term Liabilities payable usually with in year
e.g. sundry creditors, Bills Payable, outstanding expenses.
Contingent Liabilities :-
These are not actual Liabilities as on date of Balance Sheet,
which may or may not be payable in future, depend on the happening of certain events. In future, however due present circumstances; whether to pay or not, depends upon further happenings. Therefore existence of contingent liabilities shown below total liabilities by way of note for the sake of information and disclosure. e.g. investment in partly paid shares, compensation suit pending in court, Bills discounting but not
matured, such Liabilities are shown as a foot note in the Balance Sheet on liabilities side.
LIMITATIONS OF BALANCE SHEET
Balance sheet is considered to be a static document. The real position of the concern keeps on changing.

128
Stock valuation / method of depreciation are different, which affects on financial position.
Change in accounting policy may not followed consistally.
Window-dressing is accomplished in general ways, e.g. not making adequate provisions.
Fixed assets are shown at historical cost less depreciation. However, actual value of fixed assets, like Land might have appreciated much more.
ADJUSTMENTS
Before an accountant can proceeds to prepare the Final Accounts from trial balance, he has to process some additional information, which is not consider in trial balance.
The following are a few examples showing where adjustment
entries would required :
1 Closing Stock / Inventory :-
Unsold goods in stock at the end of the period. Closing stock
is valued at cost or market value which ever is lower. For accounting following entry is pass
Closing Stock A/c…………………....Dr XX
To Trading A/c XX
While closing stock appears on credit side of Trading A/c and it
also appears on an assets, in the Balance Sheet.
2 Outstanding Expenses :-
The nominal accounts records the actual expenses paid during
the period, However some expenses are incurred, (due) but not paid, hence it is not accounted, are also brought into the books to help in
proper matching of revenues and expenses. e.g. Firm pays wages on 10th of the subsequent mouth. These for at the end of the year say 31st march ’10, wages account is debited up to Feb. 10; since March wage not paid. These unpaid / outstanding expenses must also be included. This is done by passing following adjustment entry.
Wages A/c……………………………..Dr XX
To outstanding wages A/c XX
The above entries increases wages in Trading A/c and it is since
not paid shown a Liability in the balance sheet.

129
3 Prepaid Expenses :-
Certain expenses paid may relate to more than one accounting period. It is necessary to ascertain that portion of expense which the
benefit is not yet received by the concern. e.g. In such premium paid Rs. 6000, for the year ended 31st march 2010. Prepare Final Accounts for the ended 31st Dec 2009. Hence Jan to March, three month insurance premium benefit to the subsequent three month. Such expenses paid in a advance are called ‘pre-paid expenses’. Adjustment entry pass as under :
Prepaid Expenses A/c…………..…...Dr XX
To Expenses A/c XX
Prepaid expenses deducted from concern period and shown in
the balance sheet an assets.
4 Depreciation :-
It is the reduction or fall in the value of a Fixed Assets due to its
use. Thus, the depreciation is loss to the business, to account for following adjustment entry is passed.
Depreciation A/c……………………...Dr XX
To Fixed Assets A/c XX
Depreciation is debited to Profit & Loss A/c and it is deducted
from concerned Fixed Assets in the Balance Sheet.
5 Outstanding / Accrued Income :-
Income earned during the period but not received, Entry-
Outstanding Income A/c……………..Dr XX
To Income A/c XX
It added to Income in Profit & Loss A/c and shown as assets in
the Balance Sheet.
6 Income Received in Advance :-
Entry- Income received, however it relate to subsequent year; Income
A/c…………………………....Dr XX
To Income Received in Advance A/c XX
Advance income deducted from income on credit side of Profit &
Loss A/c and shown it on Liability side of Balance Sheet.
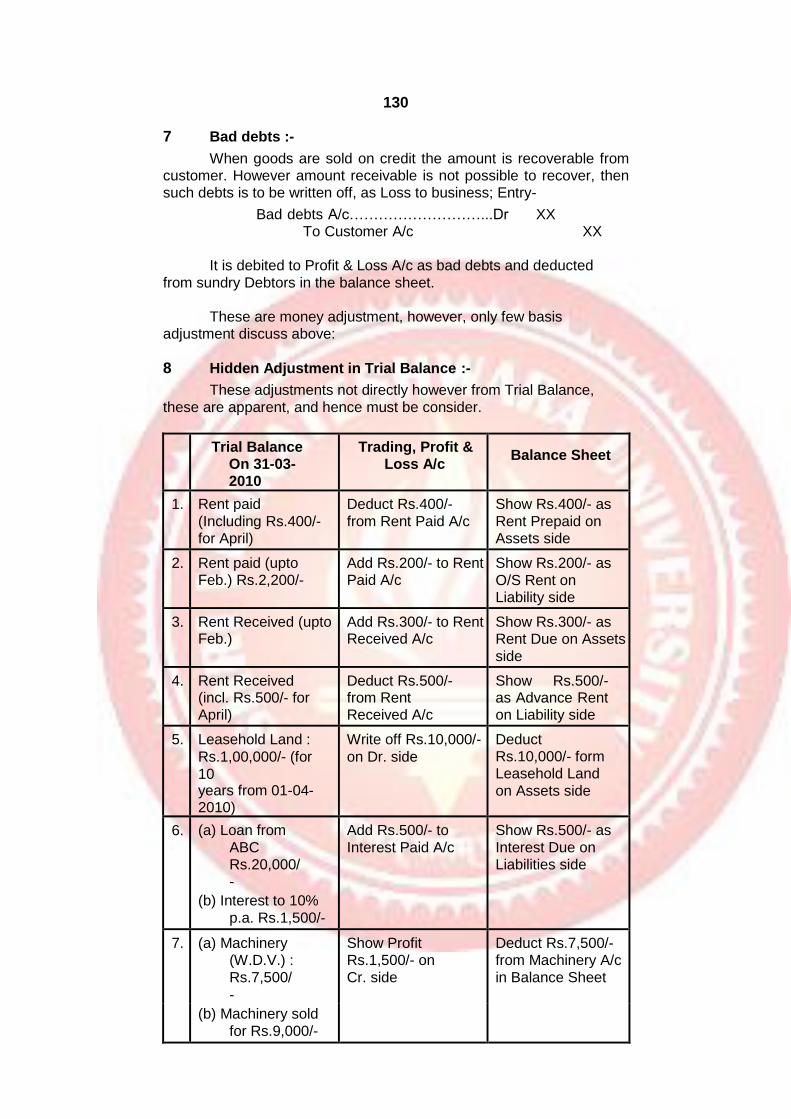
130
7 Bad debts :-
When goods are sold on credit the amount is recoverable from customer. However amount receivable is not possible to recover, then such debts is to be written off, as Loss to business; Entry-
Bad debts A/c………………………...Dr XX To Customer A/c XX
It is debited to Profit & Loss A/c as bad debts and deducted
from sundry Debtors in the balance sheet.
These are money adjustment, however, only few basis
adjustment discuss above:
8 Hidden Adjustment in Trial Balance :-
These adjustments not directly however from Trial Balance,
these are apparent, and hence must be consider.
Trial Balance On 31-03-2010
Trading, Profit & Loss A/c
Balance Sheet
1. Rent paid
(Including Rs.400/- for April)
Deduct Rs.400/-
from Rent Paid A/c
Show Rs.400/- as
Rent Prepaid on Assets side
2. Rent paid (upto Feb.) Rs.2,200/-
Add Rs.200/- to Rent Paid A/c
Show Rs.200/- as
O/S Rent on Liability side
3. Rent Received (upto Feb.)
Add Rs.300/- to Rent Received A/c
Show Rs.300/- as Rent Due on Assets
side
4. Rent Received (incl. Rs.500/- for April)
Deduct Rs.500/- from Rent Received A/c
Show Rs.500/- as Advance Rent on Liability side
5. Leasehold Land :
Rs.1,00,000/- (for
10 years from 01-04- 2010)
Write off Rs.10,000/-
on Dr. side
Deduct Rs.10,000/- form Leasehold Land
on Assets side
6. (a) Loan from
ABC Rs.20,000/-
Add Rs.500/- to
Interest Paid A/c
Show Rs.500/- as
Interest Due on Liabilities side
(b) Interest to 10%
p.a. Rs.1,500/-
7. (a) Machinery (W.D.V.) :
Rs.7,500/
-
Show Profit Rs.1,500/- on
Cr. side
Deduct Rs.7,500/- from Machinery A/c
in Balance Sheet
(b) Machinery sold
for Rs.9,000/-

131
CHECK YOUR PROGRESS
Give the effects of the following adjustments:
1. Salary Rs. 4000 is Outstanding.
2. Prepaid rent Rs.1000.
3. Wages included Rs.4000 which is used for installation of
Machinery.
4. Interest on Investment Rs.3000 received in advance.
ILLUSTRATIONS
Illustration 1:
From the following Trial Balance of Shri - Atul Sheth prepare Trading and Profit and Loss A/c for the year ended 31st March, 2010 and a Balance Sheet on that date.
Trial Balance as on 31st March, 2010
Particulars Dr. Rs. Cr. Rs.
Machinery 90,000
Building 50,000
Stock (01-04-09) 10,200
Purchases 80,800
Wages & Salaries 17,000
Carriage Outwards 3,000
Sundry Debtors 50,000
General expenses 9,100
Rent 1,700
Bad Debts 650
Income Tax 600
Legal Charges 800
Atul Sheth’s Drawing 18,000
Cash In hand 24,000
Cash at bank 18,000
Atul Sheth’s Capital 1,20,200
Sundry Creditors 18,000
Bills Payable 23,000
Returns Outwards 1,800
Interest 3,300
Sales 2,07,550
3,73,850 3,73,850

132
Adjustments :-
The following adjustments should be taken into consideration :-
1) Stock on 31st March,2010 was Rs.70,000/- valued at cost and market price Rs.82,000/-.
2) Depreciate Machinery at 10% and Building @ 5%.
3) Rent Outstanding Rs.800/-.
Solution :-
Shri Atul Sheth’s
Trading and Profit & Loss Account for the year ended as on
31st March 2010 Dr. Cr.
Particulars Rs. Particulars Rs.
To Opening Stock 10,200 By Sales 2,07,550
To Purchases 80,800 By Closing Stock 70,000
(-) P. Return 1,800 79,000
To Wage and Salaries 17,000
To Gross Profit c/d 1,71,350
2,77,550 2,77,550
To Carriage Outward 3,000 By Gross Profit b/d 1,71,350
To General Expenses 9,100 By Interest 3,300
To Rent 1,700
(+) Outstanding 800 2,500
To Bad Debts 650
To Legal Charges 800
To Depreciation
On Machinery 9,000
On Building 2,500
To Net Profit c/d 1,47,100
1,74,650 1,74,650

133
Shri Atul Sheth’s Balance
sheet as on 31/03/2010
Liabilities Rs. Rs. Assets Rs. Rs.
Capital balance 1,20,200
Machinery 90,000
(+) Net Profit 1,47,100 (-) Depreciation
(9,000)
81,000
(-) Drawings (18,000) Building 50,000
(-) Income Tax (600) 2,48,700 (-) Depreciation
(2,500)
47,500
Sundry Creditors
18,000 Sundry Debtors
50,000
Bills Payable 23,000 Cash in hand 24,000
O/s Rent 800 Cash at Bank 18,000
Closing Stock 70,000
2,90,500
2,90,500
Illustration 2:
From the following Trial balance extracted from the books of Shri Sunit as on 31st December 2009. Prepare his final accounts as on 31st December 2009 after taking into consideration following adjustments.
Trial balance as on Dec. 31, 2009
Particulars Dr. Rs. Cr. Rs.
Sundry Creditors 28,000
Rent 5,000
Cash at Bank 42,000
Cash in hand 28,000
Stock as on 1 Jan. 2009 18,000
Bad debts 900
Discounts 1,800 1,200
Purchase and Sales 65,000 1,08,000
Carriage on Sales 3,500
Plant and Machinery 48,000
Sales Return 1,200
Purchase Return 1,800
Carriage on Purchases 7,500
Furniture and Fixtures 80,000
Insurance 8,000
Salaries 9,000
Bills Receivable 18,000
Drawings 22,000

134
Wage
s
Capita
l
Sundry Debtors
Commission
6,000
1,20,900
4,200
3,50,000
4,89,000 4,89,000
Adjustments –
1) Depreciate Plant and Machinery 10%.
2) Insurance prepaid Rs.1,500/-.
3) Outstanding Salaries Rs.1,200/-.
4) Closing Stock Rs.81,000/-.
Solution :
Shri Sunit’s Final Accounts
Trading and Profit and Loss Account for the year ended as on 31st December 2009
Dr. Cr.
Particulars Rs. Rs. Particulars Rs. Rs.
To Opening Stock 18,000 By Sales 1,08,000
To Purchases 65,000
(-) Sales Return (1,200) 1,06,800
(-) Purchase Return
(1,800)
63,200 By Closing Stock 81,000
To Carriage on
Purchases 7,500
To Wages 6,000
To Gross Profit c/d
93,100
1,87,800 1,87,800
To Rent
To
Insurance (-
) Prepaid
To Bad
Debts To
Discount To
Salaries
(+) Outstanding
To Carriage on
Sales To
Commission
5,000 By Gross Profit b/d
93,100
8,000
By Discount 1,200
(1,500)
6,500
900
1,800
9,000
(1,200)
10,200
3,500
4,200
4,800

135
To Depreciation
on Plant &
Mach.
To Net Profit
[transferred to
Capital]
57,400
94,300 94,300

136
Shri Sunit’s
Balance Sheet as on 31st December 2009
Liabilities Rs. Rs. Assets Rs. Rs.
Capital balance 3,50,000 Plant & Mach. 48,000
(+) Net Profit 57,400 (-) Depreciation
(4,800)
43,200
(-) Drawings (22,000) 3,85,400 Cash at Bank 42,000
Sundry Creditors
28,000 Cash in hand 28,000
O/s Salaries 1,200 Furniture &
Fixtures 80,000
Sundry Debtors
1,20,900
Closing Stock 81,000
Prepaid
Insurance 1,500
Bills Receivable
18,000
4,14,600 4,14,600
Illustration 3:
From the following Trial Balance and additional information
prepare Profit and Loss Account for the year ended 31/03/2008 and Balance Sheet as on that date of Shri Ankur.
Trial Balance as on 31/03/2008
Particulars Dr. Rs. Cr. Rs.
Sundry Debtors 88,000
Capital 3,16,300
Salaries 9,000
Commission 800
Furniture 90,000
Creditors 81,000
Dividend 4,000
Machinery 1,56,000
Bad debts 2,250
Advertisement 1,000
Investments 38,000
Bills Payable 18,000
Opening Stock (01/04/07) 32,000
Insurance 11,000
Drawings 17,000
Cash in hand 35,000
Cash at Bank 51,000

137
Interest 900
Purchases 1,34,500
Sales Returns 1,800
Wages 6,500
Bills Receivable 32,000
Purchase Return 2,300
Sales 2,10,000
Carriage Inward 2,100
Octroi 1,500
Bank Overdraft 76,950
7,09,450 7,09,450
Adjustments –
1) Closing Stock Rs.33,000/-.
2) Wages Outstanding Rs.2,000/-.
3) Insurance prepaid Rs.2,500/-.
4) Depreciate Machinery at the rate of 10% and Furniture 15%.
Solution :
Shri Ankur’s Final Account
Trading Account for the year ended 31st March 2008
Dr. Cr.
Particulars Rs. Rs. Particulars Rs. Rs.
To Opening Stock
32,000 By Sales 2,10,000
To Purchases 1,34,500
(-) Sales Return
(1,800) 2,08,200
(-) Purchase Return
(2,300) 1,32,200
By Closing Stock
33,000
To Wages 6,500
(+) Outstanding 2,000 8,500
To Carriage Inward
2,100
To Octroi 1,500
To Gross Profit c/d
64,900
2,41,20
0
2,41,20
0
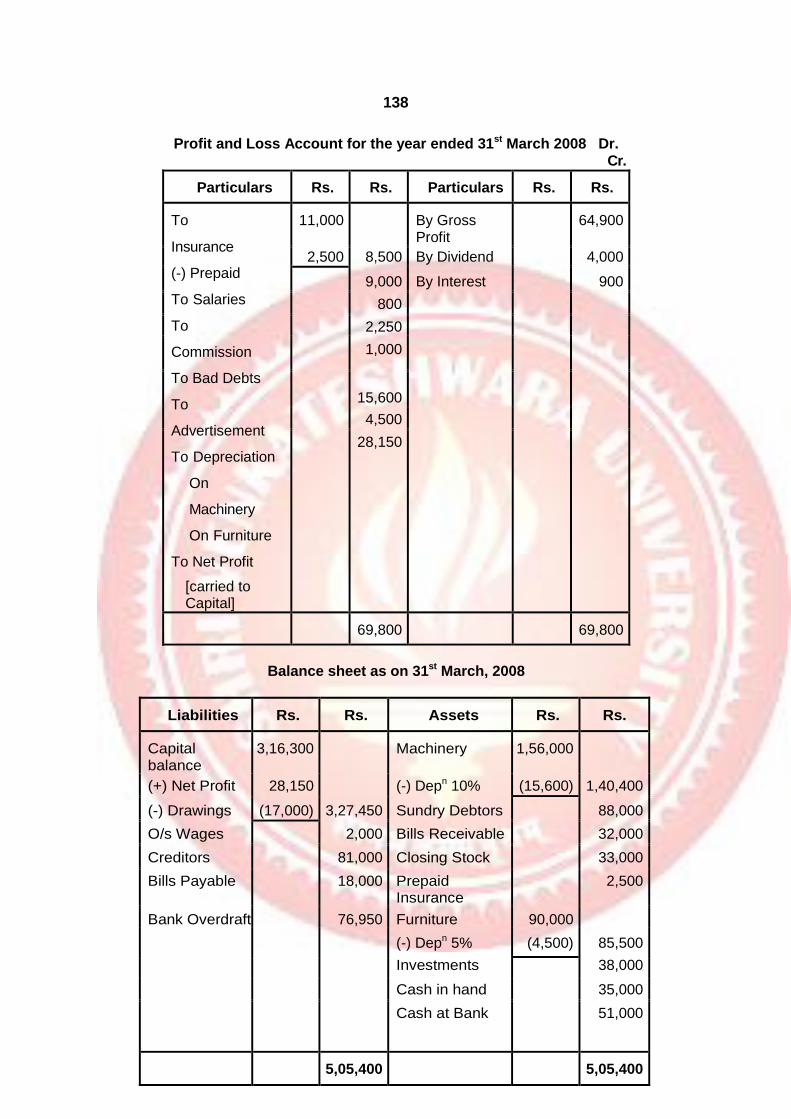
138
Profit and Loss Account for the year ended 31st March 2008 Dr. Cr.
Particulars Rs. Rs. Particulars Rs. Rs.
To
Insurance
(-) Prepaid
To Salaries
To
Commission
To Bad Debts
To
Advertisement
To Depreciation
On
Machinery
On Furniture
To Net Profit
[carried to Capital]
11,000
By Gross Profit
64,900
2,500 8,500 By Dividend 4,000
9,000 By Interest 900
800
2,250
1,000
15,600
4,500
28,150
69,800
69,800
Balance sheet as on 31st March, 2008
Liabilities Rs. Rs. Assets Rs. Rs.
Capital balance
3,16,300
Machinery 1,56,000
(+) Net Profit 28,150 (-) Depn 10% (15,600) 1,40,400
(-) Drawings (17,000) 3,27,450 Sundry Debtors 88,000
O/s Wages 2,000 Bills Receivable 32,000
Creditors 81,000 Closing Stock 33,000
Bills Payable 18,000 Prepaid Insurance
2,500
Bank Overdraft 76,950 Furniture 90,000
(-) Depn 5% (4,500) 85,500
Investments 38,000
Cash in hand 35,000
Cash at Bank 51,000
5,05,400
5,05,400

139
Illustration 4:
Following is the trial balance of Amir Khan as on 31st March, 2010.
Particulars Dr. Rs. Cr. Rs.
Capital Account 80,000
Drawing Account 6,000
Stock (01/04/2009) 45,000
Purchases 2,60,000
Sales 3,10,000
Furniture 10,000
Sundry Debtors 40,000
Freight and Octroi 4,600
Trade Expenses 500
Salaries 5,500
Rent 2,400
Advertisement Expenses 5,000
Insurance Premium 400
Commission 1,300
Discount 200
Bad debts 1,600
Creditors 20,900
Cash in hand 5,200
Bank 5,800
Goodwill (at cost) 20,000
4,12,200 4,12,200
Adjustments –
a) Stock on 31st March, 2010 was valued at Rs.53,000/-.
b) Salaries have been paid only for 11 months.
c) Unexpired insurance included in the figure of Rs.400/-
appearing in trial balance is Rs.100/-.
d) Commission earned but not yet received amounting to Rs.422/- is to be recorded in books of account.
e) Furniture is depreciated @ 10% per annum.
f) Only 1/4th of advertising expenses are to be written off.
Prepare Trading and Profit and Loss Account for the year ended 31st March, 2010 and balance sheet as on that date.

140
Solution :
Trading and Profit and Loss Account for the year ended 31st
March, 2010
Dr. Cr.
Particulars Rs. Rs. Particulars Rs. Rs.
To Stock (01.04.09)
45,000 By Sales
3,10,000
To Purchases 2,60,000 By Stock (31.03.10)
53,000
To Freight &
Octroi 4,600
To Gross Profit
transferred to
P&L Account 53,400
3,63,000
3,63,000
To Trade Exp.
To Salaries
(+) O/s
Salaries To
Rent
To Advertising
Exp (-) Amount
c/f (3/4) To
Insurance
Premium
(-) Unexpired
Ins. To Discount
To Bad Debts
To
Depreciation
To Net Profit
transferred to
Capital
Account
500 By Gross Profit
transferred
from Trading
Account
By
Commission
(+)
Commission
earned but
not
received
53,400
5,500
500 6,000
2,400 1,300
5,000
(3,750) 1,250
422 1,722
400
(100) 300
200
1,600
1,000
41,872
55,122
55,122

140
Amir Khan
Balance sheet as on 31st March, 2006
Liabilities Rs. Rs. Assets Rs. Rs.
Capital :
Fixed Assets :
Opening Balance
80,000 Goodwill (at cost) 20,000
(+) Net Profit 41,872 Furniture 10,000
1,21,872
(-) Depreciation (1,000)
9,000
(-) Drawings (6,000) 1,15,872 Current Assets :
O/s Salary 500 Unexpired Insurance
100
Creditors 20,900 Unexpired Advt.
Expenses 3,750
Commission earned
but not received 422
Stock 53,000
Sundry Debtors 40,000
Cash at Bank 5,800
Cash in hand 5,200
1,37,272
1,37,272
EXERCISES
Theory Questions
1) Explain what is Final Account?
2) Distinguish between Trial balance and Balance sheet
3) Write short notes on
a) Adjustment
b) Outstanding Expenses
c) Gross Profit
d) Prepaid Expenses
e) Fixed Assets
f) Floating Assets
4) What are the limitations of Balance Sheet.

141
Practical Problems
Below is the trial balance of Suresh as at 31st March, 2010
Debit balance Rs. Credit balance Rs.
Suresh’s Current A/c 1,500 Capital Account 50,000
Purchases 7,60,450 Loan from Mohan @ 9%
20,000
Salaries 4,200 (taken on 1st October, 09)
Carriage on Purchases 400 Sales 7,20,000
Carriage on Sale 500 Discount 500
Lighting 300 Sundry Debtors 20,000
Rates and Insurance 400
Buildings 27,000
Sundry Debtors 8,000
Furniture 6,000
Cash in hand 250
Cash at bank 1,500
8,10,500 8,10,500
Rates have been prepaid to the extent of Rs.175/-, Bad debts
totaling Rs.500/- have to be written off. Buildings have to be depreciated at 2% and Furniture @ 10%.
You are required to prepare the Profit and Loss Account for the year
ended 31st March, 2010 and the balance sheet as on that date.
From the following prepare Trading Account Profit and Loss
Account and Balance Sheet.
Trial Balance as 31st March, 2011
Sr. No. Name of the Account L.F. Debit (Rs.)
Credit (Rs.)
1 Sundry Debtors 15,000 -
2 Buildings 40,000 -
3 Goodwill 30,000 -
4 Bills Payable - 45,000
5 Sundry Creditors - 25,000
6 Plant & Machinery 1,60,000 -
7 Opening Stock 35,000 -
8 Sales - 1,40,000

142
9 Bank Overdraft - 1,25,000
10 Bills Receivable 40,000 -
11 Purchases 1,25,000 -
12 Sales Returns 1,000 -
13 Wages 45,000 -
14 Purchase Returns - 1,500
15 Carriage Inwards 600 -
16 Carriage Outwards 300 -
17 Office Salaries 12,000 -
18 Office Rent 500 -
19 Commission 600 -
20 Postage & Telegram 100 -
21 Depreciation 500 -
22 Printing & Stationery 45 -
23 Bad Debts 200 -
24 Prepaid Insurance 150 -
25 Cash in hand 6,000 -
26 Cash at Bank 9,000 -
27 Income Receivable 400 -
28 Capital Account - 1,90,000
29 Drawings 5,105 -
5,26,500 5,26,500
Closing stock valued at Rs.1,10,000/-.
Prepare Trading and Profit and Loss Account from the following
trial balance and adjustments for the year ending 31st December, 2008. Prepare Balance sheet as at that date.
Trial balance as on 31st December, 2008
Name of the Account L.F. Debit (Rs.)
Credit (Rs.)
Capital Account - 2,00,000
Drawings Account 86,000 -
Stock (01/01/2008) 75,000 -
Bills Receivable 15,000 -
Sales - 1,62,350
Purchases 50,000 -
Returns 2,000 3,000
Salaries & Wages 12,000 -

143
Creditors - 15,000
Insurance 3,500 -
Carriage Inwards 1,500 -
Carriage Outwards 850 -
Debtors 68,000 -
Commission 3,000 2,000
Interest 4,500 3,000
Discount 3,500 3,000
Bills Payable - 12,000
Printing & Stationery 2,500 -
Trade Expenses 1,500 -
Furniture & Fixtures 11,000 -
Cash in hand 46,000 -
Cash at bank 12,000 -
Rent & taxes 2,500 -
4,00,350 4,00,350
Adjustments –
1) Closing Stock was valued at Rs.1,05,000/-.
2) Furniture valued at Rs.10,000/-.
3) Outstanding Expenses : Salaries at 1,200/-, Rent & Taxes Rs.600/- and prepaid insurance Rs.650/-.
Following is the trial balance of M/s. Anjali. You are required to
prepare Trading Account, Profit and Loss Account and Balance Sheet for the year ended 31st December, 2010, after considering the adjustment given below.
Sr. No. Name of the Account Debi
t (Rs.)
Credi
t (Rs.)
1 Stock on 01-01-2010 60,000 -
2 Purchases & Sales 80,000 1,00,000
3 Returns 1,500 2,500
4 Drawings 2,400 -
5 Wages – productive 3,000 -
6 Wages – unproductive 2,000 -
7 Salaries 4,000 -
8 Rent, rates & insurance 1,500 -
9 Bad debts 1,000 -
10 Discount 600 1,000
11 Machinery 20,000 -

144
12 Buildings 60,000 -
13 Sundry Debtors & Creditors 16,000 18,000
14 Cash 12,000 -
15 Capital - 1,17,200
16 Bank Overdraft - 40,000
17 Furniture 7,500 -
18 Carriage Inward 1,250 -
19 Carriage Outward 1,450 -
20 Interest 4,000 16,000
21 Commission 750 11,000
22 Goodwill 25,000 -
23 Gas & Fuel 1,750 -
3,05,700 1,05,700
Adjustments –
1) On 31st December, 2010 the cost price of closing stock was Rs.51,000/- and its market price was Rs.52,000/-.
2) Goods worth Rs.6,000/- taken over by the proprietor for the his personal use, were not entered in the books of accounts.
From the following Trial balance, you are required to prepare
Trading and Profit and Loss Account for the year ended 31st December, 2010 and the Balance Sheet as on that date, after taking into consideration the additional information.
Trial balance (31-12-2010)
Sr. No. Name of the Account L.F. Debit (Rs.)
Credit (Rs.)
1 Drawings 23,800 -
2 Capital - 1,95,000
3 Opening Stock 50,000 -
4 Creditors - 1,75,000
5 Purchases 60,000 -
6 Sales - 1,55,000
7 Royalties 6,000 -
8 Trade Expenses 8,000 -
9 Returns Outwards - 1,000
10 Advertisement 1,500 -
11 Bills Payable - 2,000
12 Wages and Salaries 4,800 -
13 Reserve Fund - 6,000

145
14 Cash in hand 8,500 -
15 Debtors 68,000 -
16 Bad debts 4,400 -
17 Investments 1,30,000 -
18 Bills Receivable 12,000 -
19 Discount 2,500 2,500
20 Motor Van 15,000 -
21 Furniture 8,000 -
22 Office Rent 3,000 -
23 Plant & Machinery 25,000 -
24 Freehold Property 1,30,000 -
5,36,500 5,36,500
The following figures were taken from the books of Ashok on 31st
March, 2010.
Particulars Rs. Particulars Rs.
Cash at bank 26,400 Royalties received 400
Cash in hand 30 Trade and General
Sales 2,61,230 Expenses 5,020
Stock (1st April, 2009) 27,410 Reserve on Patents 5,000
Sales Returns 3,300 Interest on Loan 1,240
Discount (Dr.) 6,380 Repairs 840
Bills Receivable 1,820 Sundry Debtors 20,780
Sundry Debtors 52,720 Buildings 95,820
Depreciation 4,780 Patent rights 50,000
Purchases 1,84,030 Loan (raised on 45,000
Discount on Purchases 3,900 mortgage of buildings)
Wages 14,040 Agent’s Commission 6,500
Provision for bad debts 5,400 Bad Debts 1,900
Provision for discounts Plant and Machinery 30,000
on Debtors 1,970 Capital 2,00,000
Drawings 30,000
Advertising 1,000
Carriage 450
In addition, the following information is given.
a) Stock on 31st March, 2010 was Rs.82,500/-.
Prepare Trading and Profit and Loss Account of Ashok for the
year ended 31st March, 2010 and his balance sheet as on that date.

146
7
PARTNERSHIP FINAL ACCOUNTS
Unit Structure:
Objectives
Introduction
Definition
Characteristics of Partnership
Types of Partners
Partnership Deed
Provisions of Partnership Act 1932
Methods of maintaining Capital Account
Partnership Final Accounts
Adjustments
Recent addition (L.L.P.)
Illustrations
Exercises
OBJECTIVES
After studying the Unit the students will be able to:
Define partnership and explain the characteristics of Partnership.
Explain the types of Partners.
Understand the methods of maintaining Capital accounts
Make the adjustment entries and prepare the Final accounts of a partnership firm.
INTRODUCTION
In small business, sole trader can manage business. He can himself provide the capital and supervise the work. However, there are numbers of limitations : To over come limitations, businessmen may convert his business into Partnership. Each partner contribute

147
capital and in return each partner get a share in the profits of the firm. DEFINITION :
As per Indian Partnership Act 1932, “Partnership is the relation between persons who have agreed to share the Profit / Loss of a business carried on by all or any of them acting for all.”
CHARACTERISTICS OF PARTNERSHIP
a) It is a voluntary association of persons.
b) The relations among them are contractual.
c) Each partner is Principal as well as Agent.
d) All the partners can take active part in business.
e) Profit / Loss are shared by the partners as per Partnership Deed.
f) Minimum two and maximum 10 partners are allowed for banking
business, however maximum 20 partners are all for the general business.
g) The liability of the partners is unlimited.
TYPES OF PARTNERS
i) Active Partner : taking active part in firm business
ii) Sleeping / Dormant : Not taking active part in business, Partner provides capital.
iii) Nominal Partner : Only he lends his name in firm.
iv) Partners by holding : He represents himself as partner,
out / by Estoppel even though he is not a partner.
v) Minor Partner : He is less than 18 year old, shares in only Profit of business.
vi) Limited Partner : His liabilities is limited to the extent, the capital contributed by him.
PARTNERSHIP DEED
It is much agreement, in writing between the partners of the firm.
The terms of contracts are written in Deed. It is prepared on stamp paper and signed by all partners. Copy partnership deed are submitted to the Bank, Income Tax Departments, Sales Tax Departments etc. Deed indicates the rights, duties and liabilities of the partner.
Partnership Deed contents various term, conditions,
148
Profit / Loss sharing, Interest on Capital and drawings, method of valuation of Goodwill etc. PROVISION OF PARTNERSHIP ACT 1932
Normally all terms and condition are stated in Partnership Deed. In case of deed is silent on certain matters, provision of Partnership Act, 1932 are applicable;
1. Profit and Losses shares by all partners equally.
2. No interest on capital and drawings.
3. No salary commission etc. payable to partner.
4. Interest @ 6% p.a. can be paid on Loan from partner.
5. Every partner can take active part in the Partnership business and
can inspect the books of accounts.
6. Partner cannot start any parallel business in competition.
METHODS OF MAINTAINING CAPITAL ACCOUNT
There are two methods of maintaining Partner’s Capital
Accounts.
a) Fixed Capital Method
b) Fluctuating Capital Method
Fixed Capital Method :
Under this method, capital contributed by partners remain fixed
forever. Capital balances are not changed. Partners Current Account are open for recording transactions like interest on capital, drawing in cash or kind, share in Profit or Loss etc. Therefore Partners Current Account may have debit balance or credit balance. Debit balances of Current Account are shown on assets side of the Balance Sheet and
vice versa.
Fluctuating Capital Method :
Under this method Capital Account of partner always fluctuates.
It do not remains fixed as internal transactions of partner with firm are recorded in Capital Account only. Due to recording of internal transactions, capital balance fluctuates / changes.
PARTNERSHIP FINAL ACCOUNTS
Partnership Final Accounts consist of :

149
i) Trading Account
ii) Profit & Loss Account
iii) Profit and Loss Appropriation A/c
iv) Balance Sheet of Firm
Trading, Profit & Loss Account
Partnership Trading, Profit and Loss A/c are prepared on same
line as Sole Proprietor. As these are discuss earlier, so not explain again.
Profit & Loss Appropriation Account
Net Profit or Net Loss from business is ascertain in Profit & Loss Account. This Net Profit / Net Loss transferred to Profit & Loss Appropriation A/c. Internal amount payable to partners like partner
Salaries, Commission, Interest on Partners Capital, Interest on drawings etc. are charges against Net Profit. Balance Net Profit / Net Loss is transferred to Partners Current Account / Capital Account as the case may be, specimen of Profit & Loss Appropriation is as under –
Profit & Loss Appropriation Account
for the year ended
Dr. Cr.
Particulars Rs. Particulars Rs.
To Partner’s Salaries
A/c
To Partner’s
Commission A/c
To Interest on Partners
Capital A/c
To Interest on Partner’s
Loan A/c
To Transferred to
Reserves A/c
To Net Profit
transferred to
partners Capital A/c
(in their Profit
sharing ratio)
A XX
B XX
XX
XX
XX
XX
XX
XX
XX
By Net Profit
(transferred from
Profit and Loss A/c)
By Interest on
Drawings A/c
XX
XX

150
XX XX
Balance Sheet of Partnership Firm :
Balance Sheet of Partnership Firm is also like a Balance Sheet of Sole Proprietor only differ is that instead of sole proprietor capital alone, there will be each partners capital balances, may have Partners Current Account balances, Specimen of Balance Sheet as under.
Balance Sheet as on
Liabilities Rs. Assets Rs.
Partner’s Capital A/c Cash on hand XX
R XX Bank balance XX
K XX Sundry Debtors XX
G XX XX Bills Receivable XX
Partners Current A/c Prepaid Expenses XX
R XX Income receivable XX
G XX XX Investments XX
Sundry Creditors XX Office Equipments XX
Bank Loan XX Plant & Machinery XX
Outstanding Expenses XX Patents XX
Income received in advance
XX
Land & Building
Goodwill
XX
XX
Provident Fund XX Partners Current A/c
Reserve Fund XX K XX XX
XX XX
Balance Sheets Liabilities side total must be equal to total
Assets.
ADJUSTMENTS
In addition to normal adjusts discuss in Final Accounts of Sold Trader, there may few more adjustment in respects of firm as under.
Interest on Capital :
Calculate interest on Capital @ rate given,
Profit & Loss Appropriation A/c .................................. Dr. XX

151
To Interest on Partners Capital A/c XX
(Being interest on partners’ capital provided.)
Interest on Capital A/c ............................................. Dr. XX
To Partner Capital A/c XX
(Being interest on Capital transferred.)
Interest on Partners drawings :
Interest may be charged on drawings made by Partner to make
distribution of Profit more equitable. Since drawing are made through the year it is calculated as under –
If amount are withdrawn equally every month.
a) Middle of each month = Int. for 6 months
b) On 1st Day of month = Int. for 6½ month
c) On Last Day of month = Int. for 5½ month
Entry :
a) Interest on drawing A/c ................................. Dr.
To Profit & Loss Appropriation A/c
XX
XX
b) Partners Capital A/c ...................................... Dr.
To Interest on drawings A/c
XX
XX
7.9.3 Salaries to Partners :
Profit & Loss Appropriation A/c .......................... Dr.
To Partner’s Capital A/c
XX
XX
Remaining balance in Profit & Loss Appropriation Account
indicates distributable Profit / Loss which should be transferred to Partner’s Capital Account.
In case of Profit
Profit & Loss Appropriation A/c ……………….. Dr. XX
To A’s Capital A/c XX
To B’s Capital A/c XX
(Being Net Profit transferred to partners in their Profit / Loss sharing
ratio.)
Note : 1) If Partners Capital are fixed, then instead of Capital Account,
all above i.e. Interest, Salary, Net Profit etc. are transferred to Partner’s Current Account.

152
2) Profit adjustment due to Guarantee etc. are not specially covered in syllabus & hence not considered.
LIMITED LIABILITY PARTNERSHIP ACT (L.L.P.)
The Act called Limited Liability Partnership Act (L.L.P.) extended
scope and working of Partnership. A present partnership firm can also be converted into L.L.P. It has number of advantages over Partnership Firm or Private Ltd. Company. Number of partners limits not applicable to L.L.P. Here are number of advantages over Partnership
Firm mainly liabilities of partners rusticated to capital contribution by partners. L.L.P. enjoys more or less advantages like in private limited company.
ILLUSTRATIONS
Illustrations 1: From the following trial balance of Neela and Sheela.
You are required to prepare Trading and Profit & Loss Account for the year ended 31st March 2007 and Balance sheet as on that date after considering the following adjustments.
Trial Balance as on 31st March 2007
Particulars Rs. Rs.
Opening Stock 17,500 -
Salaries and Wages 4,600 - Cash in hand 6,000 -
Purchase and Sales 1,12,600 2,65,000 Office Expenses 4,300 - Productive Wages 7,000 - Bills Receivable 4,000 - Legal Expenses 3,300 - Bad debts 1,900 - Works Managers Salary 5,600 - Commission 1,800 2,500
Investments 42,000 - Debtors 67,500 - Creditors - 92,000 Bank overdraft - 88,000
Patents 38,000 - Loose Tools 28,000 - Furniture 65,000 - Goodwill 80,000 - Interest - 1,600
Land & Building 1,25,000 - Capital Accounts :
Neela - 1,10,000 Sheela - 1,05,000 Drawings :

153
Neela Sheela
20,000 30,000
- -
6,64,100 6,64,100
Adjustments :
1) Partners shares Profit and losses equally.
2) The Closing Stock cost Rs.25,000/- market value Rs.19,000/-.
3) Neela has withdrawn goods worth Rs.800/- for personal use.
4) Depreciate Land and Building at 10% p.a. and Loose Tools 15%
p.a.
Trading Account for the year ended 31st March 2007
Particulars Rs. Particulars Rs.
To Opening Stock 17,500 By Sales
By Goods withdrawn
by Neela
By Closing Stock
2,65,000
To Purchases 1,12,600
To Productive Wages 7,000 800
To Works Manager’s 5,600 19,000
Salary
To Gross Profit 1,42,100
2,84,800 2,84,800
Profit & Loss Account for the year ended 31st March 2007
Particulars Rs. Particulars Rs.
To Salaries &
Wages To Office
Expenses To Legal
Expenses To Bad
Debts
To Commission
To Depreciation
Loose Tools
Land & Building
To Net Profit
Neela 56,800
Sheela 56,800
4,600 By Gross Profit 1,42,100
4,300 By Commission 2,500
3,300 By Interest 1,600
1,900
1,800
4,200
12,500
113600
1,46,200 1,46,200

154
Balance Sheet as on 31st March 2007
Liabilities Rs. Rs. Assets Rs. Rs.
Capital Accounts
Cash in hand 6,000
Neela : balance
1,10,000
Bills Receivable
4,000
(+) Net Profit 56,800 Investments 42,000
(–) Drawings 20,000 Sundry Debtors
67,500
(–) Goods taken
800 1,46,000 Stock 19,000
Patents 38,000 Sheela : balance
1,05,000
Loose Tools 28,000
(+) Net Profit 56,800 (–) Depn 15% 4,200 23,800 (–) Drawings 30,000 1,31,800 Furniture 65,000
Goodwill 80,000
Bank Overdraft 88,000 Land & Building
1,25,000
Sundry Creditors
92,000 (–) Depn 10% 12,500 1,12,500
4,57,800 4,57,800
Illustration 2 : From the following Trial balance of Ram and Shyam.
You are required to prepare Trading and Profit & Loss Account for the year ending 31st Dec. 2006 and balance sheet as on that date after consideration the adjustments given below.
Trial Balance as on 31st March, 2006
Dr. Cr.
Particulars Rs. Particulars Rs.
Stock (01.04.05) 35,000 Sales 3,30,000
Salary and Wages 9,200 Discount 4,800
Cash 10,000 Creditors 20,000
Purchases 2,25,200 Bank Overdraft 10,000
Sundry Expenses 8,600 Interest on Investments 7,200
Productive Wages 14,000 Capital Accounts
Bills Receivable 8,000 Ram 60,000
Law charges 3,000 Shyam 40,000
Bad Debts 1,000
Works Expenses 6,000
Commission 3,000
Investments 20,000
Debtors 40,000
Trade Marks 8,000
Tools and Equipments 6,000
Furniture 12,000

155
Goodwill
Building
13,000
50,000
4,72,000 4,72,000
Adjustments :
1) Partners shares Profit and Losses in the equal ratio.
2) Closing Stock cost price Rs.40,000/- market value Rs.45,000/-.
3) Uninsured goods worth Rs.10,000/- were lost by fire.
4) Unpaid Salary and Wages Rs.2,100/-.
Trading Account for the year ended 31st December 2006
Particulars Rs. Particulars Rs.
To Opening Stock 35,000 By Sales
By Uninsured Goods
lost by fire
By Closing Stock
3,30,000
To Purchases 2,25,200
To Productive Wages 14,000 10,000
To Works Expenses 6,000 40,000
To Gross Profit c/d 99,800
3,80,000
3,80,000
Profit & Loss Account for the year ended 31st December 2006
Particulars Rs. Particulars Rs.
To Sundry Expenses 8,600 By Gross
Profit By
Discount By
Interest on
Investment
99,800
To Law Charges 3,000 4,800
To Bad Debts 1,000
To Commission 3,000 7,200
To Salaries 9,200
(+) Outstanding 2,100 11,300
To Uninsured Goods
lost by fire 10,000
To Net Profit
Ram 37,450
Shyam 37,450 74,900

156
1,11,800
1,11,800
Balance Sheet as on 31st December 2006
Liabilities Rs. Rs. Assets Rs. Rs.
Capital Accounts
Cash 10,000
Ram : balance 60,000 Bills Receivable
8,000
(+) Net Profit 37,450 97,450 Investments 20,000
Debtors 40,000
Shyam : balance
40,000 Trade marks 8,000
(+) Net Profit 37,450 77,450 Tools and
Equipments 6,000
Creditors 20,000 Closing Stock 40,000
Bank Overdraft 10,000 Furniture 12,000
Outstanding Goodwill 13,000
Salaries & Wage
2,100 Building 50,000
2,07,000 2,07,000
Illustration 3 : (Goods withdrawn, Loss by Fire)
From the following Trial Balance of Jagan and Magan, you are required
to prepare a Trading and Profit and Loss Account for the year ended 31st March 2010 and the Balance Sheet as on that date, after taking into the consideration the additional information :
Trial Balance as on 31st March 2010
Particulars Debit (Rs.)
Credit (Rs.)
Opening Stock 17,500 -
Salaries and Wages 4,600 -
Cash in hand 5,000 -
Purchases and Sales 1,12,600 1,65,000
Office Expenses 4,300 -
Productive Wages 7,000 -
Bills Receivable 4,000 -
Legal Expenses 1,500 -
Bad Debts 500 -
Works Manager’s Salary 3,000 -
Commission 1,500 2,400
Investments 10,000 -
Debtors and Creditors 20,000 10,000
Bank Overdraft - 5,000

157
Patents 4,000 -
Loose Tools 3,000 -
Furniture 6,000 -
Goodwill 6,500 -
Interest on Investment - 3,600
Land and Building 25,000 -
Capital Accounts :
Jagan - 30,000
Magan - 20,000
2,36,000 2,36,000
Adjustments :
1. Partners share Profits and Losses in their capital ratio.
2. The Closing Stock – Cost Rs.20,000/- Market Value Rs.22,500/-
3. Jagan has withdrawn goods worth Rs.600/- for his personal use.
4. Uninsured goods worth Rs.5,000/- were destroyed by fire.
5. Rs.225/- written off as bad debts from Debtors.
6. Outstanding Salaries and Wages Rs.400/-.
7. Depreciation on Land and Building at 7½ %.
Solution :
M/s. Jagan and Magan
Trading, Profit & Loss Account for the year ended 31-03-2005 Dr.
Cr.
Particulars Rs. Particulars Rs.
To Opening
Stock To
Purchases
To Productive Wages
To Work Manager’s
Salary To Gross Profit
c/d
17,500
1,12,600
7,000
3,000
50,500
By Sales
By Goods withdrawn
(Jagan) By Goods Lost by
Fire
By Closing Stock
1,65,000
600
5,000
20,000
1,90,600
1,90,600
To Salaries & Wages
4,600 (+) Outstanding
400
5,00
0
4,300
1,500
72
By Gross Profit
c/d By
Commission
By Interest on Investment
50,500
2,400
3,600
To Office
Expense To
Legal Expense
To Bad Debts
(+) Additional B.D.
500
225

158
To
Commission
To Loss by Fire
To Depreciation
on Land &
Building
To Net Profit trd Capital A/c
5
1,500
5,000
1,87
5

159
Jagan (3/5) 21,960
Magan (2/5) 14,640
36,600
56,500 56,500
Balance Sheet as on 31-3-2005
Liabilities Rs. Rs. Assets Rs. Rs.
Jagan’s Capital Goodwill 6,500
Balance b/d 30,000 Land & Building 25,000
(+) Net Profit 21,960 (-) Depreciation 1,875 23,125
51,960 Furniture 6,000 (-) Drawings 600 51,360 Loose Tools 3,000
Magan’s Capital
Patents 4,000
Balance b/d 20,000 Investments 10,000 (+) Net Profit 14,640 34,640 Bills Receivable 4,000
Creditors 10,000 Debtors 20,000
Bank Overdraft 5,000 (-) Bad debts 225 19,775
Outstanding Closing Stock 20,000
Salaries & Wages
400 Cash in Hand 5,000
1,01,400 1,01,400
Illustration 4 : A & B are partners and the trial balance and the
necessary adjustments of there are given below :
Trial balance as on 31st March, 2010
Particulars Rs. Particulars Rs.
Purchase 2,59,000 Capital :
Sales Returns 4,250 A 1,27,000
Debtors 50,200 B 1,35,000
Opening Stock 21,000 Sales 3,05,000
Salaries 13,600 Purchase Returns 3,230
Wages 20,100 Creditors 21,070
Furniture Balance as on
Dividend on Investment 10,825
1-4-2009 16,750
(+) Purchases 31.3.2010
1,700
Machines 16,229
Bad debts 315
Advertisements 46,000
(for 5 years w.e.f.
1/10/2009)

160
Investments 1,20,500
Current Account :
A 3,000

161
B
Cash and Bank balance
1,500
27,981
6,02,125 6,02,125
Adjustments :
1. Closing Stock Rs.75,000/-.
2. Depreciation on machines at 5% and on furniture at 10% p.a.
3. Salaries to A Rs.2,000/- p.m.
4. Interest on Capital at 5%.
After considering the adjustments, prepare the trading and Profit
& Loss Accounts for the year ended 31st March 2010 and Balance Sheets as on that date.
Solution :
In the books of M/s. An Co. & Co.
Trading, Profit and Loss Account for the year ended 31st
March 2010
Dr. Cr.
Particulars Rs. Rs. Particulars Rs. Rs.
To Opening Stock
21,000 By Sales 3,05,000
To Purchases 2,59,000
(-) Returns (4,250) 3,00,750
(-) Returns (3,230) 2,55,770
By Closing Stock
75,000
To Wages 20,100
To Gross Profit c/d
78,880
3,75,750 3,75,750
To Salaries
To Depreciation
on Machinery
Furniture
To Bad Debts
To
Advertisements
(-) Prepaid
46,000 ×
6 5 12
To Net Profit c/d
13,600 By Gross Profit
b/d By Dividend
on
Investment
78,880
811
10,825
1,675 2,486
315
46,000
(41,400)
4,600
68,704
89,705 89,705

160
Profit & Loss Appropriation Account for the year ended 31.03.2010
Dr. Cr.
Particulars Rs. Rs. Particulars Rs. Rs.
To Int. on
Capital A
B
To A’s Salaries
(2,000 12)
To Net Profit c/d
to Current A/c
A
B
By Net Profit b/d
68,704
6,350 6,750 13,100
24,000
15,802
15,802
31,604
68,704 68,704
Partner’s Current Account
Dr. Cr.
Particulars A B Particulars A B
To Bal b/d 3,000 1,500 By Int. on
Capital A/c
By Salaries
By Net
Profit
(Opening) 6,350 6,750
To Bal c/d 43,152 21,052 24,000 -
15,802 15,802
46,152 22,552 46,152 22,552
Balance Sheet as on 31st March 2010
Liabilities Rs. Rs. Assets Rs. Rs.
Partners Capital
A
B
Partners
Current A/c
A
B
Sundry
1,27,000
1,35,000
2,62,00
0
64,204
21,070
Machinery
(-) Depn @ 5%
Furniture (op.
bal) (+)
Purchased on
31.03.10
(-) Depn @ 10%
p.a. (10,750
16,229
(811)
15,41
8
16,775
50,20
16,750
1,700 (1,675)
43,152
21,052

161
Creditors 10%)
Sundry
Debtors
Investments
Stock in Trade
Cash & Bank
bal.
Prepaid Advt.
0
1,20,500
75,000
27,981
41,400
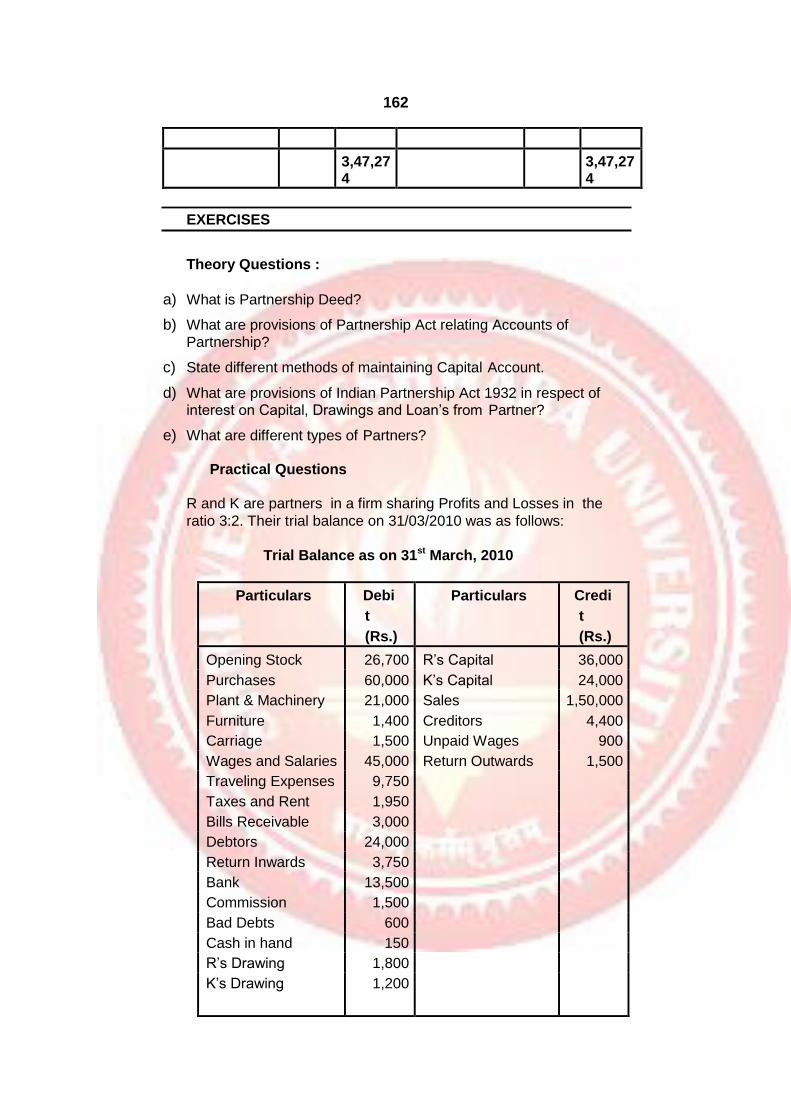
162
3,47,274
3,47,274
EXERCISES
Theory Questions :
a) What is Partnership Deed?
b) What are provisions of Partnership Act relating Accounts of
Partnership?
c) State different methods of maintaining Capital Account.
d) What are provisions of Indian Partnership Act 1932 in respect of interest on Capital, Drawings and Loan’s from Partner?
e) What are different types of Partners?
Practical Questions
R and K are partners in a firm sharing Profits and Losses in the
ratio 3:2. Their trial balance on 31/03/2010 was as follows:
Trial Balance as on 31st March, 2010
Particulars Debi
t
(Rs.)
Particulars Credi
t
(Rs.)
Opening Stock 26,700 R’s Capital 36,000
Purchases 60,000 K’s Capital 24,000
Plant & Machinery 21,000 Sales 1,50,000
Furniture 1,400 Creditors 4,400
Carriage 1,500 Unpaid Wages 900
Wages and Salaries 45,000 Return Outwards 1,500
Traveling Expenses 9,750
Taxes and Rent 1,950
Bills Receivable 3,000
Debtors 24,000
Return Inwards 3,750
Bank 13,500
Commission 1,500
Bad Debts 600
Cash in hand 150
R’s Drawing 1,800
K’s Drawing 1,200
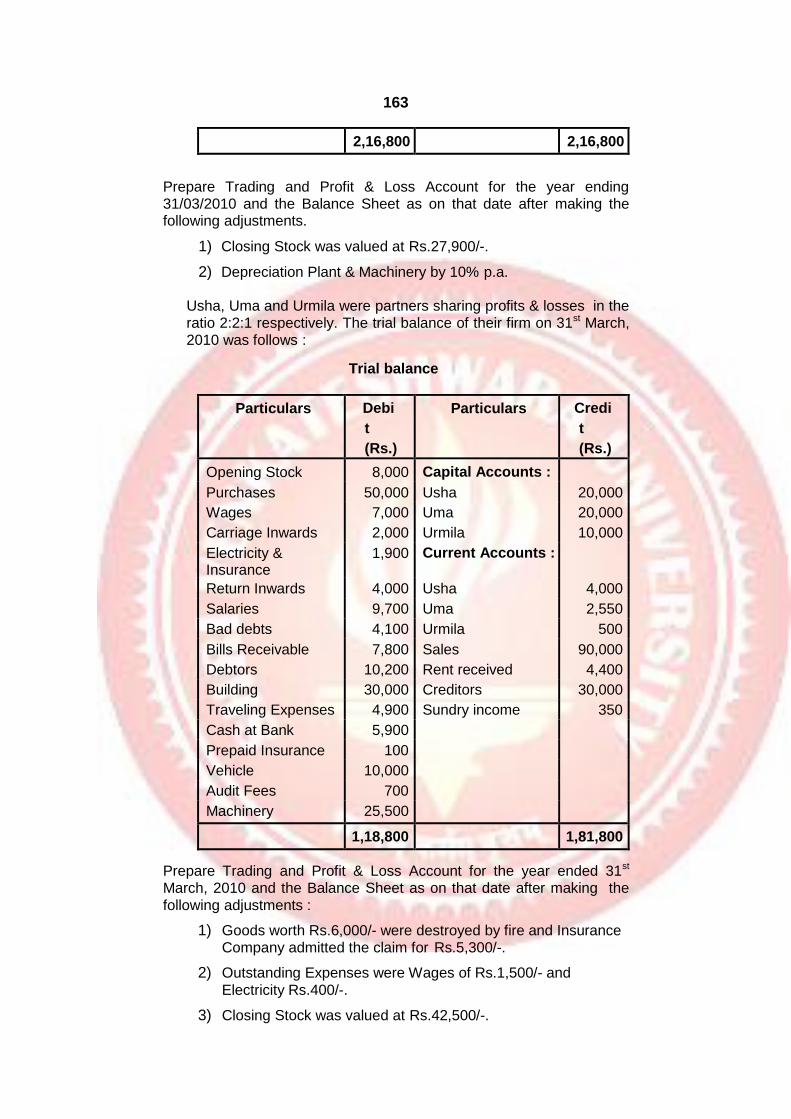
163
2,16,800 2,16,800
Prepare Trading and Profit & Loss Account for the year ending 31/03/2010 and the Balance Sheet as on that date after making the following adjustments.
1) Closing Stock was valued at Rs.27,900/-.
2) Depreciation Plant & Machinery by 10% p.a.
Usha, Uma and Urmila were partners sharing profits & losses in the ratio 2:2:1 respectively. The trial balance of their firm on 31st March, 2010 was follows :
Trial balance
Particulars Debi
t
(Rs.)
Particulars Credi
t
(Rs.)
Opening Stock 8,000 Capital Accounts :
Purchases 50,000 Usha 20,000
Wages 7,000 Uma 20,000
Carriage Inwards 2,000 Urmila 10,000
Electricity & Insurance
1,900 Current Accounts :
Return Inwards 4,000 Usha 4,000
Salaries 9,700 Uma 2,550
Bad debts 4,100 Urmila 500
Bills Receivable 7,800 Sales 90,000
Debtors 10,200 Rent received 4,400
Building 30,000 Creditors 30,000
Traveling Expenses 4,900 Sundry income 350
Cash at Bank 5,900
Prepaid Insurance 100
Vehicle 10,000
Audit Fees 700
Machinery 25,500
1,18,800 1,81,800
Prepare Trading and Profit & Loss Account for the year ended 31st March, 2010 and the Balance Sheet as on that date after making the
following adjustments :
1) Goods worth Rs.6,000/- were destroyed by fire and Insurance Company admitted the claim for Rs.5,300/-.
2) Outstanding Expenses were Wages of Rs.1,500/- and
Electricity Rs.400/-.
3) Closing Stock was valued at Rs.42,500/-.
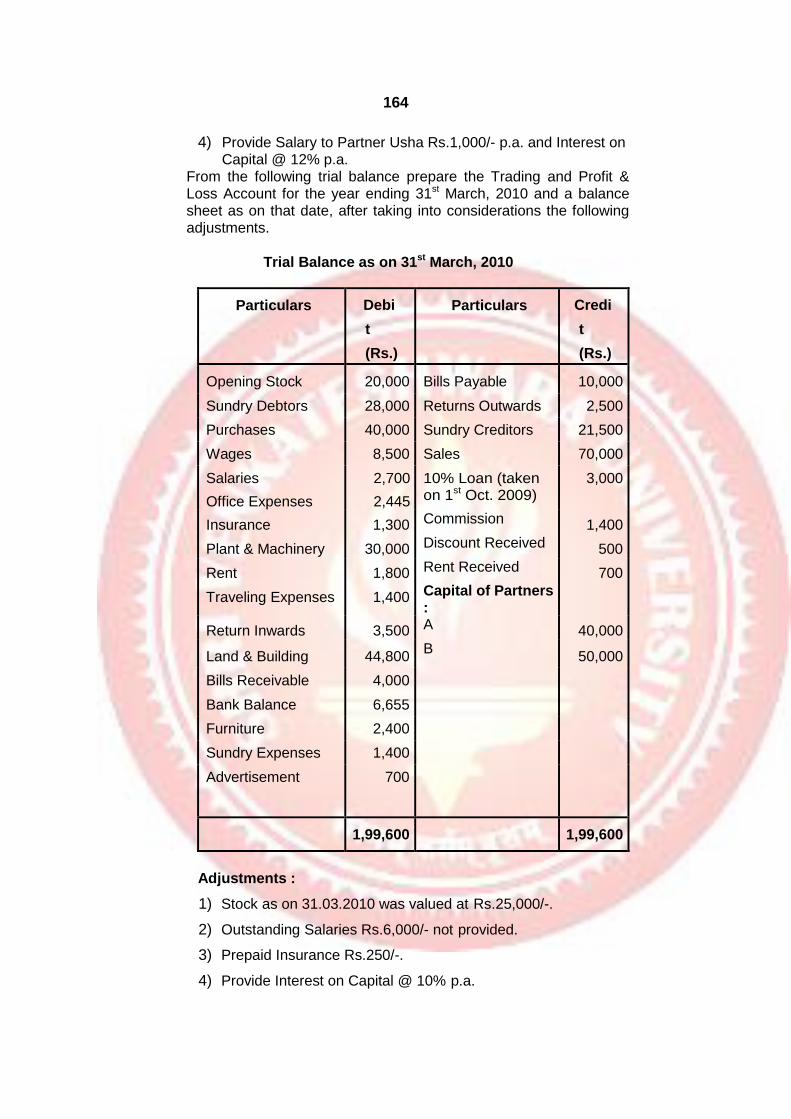
164
4) Provide Salary to Partner Usha Rs.1,000/- p.a. and Interest on Capital @ 12% p.a.
From the following trial balance prepare the Trading and Profit & Loss Account for the year ending 31st March, 2010 and a balance sheet as on that date, after taking into considerations the following adjustments.
Trial Balance as on 31st March, 2010
Particulars Debi
t
(Rs.)
Particulars Credi
t
(Rs.)
Opening Stock 20,000 Bills Payable 10,000
Sundry Debtors 28,000 Returns Outwards 2,500
Purchases 40,000 Sundry Creditors 21,500
Wages 8,500 Sales 70,000
Salaries
Office Expenses
2,700
2,445
10% Loan (taken on 1st Oct. 2009)
3,000
Insurance 1,300 Commission 1,400
Plant & Machinery 30,000 Discount Received 500
Rent 1,800 Rent Received 700
Traveling Expenses 1,400 Capital of Partners :
Return Inwards 3,500 A 40,000
Land & Building 44,800 B
50,000
Bills Receivable 4,000
Bank Balance 6,655
Furniture 2,400
Sundry Expenses 1,400
Advertisement 700
1,99,600
1,99,600
Adjustments :
1) Stock as on 31.03.2010 was valued at Rs.25,000/-.
2) Outstanding Salaries Rs.6,000/- not provided.
3) Prepaid Insurance Rs.250/-.
4) Provide Interest on Capital @ 10% p.a.

165
From the following Trial Balance of Jayshree trader, Jalgaon,
prepare Trading and Profit and Loss Account for the year ending 31/3/2010 and Balance Sheet on that date :
Trial Balance
Particulars Debi
t
(Rs.)
Particulars Credi
t
(Rs.)
Opening Stock 10,000 Bank Overdraft 35,000
Purchases 60,000 Creditors 22,000
Wages 7,000 Reserve for doubtful
Carriages 2,500 debts 700
Salaries and Wages 4,900 Sales 1,20,000
Printing 2,700 Capital Account :
Advertisement 1,000 Hemant 32,000
Bad debts 2,900 Shantanu 16,000
Discount 2,500 Current Account :
Debtors 16,000 Hemant 3,000
Bills Receivable 13,200 Shantanu 2,000
Building 30,000
Machinery 42,000
Cash in hand 5,200
Motor Car 20,000
Drawings :
Hemant 4,800
Shantanu 6,000
2,30,700
2,30,700
Adjustments :
1) Depreciate Building by 5% and Machinery by 10%.
2) Otstanding expenses were : Printing Rs.200/-, Wages
Rs.1,200/-.
3) Goods of Rs.1,000/- purchased on 31st March, 2010 were
included in Closing Stock but were not recorded in Purchases Book.
4) Cost price of Closing Stock was Rs.20,500/- while its market
price was Rs.25,000/-.

166
The trial balance of M/s. Shrikant Traders as on 31st March, 2010 is
given below.
Trial Balance as on 31st March, 2010
Particulars Debi
t
(Rs.)
Particulars Credi
t
(Rs.)
Drawings 750 Sales 75,500
Land and Building 20,000 Purchase Returns 1,000
Plant & Machinery 6,000 Sundry Creditors 12,600
Cash at Bank 550 Discount earned 50
Purchases 47,500 Outstanding Salaries
100
Sales Returns 1,500
Carriage Inward 350 Capital Account :
Opening Stock 11,000 A 15,000
Wages 6,000 B 20,000
Sundry Debtors 17,600 Current Account :
Salaries 2,500 A 1,000
Postage & Telegram 200 B 750
Rent & Insurance 400
Bad debts 250
Discount 100
Trade Expenses 300
Furniture 5,000
Commission 500
Prepaid Insurance 300
Printing & Stationery 700
Cash in hand 2,000
Patents 2,500
1,26,000 1,26,000
Adjustments :
1) Stock as on 31st March, 2010 was valued at Rs.25,000/-.
2) Outstanding wages Rs.600/- and outstanding rent Rs.700/-
3) Provide 10% depreciation on Plant & Machinery and 5% depreciation of Furniture.
4) 5% interest allowed on capital.
Prepare a Trading Account and Profit and Loss Account for the year ended 31st March, 2010 and the Balance Sheet as on that date.

167
From the following Trial Balance of M/s Chavan and Deshpande,
you are required to prepare Trading and Profit and Loss Account for the year ended 31st March, 2010 and the Balance Sheet as on that date after taking into account the necessary adjustment.
Trial Balance
Particulars Debit (Rs.)
Credit (Rs.)
Chavan’s Capital - 1,80,000
Deshpande’s Capital - 1,50,000
Chavan’s Drawings 14,450 -
Deshpande’s Drawings 10,000 -
Stock on 01/04/2009 2,00,000 -
Bills Receivable 25,000 -
Purchases 2,75,000 -
Sales - 4,00,000
Bills Payable - 60,000
Returns Inward 5,000 -
Returns Outward - 4,500
Plant and Machinery 1,00,000 -
Loose Tools 25,000 -
Patents 25,000 -
Sundry Debtors 1,25,000 -
Sundry Creditors - 1,40,000
Cash at Bank 77,550 -
Wages 19,000 -
Salaries 17,500 -
Rates & Taxes 7,500 -
Insurance 3,000 -
Printing and Stationery 2,000 -
Power and Fuel 3,500 -
9,34,500 9,34,500
Adjustments :
1) Stock as on 31st March 2010 valued at Rs.2,42,000/-.
2) Depreciate Plant & Machinery by 10% p.a.

168
8
COST ACCOUNTING
Unit Structure:
Objectives
Introduction
Limitations of Financial Accounting
Meaning of Cost, Costing and Cost Accounting
Cost Centre and Cost Units
Objectives of Cost Accounting
Classification of Cost
Elements of Cost
Methods Of Costing
Key Points
Additional Readings
Exercise
OBJECTIVES
After studying this chapter, you should be able to
understand:
Need for Cost Accounting
Meaning of Cost, Costing and Cost Accounting
Objectives of Cost Accounting
Classification of Cost
Elements of Cash
Methods of Costing
INTRODUCTION
Cost Accounting is the system of accounting which is concerned
with determination of costs of doing something which can be manufacturing or rendering service or even conducting any activity or
function. The objective of Cost Accounting is to render detailed and useful information for guidance to Management.

169
Financial accounting is developed over the time to record, summarise and present the financial transaction or events which can be expressed in terms of money. This function was primarily concerned with record keeping, leading to preparation of Profit and Loss Account and Balance Sheet. The information obtained through financial
statements is useful to the Management or Owner in several respects. However, the information provided by financial accounting is not sufficient for several purposes of decision making in many areas such as : determining output level, determining product selection – addition or dropping or changing product combination in the case of multi product company, determining or revising prices of products, whether
Profit earned is optimum as compared with competitors and in comparison to earlier years.
The need of data for such details lead to the development of
Cost Accountancy.
LIMITATIONS OF FINANCIAL ACCOUNTING
Financial accounting does not help in day to day management of the organisation. Cost Accounting has emerged mainly because of certain limitations of financial accounting, which are summarized as follows –
1) Financial accounting provides information about the business as a
whole. But it does not reveal Profit or loss of each department or product or process.
2) Material and supplies can not be controlled effectively. There is no
proper system of control of material which may in losses in the form of deterioration, scrap, misappropriation etc.
3) It does not provide cost information for fixation of prices of products
and services.
4) It does not classify the expenses into direct and indirect, fixed and variable and controllable and non-controllable.
5) There is no system of recording loss of labour, i.e. idle time and
labour cost is not recorded by jobs, processes etc.
6) Financial accounting is a historical record. It does not help in
controlling the cost.
7) It does not facilitate cost reduction which is very important and
necessary for cost control.
8) It fails to supply useful information to management for taking various
decisions like replacement of labour by machine, introduction of new product, make or buy, selection of most profitable product mix etc.

170
Therefore, Cost Accounting has developed as a separate branch of accounting. Both cost and financial accounting are concerned with systematic recording and presentation of financial data. Financial accounting reveals Profit / Loss of business as a whole for a certain period. But Cost Accounting reveals Profit / Loss of different product
lines. It helps to decide profitability of each process or each product.
MEANING OF COST, COSTING and COST
ACCOUNTING
Cost :
Institute of Cost and Works Accountants of India, defines cost
as “measurement, in monetary terms, of the amount of resources used for the purpose of production of goods or rendering services”.
Thus the term cost means the amount of expenditure, actual or
notional incurred or attributable to a given thing. It can be regarded as the price paid for attaining the objective. For e.g. Material cost is the
price of materials acquired for manufacturing a product.
Costing :
The term costing has been defined as “the techniques and
processes of ascertainment of costs. Whelden, has defined costing as, “the classifying recording and appropriate allocation of expenditure for the determination of costs the relation of these costs to sale value and the ascertainment of profitability.” Therefore costing involves the following steps.
1) Ascertaining and Collecting of Costs
2) Analysis or Classification of Costs
3) Allocating total costs to a particular thing i.e. product, a contract or a process.
Thus costing simply means cost finding by any process or
technique.
Cost Accounting :
Cost Accounting is a formal system of accounting by means of
which cost of products or service, are ascertained and controlled.

170
“Whelden” defines Cost Accounting as “Classifying, recording and appropriate allocation of expenditure for determination of costs of products or services and for the presentation of suitably arranged data for the purpose of control and guidance of management.”
Therefore, Cost Accounting is the application of costing
principles, methods and techniques in the ascertainment of costs and analysis of savings or / and excesses as compared with previous experience or with standards. It provides, detailed cost information to various levels of management for efficient performance of their functions. The information supplied by Cost Accounting as a tool of management for making optimum use of scarce resources and
ultimately add to the profitability of business.
COST CENTRE AND COST UNITS
Cost Centre :
It is a location, person or item of equipment for which cost may
be ascertained and used for the purpose of cost control. It is a convenient unit of the organisation for which cost may be ascertained. The main purpose of ascertainment of cost is to control the cost and fill up the responsibility of the person who is incharge of the cost centre.
Types of cost centers :
I. Personal Cost Centre :
It consists of a person or group of persons. e.g. machine operator, salesmen, etc.
II. Impersonal Cost Centre :
It consists of a location or an item of equipment or group of these. E.g. Factory, Machine etc.
III. Operational Cost Centre :
This consists of machines or persons carrying on similar
operations.
Cost Accounting = Costing (+) Application of Cost control methods and ascertainment of profitability (+) Presentation of relevant information for managerial decision making.

171
IV. Process Cost Centre :
This consists of a continuous sequence of operation or specific operations.
V. Production Cost Centre :
This is the centre where actual production takes place or these include, those departments that are directly engaged in manufacturing activity and contribute to the content and form of finished product.
e.g. Cutting, Assembly and Finishing Departments etc.
VI. Service Cost Centre :
This is the Centre which renders services to production centres.
These contribute to the production process in an indirect manner.
e.g. Stores department, Repairs and Maintainance department, H.R. Department, Purchase Department etc.
8.4.2 Cost unit :
It is a unit of product, service or time in terms of which cost are
ascertained or expressed. It is basically, a unit of quantity of product or service in relation to which costs may be ascertained or expressed.
Few examples of cost unit are given below.
Name of Industry Cost unit
Textiles Meter, yards
Transport Passenger km
Power Kilowatt – hour
Paints Litre
Iron and Steel Tonne
Canteen Per meal
Chemical Litre, kilogram
Readymade Garments Number
Petrol Litre

172
OBJECTIVES OF COST ACCOUNTING
Objectives of Cost Accounting are as follows :
1) Ascertain Cost : To ascertain the cost of product or a services
reveled and enable measurement of profit by proper valuation of inventory.
2) Analyse Costs : To analysis costs or to classify the expenses
under different heads of accounts viz. material, labour, expenses
etc.
3) Allocate and Apportion the Costs : To allocate or charge the
direct expenses or specific costs such as Raw Material, Labour to particular product, contract or process and to distribute common expenses to each product, contract or process on a suitable basis.
4) Cost Reporting : Cost Reporting or presentation includes :
a) What to report i.e. what is the nature of information to be
presented?
b) Whom to Report i.e. to whom the report is to be addressed.
c) When to Report i.e. when the report is to be presented i.e. Daily weekly monthly yearly etc.
d) How to Report i.e. in what format the report is to be presented.
5) Assist the Management : Cost Accounting assist the management
in the following ways
a) Indicate to the management any inefficiencies and extent of
various forms of waste of Raw Material, Time, Expenses etc.
b) Help the management in fixing of selling price.
c) Provide information to enable management to take decision of
various types.
6) Cost Control : Cost Accounting assist the management in cost
control. Cost control includes the following stages.
a) Setting up of targets of cast and production for each period.
b) Measuring the actual figures of performance relating to cost,
production etc. for the period concerned.
c) The figures of actual performance are to be compared with the
targets to find out the variation.
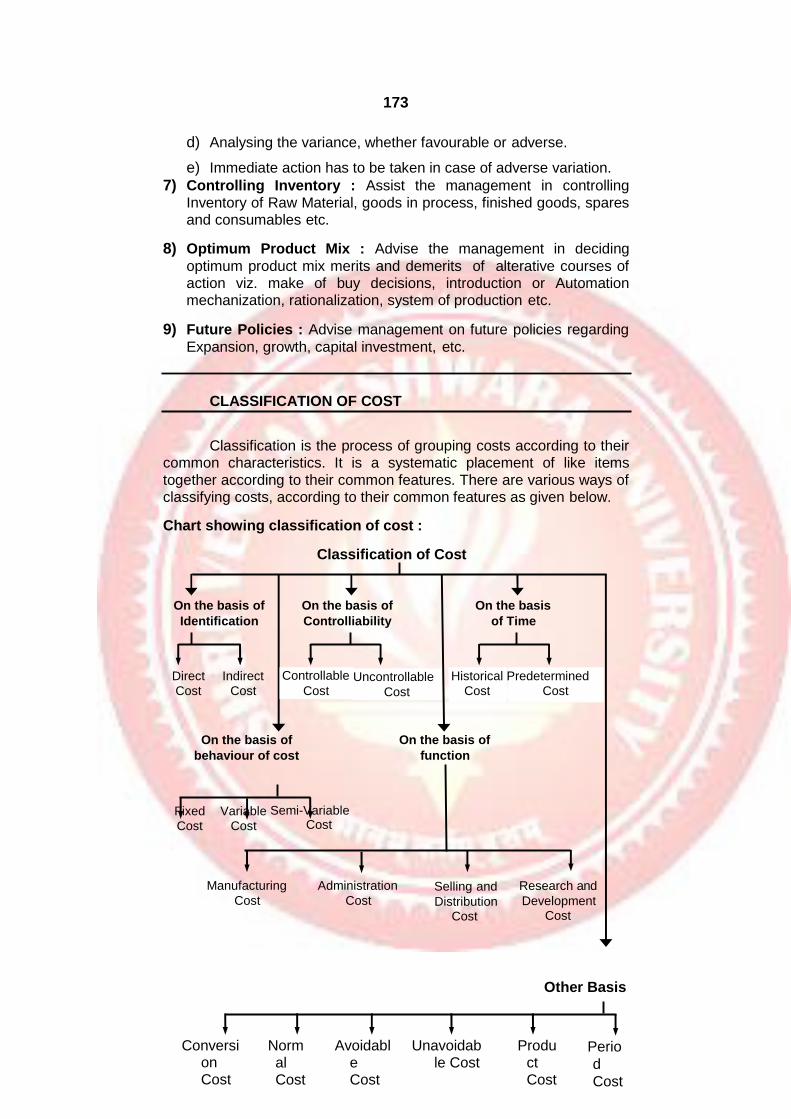
173
On the basis of
Identification
On the basis of
Controlliability
On the basis
of Time
Direct
Cost
Indirect
Cost
Controllable Uncontrollable Cost Cost
Historical Predetermined
Cost Cost
On the basis of
behaviour of cost
On the basis of
function
Fixed Variable Semi-Variable
Cost Cost Cost
Manufacturing
Cost
Administration
Cost Selling and Research and
Distribution Development Cost Cost
d) Analysing the variance, whether favourable or adverse.
e) Immediate action has to be taken in case of adverse variation.
7) Controlling Inventory : Assist the management in controlling
Inventory of Raw Material, goods in process, finished goods, spares and consumables etc.
8) Optimum Product Mix : Advise the management in deciding
optimum product mix merits and demerits of alterative courses of action viz. make of buy decisions, introduction or Automation mechanization, rationalization, system of production etc.
9) Future Policies : Advise management on future policies regarding
Expansion, growth, capital investment, etc.
CLASSIFICATION OF COST
Classification is the process of grouping costs according to their common characteristics. It is a systematic placement of like items
together according to their common features. There are various ways of classifying costs, according to their common features as given below.
Chart showing classification of cost :
Classification of Cost
Other Basis
Conversi
on Cost
Normal Cost
Avoidable Cost
Unavoidable Cost
Product Cost
Perio
d
Cost

174
I On the basis of Identification :
On the basis of identification of cost with cost units or jobs or processes, costs are classified into –
1) Direct Costs
2) Indirect Costs
1) Direct Costs : These are the costs which are incurred for and
conveniently identified with a particular cost unit process or department. These are the expenditures which can be directly allocated to a particular job, product or an activity. Eg. Cost of Raw Material used, wages paid to labourers etc.
2) Indirect Costs : These are general costs and are incurred for the
benefit of a number of cost units, processes or departments. These costs can not be conveniently identified with a particular cost unit or cost centre. Example : Depreciation of Machinery, Insurance, Lighting, Power, Rent of Building, Managerial Salaries, etc.
II On the basis of behaviour of Cost
Behaviour means change in cost due to change in output. Costs
behave differently when the level of production rises or falls. Certain costs change in direct proportion with production level while other costs
remain unchanged. As such on the basis of behaviour of cost – costs are classified into
1) Fixed Costs.
2) Variable Costs.
3) Semi Variable Costs.
1) Fixed Costs : It is that portion of the total cost which remain
constant irrespective of output upto the capacity limit. It is the cost which does not very with the change in the volume of activity in the short run. These costs are not affected by temporary fluctuation in the activity of an enterprise. These are also known as period costs as it is concerned with period. Rent of premises, tax and insurance,
staff salaries, are the examples of fixed cost.
Characteristics of Fixed Cost are :
1) Large in value
2) Fixed amount within an output range
3) Fixed cost per unit decreases with increased output

175
4) Indirect Cost
5) Lesser degree of controllability
6) Influence Variable Cost and Working Capital Y
Total Fixed Cost
O Output (Units) X
Behaviour of Fixed Cost
2) Variable Cost: It is that cost which directly very with the volume of
activity. In other words, it is a cost which changes according to the
changes in the volume of output. It tends to very in direct proportion to output. It means when the volume of output increases, total variable cost also increases when the volume of output decreases, total variable cost also decreases. But the variable cost per unit remains same. Direct material, Direct Labour, Direct Expenses are the examples of variable costs.
Characteristics of Variable Cost are :
1) Total cost changes in direct proportion to the change in total
output.
2) Cost per unit remains content.
3) It is quite divisible.
4) It is identifiable with the individual cost unit.
5) Such costs are controlled by functional manager.
Cost
(Rs.)

176
X
Variable Cost per Unit
O Output (in Units) Y
Behaviour of Variable Cost
3) Semi-Variable Cost : This is also referred as semi-fixed costs.
These costs include both a fixed and a variable component. i.e. These are partly fixed and partly variable. They remain constant upto a certain level and registers change afterwards. These costs
vary in some degree with volume but not in direct or same proportion. Such costs are fixed only in relation to specified constant condition.
For example : Repairs and maintainance of machinery, telephone charges, maintainance of building, supervision, professional tax,
compensation for accidents, light and power etc.
Output (in Units)
Behaviour of Semi-Variable Cost
III. On the basis of Controllability
On the basis of controllability, costs are classified into two
types :
1) Controllable Cost
Semi Variable Cost
Cost (R
s.)
Cost (
Rs.)

177
2) Uncontrollable Cost
1) Controllable Cost : These are the costs which can not be
influenced or controlled by the concerned cost centre or responsibility centre. These costs may be directly regulated at a given level of management authority.
2) Uncontrollable Cost : These are the costs, which can not be
influenced or controlled by the action of a specific member of an enterprise. For eg. it is very difficult to control costs like factory rent, managerial salaries etc.
The important points to be noted regarding this classification. First, controllable cost can not be distinguished from non- controllable
costs, without specifying the level and scope of management authority. It means cost which is uncontrollable at one level of management may be controllable at another level of management. Eg. Rent and Factory Building may be beyond control for the production department but can be controlled by the administrative department by negotiations. Secondly all costs are controllable in the long run and at the some appropriate management level.
IV On the basis of Functions
An organisation performs many functions. On the basis of
functions costs can be classified as follows :
1) Manufacturing Costs : It is the cost of all items involved in the
manufacturing of a product or service. It includes all direct costs and all indirect costs related to the production. It includes cost of direct materials, direct labour, direct expenses, and overhead expenses related to production. Overhead expenses, means all indirect costs involved in the production process. This is termed as factory overhead or manufacturing overheads. Eg. Salaries of staff for
production department, technical supervision, Expenses of stores department, Depreciation of Plant and Machinery, Repairs and maintainance of Factory Building and Machineries etc.
2) Administration Cost : These are costs incurred for general
management of an organisation. It is the cost which is incurred for formulating the policy, directing the organisation of controlling the operations. These are in the nature of indirect costs and are also termed as administrative overhead. Eg. Salaries of Administrative Stall, General Office expenses like rent, lighting, telephone,
stationery, postage etc.
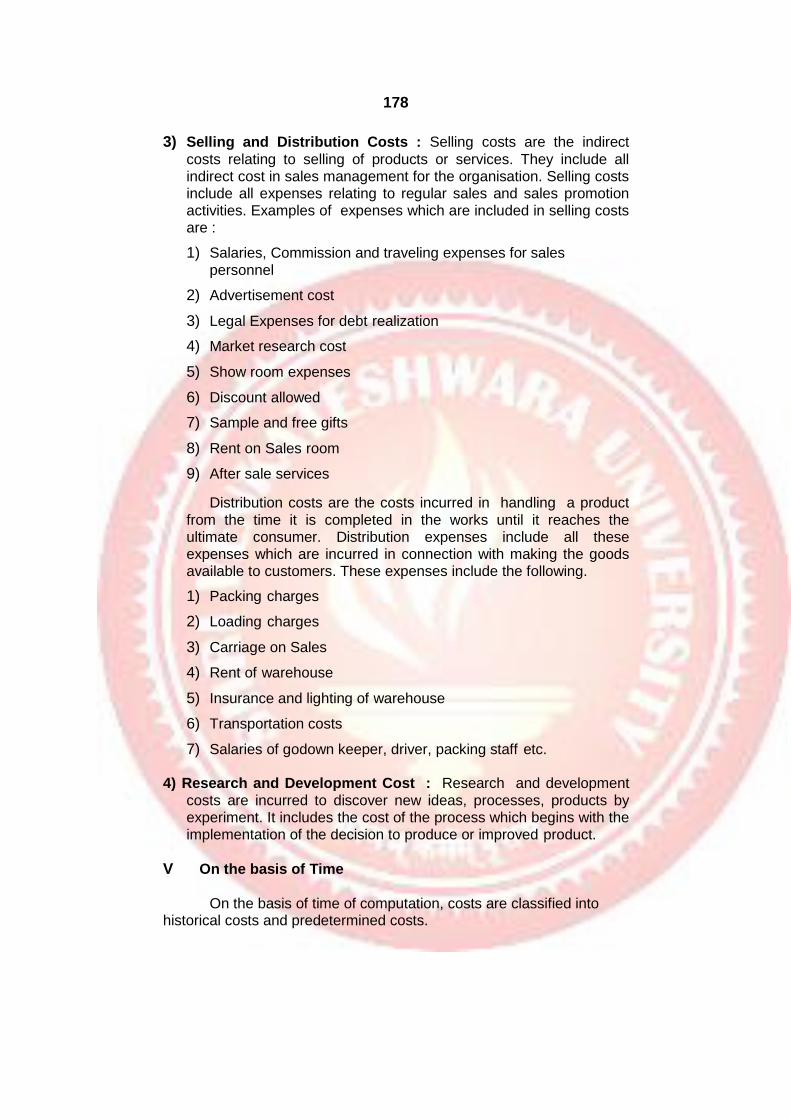
178
3) Selling and Distribution Costs : Selling costs are the indirect
costs relating to selling of products or services. They include all indirect cost in sales management for the organisation. Selling costs include all expenses relating to regular sales and sales promotion activities. Examples of expenses which are included in selling costs are :
1) Salaries, Commission and traveling expenses for sales
personnel
2) Advertisement cost
3) Legal Expenses for debt realization
4) Market research cost
5) Show room expenses
6) Discount allowed
7) Sample and free gifts
8) Rent on Sales room
9) After sale services
Distribution costs are the costs incurred in handling a product
from the time it is completed in the works until it reaches the ultimate consumer. Distribution expenses include all these expenses which are incurred in connection with making the goods available to customers. These expenses include the following.
1) Packing charges
2) Loading charges
3) Carriage on Sales
4) Rent of warehouse
5) Insurance and lighting of warehouse
6) Transportation costs
7) Salaries of godown keeper, driver, packing staff etc.
4) Research and Development Cost : Research and development
costs are incurred to discover new ideas, processes, products by experiment. It includes the cost of the process which begins with the implementation of the decision to produce or improved product.
V On the basis of Time
On the basis of time of computation, costs are classified into
historical costs and predetermined costs.
179
1) Historical Costs : These are the costs which are ascertained after
these have been incurred. Historical costs are then nothing but actual costs. They represent the costs of actual operational performance. These costs are not available until after the completion of manufacturing operations.
2) Pre determined Costs : These are the future costs which are
ascertained in advance of production on the basis of a specification of all the factors affecting cost and cost data. Predetermined costs are future costs determined in advance on the basis of standards or estimates. These costs are extensively used for the purpose of planning and control.
VI Other Basis
1) Normal Cost : Normal cost may be defined as a cost which is
normally incurred on expected lines at a given level of output, in the condition in which that level of output in normally attained. This cost
is a part of production.
2) Abnormal Cost : Abnormal cost is that cost which is not normally
incurred at a given level of output, in the condition in which that level of output is normally attained. Such cost is over and above the normal cost and is not treated as a part of the cost of production.
3) Avoidable Cost : The cost which can be avoided under the present
conditions is an avoidable cost. These are the costs which under given conditions of performance efficiency should not have been incurred. They are logically associated with some activity and situation and are ascertained by the difference of actual cost with
the happening of the situation and the normal cost. Eg. when spoilage occurs in manufacturing in excess of normal limit, the resulting cost of spoilage is avoidable cost.
4) Unavoidable Cost : The cost which can not be avoidable under the
present condition is an unavoidable cost. They are inescapable costs which are essentially to be incurred within the limits or norms provided for. It is the cost that must be incurred under a programme of business restriction.
CHECK YOUR PROGRESS
Draw the chart showing Classification of Cost.
Define the following terms:
1. Costing
2. Cost Accounting
3. Impersonal cost center

180
4. Service Cost center
5. Direct Cost
6. Uncontrollable cost
7. Predetermined cost
Give Examples:
1. Fixed cost
2. Variable cost
3. Semi variable cost
4. Manufacturing cost
5. Administration cost
6. Selling cost
7. Distribution Cost
ELEMENTS OF COST
A cost is composed of three elements i.e. material, labour and expenses. Each of these elements may be direct or indirect. This is shown as follows :
Direct Costs Indirect Costs
Direct Material Indirect Material
Direct Labour Indirect Labour
Direct Expenses Indirect
Expenses
Material Cost
It is the cost of material of any nature used for the purpose of production of a product or a service. Materials may be Direct Material or Indirect Material.
Direct material : It is the cost of basic raw material used for manufacturing a product. Direct materials generally became a part of the finished product. No finished product can be manufactured without basic raw material. This cost is easily identifiable and chargeable to the product. For e.g. Leather in leather products, Steel in steel furniture, Cotton in textile etc. Direct material includes the following.
1) All materials specially purchased for production or the process.
2) All components purchased for production or the process.
3) Material transferred from one cost centre to another or one process to another process.

181
4) Primary packaging materials, wrappings, cardboard boxes etc necessary for production or protection of product.
However, in many cases, though a material forms a part of the
finished product, yet it is not treated as direct material. Eg. nails used in
furniture, thread used in stitching garments etc. This is because value of such materials is so small that it is quite difficult to measure it.
Indirect material : It is the cost of material other than direct material
which cannot be charged to the product directly. It can not be treated as part of the product. These are minor in importance. It is also known as expenses materials. It is the material which cannot be allocated to the product but can be apportioned to the cost units.
Examples : Lubricants, Cotton waste, Grease, Oil, Small tools, Minor
items like thread in dress making, nails in furniture (nuts, bolts in furniture) etc.
Therefore, indirect materials can not be easily identified with
specific job. They may not vary directly with the output. It is considered as a part of overheads.
Labour Cost
This is the cost of remuneration in the form of wages, Salaries,
Commissions, Bonuses etc. paid to the workers and employees of an organisation.
Direct Labour Cost : Direct Labour Cost is the amount of wages
paid to those workers who are engaged on the manufacturing line. It consists of wages paid to workers engaged in converting of raw materials into finished products. The amount of wages can be conveniently identified with a particular line, product, job or process.
These workers directly handle machines on the production line. Direct wages include payment made to the following group of workers.
1) Labour engaged on the actual production of the product
2) Labour engaged in aiding the operation viz. supervisor, foremen,
shop Clerks and worker on internal transport.
3) Inspectors, Analysts, needed for such production.
Example : Carpenter in furniture making unit, tailor in readymade wear
unit, Labour in construction work etc.
Indirect Labour Cost : It is the amount of wages paid to those
workers who are not engaged on the manufacturing line. It is of general character and can not be directly identified with a

182
particular cost unit. This indirect labour is not directly engaged in the production operations but such labour assist or help in production operations. It can not be easily identified with specific job, contract of work order. It may not vary directly with the output. It is treated as part of overheads.
Example : Labour in Human Resource department, Labour in payroll
department, Labour in stores, Labour in Securities Department, Labour
in power house department etc.
Expenses
All costs other than material and labour are termed as expenses.
It is defined as the cost of services provided to an undertaking and the notional cost of the use of owned assets.
Direct Expenses : It is the amount of expenses which is directly
chargeable to product manufactured or which may be allocated to
product directly. It can be easily identified with the product. These are the expenses which are specifically incurred in connection with a particular job or cost unit. They are also called as chargeable expenses.
Example : Hire of special plant for a particular job, Travelling expenses
in securing a particular contract, Carriage paid for materials purchased for specific job, Royalty paid in mining or production etc.
Indirect Expenses : All indirect costs other than indirect materials
and indirect labour costs, are termed as indirect expenses. It is the amount of expenses which can not be charged to the product
directly. These can not be directly identified with particular job, process or work order and are common to cost units’ or cost centres. Indirect expenses include factory expenses, administrative overheads, selling and distribution expenses etc.
Overhead
This is the aggregate of indirect material cost, indirect labour
cost and Indirect expenses.
Thus overhead=Indirect Material+ Indirect Labour+ Indirect Expenses
METHODS OF COSTING
Methods of Cost Accounting signify the systems used to assign cost elements to cost objects. These are the procedures by which product costs are accumulated. Different methods of cost

183
determination are used because business vary in their nature and the type of products or services they produce. Following are the different methods of costing.
Job costing and Batch Costing:
Job costing is designed to accumulate cost data for a manufacturing
firm which produces goods to specific order. It is also known as specific orders costing or production order costing. According to “ICMA”, London, it is that category of basic costing method which is applicable where the work consists of separate contract job or batches each of which is authorized by specific order or contract. It is followed by manufacturing and non- manufacturing concerns. It is employed in
industries in which –
a) A production is done on the basis of customer’s own
specifications.
b) Products are manufactured in distinguishable lots.
c) Products are not uniform.
d) It is practical to maintain a separate record of each lot from the time production is begun until it is completed.
Following is the list of concerns which generally employ job costing method.
a) Printing Work.
b) Design Engineering Concerns.
c) Repair Works.
d) Construction companies.
e) Furniture makers.
f) Hardware industry.
g) Automobile garages.
h) Interior decoration etc.
Batch Costing
It is a form of job costing in which a batches of identical products
is taken as the cost unit. It is used when production consists of limited repetition work and a definite number of articles are manufactured in each batch to be held in stock for sale to customers generally. Thus batch is a cost unit consisting of a group of identical units.
Batch costing is applied in the manufacture of shoes,
readymade garments, component parts of cars, radios, watches etc and manufacture of drugs, engineering equipments etc.
184
For eg. in foot wear industry it is not just economical to manufacture a pair of shoes to meet the requirement of one customer. But batches say 500 to 5000 shoes of each size, style colour etc are economically made and held in stock for sale on demand.
Contract Costing:
It is a method of costing in which each contract is taken as a
separate costing unit for the purpose of cost ascertainment and control. The objective is find out the Profit or loss on each contract separately. Contract costing is employed in business undertakings engaged in building construction, road construction, bridge construction, dam construction and other civil engineering works, ship building etc.
Contracts are generally of large size. A contract generally takes
more than one year to complete. Work on contract is carried out at the site of the contracts and not in factory premises. Payments by the customer (contractee) are made at various stages of completion of the
contract based on architects certificate for the completed stage.
Process Costing:
It is a method of costing used to ascertain the cost of the product at each process operation or stage of manufacture where processes are carried on. According to ICMA London, “It is that form of operation costing where standardized goods are produced.”
Process costing is used to ascertain the cost of product at each
stage of manufacture where material is passed through various operations to obtain a final product. This method of costing is used by those concern which manufacture articles of uniform standards. These concerns manufacture articles on a continuous flow basis.
Each process is treated as a cost centre and separate account
is opened for each process. All costs related to a process are debited to its process account. The output passing through the process is also recorded. The output of one process becomes the input of next process
and so on until the finished product is obtained. This method is suitable for Textile mills, Chemical works, Oil refining, Cement manufactures, Paper Manufacture, Steel production, Paint manufacture, Sugar works, Plastic manufactures etc.
Single (output) or unit costing:

185
It is a method of costing in which cost is ascertained in convenient units of product turned out by continuous manufacturing activity. The unit of costing is chosen according to the nature of product. This method of costing is used in those industries, in which the production consists of a single product or a few varieties of the same
product with variations in size, shape, quality etc. and production is uniform and on continuous basis.
Examples of industries in which this method is commonly used
are : Cement, Steel, Sugar, Paper brick works, dairies etc. Cost of units in these industries are a tonne of cement, or steel, or sugar, 1000
bricks, a gallon of milk etc.
This method is also known as single costing. Operating Costing:
It is a method of costing which is used in those industries, which
are engaged in providing services such as transport, electricity etc. The cost of providing a service is termed as operating cost. Operating costing is used in those industries, where services rendered to
customers are of unique and standardized type.
The selection of a suitable cost unit (unit of service) is very
important. The cost unit may be different for different type of industries. A few examples are given below.
Undertakings Cost Unit
Transport Per passenger km
Hospital Per bed per day
Hotel Per room per day
Electricity Per kilowatt hour
Cinema Per seat per show
8.8.5 Operation Costing:
Under this method each operation is treated as a cost centre.
Costs are accumulated in each operation instead of each process. This method is used by industries engaged in repetitive mass production with continuous flow of work. These industries could be those engaged in the manufacture of leather products, toys, bicycles, ceiling fans, weighing machines etc.
KEY POINTS

186
Cost : It is the amount of expenditure, actual or notional incurred
on a given thing.
Costing : It is process of ascertaining the cost.
Cost Centre : It is a convenient unit for which cost may be
ascertained.
Cost Unit : It is a unit of product or service for which cost is
ascertained.
Cost Control : It involves comparing actual cost with the target and
taking remedial action.
Objectives of –
Cost Accounting : Ascertain Cost, Analyse Cost, allocate and
apportion Cost, Cost Reporting, Assist the management, Cost control, Optimum product mix, Future policies.
Elements of Cost : Direct Cost – Direct material, Direct labour,
Direct expenses. Indirect Cost – Indirect material, Indirect labour, Indirect expenses.
Methods of Costing : Job and Batch Costing, Contract Costing,
Process Costing, Output Costing Operating Costing, Operation Costing.
ADDITIONAL READINGS
1) Cost Accounting – Principles and practice by M.N. Arora
2) Cost Accounting – An introduction by Nigam and Jain
3) Cost Accounting – Chopade and Choudhary
EXERCISE
1) What is meant by Cost Accounting? Explain in brief different
ways of Cost Classification.
2) What is Cost Accounting? What are the elements of Cost
Accounting?
3) What is Cost Accounting? Explain the methods of Costing.
4) What is Cost Accounting and what are the objectives of Cost
Accounting?

187
9
FINANCIAL MANAGEMENT
Unit Structure:
Objectives
Meaning
Scope of Financial Management
Role of Financial Management
Functional areas of Financial Management
Various Financial Management Tools
Exercise
OBJECTIVES
After studying the unit the students will be able to:
Know the meaning of Financial Management.
Explain the Scope and role of Financial Management.
Elaborate the Functional areas of Financial Management.
Understand the various tools of FM, advantages and disadvantages of various tools.
MEANING
Finance may be defined as the art and science of managing money. The major areas of finance are Financial Services and
Managerial Finance or Financial Management.
Financial Services is concerned with the design and delivery of advice and financial products to individuals, businesses and governments within the areas of banking are related institutions, personal financial planning, investments, real estate, insurance and so on.
Financial Management is concerned with the duties of the
financial managers in the business firm. Financial managers actively manage the financial affairs of any type of business, namely, financial and non-financial, private and public, large and

188
small, profit seeking and not for profit. They perform such varied tasks as budgeting, financial forecasting, cash management, credit administration, investment analysis, funds management and so on.
Financial Management as an integral part of overall
management is not a totally independent area. It shows heavily related disciplines and fields of study, such as economic, accounting,
marketing, production and quantitative methods.
SCOPE OF FINANCIAL MANAGEMENT
Financial management provides a conceptual and analytical framework for financial decision making. Financial management is an integral part of overall management. It covers both financial function of acquisition of funds and allocation of funds. Thus, apart from this involves acquiring the external funds and the main concern of financial
management is the efficient and allocation of funds to various uses.
The financial management consider various financial problems
of a firm. The main contents of this approach are –
What is the total volume of a firm or enterprise? What
should an enterprise acquire specific assets? How
should the funds required be financed?
It also consider How should be enterprise large and how fast should it grow?
In what form should it hold assets and what is the position of its
liabilities.
The financial management covers the major problems of the
firm. The main solutions to this problem corresponding under the various decisions taken by the financial managers. Mostly it covers various fields like investment, financing, dividend policy, capital budgeting, working capital management and so on.
ROLE OF FINANCIAL MANAGEMENT
Role of financial management is very important which are
undertaken by finance manager.
1. In performing financial analysis and planning : The concern of
financial analysis and planning is –
a. Transforming financial data into a form that can be used to
monitor financial condition.

189
b. Evaluating the need for increased / reduced productive capacity and
c. Determining the additional / reduced financing required.
This activity is fully depend on the financial management. It proves financial management plays on important role in performing financial analysis and planning.
2. In making investment decisions : Financial management plays
an very important role in making investment decisions like current assets as well as fixed assets. Financial manager must determine and maintain certain optimum level of each assets. He should also
decide which of the best fixed asset acquired and when the existing assets need to be modified or replaced or liquidated.
3. In making financing decisions : Financial management again
plays an vital role in making financing decision. It means the finance manager consider which appropriate mix of short term and long term financing selected and the best individual short term or long term
sources of financing at a given point of time. These decisions are dedicated as per necessities, but same require an in-depth analysis of the available financing alternatives, the financial manager considers their costs and their long term implications.
FUNCTIONAL AREAS OF FINANCIAL MANAGEMENT
Financial management can be broken down into three different functional areas are as follows –
1. The investment decision
2. The financing decision and
3. The dividend policy decision
1. The Investment Decision : The investment decision relates to the
selection of assets in which the funds will be invested by firm. The assets can be acquired fall into 2 categories :
i) Long term assets (fixed assets) which yields a return over a
period of time.
ii) Short term or current assets defined as those assets which in
the normal course of business are convertible into cash without diminution in value usually within a year.

190
The investment decision policy is also known as capital budgeting management. If the funds are invested in a long term period for acquiring fixed assets is called as capital budgeting management and vice-versa. If the funds are invested in a current assets is popularly for short term period known as working capital
management.
2. Financing Decision : The second major decision involved in
financial management is the financing decision. This is concern with the financing mix or capital structure or leverage. The term capital structure refers to the proportion of debt and equity capital. It means
the choice of the proportion of these sources of finance is the capital requirement. It gives the theoretical relationship between the employment of debt and the return to the shareholders.
3. Dividend policy decision : The major third decision area of
financial management is decision relating to the dividend policy. The dividend decision should be analysed in relation to the financing decision of a firm. The two alternatives are available,
i.e. i) The available profits can distributed among the shareholders in the form of dividend or ii) The available profits can be reinvested into business. The decision as to which course should be followed depends largely on a significant element in the dividend decision, the dividend pay our ratio, that is, what proportion of net profits should be paid out to the shareholders.
VARIOUS FINANCIAL MANAGEMENT TOOLS
Following are various financial management tools:
1. Cash flow statement
2. Fund flow statement
3. Ratio analysis
Cash Flow Statement :
Cash flow statement means a statement of showing net changes
in the position of cash and cash equivalents.
As per as 3, this would include cash in hand and savings,
current account balances with banks, demand deposits with banks and cash equivalents.
Cash equivalents are defined as short term and highly liquid
investments that are readily convertible into cash which are subject to insignificant risk of changes in values.
191
Uses / advantages of Cash Flow Statement :
1. Efficient Cash Management : The most important function of
management is to manage the cash resources in such a way that adequate cash is available for meeting the expenses. It helps to plan and co-ordinate the financial operation of the business.
2. Internal Financial Management : It provides a clear picture of cash
flow operations. Therefore, it is very useful for internal financial management.
3. Knowledge of changes in Cash Position : It enables the
management to know about the causes of changes in cash position. The finance manager can explain the relationship between profit and cash balance.
4. Success or failure of Cash Planning : Cash flow statement helps
to management in making the comparison between actual and budgeted cash flow statement to know the success or failure in cash management. It also helps in taking necessary remedial
measures in cash of any deviations.
5. Projected Cash Flow : It helps to know the projected cash inflow
and cash outflow.
6. Supplemental to Fund Flow Statement : It is supplementary to
Fund flow statement for analysis of cash.
7. Tool of Analysis : It analysis is certainly a better tool of analysis
than the fund flow analysis for short term decisions.
Limitations of Cash Flow Statement :
1. Misleading of Inter – Industry Comparison : Cash flow statement
does not measure the economic efficiency of one company in relation to another company. Therefore, due to inter-industry comparison of cash flow may mislead.
2. Misleading Inter – Firm Comparison : The terms and conditions of
purchases and sales of different firms may not be the same. Hence, inter firm comparison becomes misleading.
3. Influence of Management Policies : Management policies
influence the cash easily by making certain payments in advance or by postponing certain payments.

192
4. Can not tally with Income Statement : Cash Flow Statement can
not be tally with income statement. Therefore, net cash flow does not mean income of the business.
5. Not a substitute to other statement : It can not be substitute to
other statements. For eg. Fund Flow Statement and Balance Sheet.
Fund Flow Statement :
Fund flow statement shows the sources and uses of funds as
well as net change in working capital. It is a financial statement which shows as to how a business entity has obtained its funds and how it has applied or employed its funds between the opening and closing Balance Sheet dates during the particular year or period.
Uses / advantages of Fund Flow Statement :
1. Fund flow statement helps the management in the assessment of long range forecasts of a cash requirements and availability of liquid resources. The manager can judge the quality of management
decisions.
2. With the help of Fund Flow Statement, the investors are able to measure as to how the company has utilized the funds supplied by them and its financial strength. Also, the investors can judge the
company’s capacity to generate funds from operations.
3. It serves as effective tools to the Management for economic analysis as it supplies additional information which can not be provided by financial statement based on historical data.
4. Fund flow statement explains the relationship between changes in working capital and net profits.
5. Fund flow statement helps the management in making planning process of a company. It is also useful in assessing the resources available and the manner of utilization of the resources.
6. It explains the financial consequences of business activities. It also provides explicit and clean answer to questions regarding liquid and
solvency position of the company.
7. Fund Flow Statement provides clues to the creditors and financial institutions as to the ability of a company to use funds effectively in the best interest of the investors, creditors and owners of the company.

193
Limitations of Fund Flow Statements
1. It should not be overlooked that Fund Statements ignore non- cash
transactions, therefore it is considered as cruder device than the financial statement.
2. Fund Flow Statements merely rearrange a part of the information contained in financial statements. They do not serve as original evidence of financial status.
3. Though changes in cash resources are more significant, they are not highlighted by Fund Statements except being shown by them as a part of working capital.
4. As Fund Flow Statements are prepared from information provided by financial statements, they are essentially historical in nature.
Distinction between Cash Flow Statement & Fund Flow Statement
Cash Flow Statement Fund Flow Statement
It shows net change in the position of cash and cash
equivalents
It shows change in the position of ‘working capital’.
It is based on narrower concept of funds i.e. cash and cash
equivalents.
It is based on broader concept of funds i.e. working capital.
Now, it is mandatory for all the
listed companies and is more widely used in India or abroad.
It is not mandatory and it is not
being used by the companies.
Changes in working capital are
adjusted for ascertaining cash generated from operations.
Statement of changes in working
capital is prepared under fund flow statement.
In Cash flow statement, decrease
in current liability or increase in current assets results in decrease in cash and vice – versa.
In working capital, decrease in
current liability or increase in current asset brings increase in working capital and vice – versa.
Ratio Analysis:
Financial statement gives us clear idea about the financial
position of the company. It will help the proprietor whether to continue the business or closed down or to make changes in working style of the
business. Every businessman is interested in profit margin only. Financial statement gives the clear idea of the

194
profit margin in amounting term. But with the help of ratio, we get the clear idea of comparison and with the help of ratio we are able to express the relationship between different figures.
Ratios express the relationship between two number as well as
accounting figures. It shows the process of computing and presenting the relationship between items of the financial statement.
The ratio can be expressed in 3 terms:
1. Simple or pure ratio.
2. Percentage.
3. Rate.
EXERCISE
1. Explain fund flow and cash flow.
2. Distinguish between Fund flow and Cash flow.
3. Define financial management. Briefly explain the functional areas of FM.
4. Explain the tools of Financial Management.
5. Elaborate the role of Financial Management in decision making.

195
10
RATIO ANALYSIS-I
Unit Structure:
Objectives
Introduction
Meaning
Forms
Classification
Balance Sheet Ratio
Revenue Statement Ratio
Composite Ratio
Advantages and Limitations of Ratio Analysis
Exercise
OBJECTIVES
After studying the unit the students will be able to:
Define Ratio.
Understand the classification of ratio.
Know the forms in which the ratios can be expressed.
Explain the advantages and limitations of ratio analyses.
INTRODUCTION
Financial statement gives us clear idea about the financial position of the company. It will help the proprietor whether to continue the business or closed down or to make changes in working style of the business. Every businessman is interested in profit margin only.
Financial statement gives the clear idea of the profit margin in amounting term. But with the help of ratio, we get the clear idea of comparison and with the help of ratio we are able to express the relationship between different figures.
MEANING
Ratios express the relationship between two number as well as
accounting figures. It shows the process of computing and

196
presenting the relationship between items of the financial statement. FORMS:-
The ratio can be expressed in 3 terms:
1. Simple or pure ratio.
2. Percentage.
3. Rate.
1. Simple or pure ratio -
It gives a simple relationship between two figures. We take simple example of current ratio, it means consider the relationship between current assets and current liabilities, if the current assets are Rs.4,00,000/- and current liabilities are Rs.2,00,000/-, the ratio is derived by dividing Rs.4,00,000/- by Rs.2,00,000/-, then the answer is 2 which will be expressed on 2:1.
2. Percentage -
Some ratio’s is expressed in terms of percentage. The
relationship between profit and sales is expressed in percentage. For example- If sales are Rs.10, 00,000/- and gross profit is Rs.5,00,000/- then it is expressed as gross profit being 50% of sales.
3. Rate-
Ratios are also expressed in terms of rates. i.e. number of times
or certain period. The relationship between stock is expressed in terms
of rates. For Example- If stock turn over rate is said to be 6 times in a year, it mean that the stock is converted into sales 6 times in 12 months.
CLASSIFICATION
Ratios are classified as follow:
1. Based on financial statement
2. Based on function
3. Based on user
Based on financial statement :

197
The relationship between two figures which is expressed, it is taken from financial statement i.e. profit and loss a/c, balance sheet or both. This can be grouped as follows.
I. Balance sheet ratio -
The relationship between two figures is expressed by taking
figures from balance sheet itself. There is no need to refer income statement. Actually, the relationship between the assets and liabilities is current ratio, liquid ratio, proprietary ratio capital gearing ratio, debt equity ratio, and stock-working capital ratio.
II. Income statement ratio -
The relationship between two groups is expressed from income
statement itself. Mostly, it shows the relationship between profitability and sales of the firm. For Example - gross profit ratio, operating ratio,
net profit ratio, net operating profit ratio and stock turnover ratio.
III. Combined ratios -
Under these ratio’s the relationship between two figures is
expressed by taking figures on from Balance Sheet and another from
Income Statement. It shows the relationship between the profits and investment of the firm. For e.g. Return on Capital employed, Earning Per Share, Debtors Turnover Ratio, etc.
Based on Functions :
Accounting Ratio’s can be classified on the basis of their function or according to their purpose, that is, Liquidity Ratio, Leverage Ratio, Activity Ratio, Profitability Ratio and Coverage Ratio or valuation Ratios.
I. Liquidity Ratio -
It analyse the short term and immediate financial position of the
business organization and it also indicates the relationship between current assets and current liabilities. For e.g. Current Ratio, Liquid Ratio, Quick Ratio.
II. Leverage Ratio -
It shows the relationship between debts and own funds in
financing the assets of the business. It includes debt equity ratio, capital
gearing ratio and proprietary ratio. It also helps in knowing the solvency or the company and so it is known as capital structure ratio or solvency ratio.
III. Activity Ratio -

198
This ratio shows comparison of sales with different items of income statement and Balance Sheet. It shows the utilization of funds and efficiency of business important activity ratios of stock turnover ratio, debtors turnover ratio etc.
IV. Profitability Ratio -
It makes comparison of profits with sales and assets of the
business profits include gross profit, operating net profit, profit before
tax etc. It reflects overall efficiency of business. It includes gross profit ratio, net profit ratio, return on capital employed etc.
V. Coverage Ratio -
It is the relationship between profits of the company and
amounts payable to outsider. Out of such profits in the form of dividends, interests, etc. it includes dividend payout ratio, debt ratio etc.
Based on users :
1. Ratio for shareholders –
Shareholders are interested in the safety of their funds and capital appreciation. It includes return on proprietors’ funds and return on equity capital.
2. Ratio for Short Term Creditors:
Basically, creditors are interested in knowing the firms ability to
meet short term obligation in time. This includes current ratio, liquid ratio.
3. Ratio for Management :-
The management is interested in the returns on their investment. For e.g. Return on capital employed, turnover ratio, operating ratio etc.
4. Ratios for Long Term Creditors :-
They are interested in companies ability to pay interest and
repay the debts when it is actually due. E.g. Debt Equity Ratio, Proprietary Ratio etc.

199
Classification of Ratios
Solvency
Ratio or
Credit Ratio
Leverag
e
Ratio
Activit
y
Ratio
Profitabili
ty
Ratios
Valuation
1. Proprietary Ratio
2. Capital Gearing Ratio
1. Earning
Per Share
2. Earning Yield Ratio
3. Dividend Yield
Long Term
1. Proprietary Ratio
2. Debt Equity
3. Capital Gearing
1. Stock Turnover Ratio
2. Turnover or Total Assets Ratio
3. Stock Working
Capital Ratio
4. Debtors
Turnover Ratio
5. Working Capital Turnover
6. Fixed
Assets
Turnover
Product
1. Gross Profit
2. Net Profit
3. Operating Expenses
4. Equity Share Capital
Investment
1. Return on
capital
employed
2. Return on Proprietors Fund
3. Earning Per Share 4. Dividend Per Share
CHECK YOUR PROGRESS
Draw the chart showing Classification of Ratios.
Define the following terms:

200
1. Ratio
2. Balance sheet ratio
3. Liquidity ratio

200
4. Activity ratio
5. Coverage ratio BALANCE SHEET RATIO
For making easy calculation or Ratio draw up Vertical Statement
of Balance Sheet.
Vertical Format or Balance Sheet
Particulars
Amt Amt Amt
I. SOURCES OF FUNDS
1. Equity Share Capital
2. Reserves & Surplus
Equity Shareholders (1 + 2) Funds
3. Preference Share Capital
Proprietors Fund (1 + 2 + 3)
4. Borrowed Funds
XX
XX
XX
XX
XX
XX
XX
Total Sources of Funds XXX
II. APPLICATION OF FUNDS
1. Fixed Assets
Goodwill
Plant & Machinery
Land & Building
2. Investment
3. a) Current Assets
i) Debtor
ii) Cash
iii) Bills Receivable
Quick Assets (I + ii +
iii)
iv) Closing Stock
v) Prepayment
s Total Assets
(a)
4. b) Current Liabilities
i) Creditors
ii) Bills
Payable Quick
Liabilities
iii) Bank Overdraft
iv) Other Quick Liabilities
Total Current Liabilities
(b)
X
X
X
X
X
X
XX
XX
XX
XX
XX
X
X
X
X
X
X
XX
XX
XX
XX
XX
XX
XX
XX
XX
XX

201
5. Working Capital (a - b) XX

202
Total Application of Funds / Total Capital Employed (1 + 2 + 5)
XXX
Current Ratio -
This ratio compares the current assets with the current liabilities.
It is expressed in the form of pure ratio. E.g. 2:1.
a. Current Ratio = Current Assets Current
Liabilities
b. Current assets include assets which are circulated and liquidated in
cash within one accounting period. E.g. Debtors (net), bills receivables, short term investment, inventories, loose tools etc.
c. Current Liabilities, any liability which is due to be paid within one
accounting period is a current liability. E.g. Creditors, bills payable, outstanding expenses, proposed dividend, bank overdraft etc.
d. Significance - It indicates the strength of working capital and
measures short term solvency of the business. It reflects the ability of business to pay its short term liabilities.
e. Standard - Normally, 2:1 is regarded as standard ratio which means
current assets must be nearly two times of current liabilities.
f. Limitations - It ignores the components of working capital by considering liquid assets and deferred assets as same. It also ignores the quality of working capital by including dead stock in working capital.
g. Example:
Current Assets or a company on Rs. 4,00,000 and on the same data, current liabilities are Rs. 2,00,000. Then
Current Ratio Current Assets
Current Liabilities
4,00,000
2,00,000
2 :1
Quick Ratio / Liquid Ratio / Acid Test Ratio -
Liquid ratio compares the quick assets with the quick liabilities. It
is expressed in the form of a pure ratio and it is also known as quick ratio and Acid Ratio.
a. Quick Ratio Quick Assets
Quick Liabilities

203
b. Quick Assets include all current assets minus stock and prepaid expenses.
c. Quick Liabilities includes all current liabilities minus advances
received and bank overdraft.
d. Significance - It helps to know the immediate short term liabilities and abilities of business to pay them.
e. Standard - Normally, 1:1 is the standard quick ratio which means
quick assets must be at least equal to quick liabilities.
f. Limitation- It may not indicate the long term solvency of the
business.
g. Example:
From the following information given calculate 1) Quick Assets
2) Quick Liabilities and 3) Quick Ratio.
Particulars Amt Particulars Amt
Cash 5,000 Outstanding Salaries 1,000
Debtors 10,000 Bank Overdraft 2,000
Creditors 5,000 Stock 3,000
Prepaid Expenses 2,000 Bills Payable 4,000
Bills Receivable 8,000
Solution:-
Quick Assets:-
Cash 5,000
Debtors 10,000
Bills Receivable 8,000
Total 23,000
Quick Liabilities:-
Creditors 5,000
Outstanding Salary 1,000
Bills Payable 4,000
Total 10,000
Quick Ratio Quick Assets
Quick Liabilities
23,000
10,000

204
2 : 3 : 1
Stock-Working Capital Ratio -
This ratio shows the relationship between the closing stock and
the working capital.
a. Stock Working Capital Ratio Stock
Working Capital
100
b. Stock means closing stock.
c. Working capital is equal to current assets minus current liabilities.
d. Significance - It shows the quality of working capital and the quantum of stock in it.
e. Standard - It is practically not possible to have a standard.
f. Example:
If inventory is Rs.80,000/- & Working Capital Rs.1,20,000/- the
stock to Working Capital Ratio would be
Stock
Working Capital
100
80,000
1,20,000
100
Stock working capital ratio 67%
Proprietary Ratio / Net Worth Ratio / Assets Backing Ratio-
It compares proprietor’s funds with total liabilities or total assets.
It is expressed in terms of percentage.
a. Proprietory Ratio Proprietors Funds
100 Total
Assets
b. Proprietors funds, includes paid up preference share capital, paid up Equity Share Capital, Capital Reserve, Revenue Reserve, Security Reserve , Profit & Loss Account minus Accumulated losses and fictitious assets.
c. Total Assets includes Fixed Assets, investments and current assets.
d. Significance - It determines to what extent total assets are financed
by proprietors. It also compares proprietors funds with total assets and total liabilities. It also indicated as Total Assets = Total Liabilities, Total Liabilities = Proprietors Funds + Loans +
Current Liabilities.

205
e. Standard - It should be very high or very low. Normally, it should be guided as 65%-75% considered. But, it differs from business to business.
f. Example: Proprietary Ratio -
From the following information calculate proprietary Ratio or S Ltd.
Particulars Amt
Equity share capital 1,50,000
Preference share capital 50,000
Reserves 30,000
Proprietors funds 2,30,000
Current Assets 1,00,000
Fixed Assets 2,50,000
Total Assets 3,50,000
Proprietory Ratio Proprietors Fund
100 Total Assets
23,000
100
35,000
66%
Debt Equity Ratio -
This ratio compares the long term debts with shareholders’ funds. It is usually expressed as a pure ratio.
a. Debt Equity Ratio Debt
Equity
OR
Loan Funds
Owned Funds
b. Debt includes borrowed funds as secured / Unsecured loans
including debentures, interest accrues and due on loans.
c. Proprietors funds includes paid up share capital, Reserves and surplus minus fictitious assets and accumulated losses.
d. Significance - This is a solvency ratio and it also indicated the proportion of debt and equity in financing the funds of the concerns.
It also shows protection cover for long term creditors. The low debt equity ratio is considered as favourable to creditors. It indicates, low ratio means less dependence on long term debts.

206
e. Standard - If debts equity ratio is two third then it is considered as satisfactory ratio. It implies that out of three total funds debts would be 2 and Equity would be 1.
f. Example: Debt Equity Ratio -
From the following information calculate Debt - Equity Ratio or P Ltd.
Particulars
Amt
5 % Debentures
7 % Preference share Capital
Equity Capital
4,00,000
2,00,000
3,00,000
Debt Equity Ratio Borrowed funds
Funds
4,00,000
5,00,000
0.8
Capital Gearing Ratio / Financing Leverage Ratio / Capital Structure Ratio -
Gearing means the process of increasing the equity
shareholders’ return through the use of debt. Equity shareholders earn more when the rate or return on total capital is more than the rate of interest on debts.
a. Capital Gearing Ratio
Capital Bearing Fixed Rate
of Interest & Dividend
Capital Not Bearing Fixed Rate
of Interest & Dividend.
b. Capital bearing fixed rate of interest and dividend includes Preference share capital, debentures, loans etc.
c. Capital not bearing fixed rate of interest and dividend includes equity share capital, reserves and surplus, fictitious assets and accumulated losses.
d. Significance - It shows balance between debt and equity and it also
shows whether a company is practicing trading on equity.
e. Example: Capital Gearing Ratio-

207
The following are the relevant extract from Balance sheet or ABC Ltd as on 31st Dec, 2003. Calculate the capital gearing ratio.
Liabilities Amt
8,000 Equity share or Rs.10/- each Fully Paid 80,000
9% Preference Shares or Rs.100/- cash fully paid 1,50,000
Security (share) Premium 10,000
Capital Reserve 16,000
10% Debentures 50,000
Capital Gearing Ratio Capital entitled to fixedInterest / Dividend
Capital not entitled to fixedInterest / Dividend
OR
= Preference Capital Debentures
Equity Capital Share Premium Capital Reserve
1,50,000 50,000
80,000 10,000 16,000
2,00,000
1,06,000
1.89
REVENUE STATEMENT RATIO
Format of Revenue statement
Profit & Loss A/c.
Vertical Income / Revenue Statement
Particulars
Amt Amt Amt
Credit Sales
Cash Sales
Total Sales
Opening Stock
Credit
Purchases Cash
Purchases Total
Purchases
Direct Expenses
(-) Closing Stock
Cost of Good Sold
Gross Profit
XX
XX
X
X
X
X
XX
XX
XX
(XX
)
XX
(XX)
XX

208
Operating Exp
Administrative Exp
Selling Expenses
Finance Exp (Excl. Interest)
Operating Profit
(+) Non Operating Income (-) Non Operating Exp
Profit Before Interest &
Tax (-) Interest on loans
Net Profit Before
Tax (-) Income Tax
Net Profit after Tax
(-) Preference Dividend
Profit available for Equity
Shareholders (-) Equity Dividend
X
X
X
X
X
X
(XX)
XX
XX
XX
(XX)
XX
(XX)
XX
(XX)
XX
(XX)
XX
(XX)
Retained Earnings XX
Gross Profit Ratio -
This ratio compares gross profit with net sales.
a. Gross Pr ofit Ratio Gross Pr ofit
100 Net Sales
b. Gross Profit = Sales minus Cost of Goods Sold
(Cost of Goods Sold = Opening Stock + Purchases + Direct
Expense - Closing Stock)
c. Net Sales = Sales minus Sales Returns minus Allowances.
d. Significance - It indicates basic profitability of business concern, it also indicate the efficiency of the purchase department, production department and the sales department. It shows the percentage of mark up on the goods sold.
e. Example: Gross Profit Ratio -
Net Sales Rs. 5,00,000
(-) Cost of Goods Sold Rs. 4,20,000
Gross Profit 80,000

209
Calculate Gross Profit Ratio.
Gross Pr ofit Ratio Gross Pr ofit
100 Sales
80,000
5,00,000
100
16%
Operating Ratio -
It expresses the relationship between total operating costs and
net sales.
a) Operating Ratio Operating Cost
100 Net
Sales
= cos t of goods sold Operating Expenses
100
Net Sales
b) It expresses the relationship between each item of expenditure with
sales. It brings out the relationship between elements of operating cost and net sales.
c) Significance - This enables the management in controlling cost and improving profit ability as well as the auditor and income tax
department to judge the correctness and reliability of various expenses.
d) Limitations - If expenses of fixed amount the ratio of expenses to sales may be increased or decreased in value. The ratio of variable expenses may remain same even though sales are increased.
e) Example: Operating Ratio -
Calculate operating ratio from the following information.
Sales Rs. 20,00,000
Gross Profit Rs. 7,00,000
Operating Expenses Rs. 5,00,000
Cost of goods sold = Sales less Gross Profit
1,30,000 = 20,00,000 - 7,00,000
Operating Ratio Cost of Goods Sold Operating expenses
100
Net Sales
13,00,000 5,00,000
100
20,00,000
90%

210
Calculate various expenses ratios and operating ratio from the
following information.
i) Cost of goods sold Rs. 40,000
ii) Office & Administrative expenses Rs. 20,000
iii) Selling & distribution Expenses Rs. 15,000
iv) Sales Rs. 1,00,000
i) Cost of goods sold Ratio = cost of goods sold
100 Sales
= 40,000
100
10,000
= 40%
ii) Office & administrative Expenses Ratio
= Office & Administrative Expenses
100
Sales
= 20,000
1,00,000
= 20%
100
iii) Selling & distribution Expenses Ratio
= Selling & distribution Expenses
100
Sales
= 15,000
1,00,000
= 15%
100
iv) Operating Ratio =
Cost of goods sold Operating Exp 100
Net Sales
= 40,000 20,000 15,000
100
1,00,000
= 75%
Net Profit Ratio -
Net profit ratio indicates the relationship between net profit and
the sales. It is usually expressed in the form of a percentage.
a) It is calculated in three ways.

210
i. Net Operating Pr ofit Ratio Net Operating Pr ofit
100 Net Sales
ii. Net Pr ofit Ratio Net Pr ofit before tax
100 Net Sales
iii. Net Pr ofit Ratio Net Pr ofit after tax
Net Sales
100
b) Net Profit before tax = Operating Net profit + Non operating income -
Non operating expenses.
Net profit after tax = Net profit before tax - income tax
c) Net Sales = Gross sales minus Returns minus allowances
d) Significance - It indicates overall profitability of business organization, it also indicates as to what portion of net profit is available to the proprietors.
e) Limitations - It cannot be used as a text Net profit Ratio without considering other revenue statement ratio. It may be also affected by non operating income of expenses, income from extra ordinary transaction. In such cases, Net profit ratio may be showing higher
or lower volume even though sales and other cost may be showing the same tendency as before and hence net profit Ratio is isolation cannot provide clear idea about the company’s profitability.
f) Example: Net Profit Ratio -
Calculate Net Profit Ratio from the following :
Operating Net Profit Rs.1,50,000 Non
Operating Income Rs.25,000
Non Operating Expenses Rs.20,000
Net Sales Rs.10,00,000
Net Profit Ratio Net Profit before Tax
100 Sales
NPBT = Operating Net Profit + Non Operating Income - Non Operating
Expenses
= 1,50,000 + 25,000 - 20,000
= 1,55,000
NP Ratio 1,55,000
10,00,000
100
15.5%

211
Stock Turnover Ratio / Stock velocity Ratio / inventory
Turnover Ratio -
Stock turnover ratio shows the relationship between the cost of
goods sold and the average stock.
a) Stock turnover Ratio
cos t of goods sold Average
stock
OR
Net Sales Average stock at selling price
b) Cost of goods sold = Opening stock + Purchases + Direct expenses - closing stock
c) Average stock
Opening stock closing Stock
2
d) Significance - Stock turnover ratio helps in determining the frequency of inventory replacement. It also helps in determining the liquidity of business organization.
e) Limitations - It should be studied along with current ratio stock working capital ratio. Stock being differed from current assets,
current ratio may be satisfactory due to large stock, but it may suffer bud quick ratio.
f) Example: Stock Turnover Ratio -
If cost of sales is Rs.25,00,000/- and opening stock
Rs.3,00,000/- and closing stock Rs.2,00,000/-. Calculate Stock Turnover Ratio.
Average Stock Opening Stock Closing Stock
2
3,00,000 2,00,000
2
2,50,000
Stock Turnover Ratio Cost of Sales
Average Stock
25,00,000
2,50,000
10 times

212
Operating Profit Ratio -
Operating profit ratio indicates the relationship between Operating profit and Sales.
a) Operating Pr ofit Ratio Operating Pr ofit
100 Net Sales
b) Operating profit = Gross profit minus operating expenses,
Operating expenses =
1 Office and administrative expenses
2 Selling a distribution expenses
3 Finance expenses excluding interest on loans and
Debentures.
c) Net Sales = Sales less Returns less Allowances.
d) Significance - It is a profitability ratio, which shows the relationship
between profits and sales, it also indicates profits from operations.
e) Example: Operating Profit Ratio -
Calculate operating net profit ratio from the following data.
Gross Profit Rs.4,00,000
Office Expenses Rs.1,50,000
Selling Expenses Rs.1,00,000
Sales Rs.10,00,000
Operating Net Profit = Gross Profit less Selling Expenses less
Office Expenses
1,50,000 = 4,00,000 - 1,00,000 - 1,50,000
Operating Net Pr ofit Ratio Operating Net Pr ofit
100 Net Sales
1,50,000
10,00,000
100
15%
COMPOSITE RATIO
Return on capital employed -
This ratio measures the relationship between net profit (before
interest & tax) and the capital employed to earn it. It is expressed as a percentage.

213
Net profit before
a) Re turn on capital employed int erest, Tax,dividend
100 Capital employed
b) Net Profit before interest, tax and dividend
c) Capital Employed = Proprietors fund + Long Term Loans
OR
Fixed Assets + Current Assets - current liabilities.
d) Significance - It gives clear index or utilization of assets earning capacity. This ratio measures the overall profitability from the total funds employed. It means, measures the relationship between net profit before interest, tax and capital employed to earn net profit.
e) Limitations - This ratio is based on earning and capital employed of the business. These components are subject to various manipulations by management or based on various different
accounting policies.
f) Example: Return On Capital Employed -
Calculate return on capital employed from the following data.
Net Profit Rs. 2,00,000
Capital Employed Rs. 20,00,000
Re turn on Capital Employed Net Pr ofit
Capital Employed 100
2,00,000
20,00,000
100
10%
1.7.2 Return on proprietors fund / Return on proprietors Equity -
It measures the relationship between profits available to proprietor funds.
a) Re turn on proprietors fund Net profit after Tax
100 proprietors fund
b) Net profit after Tax
c) Proprietors funds includes paid up Preference share capital, paid up equity share capital, capital Reserve, Revenue Reserve, Security Reserve, Profit and Loss A/C surplus minus Accumulated losses
and fictitious Assets.

214
d) Significance - Higher ratio signifies better utilization of funds. It also measures the overall performance of a business in regards utilization of total resources available.
e) Example: Return on Proprietors fund-
The following is the relevant extract from the Profit & Loss A/c & Balance Sheet of SR Ltd. as on 31. 03. 2004
Profit & Loss A/c, for the year ended 31. 03. 04
Dr. Cr.
Particulars Amt Particulars Amt
To Administrative Exp. 80,000 By Gross Profit b/d 2,00,000
To Selling Expenses 30,000
To Provision for Tax 20,000
To Net Profit c/d 70,000
2,00,000 2,00,000
Balance Sheet as on 31. 03. 2004
Particulars
Amt Amt
Share Capital
600, 7% Preference Shares of Rs.100/- each fully paid
1,500, Equity Shares of Rs.100/- each
fully paid
Reserves
General Reserve
Capital Redemption Reserve
Dividend Equalisation Fund
60,000
1,50,000
2,10,000
90,000
40,000
30,000
20,000
3,00,000
Re turn on Pr oprietors Fund Net Pr ofit
Pr oprietors Fund
100
70,000
3,00,000 100
23.3%

215
Return on Equity Share Capital –
It indicates the rate of earning on equity share capital.
a) Return on Equity =
Net Profit after Tax – Preference Dividend 100
Share Capital Equity Share Capital
b) Net Profit after Tax minus Preference dividend.
c) Equity Share Capital includes paid up equity share capital.
d) Significance - It includes an investor in shares of company whether continue to hold or dispose off such shares. It also enables investors to compare earnings of the company with that another company. Higher ratio signifies better utilization of shareholders fund and higher return on equity share capital.
e) Example: Return on Equity Share Capital -
From the following information calculate Return on Equity Capital Ratio.
Net Profit after Tax 3,25,000
7% Preference share capital 1,50,000
Paid up Equity share capital 10,00,000
Re turn on Equity Capital Net Pr ofit less Pr eference dividend
100
Paidup Equity Capital
3,25,000 – (7% of 1,50,000)
100
10,00,000
3,25,000 – 10,500
100
10,00,000
3,14,500
10,00,000
100
31.45%
Earning Per Share -
It shows earning per equity share, whether or not company
declares dividend.
a) Earning per share Net Pr ofit after Tax – Pr eference Dividend
Number of Equity Shares
b) Net profit after Tax minus Preference dividend.
c) Number of equity shares outstanding.
d) Significance - Higher ratio signifies better utilization of funds
available and the company may pay dividend at a higher rate in future. Higher ratio indicates higher overall profitability and effective utilization of equity capital.
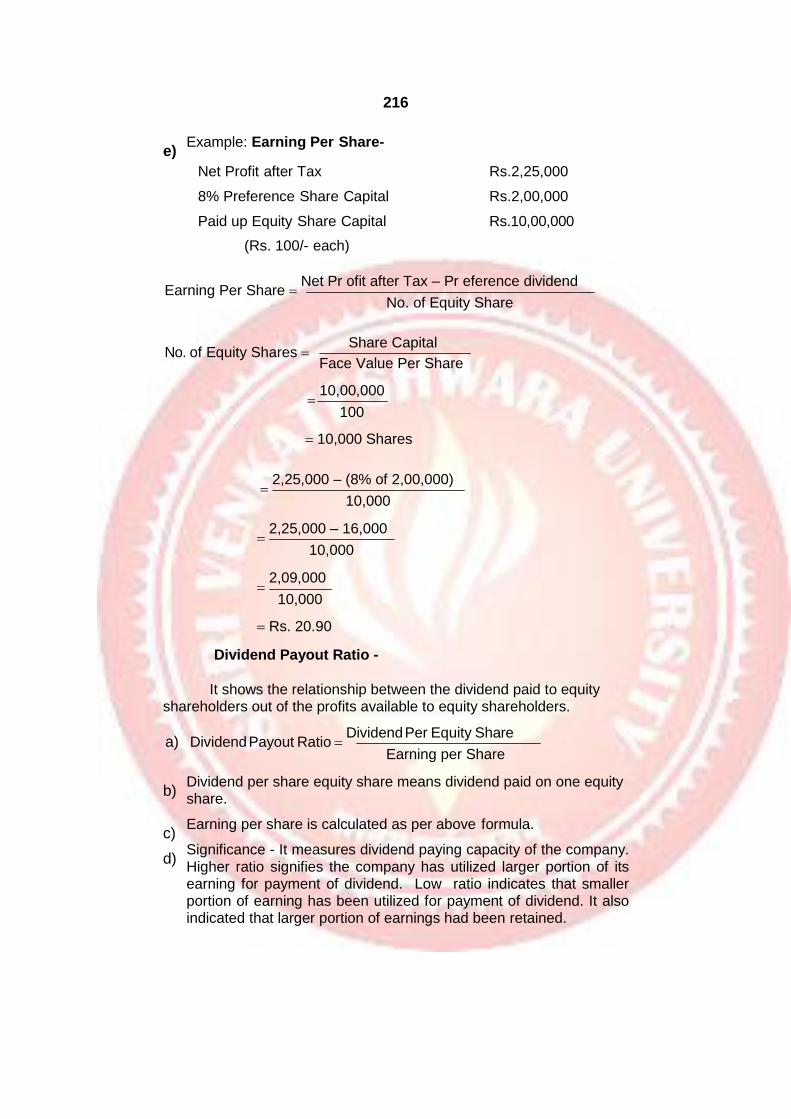
216
e) Example: Earning Per Share-
Net Profit after Tax Rs.2,25,000
8% Preference Share Capital Rs.2,00,000
Paid up Equity Share Capital Rs.10,00,000
(Rs. 100/- each)
Earning Per Share Net Pr ofit after Tax – Pr eference dividend
No. of Equity Share
No. of Equity Shares Share Capital
Face Value Per Share
10,00,000
100
10,000 Shares
2,25,000 – (8% of 2,00,000)
10,000
2,25,000 – 16,000
10,000
2,09,000
10,000
Rs. 20.90
Dividend Payout Ratio -
It shows the relationship between the dividend paid to equity
shareholders out of the profits available to equity shareholders.
a) Dividend Payout Ratio Dividend Per Equity Share
Earning per Share
b) Dividend per share equity share means dividend paid on one equity share.
c) Earning per share is calculated as per above formula.
d) Significance - It measures dividend paying capacity of the company.
Higher ratio signifies the company has utilized larger portion of its earning for payment of dividend. Low ratio indicates that smaller portion of earning has been utilized for payment of dividend. It also indicated that larger portion of earnings had been retained.

217
e) Example: Dividend Payout Ratio -
Net Profit after Tax Rs. 3,25,000
7% Preference Share Capital Rs. 2,00,000 Paid
up Equity share
Capital of Rs. 10 per share Rs. 10,00,000
Equity Dividend @ Rs. 1 per share
Dividend Payout Ratio Dividend to Equity Shareholders
Pr ofit available to Equity shareholders
100
10,00,000
3,25,000 – 14,000
10,00,000
100
100
3,25,000 (7% of 2,00,000)
10,00,000
100
3,11,000
32.15%
Dividend Yield Ratio -
It shows the relationship between dividend per share earned by
shareholder on market price of each share.
a) Dividend Yield Ratio Dividend Per Share
Market Pr ice per share
b) Dividend per share is derived by dividing Total Dividend payout to Number of Shares.
c) Market price per share is the quotation price in the stock market.
d) Significance - This ratio indicates the ultimate current return which
investors will get as a percentage on its current market value of shares. It also indicates dividend policy of the company.
e) Example: Dividend Yield Ratio -
Dividend per Share Rs.10
Market Price per Share Rs.100
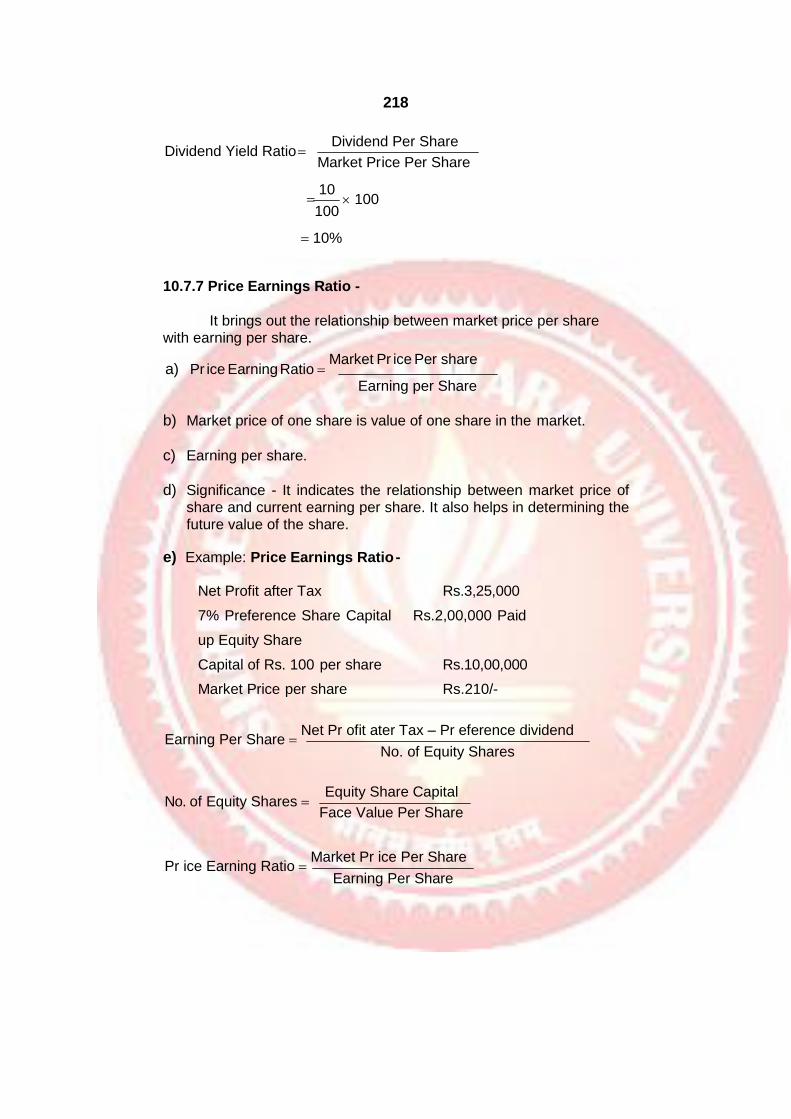
218
Dividend Yield Ratio Dividend Per Share
Market Pr ice Per Share
10
100 100
10%
10.7.7 Price Earnings Ratio -
It brings out the relationship between market price per share
with earning per share.
a) Pr ice Earning Ratio Market Pr ice Per share
Earning per Share
b) Market price of one share is value of one share in the market.
c) Earning per share.
d) Significance - It indicates the relationship between market price of share and current earning per share. It also helps in determining the future value of the share.
e) Example: Price Earnings Ratio -
Net Profit after Tax Rs.3,25,000
7% Preference Share Capital Rs.2,00,000 Paid
up Equity Share
Capital of Rs. 100 per share Rs.10,00,000
Market Price per share Rs.210/-
Earning Per Share Net Pr ofit ater Tax – Pr eference dividend
No. of Equity Shares
No. of Equity Shares Equity Share Capital
Face Value Per Share
Pr ice Earning Ratio Market Pr ice Per Share
Earning Per Share

219
No. of Equity Shares 10,00,000
10,000 Shares 100
EPS 3,25,000 – 14,000
31.10
10,000
PER 210
31.10
6.75
Fixed Assets Turnover Ratio –
It indicates the frequency of fixed assets utilization.
a) Fixed Assets Turnover Ratio Net Assets
Fixed Assets
b) Net Sales = Gross Sales minus Sales Return minus Allowances.
c) Fixed Assets includes assets acquired for long term use in the business and not for sale in ordinary course of business. For e.g. Goodwill, Land & Building, Plant & Machinery, Vehicles etc.
d) Significance - It indicates efficiency in or extend of utilization of fixed assets. Higher ratio indicates high degree of efficiency in utilization and low degree signifies vice-versa.
e) Example: Fixed Assets Turnover Ratio -
If sales are Rs.10,00,000/- and Fixed Assets are
Rs.3,00,000/- calculate Fixed Assets.
Turnover Ratio Net Sales
1,00,000 3.33
Fixed Assets 3,00,000
Total Assets Turnover Ratio -
It shows the relationship between net sales and total assets.
a) Total Assets Turnover Ratio Net Sales
Total Assets
b) Net Sales = Gross sales minus Returns minus Allowances.
c) Total Fixed Assets = Fixed Assets + Investment + Current Assets
but excluding fictitious assets.
d) Significance - It indicates how efficiency assets are employed overall.

220
e) Example: Total Assets Turnover Ratio -
Total Assets = Fixed Assets + Current Assets 5,00,000 = 3,00,000 + 2,00,000
Turnover Rs.10,00,000/- Total
Assets Turnover Ratio
Net Sales
Total Assets
10,00,000
5,00,000
20
Debt Service Ratio / Interest Coverage Ratio -
This ratio shows the relationship between earning before interest
and interest on long term loans. The main purpose of this ratio is to find out the number of times the fixed interest charges are covered by the
income before interest and tax.
a) Debt Service Ratio Net Pr ofit before Interest & Tax
Fixed Interest Charges
b) Profit before interest & tax means the amount of net profit before interest and tax. Interest means the interest payable on loans.
c) Fixed interest charges mean interest on long term loans.
d) Significance - Its main purposed is to measure the interest paying capacity of the company.
e) Example: Debt Service Ratio -
Find out the Debt Service Ratio from the following details
a) Profit before interest and tax Rs.1,00,000/-
b) Interest payable Rs.25,000/-
Debt Service Ratio Profit before Interest & Tax
Interest
1,00,000
25,000
4

221
Debt Service Coverage Ratio -
It shows the relationship between net profits and interest plus installments payable on loans. It is expressed as a pure number.
a) Debt Service Coverage Ratio
Cash Pr ofits available for
debt servicing
Interest Installment due
on loans
b) Cash profits available for debt servicing are calculated as follows:
i) Net Profit after interest and Tax
ii) (+) Non cash debits to Profit & Loss A/c
(E.g. Depreciation, goodwill w/off, loss on sales of Fixed Assets
etc)
iii) Cash Profits for debt servicing.
c) Interest means interest on long term loans during the year.
Installment means installments due on long term loans during
the year.
d) Significance - This ratio indicates the company’s ability to pay interest and principal amount on time as it indicates whether company is able to pay interest and repayment of loan out of earnings of the company. It is more useful for lender as it takes care of total repayment liability.
e) Example: Debt Service Coverage Ratio
Find out the Debt Service Coverage Ratio from the following
details.
1) Profit after interest and tax Rs.2,50,000/-
2) Interest Payable Rs.25,000/-
3) Depreciation Rs.15,000/-
4) Loan installment payable during the year Rs.1,45,000/-.
Debt Equity Ratio Net Pr ofit before Interest & Tax
Fixed Interest Charges
2,50,000 15,000 25,000
25,000 1,45,000
1.70
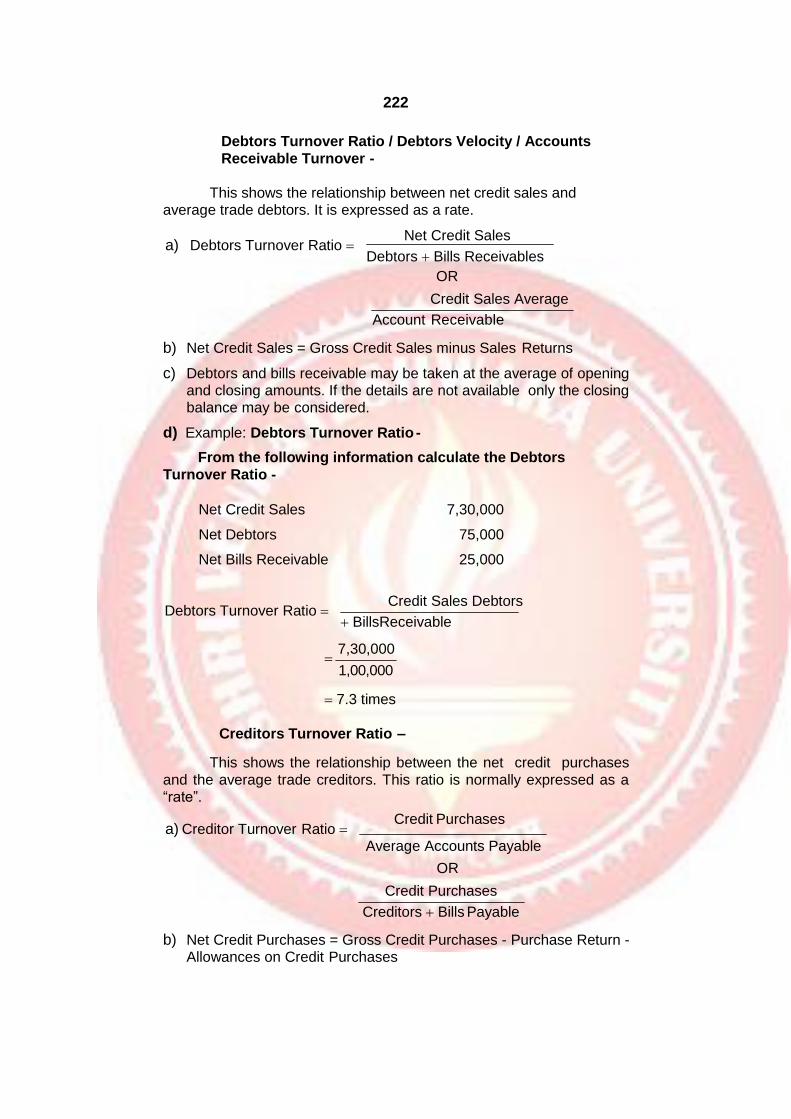
222
Debtors Turnover Ratio / Debtors Velocity / Accounts
Receivable Turnover -
This shows the relationship between net credit sales and
average trade debtors. It is expressed as a rate.
a) Debtors Turnover Ratio Net Credit Sales
Debtors Bills Receivables
OR
Credit Sales Average
Account Receivable
b) Net Credit Sales = Gross Credit Sales minus Sales Returns
c) Debtors and bills receivable may be taken at the average of opening and closing amounts. If the details are not available only the closing balance may be considered.
d) Example: Debtors Turnover Ratio -
From the following information calculate the Debtors
Turnover Ratio -
Net Credit Sales 7,30,000
Net Debtors 75,000
Net Bills Receivable 25,000
Debtors Turnover Ratio Credit Sales Debtors
BillsReceivable
7,30,000
1,00,000
7.3 times
Creditors Turnover Ratio –
This shows the relationship between the net credit purchases
and the average trade creditors. This ratio is normally expressed as a “rate”.
a) Creditor Turnover Ratio Credit Purchases
Average Accounts Payable
OR
Credit Purchases
Creditors Bills Payable
b) Net Credit Purchases = Gross Credit Purchases - Purchase Return - Allowances on Credit Purchases

223
c) Creditors and bills payable may be taken at the average of the opening and closing amount. If the details are not available, only the closing balance may be considered.
d) Example: Credit turnover ratio.
From the following information calculate the credit turnover ratio.
Net Credit Purchases Rs. 1,00,000
Creditors Rs. 20,000
Bills Payable Rs. 5,000
Creditor Turnover
Credit Purchases
Creditors BillsPayable
1,00,000
20,000 5,000
1,00,000
25,000
4 times
Debt Collection Period –
This ratio gives average debt collection period and indicates the extend to each the debts have being collected in time.
a) Debt Collection Period Number of days or months in a year
Debtors Turnover Ratio
b) Significance - It indicates credit and collection policy and it also
indicates effectiveness of collection from debtors.
c) Example: Debt Collection Period -
Debt collection period is calculated from above illustration of the
point 10.7.12
Debt Collection Period 365
Debtors Turnover Ratio
365
7.33
50 days.
10.7.15 Creditors Payout Ratio -
This shows the relationship between Number of days or months
in a year with the promptness in payment of credit purchases.

224
a) Creditor Payout Ratio No. of day sin a year
Creditor Turnover Ratio
b) Significance - It should be compared with actual credit available
from suppliers and whether the company is taking full benefit of the credit period allowed by creditors.
c) Example: Credit Collection Period -
It is calculated from above illustration No. 10.7.13
Credit Collection Period 365
Creditors Turnover Ratio
365
4
12
91days or 3 months. 4
ADVANTAGES AND LIMITATIONS OF RATIO ANALYSIS
Advantages of Ratios Analysis:
Ratio analysis is an important and age-old technique of financial
analysis. The following are some of the advantages / Benefits of ratio analysis:
1. Simplifies financial statements: It simplifies the
comprehension of financial statements. Ratios tell the whole story of changes in the financial condition of the business
2. Facilitates inter-firm comparison: It provides data for inter-
firm comparison. Ratios highlight the factors associated with with successful and unsuccessful firm. They also reveal strong firms and weak firms, overvalued and undervalued firms.
3. Helps in planning: It helps in planning and forecasting. Ratios
can assist management, in its basic functions of forecasting. Planning, co-ordination, control and communications.
4. Makes inter-firm comparison possible: Ratios analysis also
makes possible comparison of the performance of different divisions of the firm. The ratios are helpful in deciding about their efficiency or otherwise in the past and likely performance in the future.
225
5. Help in investment decisions: It helps in investment decisions
in the case of investors and lending decisions in the case of bankers etc.
Limitations of Ratios Analysis:
The ratios analysis is one of the most powerful tools of financial
management. Though ratios are simple to calculate and easy to understand, they suffer from serious limitations.
1. Limitations of financial statements: Ratios are based only on the
information which has been recorded in the financial statements. Financial statements themselves are subject to several limitations. Thus ratios derived, there from, are also subject to those limitations.
For example, non-financial changes though important for the business are not relevant by the financial statements. Financial statements are affected to a very great extent by accounting conventions and concepts. Personal judgment plays a great part in determining the figures for financial statements.
2. Comparative study required: Ratios are useful in judging the
efficiency of the business only when they are compared with past results of the business. However, such a comparison only provide glimpse of the past performance and forecasts for future may not prove correct since several other factors like market conditions, management policies, etc. may affect the future operations.
3. Ratios alone are not adequate: Ratios are only indicators, they cannot be taken as final regarding good or bad financial position of
the business. Other things have also to be seen.
4. Problems of price level changes: A change in price level can
affect the validity of ratios calculated for different time periods. In such a case the ratio analysis may not clearly indicate the trend in solvency and profitability of the company. The financial statements, therefore, be adjusted keeping in view the price level changes if a
meaningful comparison is to be made through accounting ratios.
5. Lack of adequate standard: No fixed standard can be laid down for ideal ratios. There are no well accepted standards or rule of thumb for all ratios which can be accepted as norm. It renders interpretation of the ratios difficult.
6. Limited use of single ratios: A single ratio, usually, does not
convey much of a sense. To make a better interpretation, a number of ratios have to be calculated which is likely to confuse the analyst than help him in making any good decision.

226
7. Personal bias: Ratios are only means of financial analysis and not
an end in itself. Ratios have to interpreted and different people may interpret the same ratio in different way.
8. Incomparable: Not only industries differ in their nature, but also the
firms of the similar business widely differ in their size and accounting procedures etc. It makes comparison of ratios difficult and misleading.
EXERCISE
1. Explain the advantages and limitations of ratio analyses.
2. Briefly explain the classification of Ratios.
3. Give significance of Following Ratios:
Proprietors ratio
Debt Equity ratio
Gross profit ratio
Stock turnover ratio
Earnings per share
Creditors payout ratio
4. Give formula of the ratio:
Current Assets
Quick liabilities
Proprietors fund
Capital gearing ratio
Net profit before tax
Capital employed
Total Assets

227
11
RATIO ANALYSES-II
Unit Structure:
Objectives
Solved Problems Exercise
OBJECTIVES
After studying the unit the students will be able to solve the
practical problems on Ratio analyses.
SOLVED PROBLEMS
The following are summarized Profit and Loss Account for the year ending 31st March, 2005 and the Balance Sheet as on that date of
A Ltd.
Profit & Loss Account
Dr. Cr.
Particulars Rs. Particulars Rs.
To Opening Stock 10,000 By Sales 1,00,000
To Purchases 55,000 By Closing Stock 15,000
To Gross Profit 50,000
1,15,000 1,15,000
To Administrative By Gross Profit 50,000
Expenses 15,000
To Interest 3,000
To Selling Expenses 12,000
To Net Profit 20,000
50,000 50,000

228
Balance Sheet
Liabilities Rs. Assets Rs.
Share Capital 1,00,000 Land & Building 50,000
(Rs.10/- each) Plant & Machinery 30,000
Profit & Loss Account 20,000 Stock 15,000
Creditors 25,000 Debtors 15,000
Bills Payable 15,000 Bills Receivable 12,500
Cash & Bank 17,500
Furniture 20,000
1,60,000 1,60,000
Average Debtors Rs.12,500/-
Credit Purchases Rs.40,000/-
Credit Sales Rs.80,000/-
Calculate –
(i) Stock Turnover Ratio (ii) Debtors turnover ratio,
(iii) Creditors turnover ratio, (iv) Working Capital turnover ratio,
(v) Sales to Capital employed,(vi) Return on shareholders funds,
(vii) Gross Profit Ratio, (viii) Net Profit ratio,
(ix) EPS, (x) Operating ratio.
Solution :
i) Stock turnover ratio = Cost of goods sold
AverageStock
= 50,000 [Sales – G.P.]
10,000 + 15,000 / 2
= 50,000
12,500
= 4 times
ii) Debtors turnover ratio = Credit Sales
Average Debtors
= 80,000
12,500

229
= 6.4 times
iii) Creditors turnover ratio = Credit Purchases
Average Accounts Payable
= 40,000
40,000 [Crs + B.P.]
= 1 time
Sales
iv) Sales to Capital employed = (working Capital) [Current Assets – Current Liabilities]
= 1,00,000
20,000
= 5 times
v) Sales to Capital Employed = Sales
Capital employed
1,00,000 = 1,00,000 + 20,000
100
Equity P&L A/c
= 1,00,000
1, 20,000
= 83 : 1
vi) Returns on Shareholders funds = Net Profit
Shareholders funds
100
= 20,000
1, 20,000
= 16.67 %
100
vii) Gross Profit Ratio = Gross Profit
100 Sales
= 50,000
1,00,000
= 50 %
100
viii) Net Profit Ratio = Net Profit
100 Sales
= 20,000
1,00,000
100

230
= 20 %
ix) EPS =
Net Profit
No. of Equity Shares
= 20,000
10,000
= Rs.2/-
x) Operating ratio =
=
Cost of Good Sold + Operation
Expenses Sales
50,000 + 27,000 100
1,00,000
= 77 % From the following information, you are required to prepare a
Balance Sheet.
Particulars Rs.
Working Capital 75,000
Reserves and Surplus 1,00,000
Bank Overdraft 60,000
Current Ratio 1.75
Liquid Ratio 1.75
Fixed assets to proprietors’ Funds .75
Long-term liabilities Nil
Solution : Balance Sheet
Liabilities Rs. Assets Rs.
Share capital 2,00,000 Fixed Assets 2,25,000
Reserves & Surplus 1,00,000 Stock 60,000
Bank Overdraft 60,000 Debtors and Cash 1,15,000
Creditors 40,000
4,00,000 4,00,000
Workings :
1. Current Assets
Current Ratio = 1.75
Working Capital should be = .75
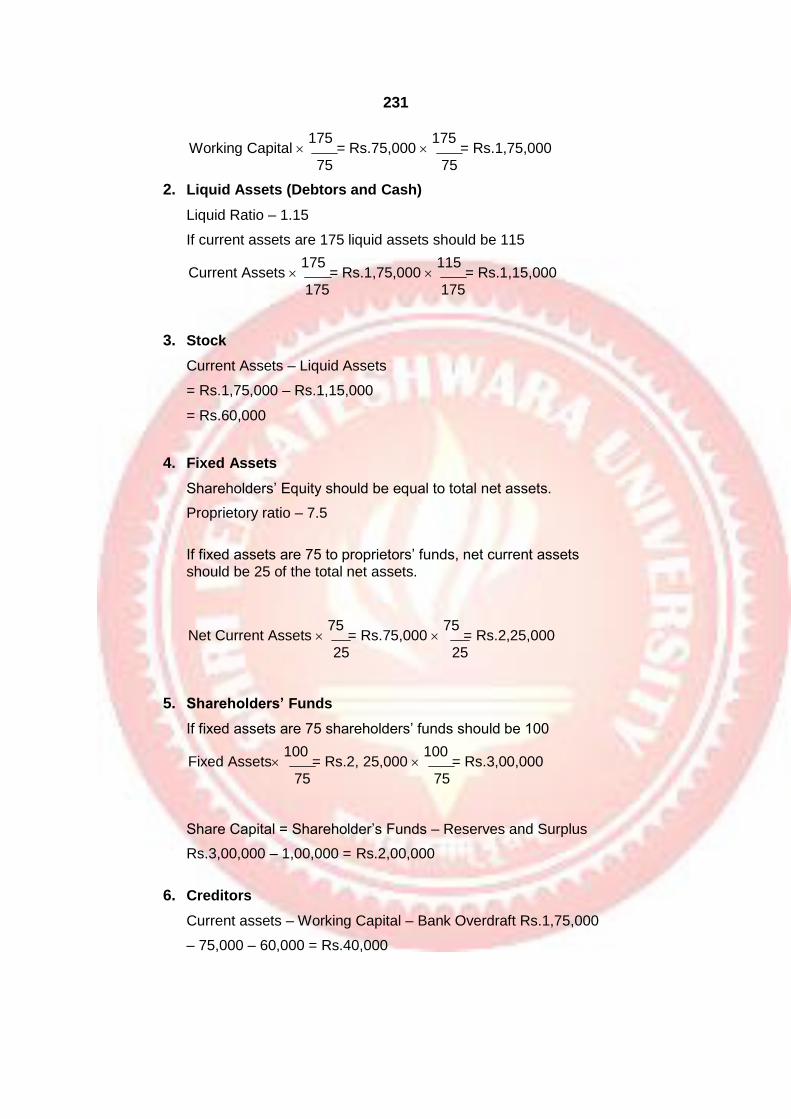
231
Working Capital 175
= Rs.75,000 175
= Rs.1,75,000 75 75
2. Liquid Assets (Debtors and Cash)
Liquid Ratio – 1.15
If current assets are 175 liquid assets should be 115
Current Assets 175
= Rs.1,75,000 115
= Rs.1,15,000 175 175
3. Stock
Current Assets – Liquid Assets
= Rs.1,75,000 – Rs.1,15,000
= Rs.60,000
4. Fixed Assets
Shareholders’ Equity should be equal to total net assets.
Proprietory ratio – 7.5
If fixed assets are 75 to proprietors’ funds, net current assets should be 25 of the total net assets.
Net Current Assets 75
= Rs.75,000 75
= Rs.2,25,000 25 25
5. Shareholders’ Funds
If fixed assets are 75 shareholders’ funds should be 100
Fixed Assets 100
= Rs.2, 25,000 100
= Rs.3,00,000 75 75
Share Capital = Shareholder’s Funds – Reserves and Surplus
Rs.3,00,000 – 1,00,000 = Rs.2,00,000
6. Creditors
Current assets – Working Capital – Bank Overdraft Rs.1,75,000
– 75,000 – 60,000 = Rs.40,000
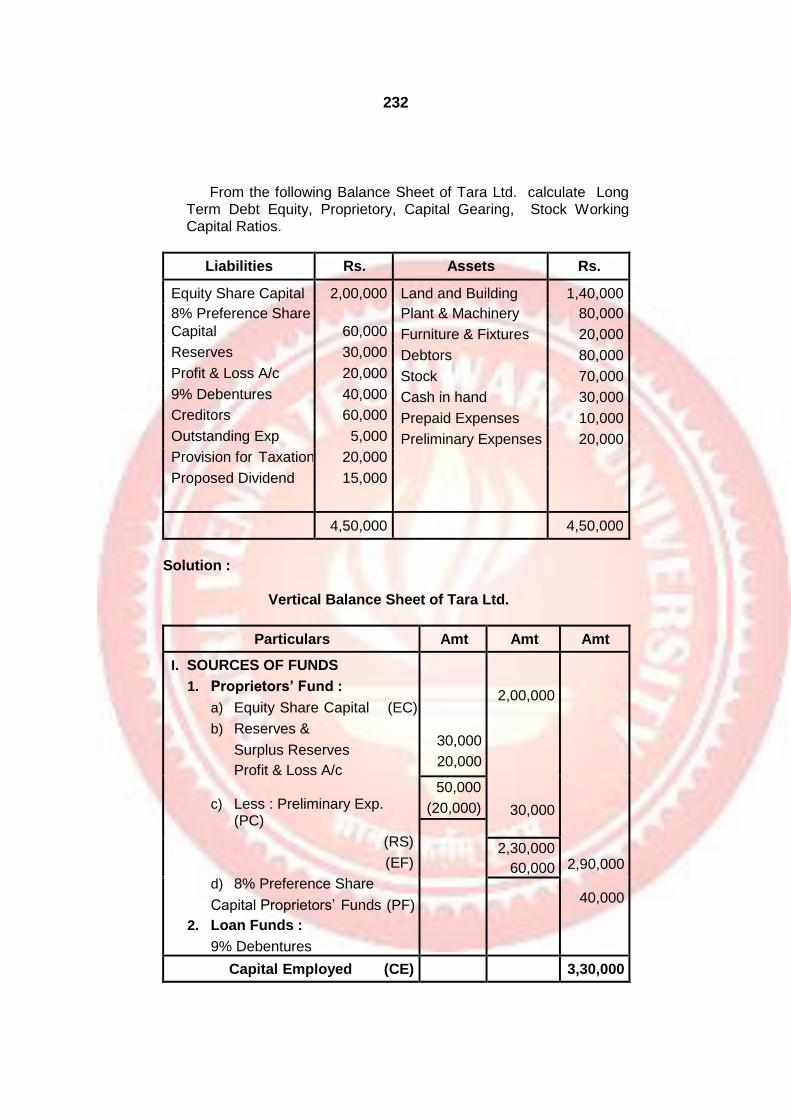
232
From the following Balance Sheet of Tara Ltd. calculate Long Term Debt Equity, Proprietory, Capital Gearing, Stock Working Capital Ratios.
Liabilities Rs. Assets Rs.
Equity Share Capital 2,00,000 Land and Building 1,40,000
8% Preference Share Plant & Machinery 80,000
Capital 60,000 Furniture & Fixtures 20,000
Reserves 30,000 Debtors 80,000
Profit & Loss A/c 20,000 Stock 70,000
9% Debentures 40,000 Cash in hand 30,000
Creditors 60,000 Prepaid Expenses 10,000
Outstanding Exp 5,000 Preliminary Expenses 20,000
Provision for Taxation 20,000
Proposed Dividend 15,000
4,50,000 4,50,000
Solution :
Vertical Balance Sheet of Tara Ltd.
Particulars Amt Amt Amt
I. SOURCES OF FUNDS
1. Proprietors’ Fund :
a) Equity Share Capital (EC)
b) Reserves &
Surplus Reserves
Profit & Loss A/c
c) Less : Preliminary Exp. (PC)
(RS)
(EF)
d) 8% Preference Share
Capital Proprietors’ Funds (PF)
2. Loan Funds :
9% Debentures
30,000
20,000
2,00,000
30,000
2,90,000
40,000
50,000
(20,000)
2,30,000
60,000
Capital Employed (CE) 3,30,000

233
II. APPLICATION OF FUNDS
1. Fixed Assets
Land & Building
Plant & Machinery
Furniture & Fixtures (FA)
2. Working Capital
a) Current Assets
Debtor
Cash-in-hand
Stock (CST)
Prepaid Expenses (CA)
b) Current Liabilities
Creditors
Outstanding Expenses
Provision for Taxation
Proposed Dividend
(CL) Working Capital (WC)
80,000
30,000
70,000
10,000
1,40,000
80,000
20,000
2,40,000
90,000
1,90,000
(1,00,000
)
60,000
5,000
20,000
15,000
Capital Employed (CE) 3,30,000
1) Long Term Debt Equity = Long Term Debt
= BF
Shareholder ' s Fund PF
= 40,000
2,90,000
= 0.14 : 1
2) Proprietory Ratio = Proprietor ' s Funds
100 Total Assets
= PF
100 TA
= 2,90,000
100
4,30,000
= 67.44%
TA = FA + CA = 2,40,000 + 1,90,000 = 4,30,000

234
3) Capital Gearing Ratio =
Capital Entitled to Fixed Rate of Dividend / Interest
Other Capital
= PC + BF
EF
Preference Capital + Debentures + Long Term Loans
= Equity Capital + Net Reserves
– Preliminary Expenses
= 60,000 + 40,000
2,30,000
= 1,00,000
= 0.43 : 1
2,30,000
4) Stock Working Capital Ratio = Stock
Working Capital
= CST
100 WC
= 70,000
100
90,000
= 77.78%
100
X Ltd. and Y Ltd. are in the same line of business. Following are
their Balance Sheets as on 31st December 2003.
Balance Sheet as on 31st December, 2003
Liabilities X
Ltd. (Rs.)
Y
Ltd. (Rs.)
Assets X
Ltd.
(Rs.)
Y
Ltd.
(Rs.)
Equity Share Capital
7,00,000 2,00,000
Land 1,00,000 80,000
Reserve & Surplus
1,00,000 1,00,000
Building 2,50,000 2,00,000
12% Debentures 2,00,000 5,00,000
Plant & Machinery
5,00,000 3,00,000
Creditors 1,20,000 70,000 Debtors 2,10,000 1,10,000
Bills Payable 40,000 20,000 Stock 1,00,000 2,00,000
Proposed Dividend
20,000 20,000 Cash & Bank 55,0000 40,000
Provision for Tax 35,000 20,000
12,15,000
9,30,000
12,15,000
9,30,000

235
You are required to rearrange the Balance Sheets (in Vertical form) and calculate the following ratios for both the companies (any three)
a) Proprietory Ratio b) Capital – Gearing Ratio
c) Current Ratio d) Stock Working Capital Ratio
(Mar 2003, adapted) Solution :
Balance Sheet as on 31st December, 2003
Particulars
Amt Amt
I. SOURCES OF FUNDS
1. Shareholders Fund
a) Share Capital
b) Reserves & Surplus
Proprietors’ Funds
(A+B)
2. Borrowed Funds :
12% Debentures
(PF/EF)
(BF)
7,00,000
2,00,000
1,00,000 1,00,000
8,00,000 3,00,000
2,00,000
5,00,000
Total Funds Available (1 + 2) 10,00,000 8,00,000
II. APPLICATION OF FUNDS
1. Fixed Assets
Land
Buildin
g
Plant & Machinery
2. Working
Capital Current
Assets Debtor
Cash & Bank
Stock
Current Liabilities
Creditors
Bills
Payable
Proposed Dividend
Provision for Tax
Working Capital (CA – CL)
(FA)
(CST)
(CA)
(CL)
(WC)
1,00,000
80,000
2,50,000 2,00,000
5,00,000 3,00,000
8,50,000 5,80,000
2,10,000
1,10,000
55,000 40,000
1,00,000 2,00,000
3,65,000 3,50,000
1,20,000
70,000
40,000 20,000
20,000 20,000
35,000 20,000
2,15,000 1,30,000
1,50,000 2,20,000
Total Funds Employed (1 + 2 + 3) 10,00,000 8,00,000
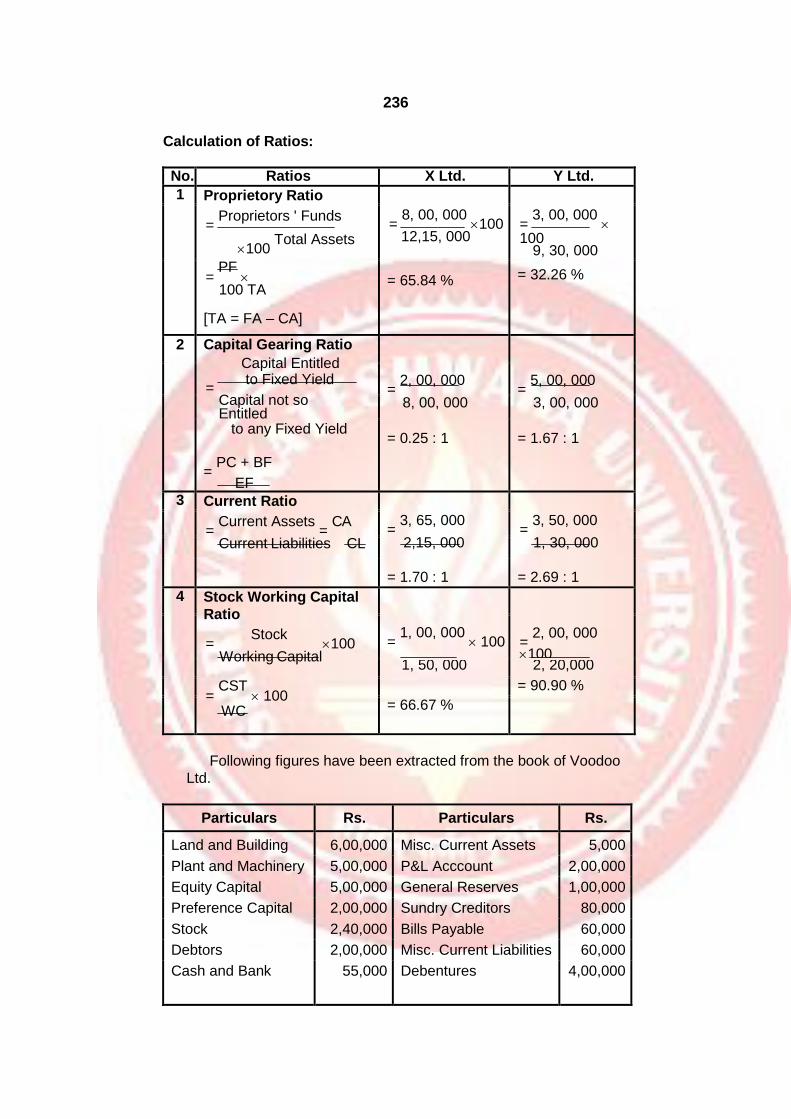
236
Calculation of Ratios:
No. Ratios X Ltd. Y Ltd.
1 Proprietory Ratio
= Proprietors ' Funds
100 Total Assets
= PF
100 TA
[TA = FA – CA]
=
8, 00, 000 100
12,15, 000 =
3, 00, 000
100
9, 30, 000
= 65.84 % = 32.26 %
2 Capital Gearing Ratio
Capital Entitled
= to Fixed Yield
Capital not so Entitled
to any Fixed Yield
= PC + BF
EF
= 2, 00, 000
= 5, 00, 000
8, 00, 000 3, 00, 000
= 0.25 : 1 = 1.67 : 1
3 Current Ratio
= Current Assets
= CA
Current Liabilities CL
=
3, 65, 000 =
3, 50, 000
2,15, 000 1, 30, 000
= 1.70 : 1 = 2.69 : 1
4 Stock Working Capital
Ratio
= Stock
100 Working Capital
= CST
100 WC
= 1, 00, 000
100
= 2, 00, 000
100
1, 50, 000 2, 20,000
= 90.90 %
= 66.67 %
Following figures have been extracted from the book of Voodoo
Ltd.
Particulars Rs. Particulars Rs.
Land and Building 6,00,000 Misc. Current Assets 5,000
Plant and Machinery 5,00,000 P&L Acccount 2,00,000
Equity Capital 5,00,000 General Reserves 1,00,000
Preference Capital 2,00,000 Sundry Creditors 80,000
Stock 2,40,000 Bills Payable 60,000
Debtors 2,00,000 Misc. Current Liabilities 60,000
Cash and Bank 55,000 Debentures 4,00,000

237
You are required to –
a) Rearrange above figures in the vertical form and
b) Calculate – (i) Debt-Equity Ratio (ii) Proprietory Ratio (iii) Capital
Gearing Ratio.
(April 98, adapted)
Solution :
Balance Sheet of Voodoo Ltd. as on ……
Particulars
Amt Amt
I. SOURCES OF FUNDS
1. Proprietors’ Fund
a) Equity Share Capital (EC)
b) P&L Account
c) General Reserve
Equityholders’ Funds (A+B)
(EF)
d) Preference Capital (PC)
Proprietors Funds (PF)
2. Borrowed Funds :
Debentures (BF)
5,00,000
2,00,000
1,00,000
10,00,00
0
4,00,000
8,00,000
2,00,000
Capital Employed (1 + 2) (CE) 14,00,000
II. APPLICATION OF FUNDS
1. Fixed Assets
Land & Building
Plant & Machinery
2. Working Capital
Debtors
Cash / Bank
Misc. Current Assets
Stock
Current Assets
Sundry Creditors
Bills Payable
Misc. Current Liabilities
Current liabilities
Working Capital
(FA) (CST)
(CA)
(CL)
(WC)
2,00,000
55,000
5,000
2,40,000
6,00,000
5,00,000
11,00,000
3,00,000
80,000
60,000
60,000
5,00,000
2,00,000
Capital Employed (1 + 2) (CE) 14,00,000

238
1) Debt – Equity Ratio = Borrowed Fund
= BF
Proprietors' Fund PF
= 4,00,000
= 0.4
10,00,000
OR
= Borrowed Fund Borrowed
Fund + Proprietor ' s Fund
= BF
= 4,00,000
= 0.29
BF + PF 14,00,000
2) Proprietory Ratio = Proprietors ' Fund
100 Total Assets
= PF
100 TA
= 10,00,000
16,00,000
100 = 62.50 %
3) Capital Gearing Ratio =
Capital Entitled to Fixed Rate of Dividend / Interest
Other Capital
= PC + BF
= 6,00,000
= 0.75 : 1
EF 8,00,000
Note : Total Assets = Fixed Assets + Current Assets
= 11,00,000 + 5,00,000
= 16,00,000
Following is the Balance Sheet of Roland Ltd.
Balance Sheet as on 31st March, 2004
Liabilities Rs. Assets Rs.
Equity Share Capital 1,00,000 Cash in hand 2,000
6% Preference Share Cash at Bank 10,000
Capital 1,00,000 Bills Receivable 30,000
7% Debentures 40,000 Debtors 70,000
8% Public Deposits 20,000 Stock 40,000
Bank Overdraft 40,000 Advances 20,000

239
Creditors 60,000 Furniture 30,000
Unpaid Dividend 10,000 Machinery 1,00,000
Outstanding Exp. 7,000 Land & Building 2,20,000
Reserves 1,50,000 Goodwill 30,000
Provision for Tax 20,000 Preliminary Expenses 10,000
Profit & Loss Account 20,000 Calls in Arrears in
Equity Shares 5,000
5,67,000 5,67,000
Convert the above Balance Sheet in vertical form and calculate – (i)
Current Ratio (ii) Quick Ratio (iii) Proprietary Ratio (iv) Capital Gearing Ratio (v) Stock Working Capital Ratio.
(Oct. 01, adapted)
Solution :
Vertical Balance Sheet as on 31st March, 2003
Particulars Amt Amt Amt
I. SOURCES OF FUNDS
1. Owners’ Fund
a) Equity Share Capital
Equity Share Capital
Less : Calls-in-
arrears
(EC)
b) Reserves and
Surplus Reserve
Profit & Loss Account
c) Less : Preliminary Exp.
Reserves & Surplus (RS)
Equityholders’ Funds (EF)
d) 6% Preference Capital (PC)
Proprietors Funds (PF)
2. Borrowed Funds :
a) Secured Loans
7%
Debentures
b) Unsecured Loans
8% Public
Deposit
(BF)
1,00,000
(5,000)
95,000
1,60,000
2,55,000
1,00,000
3,55,000
60,000
1,50,000
20,000
1,70,000
(10,000)
40,000
20,000
Capital Employed (1 + 2) (CE) 4,15,000

240
II. APPLICATION OF FUNDS
1. Fixed Assets
Goodwill
Land & Building
Machinery
Furniture
2. Working Capital
a) Current Assets
Cash-in-hand
Cash at Bank
Bills
Receivable
Debtors
Advances
b) Current liabilities
Creditors
Unpaid
Dividend
Outstanding Expenses
Provision for Tax
Bank Overdraft
Working Capital
(FA)
(QA)
(CST)
(CA)
(QL)
(CL)
(WC)
30,000
2,20,000
1,00,000
30,000
3,80,000
2,000
10,000
30,000
70,000
20,000
1,32,000
40,000
1,72,000
60,000
10,000
7,000
20,000
97,000
40,000
1,37,000
35,000
Capital Employed (1 + 2) (CE) 4,15,000
Calculation of Ratios :
1) Current Ratio = Current Assets
= CA
Current Liabilities CL
= 1,72,000
= 1.26 : 1
1,37,000
2) Quick Ratio = Quick Assets
= QA
Quick Liabilities QL
= 1,32,000
= 1.36 : 1
97,000

241
3) Proprietory Ratio = Proprietor ' s Funds
100 Total Assets
= PF
100 TA
= Proprietors' Fund
Fixed Assets + Current Assets
= 3,55,000
= 64.31%
5,52,000
100
4) Capital Gearing Ratio =
Capital Entitled to Fixed Rate of
Interest or Dividend
Capital not so entitled to Fixed
Rate of Dividend
= PC + BF
EF
= 1, 60,000
= 0.63 : 1
2,55,000
5) Stock Working Capital Ratio = Stock
Working Capital
100
= 40,000
100
35,000
= 114.29%
From the following given below prepare Balance Sheet in a vertical
form, suitable for analysis and calculate the following ratios:
a) Capital Gearing Ratio b) Proprietory Ratio
c) Current Ratio d) Liquid Ratio
e) Stock to Working Capital (Oct. 06, adapted)
Particulars Rs. Particulars Rs.
Cash at Bank 12,500 Land & Building 2,00,000
Expenses paid in Advance
15,500 Stock 68,250
Creditors 1,01,500 Debtors 1,30,750
Bills Receivable 5,250 Plant & Machinery 1,36,000
12% Debentures 62,500 Loan from Director 1,00,000
Equity Share Capital 2,50,000 (Repayable after three
Profit & Loss A/c (Cr.) 54,250 years)
5,67,000 5,67,000

242
Solution:
Vertical Balance Sheet as on …
Particulars Amt Amt Amt
I. SOURCES OF FUNDS
1. Shareholder’s Fund
a) Share Capital
Equity Share
Capital
b) Reserves and Surplus
Profit & Loss Account – Cr. bal
Own fund / Net Worth (A + B)
2. Loan Funds :
a) Secured Loans
12%
Debentures
b) Unsecured Loans
Loan from Directors (Repayable
for 3 years)
2,50,000
54,250
3,04,250
1,62,500
62,500
1,00,000
Total Funds Available (1 + 2)
4,66,750
II. APPLICATION OF FUNDS
1. Fixed Assets
A. Tangible Assets
Land & Building
Plant & Machinery
B. Intangible Assets
2. Long Term
Investments Total
Fixed Assets
3. Working Capital
A. Current Assets
a. Quick Assets
Cash at Bank
Bills
Receivable
Debtors
Total Quick Assets
b. Non-Quick Assets
Expenses paid in
Advance Stock
Total Current Assets
B. Less : Current Liabilities
a. Quick
Liabilities
Creditors
b. Non-Quick Liabilities
2,00,000
1,36,000
3,36,000
NIL
3,36,000
1,30,750
3,36,000
NIL
12,500
5,250
1,30,750
1,48,500
83,750
15,500
68,250
1,01,500
NIL
2,32,250
1,01,500

243
Total Current Liabilities
Working (A – B)
Total Funds Employed (2 + 3)
4,66,750

244
Ratios :
a) Capital Gearing Ratio =
=
Capital Entitled to Fixed Rate of
Interest or Dividend
Capital not so entitled to Fixed Rate
of Dividend
Preference Share Capital +
Borrowed Funds
Equity Share Capital + Re serves
Misc. Expenses
= 1, 62,500
2,50,000 + 54, 250
= 1,62,500
3,04, 250
= 0.534 : 1
b) Proprietory Ratio = Shareholders Funds
Total Assets
= 3,04, 250
= 0.535 : 1 5,68,250
Total Assets = Fixed Assets + Investment + Current Assets
= 3,36,000 + Nil + 2,32,250 = Rs.5,68,250
c) Current Ratio = Current Assets
Current Liabilities
= 2,32,250
= 2.288 : 1 1,01,500
d) Liquid Ratio = Quick Assets
Quick Liabilities
= 1, 48,500
= 1.463 : 1
1,01,500
e) Stock to Working Capital = Stock
Working Capital
= 68, 250
= 0.522 : 1 1,30,750

245
(A) Following is the Profit and Loss Account of Saurav Limited
for the year ended 31st March, 2003. You are required to prepare Vertical Income Statement for the purpose of analysis.
Particulars Rs. Particulars Rs.
To Opening Stock 700 By Sales
To Purchases 900 Cash 520
To Wages 150 Credit 1,500
To Factory Expenses 350 2,020
To Office Salaries 25 Less : Returns &
To Office Rent 39 Allowances 20 2,000
To Postage & Telegram 5 By Closing Stock
By Dividend on
Investment
By Profit on Sale of
Furniture
600
To Directors Fee 6
To Salesmen Salaries 12 10
To Advertising 18
To Delivery Expenses 20 20
To Debenture Interest 20
To Depreciation
On Office Furniture 10
On Plant 30
On Delivery Van 20
To Loss on Sales of Van 5
To Income Tax 175
To Net Profit 145
2,630 2,630
(B) From the above Vertical Income Statement Calculate: (i) Gross Profit Ratio, (ii) Operating Costs Ratio excluding Finance
expenses (iii) Stock Turnover Ratio.
(Oct. 2003, adapted) Solution :
Vertical Income Statement for the year ended 31st March, 2003
Particulars Rs. Rs.
Credit Sales CRS 1,500
Cash Sales 520
Less : Returns (20)
1. Total Sales S 2,000
Opening Stock OST 700
Purchases CRP 900
Factory Expenses 350

246
Wages
Depreciation : Machinery
Less : Closing Stock (CST)
2. Cost of Goods Sold COGS
3. Gross Profit GP
4. Administration Expenses
Office Rent
Salaries
Postage
Depreciation
Directors Fees
AE
5. Selling Expenses
Salaries
Advertising
Depreciation
Delivery
Expenses
SE
6. Operating Expenses OE
7. Operating Profit [GP – OE] OP
Dividend
Profit on Sale of Furniture
Loss on Sale of Van
8. Net Non-Operating Profit / Loss NO
9. Profit before Interest & Tax PBIT
Interest on Debentures INT
10. Net Profit Before Tax NPBT
Income Tax
11. Net Profit After Tax NPAT
Preference Dividends
12. Profit Av. For Equityholders PAES
Equity Dividends ED
13. Retained Earnings RET
150
30
(600)
1,530
470
85
70
155
315
25
340
20
320
175
145
0
145
0
145
39
25
5
10
6
12
18
20
20
10
20
(5)
Calculation of Ratios :
i) Gross Profit Ratio = Gross Profit
100 Gr Net Sales
= 470
2,000 100 = 23.5%
ii) Operating Cost Ratio = Operating Cost
100 Net Sales
= 1, 685
100
2,000 = 84.25%

247
Operating Cost = Cost of Sales + Operating Expenses
= 1,530 + 175 = 1,705
iii) Stock Turnover Ratio = Cost of Goods Sold
Average Stock
= 1,530
= 2.35 Times 650
Average Stock = Opening Stock + Closing Stock
2
= 700 + 600
= 650
2
The following figures relate to the trading activities of Z Ltd., for
the year ended 31st March 2003.
Particulars
Rs.
Sales 10,57,000
Closing Stock 4,60,000
Purchases 8,35,000
Loss on Sales of Assets 45,000
Advertising 32,750
Rent 18,750
Profit on Sale of Shares 25,000
Provision for taxation 1,00,000
Salaries 35,750
Salesmen’s Salaries 14,250
Depreciation 36,000
Sales Returns 57,000
Depreciation on Delivery Van 8,000
Printing and Stationery 17,500
Audit Fees 12,000
Opening Stock 2,25,000
Dividend received on Shares 15,000
You are required to rearrange above income statement in vertical form and compute the following ratios.
a) Gross Profit Ratio,
b) Operating Ratio
c) Net Operating Profit Ratio
d) Selling and Distribution Expenses to Sales Ratio
e) Net Profit Ratio (Oct. 96 adapted)

248
Solution :
Vertical Income Statement for the year ended 31-03-2003
Particulars Rs. Rs. Rs.
1. Gross Sales
2. Returns
3. Net Sales (1 – 2) S
4. Less : Cost of Goods Sold
a) Opening Stock
b) add : Purchases
c) Less : Closing Stock
COGS
5. Gross Profit (3 – 4) GP
6. Less :
a) Operating Expenses
Administrative Expenses
:
Rent
Salaries
Depreciatio
n
Printing & Stationery
Audit Fees
AE
b) Selling and Distribution
Expenses Advertisement
Salesman Salaries
Depreciation of Delivery Vans
SE
Operating Expenses OE
7. Operating Net Profit (5 – 6) OP
8. Add : Non-operating
Income Profit on Sale of
Shares Dividend on
Shares
9. Less : Non-Operating
Expenses Loss on Sale of
Assets
10. Net Profit before Tax (7 + 8 – 9) NPBT
11. Less : Provision for Taxation IT
12. Net Profit after Tax (10 – 11) NPAT
10,57,000
57,000
10,00,000
2,25,000
8,35,000
(4,60,000)
6,00,000
4,00,000
18,750
35,750
36,000
17,500
12,000
1,20,000
32,750
14,250
8,000
55,000
1,75,000
2,25,000
25,000
15,000 40,000
2,65,000
45,000
2,20,000
1,00,000
1,20,000

249
a) Gross Profit Ratio = G.P.
Net Sales
= 4,00,000
10,00,000
100
100
= 40%
b) Operating Ratio = COGS + OE
100 Net Sales
= 7,75,000
10,00,000
100 = 77.50%
c) Net Operating Profit Ratio
= Operating N. P.
×100 =
2,25,000
×100 = 22.50%
Net Sales 10,00,000
d) Selling & Distr. Exp. to Sales Ratio
= Selling & Dist. Expenses
×100
Net Sales
e) Net Profit Ratio = Net Profit Before Tax
×100 = 2,20,000 ×100
Sales 10,00,000
22%
Compute Various Ratios
(Two Companies)
The summarised final accounts of two companies are as follows:
Balance Sheet
Liabilities X
Ltd.
Rs.
Y
Ltd.
Rs.
Assets X
Ltd.
Rs.
Y
Ltd
Rs.
Share Capital 88,000 88,000 Fixed Assets 1,21,000 96,800
Reserves 42,900 35,200 Current Assets 1,25,400 1,03,400
8% Debentures 22,000 22,000 Less: Current
Liabilities
93,500 55,000
1,52,900 1,45,200 1,52,900 1,45,200

250
Revenue Statement for the year
Particulars
X
Ltd.
Rs.
Y
Ltd.
Rs.
Sales 3,30,000 2,64,000
Less: Cost of Sales 2,37,600 1,98,000
Gross Profit 92,400 66,000
Less: Operating Expenses 63,800 44,000
Net Profit before Tax 28,600 22,000
Less: Tax 12,100 9,240
Profit after Tax 16,500 12,760
Less: Dividend 8,800 6,600
Retained Earning 7,700 6,160
You are required to calculate the following ratios:
(1) Proprietory ratio (2) Capital gearing ratio (3) Gross profit ratio (4) Operating ratio (5) Return on capital employed ratio (6) Return on proprietor’s equity ratio (7) Expenses ratio (8) Net profit ratio.
(Apr. 95, adapted)
Solution:
Vertical Balance Sheet
Particulars X Ltd. Y Ltd.
Rs. Rs. Rs. Rs.
i) Sources of Funds a. Equity Capital EC 88,000 88,000 b. Reserves RS 42,900 35,200 1. Equity Funds EF/PF 1,30,900 1,23,200 2. Borrowed Funds
8% Debentures BF 22,000 22,000
Capital Employed CE 1,52,900
1,45,200
ii) Application of Funds
1. Net Fixed Assets 2. Working Capital
a. Current Assets
b. Less: Current Liabilities
Capital Employed
FA
C
A CL WC CE
1,21,000 96,800
1,25,400
93,500
1,03,400
55,000
31,900 1,52,900
48,400 1,45,200
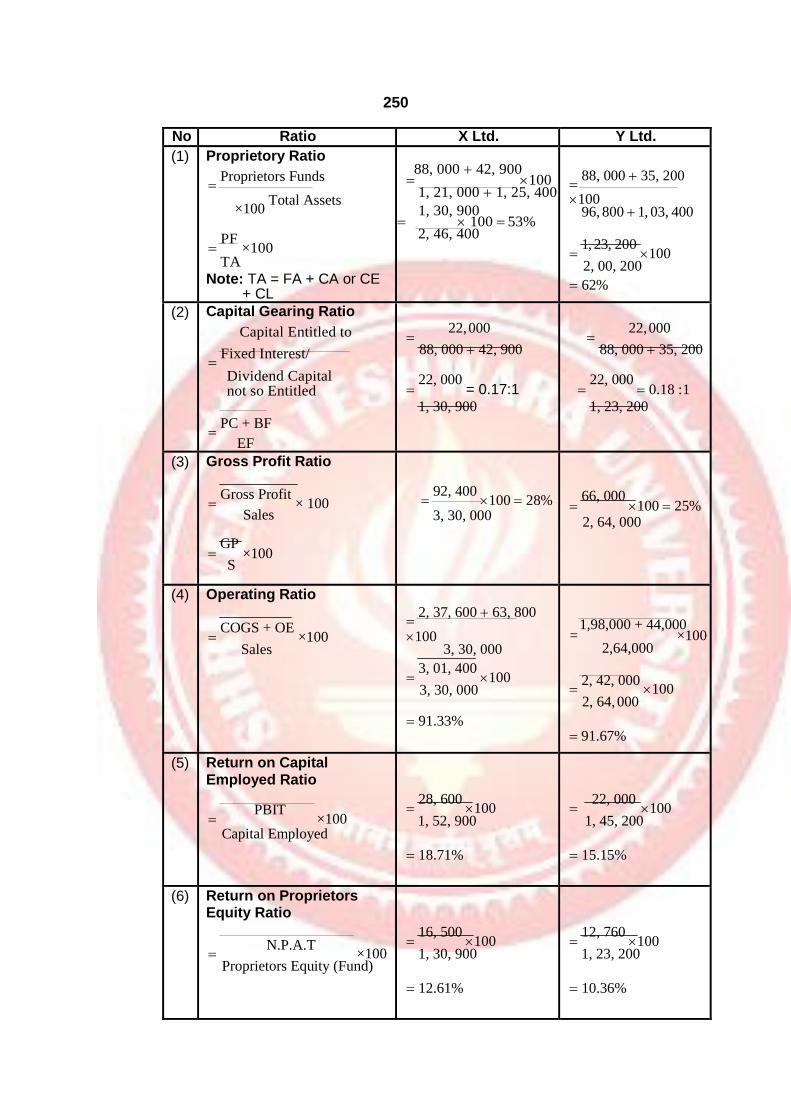
250
No Ratio X Ltd. Y Ltd.
(1) Proprietory Ratio
Proprietors Funds
×100 Total Assets
PF
×100 TA
Note: TA = FA + CA or CE + CL
88, 000 42, 900 100
1, 21, 000 1, 25, 400
1, 30, 900 100 53%
2, 46, 400
88, 000 35, 200
100
96, 800 1, 03, 400
1, 23, 200
100
2, 00, 200
62%
(2) Capital Gearing Ratio
Capital Entitled to
Fixed Interest/
Dividend Capital not so Entitled
PC + BF
EF
22, 000
88, 000 42, 900
22, 000
= 0.17:1 1, 30, 900
22, 000
88, 000 35, 200
22, 000
0.18 :1
1, 23, 200
(3) Gross Profit Ratio
Gross Profit
× 100 Sales
GP
×100 S
92, 400
100 28% 3, 30, 000
66, 000
100 25% 2, 64, 000
(4) Operating Ratio
COGS + OE
×100
Sales
2, 37, 600 63, 800
100
3, 30, 000
3, 01, 400
100
3, 30, 000
91.33%
1,98,000 + 44,000
= ×100 2,64,000
2, 42, 000
100
2, 64, 000
91.67%
(5) Return on Capital Employed Ratio
PBIT
×100 Capital Employed
28, 600
100
1, 52, 900
18.71%
22, 000
100
1, 45, 200
15.15%
(6) Return on Proprietors Equity Ratio
N.P.A.T
×100
Proprietors Equity (Fund)
16, 500
100
1, 30, 900
12.61%
12, 760
100
1, 23, 200
10.36%

251
(7) Expenses Ratio
(a) COGS
100 Sales
2, 37, 600 100
72% 3, 30, 000
1, 98, 000
100
75%
2, 64, 000
(b) O.E.
100 Sales
63, 800
100
44, 000
100
3, 30, 000 2, 64, 000
19.33% 16.67%
(8) Net Profit Ratio
N.P.B.T.
×100
Sales
28, 600
100
22, 000
100
3, 30, 000 2, 64, 000
8.67% 8.33%
From the following Balance Sheet of X Ltd. compute –
(a) Liquid Ratio (b) Proprietory Ratio (c) Stock Turnover Ratio (d) Capital Gearing Ratio (e) Debtors Velocity and offer you comments
in brief.
Balance Sheet as on 31st March, 2003
Particulars Rs. Particulars Rs.
Preference Share Capital 2,00,000 Fixed Assets 12,00,000
Equity Share Capital 5,00,000 Stock 5,40,000
Reserves 10,00,000 Sundry Debtors 8,00,000
Secured Loans 4,00,000 Advance Income-tax 1,20,000
Current Liabilities 5,40,000 Cash at Bank 7,90,000
Provisions 8,10,000
Total 34,50,000 Total 34,50,000
Total Sales during the year was Rs. 77,76,000 (including Cash Sales Rs. 5,76,000) which yielded a Gross Profit of 25% on Sales. The Stock on 31st March, 2002 was Rs. 4,32,000. Assume for your working 360 days for the year.
Solution:
(a) Liquid Ratio = Quick Assets
= QA
15, 90, 000
Quick Liabilities QL 13, 50, 000
1.18 :1
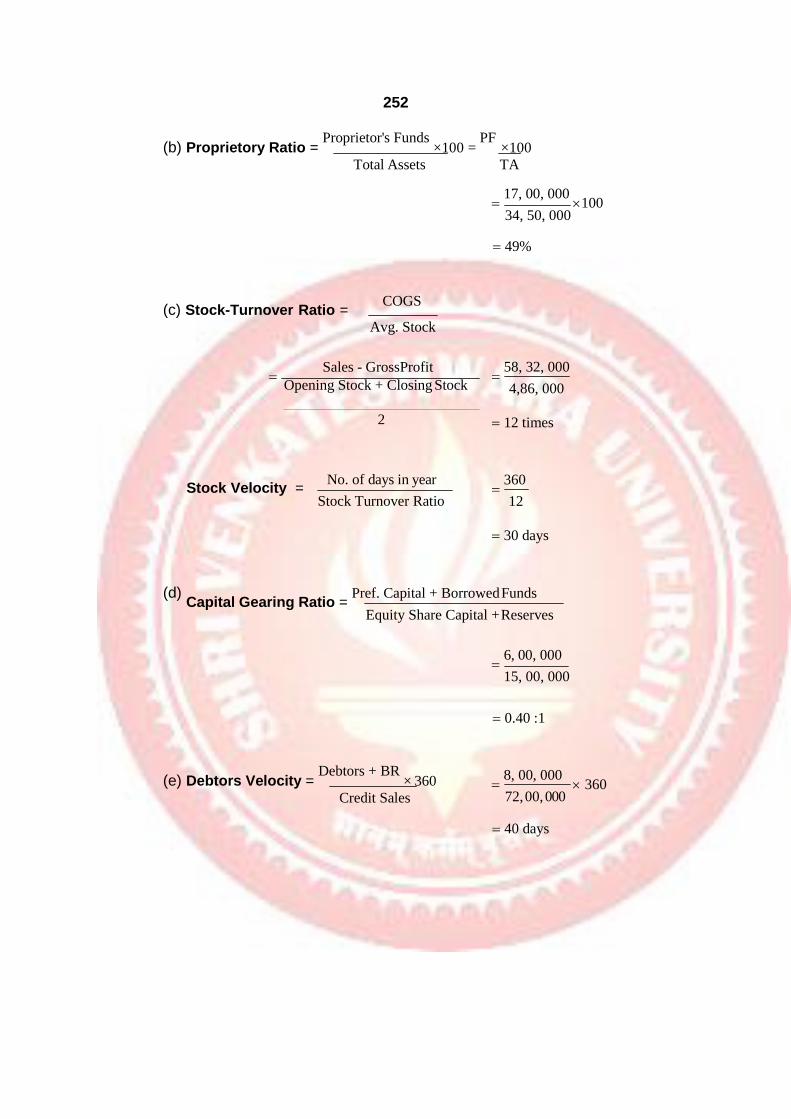
252
(b) Proprietory Ratio = Proprietor's Funds
×100 = PF
×100
Total Assets TA
17, 00, 000
100
34, 50, 000
49%
(c) Stock-Turnover Ratio = COGS
Avg. Stock
Sales - GrossProfit
Opening Stock + Closing Stock
2
58, 32, 000
4,86, 000
12 times
Stock Velocity = No. of days in year
Stock Turnover Ratio
360
12
30 days
(d) Capital Gearing Ratio =
Pref. Capital + Borrowed Funds
Equity Share Capital + Reserves
6, 00, 000
15, 00, 000
0.40 :1
(e) Debtors Velocity = Debtors + BR
× 360
Credit Sales
8, 00, 000
72, 00, 000 360
40 days

253
Working Note:
X Ltd.
Vertical Balance Sheet
Particulars Rs. Rs. Rs.
I) Sources of Funds a. Capital
Equity Share Capital EC 5,00,000 Reserves & Surplus RC 10,00,000 Equity Funds EF 15,00,000 Preference Share Capital PC 2,00,000 Proprietor’s Funds PF 17,00,000
b. Borrowed Fund:
Secured Loans BF 4,00,000
Capital Employed CE
21,00,000
II) Application of Funds
a. Fixed Assets FA 12,00,000 b. Working Capital
Debtors DR 8,00,000 Cash at Bank ... ... ... 7,90,000 Quick Assets QA 15,90,000 Add: Stock CST 5,40,000
Advance Tax ... ... ... 1,20,000 Current Assets CA 22,50,000 Less: Quick/Current Liabilities Current Liabilities ... ... ... 5,40,000 Provisions ... ... ... 8,10,000
CL 13,50,000
Working Capital (CA-CL) WC 9,00,000
Capital Employed CE
21,00,000
Q. 12 Following are the Trading and Profit and Loss Account of Sarmer
Ltd. for the year ending 31st December, 2002 and Balance Sheet on that date:
P and L Account
Particulars Rs. Particulars Rs.
To Opening Stock 1,45,000 By Sales 7,50,000
To Purchases 6,10,000 By Closing Stock 1,55,000
To Gross Profit C/d 1,50,000
9,05,000 9,05,000
To Sundry Expenses 80,000 By Gross Profit B/d 1,50,000
To Net Profit 70,000
1,50,000 1,50,000

254
Balance Sheet
Liabilities
Rs. Assets Rs.
Share Capital 7,00,000 Net Block 5,50,000
Reserve & Surplus 50,000 Stock 1,55,000
Add: Profit for the year 70,000 1,20,000 Debtors 1,80,000
Bank Overdraft 35,000 Cash 1,20,000
Creditors 1,50,000
10,05,000 10,05,000
You are required to calculate the following ratios. Current Ratio, Quick Ratio, Gross Profit to Sales, Stock Turnover, Debtors Turnover Ratio, NP to paid up Capital.
(April 98, adapted)
Solution:
(1) Gross Profit Ratio = Gross Profit
×100 = GP
×100
Net Sales S
1, 50, 000
100
7, 50, 000
20%
(2) Stock Turnover Ratio = COGS
=
Average Stock
COGS OST
+ CST 2
6, 00, 000
1, 50, 000
4 times
Average Stock = Opening Stock + Closing Stock
2 1, 50, 000
(3) Current Ratio = Current Assets
= CA
4, 55, 000
Current Liabilities CL 1,85, 000
2.46 :1
(4) Quick Ratio = Quick Assets
= QA
3, 00, 000
Quick Liabilities QL 1, 50, 000
2 :1

255
(5) Debtors Turnover Ratio = Credit Sales
= CRS
Debtors + Bill Receivable DR + BR
7, 50, 000
1,80, 000
4.17 times
(period 88 days)
(6) N.P. to Paid-up Capital = N.P.A.T.
×100
Paid-up Share Capital
= NPAT
×100 EC
70, 000
7, 00, 000 100
10%
Note:
Vertical Income Statement
Particulars Rs. Rs.
Sales S 7,50,000
Less: Cost of Goods Sold:
Opening Stock OST 1,45,000
Add: Purchases ... ... ... ... 6,10,000
... ... ... ... 7,55,000
Less: Closing Stock CST 1,55,000
Cost of Goods Sold COGS 6,00,000
Gross Profit GP 1,50,000
Less: Operating Expenses OE 80,000
Net Profit NP 70,000
Vertical Balance Sheet
Particulars Rs. Rs. Rs.
I) Sources of Funds Equity Capital EC 7,00,000 Reserves & Surplus RS 1,20,000 Shareholders Funds EF/PF 8,20,000
Borrowed Funds BF Nil
Capital Employed CE
8,20,000

256
II) Application of Funds
Fixed Assets (Net Block) Working Capital: Debtors
Cash Quick Assets Add: Stock
Current Assets Quick Liabilities: Creditors Add: Bank O.D. Current Liabilities
Working Capital (CA-CL)
Capital Employed
FA
DR ... ... ...
QA
CST
CA
CD/QL ... ... ...
CL 1,50,000 WC 35,000
CE
5,50,000
1,80,000
1,20,000 3,00,000 1,55,000
4,55,000
1,85,000
2,70,000
8,20,000
From the following Profit and Loss Accounts and Balance Sheets after calculating following ratios: (1) Current ratio (2) Proprietory ratio (3) Debt-Equity ratio (4) Stock working capital ratio
(5) Liquid ratio (6) Cost of sales to sales ratio (7) Administrative exp. to sales ratio (8) Selling expenses to sales ratio.
Balance Sheet
Liabilities 2003
Rs.
2002
Rs.
Assets 2003
Rs.
2002
Rs.
Capital of Rs. 10 each
70,000 70,000 Fixed Assets
90,000 92,000
Reserves 80,000 68,000 Current Assets
1,10,000 1,12,000
Secured Loans 22,000 24,000 Loans and
Advances
52,000 40,000
Current Liabilities 26,000 30,000
Provisions 54,000 52,000
2,52,000 2,44,000 2,52,000 2,44,000
Profit and Loss Account for the year Ended .....
Particulars 2003
Rs.
2002
Rs.
Particulars 2003
Rs.
2002
Rs.
To Opening Stock 44,000 40,000 By Sales 2,10,000 2,00,000
To Purchases 84,000 72,000 By Closing Stock
46,000 44,000
To Wages 40,000 36,000
To Factory Exp. 32,000 28,000
To Administrative
Expenses 8,000 6,000

257
To Selling Exp. 6,000 10,000
To Managerial
Remuneration 2,000 2,000
To Tfd. to Reserve 2,000 2,000
To Income Tax 22,000 24,000
To Proposed
Dividend 6,000 8,000
To Balance C/fd. 10,000 16,000
2,56,000 2,44,000 2,56,000 2,44,000
(Oct. 95, adapted)
Solution:
No Ratio 31-03-2003 31-03-2002
(1) Current Ratio
Current Assets
= CA
Current Liabilities CL
1,10, 000 52, 000
26, 000 54, 000
1, 62, 000
2.03 :1
80, 000
1,12, 000 40, 000
30, 000 52, 000
1, 52, 000
1.85 :1
82, 000
(2) Proprietory Ratio
Proprietor's Funds
×100 Total Assets*
PF
×100 TA
*Fixed + Current
1, 50, 000
100
2, 52, 000
= 59.52% or = 0.6:1
1, 38, 000
100
2, 44, 000
= 56.56% or = 0.57:1
(3) Debt-Equity Ratio
(i) Borrowed Fund
= BF
Proprietor's Fund PF
OR
(ii) Borrowed Fund Borrowed Proprietor's
Fund + Fund
BF
BF + PF
22, 000
0.15 :1 1, 50, 000
22, 000
0.13 :1 1, 72, 000
24, 000
0.17 :1 1, 38, 000
24, 000
0.15 :1 1, 62, 000

258
(4) Stock to W.C. Ratio
= Closing Stock
×100
W.C.
= CST
×100 WC
46, 000
100
44, 000
100
82, 000 70, 000
56.10% 62.86%
(5) Liquid Ratio
= Quick Assets
= QA
Quick Liabilities QL
1,16, 000
1.45 :1
80, 000
1, 08, 000
1.32 :1
82, 000
(6) Cost of Sales to Sales Ratio
COGS ×100 =
COGS ×100
Sales S
1, 54, 000
100
2,10, 000
1, 32, 000 100
2, 00, 000
73.33% 66%
(7) Administrative Expenses Ratio
Administrative Expenses
×100
Sales
= AE
×100 S
10, 000
100
2,10, 000
8, 000
100
2, 00, 000
4.76% 4%
(8) Selling Expenses Ratio
= Selling Expenses
×100
Sales
= SE
×100 S
6, 000
100
10, 000
100
2,10, 000 2, 00, 000
2.86% 5%
Note: Before calculating the ratios, it is necessary to convert Horizontal
Financial Statements in Vertical Form.

259
Commentary Limited
Vertical Balance Sheets
Particulars 2003 2002
Rs. Rs. Rs. Rs.
I) Sources of Funds Owners Funds: Capital EC 70,000 70,000 Reserves RS 80,000 68,000 Equity / Proprietory Funds EF/PF 1,50,000 1,38,000 Loan Funds:
Secured Loans BF 22,000 24,000
Capital Employed CE
1,72,000
1,62,000
II) Application of Funds
Fixed Assets FA 90,000 92,000 Working Capital Quick Assets QA 1,16,000 1,08,000 (CA + LA – Stock) Stock CST 46,000 44,000 Current Assets CA 1,62,000 1,52,000 Less: Quick Liabilities / Current Liabilities QL/CL 80,000 82,000
WC 82,000 70,000
Capital Employed CE 1,72,000 1,62,000
Vertical Income Statement
Particulars 2003 2002
Rs. Rs. Rs. Rs.
Sales S 2,10,000 2,00,000 Less: Cost of Goods Sold Opening Stock ... ... ... 44,000 40,000 Add: Purchases ... ... ... 84,000 72,000
Wages ... ... ... 40,000 36,000 Factory Expenses ... ... ... 32,000 28,000
2,00,000 1,76,000 Less: Closing Stock ... ... ... 46,000 44,000
COGS 1,54,000 1,32,000 Gross Profit GP 56,000 68,000 Less: Operating Expenses ... ... ... Administration Expenses AE 10,000 8,000 (incl. Managerial Remuneration) Selling & Dist. Expenses SE 6,000 10,000 Operating Expenses OE 16,000 18,000

260
Operating Profit OP 40,000 50,000 Less: Income-tax IT 22,000 24,000 Profit after Tax PAT 18,000 26,000 Less: Proposed Dividends ED 6,000 8,000
12,000 18,000
Less: Tfd. to Reserves ... ... ... 2,000 2,000
Profits retained RE
10,000
16,000
Profit & Loss A/c. and Balance Sheet of SIDHARTH LTD. for the
year ended 31st March, 2007:
Trading Profit & Loss Account for the year ended 31st March 2007 Dr. Cr.
Particulars Rs. Particulars Rs.
To Opening Stock 70,000 By Sales 9,00,000
To Purchases 5,40,000 By Closing Stock 80,000
To Wages 2,14,000
To Gross Profit c/d 1,56,000
9,80,000 9,80,000
To Salaries 26,000 By Gross Profit b/d 1,56,000
To Rent 5,000 By Interest on Investment 5,000
To Miscellaneous Exp. 15,000
To Selling Exp. 10,000
To Depreciation 30,000
To Interest 5,000
To Provision for Tax 20,000
To Net Profit c/d 50,000
1,61,000 1,61,000
Balance Sheet as on 31st March, 2007
Liabilities Rs. Assets Rs.
Equity Share Capital (Rs. 10)
1,50,000 Fixed Assets 1,60,000
(-) Depreciation 30,000
1,30,000
8% Preference Share Capital (Rs. 100)
1,00,000 Investment 1,00,000
Reserve & Surplus 62,000 Stock 80,000
10% Debenture 50,000 Debtors 60,000
Bank Loan (Payable after 5 years)
40,000 Bills Receivable 50,000

261
Creditors 60,000 Cash 85,000
Provision for Tax (C.Y.) 20,000 Preliminary Expenses 5,000
Bank Overdraft 20,000
Proposed Pref.
Dividend
8,000
5,10,000 5,10,000
Note: Market value of Equity share is Rs. 12 and Dividend paid per
Equity share is Rs. 2. Calculate the following ratio:
(a) Acid Test Ratio (b) Capital Gearing Ratio
(c) Operating Ratio (d) Dividend Payout Ratio (e) Debt Service Ratio (f) Creditors Turnover Ratio
(g) Earning per Share (h) Stock Turnover Ratio
(i) Price Earning Ratio
Solution:
Balance Sheet Ratios:
1. Quick/Liquid Ratio = QA
= QL
(Mar. 08, adapted)
60, 000 50, 000 85, 000
60, 000 20, 000 8, 000
1, 95, 000
2.22
88, 000
2. Capital Gearing Ratio = PC + BF
= 1, 00, 000 50, 000 40, 000
EF 1, 50, 000 62, 000 5, 000
1, 90, 000
0.92
2, 07, 000
Profit & Loss Ratios:
3. Operating Ratio = COGS + OE
×100 S
(70,000 5,40,000 2,14,000 80,000)
(26, 000 5, 000 15, 000 10, 000 30, 000)
9, 00, 000
8, 30, 000
100 92%
9, 00, 000
Stock Turnover Ratio = COGS
7, 44, 000 9.92
(OST CST ) / 2 75, 000

262
Composite Ratios:
4. Debt Service
= PBIT
= Sales - COGS - OE + Interest
INT Interest on Debentures
9, 00, 000 8, 30, 000 5, 000
75, 000
15.00
5, 000 5, 000
5. Creditors Turnover = CRP
5, 40, 000 9.00
(CD BP) 60, 000
6. Creditors Velocity = 365
CTR
365
40.56 9.00
7. Dividend Pay-out Ratio = ED
PAE
S
100 30, 000
0.71 42, 000
8. EPS =
Profitfor Equityholders =
42,000 =
Rs.2.80 No. of Equity Shares 15,000
9. Price Earning Ratio = Marke Price
= 12
= 4.29
EPS 2.80
Working Note:
Vertical Balance Sheet
Particulars Rs. Rs. Rs.
I) Sources of Funds Equity Share Capital EC 1,50,000 Reserves & Surplus ........................................ 62,000 Less: Preliminary Expenses ........................... (5,000) Net Reserves & Surplus RS 57,000 Equity Shareholder’s Funds EF 2,07,000 Pref. Share Capital PC 1,00,000 Proprietor’s Funds PF 3,07,000 Borrowed Funds 10% Debentures ... ... ... 50,000 Bank Loan (payable after 5 years) ... ... ... 40,000
BF 90,000
Capital Employed (PF+BF) CE
3,97,000
II) Use of Funds
Fixed Assets .............................................. 1,30,000 Trade Investments ...................................... 1,00,000
Total Fixed Assets FA 2,30,000

263
Quick Assets Debtors DR 60,000
Bills Receivable BR 50,000 Cash /Bank ................................................... 85,000
QA 1,95,000 Closing Stock CST 80,000 Current Assets CA Quick Liabilities
Creditors CD 60,000
Prov. For Tax ................................................ 20,000 Proposed Dividends ... ... ... 8,000
QL 88,000
Bank Overdraft OD 20,000 Current Liabilities CL
Working Capital WC
Capital Employed (FA+WC) CE
2,75,000
1,08,000
1,67,000
3,97,000
Vertical Income Statement
Particulars Rs. Rs. Rs.
Credit Sales CRS 9,00,000 Total Sales S 9,00,000 Opening Stock OST 70,000 Credit Purchases CRP 5,40,000 Wages ... ... ... 2,14,000 Less: Closing Stock (CST) (80,000) Cost of Goods Sold COGS 7,44,000 Gross Profit GP 1,56,000 Admin. Expenses Salaries ... ... ... 26,000 Rent ... ... ... 5,000 Misc. Expenses ... ... ... 15,000
AE 46,000 Selling Expenses SE 10,000 Depreciation ... ... ... 30,000 Operating Expenses OE 86,000 Operating Profit OP 70,000 Interest on Investments ... ... ... 5,000 Profit Before Int. & Tax PBIT 75,000 Interest on Debentures INT 5,000 Net Profit Before Tax NPBT 70,000 Income Tax ... ... ... 20,000 Net Profit After Tax NPAT 50,000 Preference Dividends ... ... ... 8,000 Profit Avl. For Eq. holders PAES 42,000
Equity Dividends (Rs. 2 x 15,000) ED 30,000
Retained Earnings RET
12,000

264
Following is the Profit and Loss A/c and Balance Sheet of
Adhiraj Ltd:
Profit and Loss A/c for the Year ended 31st December, 2006
Particulars Rs. Particulars Rs.
To Opening Stock 20,000 By Sales 4,50,000
To Purchases 2,00,000 By Closing Stock 80,000
To Wages 50,000
To Factory Exp. 70,000
To G.P. c/d 1,90,000
5,30,000 5,30,000
To Administrative Exp. 60,000 By Gross Profit b/d 1,90,000
To Selling Exp. 40,000 By Interest Received 5,000
To Interest on Loan 5,000
To Debenture Interest 8,000
To Net Profit 82,000
1,95,000 1,95,000
To Tax Provision By Net Profit 82,000
To Proposed Dividend
To Balance Profit
82,000 82,000
Balance Sheet as on 31st December, 2006
Liabilities Rs. Assets Rs.
Equity Share Capital
(Rs. 10)
2,00,000 Land & Building 1,75,000
9% Preference Share Capital
1,50,000 Machinery 1,50,000
8% Debenture 1,00,000 Furniture 1,00,000
Reserve 50,000 Goodwill 50,000
Profit & Loss A/c 30,000 Patents 50,000
Short Term Loan
(Repaid within one year)
1,00,000 Vehicles 1,40,000
Bank Overdraft 75,000 Investment 50,000

265
Sundry Creditors 1,40,000 Stock 80,000
Bills Payable 30,000 Debtors 90,000
Provision for Tax 20,000 Bills Receivable 30,000
Proposed Dividend 20,000
9,15,000 9,15,000
Market price of equity share is Rs. 7. Calculate
the following ratios:
(a) Acid Test Ratio (b) Capital Gearing Ratio
(c) Stock Turnover Ratio (d) Debtors Turnover Ratio (e) Creditors Turnover Ratio (f) Return on Capital Employed
(g) Stock Working Capital Ratio Ratio
(h) Operating Ratio (i) Earning Per Share
(j) Price Earning Ratio (Mar. 07, adapted)
Solution:
Ratios:
(a) Quick/Liquid/Acid Test Ratio = Quick Assets
Quick Liabilities
1, 20, 000
0.387 :1 3,10, 000
(b) Capital Gearing Ratio
=
Preference Share Capital + Borrowed Funds
Equity Share Capital + Reserves - Misc. Expenses
2, 50, 000
2, 80, 000 0.893
(c) Stock Turnover Ratio = Cost of Goods Sold
Average Stock
2, 60, 000
5.20 times 50, 000
Average Stock = Opening Stock + Closing Stock
2
20, 000 80, 000
50, 000
2

266
(d) Debtors Turnover Ratio = Credit Sales
= CRS
Debtors (DR + BR)
4, 50, 000
3.75
1, 20, 000
(e) Creditors Turnover Ratio = Credit Purchases
= CRP
Creditors (CD + BP)
2, 00, 000
1.176
1, 70, 000
(f) Return on Capital Employed = PBIT×100
CE
90, 000
5, 30, 000
100 16.98%
(g) Stock to Working Capital = Stock
Working Capital
80, 000
(1, 85, 000) (0.43)
(h) Operating Ratio = COGS + OE × 100
S
(i) Earning Per Share = PAES
3, 65, 000
100 81.11%
4, 50, 000
= 48,500
= 2.425
No. of Equity Shares 20,000
(j) Price Earnings Ratio = Market Price
= 7
= 2.90
EPS 2.425
Working Note:
Balance Sheet as on 31st December, 2006
Particulars Rs. Rs.
I) SOURCES OF FUNDS
1. Owner’s Funds
(a) Equity Share Capital
(b) Reserves and
Surplus Reserve
Profit & Loss A/c
Equity Shareholder’s Funds
EC
2,00,000
RS
... ... ... ... 50,000
... ... ... ... 30,000
EF 2,80,000

267
(c) Preference Share Capital PC 1,50,000
Proprietor’s Funds PF
2. Borrowed Funds
8% Debentures BF
CAPITAL EMPLOYED CE
II) APPLICATION OF FUNDS
1. Fixed Assets
Land & Building ... ... ... ... 1,75,000
Machinery ... ... ... ... 1,50,000
Furniture ... ... ... ... 1,00,000
Vehicles ... ... ... ... 1,40,000
Goodwill ... ... ... ... 50,000
Patents ... ... ... ... 50,000
2. Trade Investments FA 50,000
Total Fixed Assets
3. Working Capital
A. Current Assets
a. Quick Assets
Debtors DR 90,000
Bills Receivable BR 30,000
Total Quick Assets QA 1,20,000
b. Non-Quick Assets
Closing Stock CST 80,000
Total Current Assets CA 2,00,000
B. Less: Current Liabilities
a. Quick Liabilities
Creditors CD 1,40,000
Bills Payable BP 30,000
Prov. for Tax 20,000
Proposed Dividends 20,000
Short Term Loan 1,00,000
QL 3,10,000
b. Non-Quick Liabilities
Bank Overdraft OD 75,000
Total Current Liabilities CL 3,85,000
Working Capital (CA-CL) WC
CAPITAL EMPLOYED (FA+WC) CE
4,30,000
1,00,000
5,30,000
7,15,000
(1,85,000)
5,30,000

268
Vertical Income Statement for the Year Ended 31st December, 2006
Particulars
Rs. Rs.
Net Sales
Less:
(a) Opening Stock
(b) Credit Purchases
(c) Wages
(d) Factory Expenses
Less: (e) Closing Stock
Cost of Goods Sold
Gross Profit
Less: Operating Expenses
(a) Administration Expenses
(b) Selling Expenses
(c) Finance Expenses
Interest on Short term Loan
Total Operating Expenses
Operating Profit
Non-Operating Interest
Income Profit Before Interest &
Tax Interest on Debentures
Net Profit Before
Tax Less: Income
Tax Net Profit After
Tax
Less: Preference Dividends
(9% x 1,50,000)
Profit Available for Equity holders
Less: Equity Dividends
(20,000 – 13,500)
Retained Earnings
S
OST
CR
P
... ... ... ...
... ... ... ...
CST
COG
S
GP
... ... ... ...
... ... ... ...
... ... ...
... OE
... ... ... ...
... ... ... ...
PBIT
... ... ... ...
NBIT
IT
NPA
T
... ... ... ...
PAES
... ... ... ...
... ... ... ...
20,000
2,00,000
50,000
70,000
3,40,000
(80,000)
60,000
40,000
5,000
4,50,000
2,60,000
1,90,000
1,05,000
85,000
5,000
90,000
(8,000)
82,000
20,000
62,000
13,500
48,500
6,500
42,000

269
11.2 EXERCISE
Re-arrange the following Balance Sheet, and Profit and Loss
Account of Eden woods Ltd. in a form suitable for analysis and calculate the following ratios:
(a) Current Ration (b) Stock Turnover Ratio
(c) Liquidity Ratio (d) Debt Equity Ratio (e) Gross Profit Ratio (f) Net Profit Ratio
Balance Sheet as at 31st March, 2003
Liabilities Rs. Assets Rs.
Bills Payable 25,000 Fixed Assets 1,25,000
Sundry Creditors 50,000 Sundry Debtors 50,000
Debentures 1,00,000 Bank Balance 25,000
Reserves 50,000 Inventory 1,25,000
Equity Share Capital 50,000
Preference Share
Capital
50,000
Total 3,25,000 Total 3,25,000
Profit and Loss Account for the year ended 31st March, 2003
Particulars Rs. Particulars Rs.
To Opening
Inventories
75,000 By Sales 5,00,000
To Purchases 1,50,000 By Closing
Inventories
1,25,000
To Manufacturing
Expenses
50,000 By Profit on sale of
Shares
25,000
To Direct Wages 1,00,000
To Administrative
Expenses
25,000
To Selling Expenses 25,000
To Loss on Sale of
Assets
27,500
To Interest on Debentures
5,000
To Net Profit 1,92,500
Total 6,50,000 Total 6,50,000
(April 96, adapted)
[Ans.: B/S (v) Total Rs. 2,50,000; (a) 2.67:1 (b) 2.5 (c) 1 : 1
(d) 0.67 : 1 or 0.4 : 1 (e) 50% (f) 38.5%]
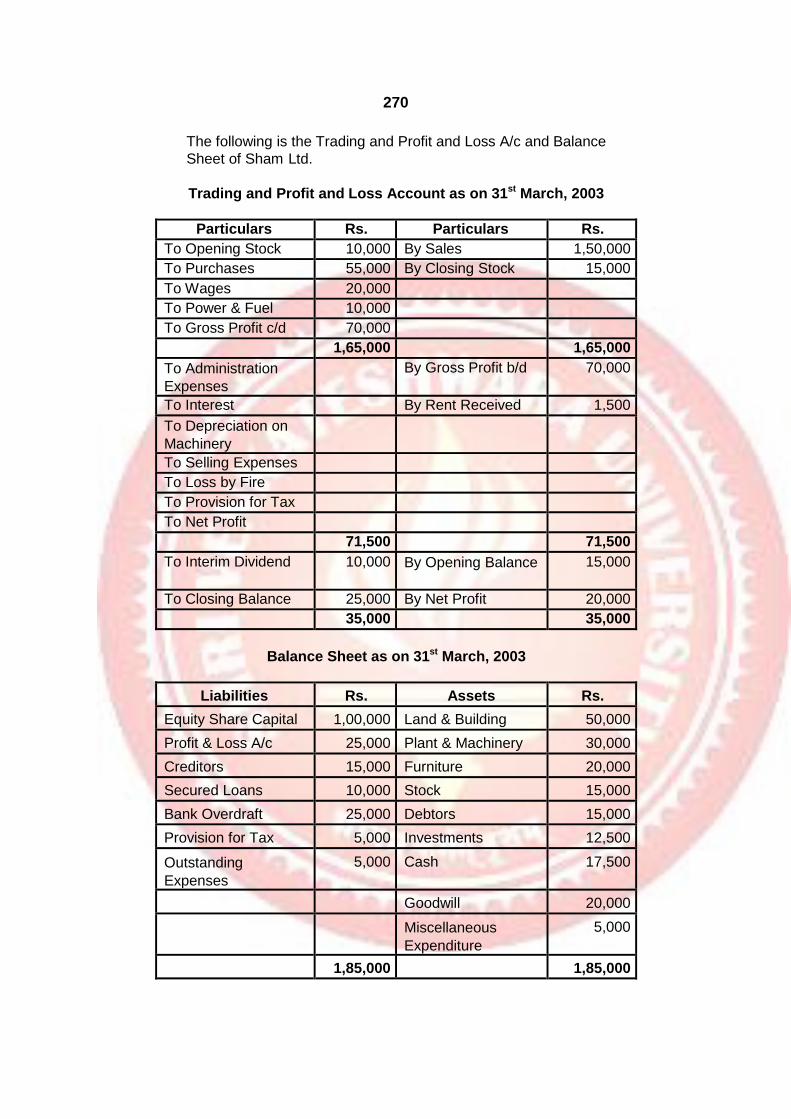
270
The following is the Trading and Profit and Loss A/c and Balance
Sheet of Sham Ltd.
Trading and Profit and Loss Account as on 31st March, 2003
Particulars Rs. Particulars Rs.
To Opening Stock 10,000 By Sales 1,50,000
To Purchases 55,000 By Closing Stock 15,000
To Wages 20,000
To Power & Fuel 10,000
To Gross Profit c/d 70,000
1,65,000 1,65,000
To Administration
Expenses
By Gross Profit b/d 70,000
To Interest By Rent Received 1,500
To Depreciation on
Machinery
To Selling Expenses
To Loss by Fire
To Provision for Tax
To Net Profit
71,500 71,500
To Interim Dividend 10,000 By Opening Balance 15,000
To Closing Balance 25,000 By Net Profit 20,000
35,000 35,000
Balance Sheet as on 31st March, 2003
Liabilities Rs. Assets Rs.
Equity Share Capital 1,00,000 Land & Building 50,000
Profit & Loss A/c 25,000 Plant & Machinery 30,000
Creditors 15,000 Furniture 20,000
Secured Loans 10,000 Stock 15,000
Bank Overdraft 25,000 Debtors 15,000
Provision for Tax 5,000 Investments 12,500
Outstanding
Expenses
5,000 Cash 17,500
Goodwill 20,000
Miscellaneous
Expenditure
5,000
1,85,000 1,85,000
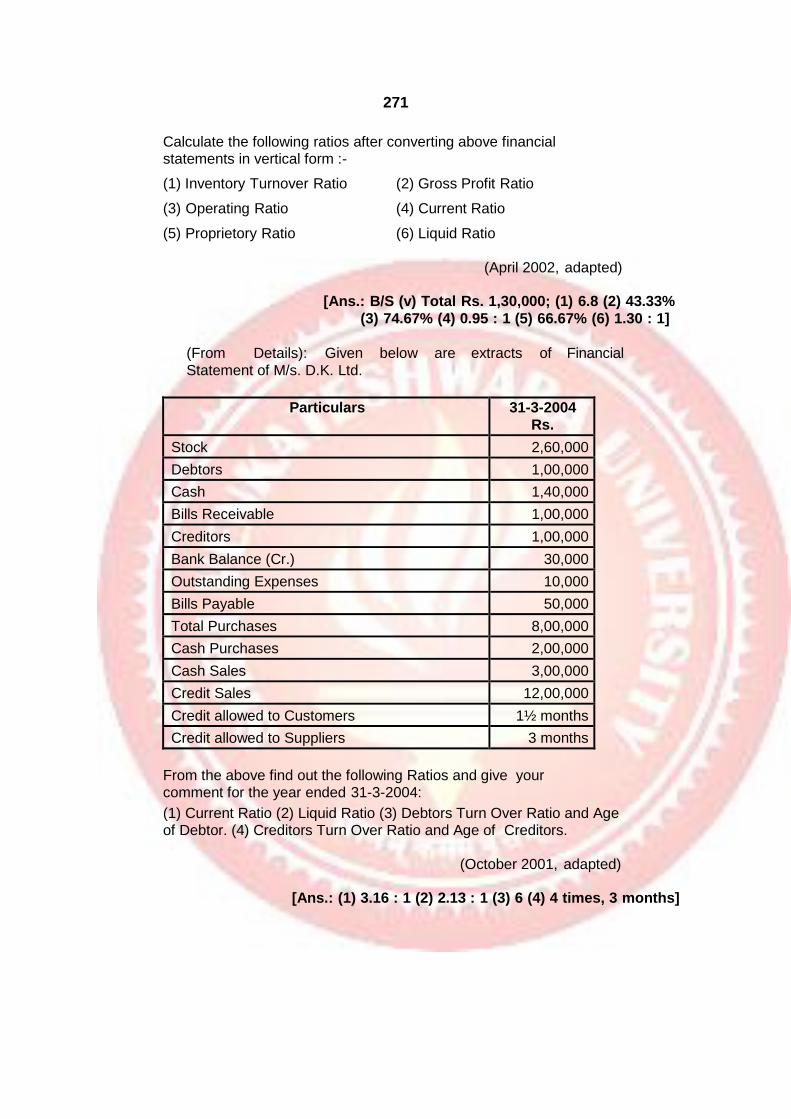
271
Calculate the following ratios after converting above financial statements in vertical form :-
(1) Inventory Turnover Ratio (2) Gross Profit Ratio
(3) Operating Ratio (4) Current Ratio
(5) Proprietory Ratio (6) Liquid Ratio
(April 2002, adapted)
[Ans.: B/S (v) Total Rs. 1,30,000; (1) 6.8 (2) 43.33%
(3) 74.67% (4) 0.95 : 1 (5) 66.67% (6) 1.30 : 1]
(From Details): Given below are extracts of Financial
Statement of M/s. D.K. Ltd.
Particulars 31-3-2004
Rs.
Stock 2,60,000
Debtors 1,00,000
Cash 1,40,000
Bills Receivable 1,00,000
Creditors 1,00,000
Bank Balance (Cr.) 30,000
Outstanding Expenses 10,000
Bills Payable 50,000
Total Purchases 8,00,000
Cash Purchases 2,00,000
Cash Sales 3,00,000
Credit Sales 12,00,000
Credit allowed to Customers 1½ months
Credit allowed to Suppliers 3 months
From the above find out the following Ratios and give your comment for the year ended 31-3-2004:
(1) Current Ratio (2) Liquid Ratio (3) Debtors Turn Over Ratio and Age of Debtor. (4) Creditors Turn Over Ratio and Age of Creditors.
(October 2001, adapted)
[Ans.: (1) 3.16 : 1 (2) 2.13 : 1 (3) 6 (4) 4 times, 3 months]
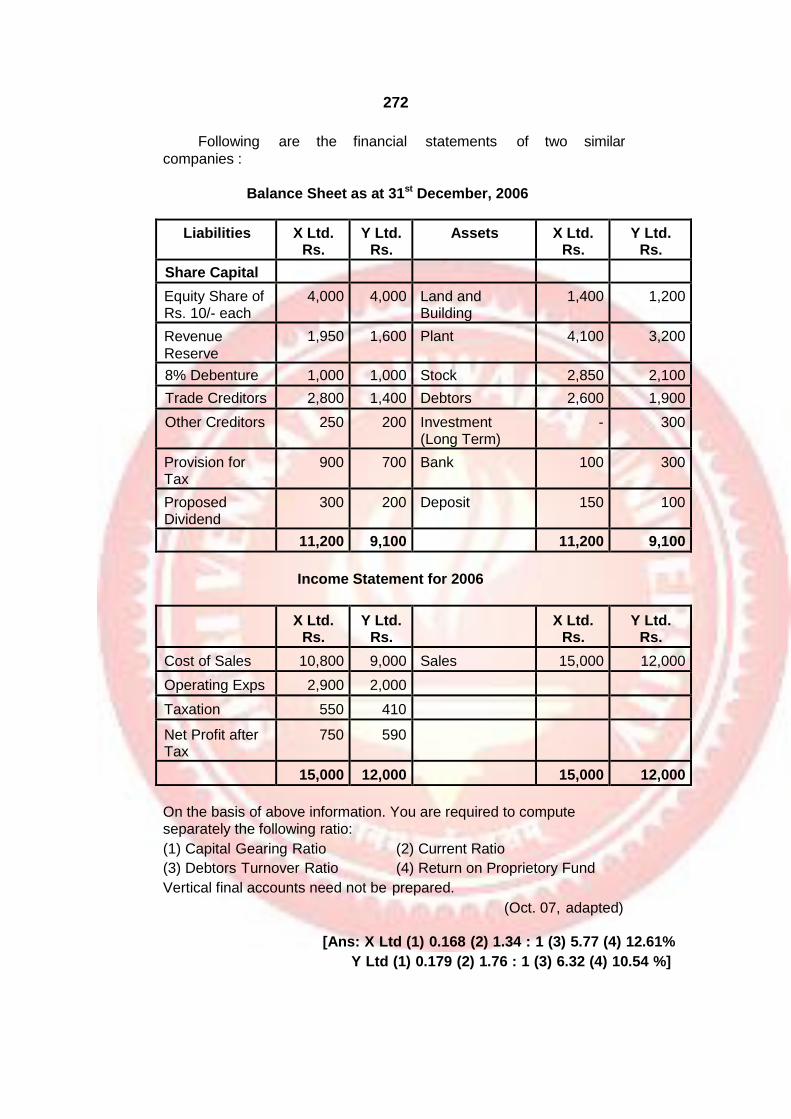
272
Following are the financial statements of two similar
companies :
Balance Sheet as at 31st December, 2006
Liabilities X Ltd. Rs.
Y Ltd. Rs.
Assets X Ltd. Rs.
Y Ltd. Rs.
Share Capital
Equity Share of Rs. 10/- each
4,000 4,000 Land and Building
1,400 1,200
Revenue
Reserve
1,950 1,600 Plant 4,100 3,200
8% Debenture 1,000 1,000 Stock 2,850 2,100
Trade Creditors 2,800 1,400 Debtors 2,600 1,900
Other Creditors 250 200 Investment (Long Term)
- 300
Provision for Tax
900 700 Bank 100 300
Proposed Dividend
300 200 Deposit 150 100
11,200 9,100 11,200 9,100
Income Statement for 2006
X Ltd. Rs.
Y Ltd. Rs.
X Ltd. Rs.
Y Ltd. Rs.
Cost of Sales 10,800 9,000 Sales 15,000 12,000
Operating Exps 2,900 2,000
Taxation 550 410
Net Profit after Tax
750 590
15,000 12,000 15,000 12,000
On the basis of above information. You are required to compute separately the following ratio:
(1) Capital Gearing Ratio (2) Current Ratio
(3) Debtors Turnover Ratio (4) Return on Proprietory Fund
Vertical final accounts need not be prepared.
(Oct. 07, adapted)
[Ans: X Ltd (1) 0.168 (2) 1.34 : 1 (3) 5.77 (4) 12.61%
Y Ltd (1) 0.179 (2) 1.76 : 1 (3) 6.32 (4) 10.54 %]
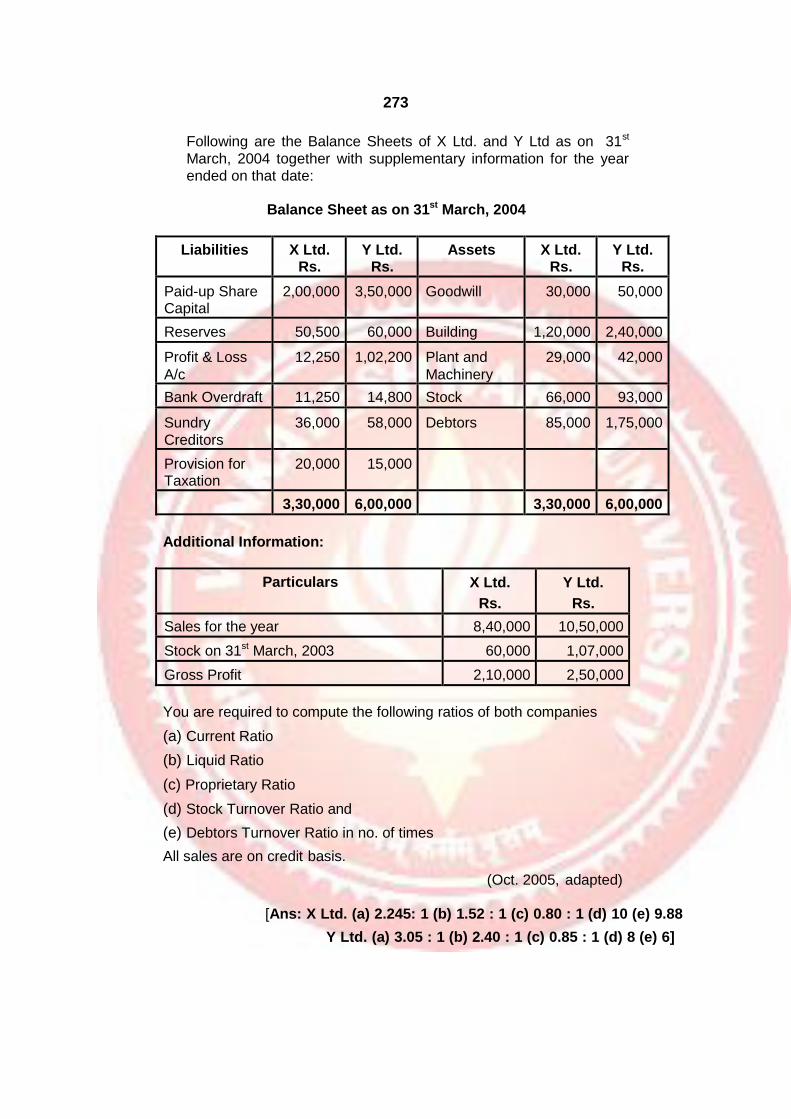
273
Following are the Balance Sheets of X Ltd. and Y Ltd as on 31st
March, 2004 together with supplementary information for the year ended on that date:
Balance Sheet as on 31st March, 2004
Liabilities X Ltd. Rs.
Y Ltd. Rs.
Assets X Ltd. Rs.
Y Ltd. Rs.
Paid-up Share Capital
2,00,000 3,50,000 Goodwill 30,000 50,000
Reserves 50,500 60,000 Building 1,20,000 2,40,000
Profit & Loss
A/c
12,250 1,02,200 Plant and
Machinery
29,000 42,000
Bank Overdraft 11,250 14,800 Stock 66,000 93,000
Sundry
Creditors
36,000 58,000 Debtors 85,000 1,75,000
Provision for Taxation
20,000 15,000
3,30,000 6,00,000 3,30,000 6,00,000
Additional Information:
Particulars X Ltd.
Rs.
Y Ltd.
Rs.
Sales for the year 8,40,000 10,50,000
Stock on 31st March, 2003 60,000 1,07,000
Gross Profit 2,10,000 2,50,000
You are required to compute the following ratios of both companies
(a) Current Ratio
(b) Liquid Ratio
(c) Proprietary Ratio
(d) Stock Turnover Ratio and
(e) Debtors Turnover Ratio in no. of times
All sales are on credit basis.
(Oct. 2005, adapted)
[Ans: X Ltd. (a) 2.245: 1 (b) 1.52 : 1 (c) 0.80 : 1 (d) 10 (e) 9.88
Y Ltd. (a) 3.05 : 1 (b) 2.40 : 1 (c) 0.85 : 1 (d) 8 (e) 6]
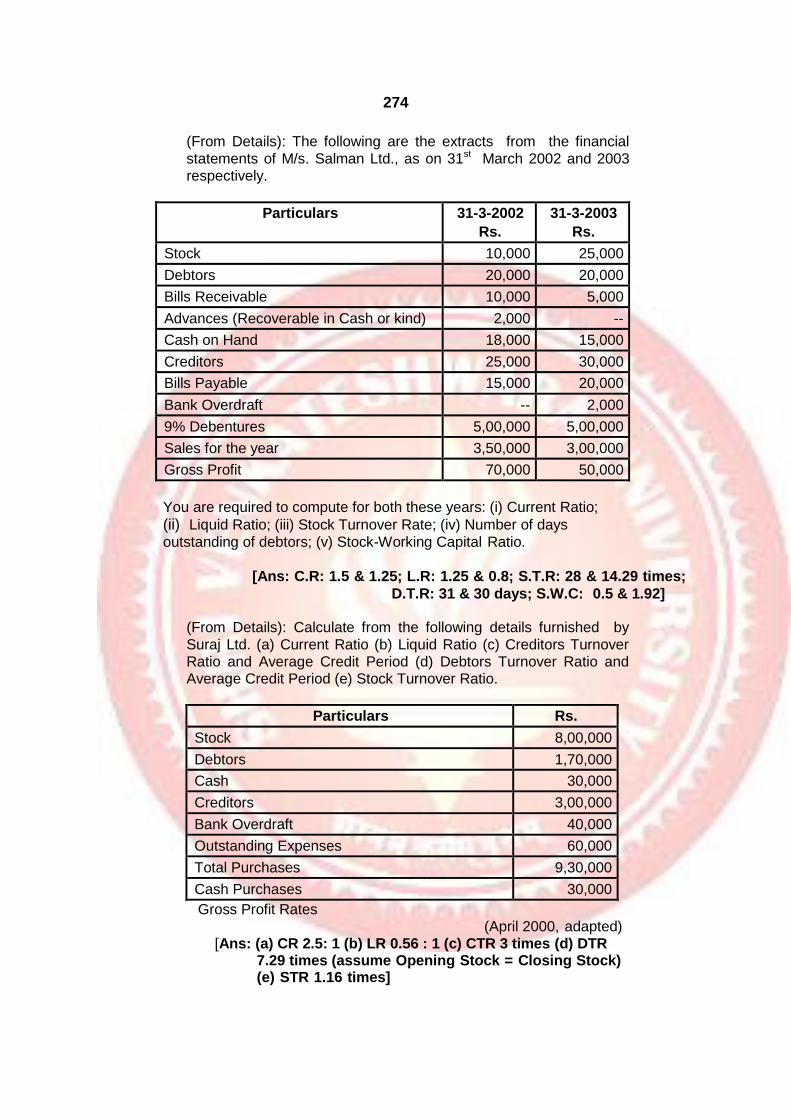
274
(From Details): The following are the extracts from the financial
statements of M/s. Salman Ltd., as on 31st March 2002 and 2003 respectively.
Particulars 31-3-2002
Rs.
31-3-2003
Rs.
Stock 10,000 25,000
Debtors 20,000 20,000
Bills Receivable 10,000 5,000
Advances (Recoverable in Cash or kind) 2,000 --
Cash on Hand 18,000 15,000
Creditors 25,000 30,000
Bills Payable 15,000 20,000
Bank Overdraft -- 2,000
9% Debentures 5,00,000 5,00,000
Sales for the year 3,50,000 3,00,000
Gross Profit 70,000 50,000
You are required to compute for both these years: (i) Current Ratio;
(ii) Liquid Ratio; (iii) Stock Turnover Rate; (iv) Number of days
outstanding of debtors; (v) Stock-Working Capital Ratio.
[Ans: C.R: 1.5 & 1.25; L.R: 1.25 & 0.8; S.T.R: 28 & 14.29 times;
D.T.R: 31 & 30 days; S.W.C: 0.5 & 1.92]
(From Details): Calculate from the following details furnished by
Suraj Ltd. (a) Current Ratio (b) Liquid Ratio (c) Creditors Turnover Ratio and Average Credit Period (d) Debtors Turnover Ratio and Average Credit Period (e) Stock Turnover Ratio.
Particulars Rs.
Stock 8,00,000
Debtors 1,70,000
Cash 30,000
Creditors 3,00,000
Bank Overdraft 40,000
Outstanding Expenses 60,000
Total Purchases 9,30,000
Cash Purchases 30,000
Gross Profit Rates (April 2000, adapted)
[Ans: (a) CR 2.5: 1 (b) LR 0.56 : 1 (c) CTR 3 times (d) DTR 7.29 times (assume Opening Stock = Closing Stock) (e) STR 1.16 times]

275
Calculate from the following details furnished by Pardeshi Ltd.:
(a) Current Ratio
(b) Liquid Ratio
(c) Credit Turnover Ratio and Average Credit Period
(d) Debtors Turnover Ratio and Average Credit Period
(e) Stock Turnover Ratio
Rs.
Stock 1,00,000
Debtors 1,40,000
Cash 60,000
Creditors 1,60,000
Bank Overdraft 30,000
Outstanding Expenses 10,000
Total Purchases 6,60,000
Cash Purchases 20,000
Gross Profit Ratio 33 1 % 3
(Oct. 2000, adapted) [Ans: (a) 1.5: 1 (b) 1.18 : 1 (c) 4 times (d) 7.07 times (e) 6.6 times]
From the following information, relating to a limited company,
prepare a statement of Proprietor’s Funds.
(i) Current Ratio 2
(ii) Liquid Ratio 1.5
(iii) Fixed Assets /Proprietor’s Funds 3/4
(iv) Working Capital Rs. 75,000
(v) Reserves and Surplus Rs. 50,000
(vi) Bank Overdraft Rs. 10,000
There were no long-term loans or fictitious assets.
All workings must form part of your answer.
[Ans: (i) Shareholder’s Funds – Rs. 3,00,000
(ii) Fixed Assets – Rs. 2,25,000 (iii) Working Capital – Rs. 75,000)
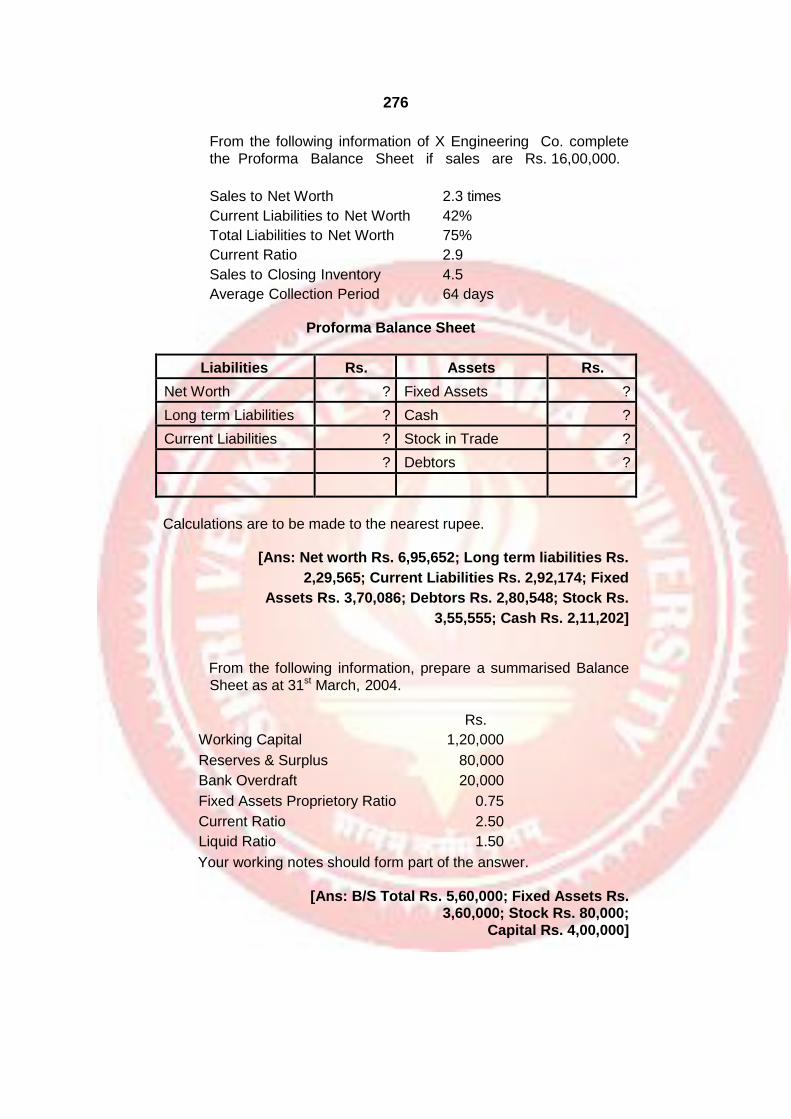
276
From the following information of X Engineering Co. complete
the Proforma Balance Sheet if sales are Rs. 16,00,000.
Sales to Net Worth 2.3 times
Current Liabilities to Net Worth 42%
Total Liabilities to Net Worth 75%
Current Ratio 2.9
Sales to Closing Inventory 4.5
Average Collection Period 64 days
Proforma Balance Sheet
Liabilities Rs. Assets Rs.
Net Worth ? Fixed Assets ?
Long term Liabilities ? Cash ?
Current Liabilities ? Stock in Trade ?
? Debtors ?
Calculations are to be made to the nearest rupee.
[Ans: Net worth Rs. 6,95,652; Long term liabilities Rs.
2,29,565; Current Liabilities Rs. 2,92,174; Fixed
Assets Rs. 3,70,086; Debtors Rs. 2,80,548; Stock Rs.
3,55,555; Cash Rs. 2,11,202]
From the following information, prepare a summarised Balance
Sheet as at 31st March, 2004.
Rs.
Working Capital 1,20,000
Reserves & Surplus 80,000
Bank Overdraft 20,000
Fixed Assets Proprietory Ratio 0.75
Current Ratio 2.50
Liquid Ratio 1.50
Your working notes should form part of the answer.
[Ans: B/S Total Rs. 5,60,000; Fixed Assets Rs. 3,60,000; Stock Rs. 80,000;
Capital Rs. 4,00,000]

277
Based on the following information of the financial ratios,
prepare Balance Sheet of Star Enterprises Ltd. as on December 31st, 2002. Explain your working and assumptions.
Current Ratio 2.5
Liquidity Ratio 1.5
Net Working Capital Rs. 6,00,000
Stock Turnover Ratio 5
Ratio of Gross Profit to Sales 20%
Turnover Ratio to Net Fixed Assets (COGS /FA) 2
Average Debt Collection Period 2.4 months
Fixed Assets to Net Worth 0.80
Long-term Debt to Capital and Reserve 7/25
Ans: Balance Sheet as on December 31st 2002
Liabilities Rs. Assets Rs.
Share Capital and Reserves
12,50,000 Fixed Assets (Cost)
Long-term Debts 3,50,000 Less Depreciation 10,00,000
Current Liabilities 4,00,000 Current Assets:
Stock in Trade 4,00,000
Sundry Debtors 5,00,000
Cash 1,00,000
20,00,000 20,00,000
From the following information prepare a Balance Sheet with as
many details as possible.
(1) Current Ratio 2.5 : 1
(2) Liquid Ratio 1.5:1
(3) Fixed Assets / Proprietor’s Fund 0.75
(4) Working Capital Rs. 60,000
(5) Reserves and Surplus Rs. 40,000
(6) Bank Overdraft Rs. 10,000
(7) There is no long-term loan or fictitious asset.
Ans:
Balance Sheet
Liabilities
Rs. Assets
Rs.
Share Capital 2,00,000 Fixed Assets 1,80,000
Reserves and Surplus 40,000 Current Assets
Current Liabilities Liquid Assets 45,000
Bank Overdraft 10,000 Stock 55,000 1,00,000
Quick Liabilities 30,000 40,000
2,80,000 2,80,000

278
Q.14 From the following information, prepare a summarised
Balance Sheet as at 31st March, 2002.
Stock Turnover
Fixed Assets Turnover Ratio
(Sales ÷ Fixed Assets)
6
4
Capital Turnover Ratio (Sales ÷ Capital) 2
Gross Profit Ratio Debt
Collection Period Gross
Profit
20% 2 months
Rs. 60,000
Ans:
Closing Stock was Rs. 5,000 in excess of opening stock Creditors 49,000
All workings should form part of your answer.
Balance Sheet as on 31-3-2002
Liabilities Rs. Assets
Rs.
Capital 1,50,000 Fixed Assets 75,000
Creditors 49,000 Debtors 50,000
Closing Stock 42,500
Cash & Bank (Bal. Fig.)
31,500
1,99,000 1,99,000
Q.15 Shri Devdas asks you to prepare his Balance Sheet from the
particulars furnished hereunder:
Gross Profit margin 20% Stock velocity: 6
Capital Rs. 1,50,000
Fixed Assets Rs. 75,000 Debt collection period 2 months Creditors payment period 73 days
Gross Profit was Rs. 60,000 Excess of closing stock over opening stock was Rs. 5,000 Difference in Balance Sheet represents bank balance.
[Ans: Bank – Rs. 31,500]

279
12
WORKING CAPITAL MANAGEMENT
Unit Structure:
Objectives
Introduction
Meaning and Definition of working capital
Working Capital Cycle
Classification of working capital
Factors determining working capital requirements
Need for working capital (Importance of working capital)
Working capital management
Changes in working capital
Key points
Additional readings
Exercise
OBJECTIVES
After studying this chapter you should be able to understand
Concept of Working Capital
Nature of Working Capital
Need for Working Capital
Working Capital Cycle
Classification of Working Capital
Determinants of Working Capital
INTRODUCTION
Every organization requires Fixed Capital for purchase of fixed assets viz. Land and Building, Plant and Machinery, Furniture, Vehicles etc. In addition to fixed capital an organisation also requires additional capital for financing day to day activities. Such

280
capital which is required for financing day to day activities in the business is called Working Capital.
Working Capital is that part of the funds of a business which is
used for day to day operation. It is the money required to keep the
business running smoothly. (It is required for smooth conduct of business activities.) In the absence of Working Capital, fixed assets can not be employed gainfully. It is the working capital which decides success or failure of an organisation. It is the life blood of an organisation.
Forecasting Working Capital and Control of Working Capital is a
continuous process and therefore, part of parcel of the overall management of the business.
MEANING AND DEFINITION OF WORKING
CAPITAL
The term Working Capital has been defined by different authors in different ways.
According to “Hoagland”, “Working Capital is descriptive of that
capital which is not fixed. But, the more common use of Working Capital
is to consider it as the difference between the book value of the current assets and the current liabilities.
Gerestenberg defines Working Capital as, “Circulating capital
means, Current Assets of a Co. that are changed in the ordinary course of business from one form to another as for example from cash to inventories, inventories to receivables and receivables to cash.”
The accounting principles Board of the American Institute
of Certified Public Accountants define Working Capital as,
“Working Capital is represented by the excess of current assets over current liabilities and identifies the relatively liquid portion of the total enterprise, capital which constitutes a margin or buffer for maturing obligation within the ordinary operating cycle of the business.”
From the above definitions, Working Capital means the excess
of Current Assets over Current Liabilities. Working Capital is the amount of net Current Assets. It is the investments made by a business organisation in short term Current Assets like Cash, Debtors, Bills receivable etc.

281
Current Assets are those assets which will be converted into Cash or will be realised within a year. These assets will be liquidated in the near future.
Current liabilities are those liabilities which will have to be paid
within a year and include such income received in advance for which are to be given within 12 months.
Working Capital = Current Assets – Current Liabilities
WORKING CAPITAL CYCLE
Working Capital cycle is also known as operating cycle concept. This concept is based on continuity of flow of funds through business operations. This flow of value is caused by different operational activities during a given period of time. The operational activities of an
organisation may include :
a) Purchase of raw materials.
b) Conversion of raw materials into finished products.
c) Sale of finished products.
d) Realisation of accounts receivables.
The operating cycle of a manufacturing concern begins on the
day it purchases raw material to produce the goods and ends on the day it receives the sale price from debtors. The period between these two days is the duration of the entire operating cycle.
Operating cycle of a manufacturing organisation
Cash
Purchase of Raw Materials
Collection from Debtors (Bills receivables)
Work in Progress
Finished goods
Operating cycle of a Trading Organisation :

282
In case of trading organisation, operational activities include:
1) Purchase of finished goods.
2) Sale of finished goods on cash or credit.
3) Collection from debtors (Bills Receivables).
Operating Cycle
Cash
Purchase of finished goods
Collection from Debtors (Bills receivables)
Sales of Finished goods
When the goods are sold on credit basis, the sale of goods cannot be converted into cash instantly because of time lag between sales and realization of cash. Due to time lag between sales and realization of receivables, there is a need for sufficient Working Capital to deal with the problem which arises due to lack of immediate realization of cash against goods sold. The operating cycle is the length of time required for conversion of cash into raw material, raw material into work in progress, work in progress into finished goods, finished goods into bills receivables, bills receivables into cash and the same cycle repeats. Therefore operating cycle is a continuous process.
CLASSIFICATION OF WORKING CAPITAL
Working Capital can be classified into :
1) Gross and Net Working Capital.
2) Permanent and Temporary Working Capital.
3) Balance Sheet and Cash Working Capital.
4) Positive and Negative Working Capital.
1) Gross and Net Working Capital
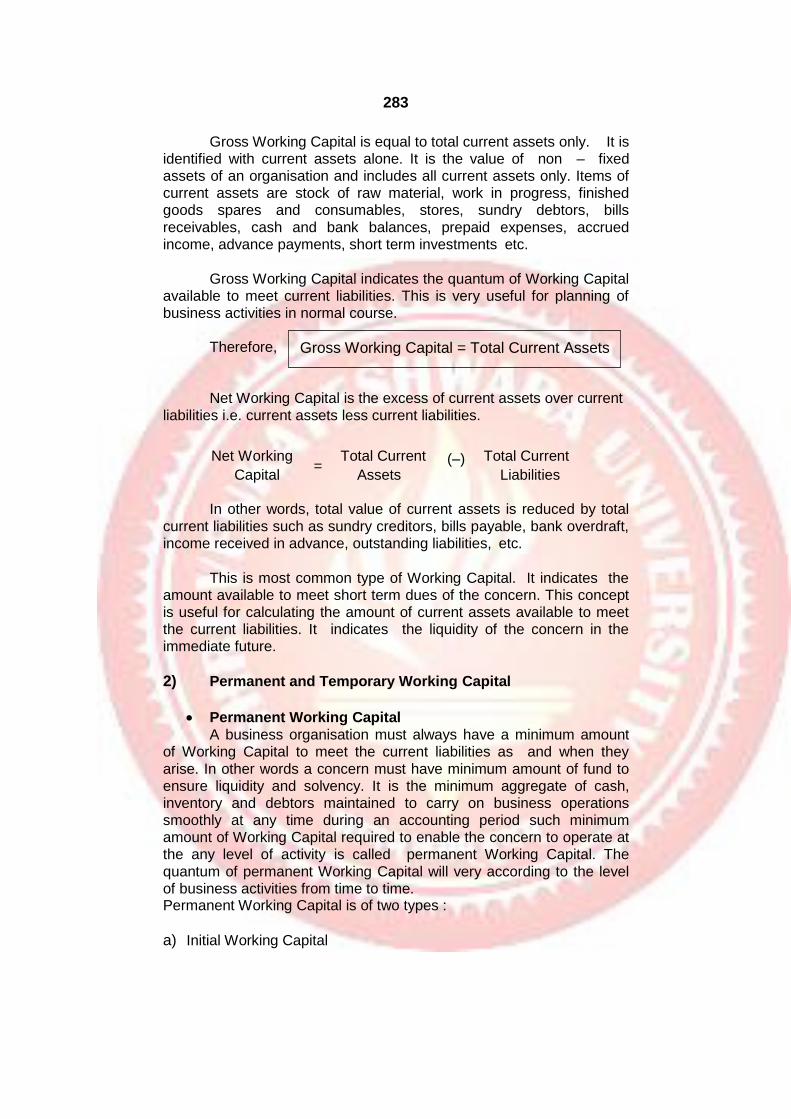
283
Gross Working Capital is equal to total current assets only. It is identified with current assets alone. It is the value of non – fixed assets of an organisation and includes all current assets only. Items of current assets are stock of raw material, work in progress, finished goods spares and consumables, stores, sundry debtors, bills
receivables, cash and bank balances, prepaid expenses, accrued income, advance payments, short term investments etc.
Gross Working Capital indicates the quantum of Working Capital
available to meet current liabilities. This is very useful for planning of business activities in normal course.
Therefore,
Net Working Capital is the excess of current assets over current
liabilities i.e. current assets less current liabilities.
Net Working = Total Current
(–) Total Current
Capital Assets Liabilities
In other words, total value of current assets is reduced by total
current liabilities such as sundry creditors, bills payable, bank overdraft, income received in advance, outstanding liabilities, etc.
This is most common type of Working Capital. It indicates the
amount available to meet short term dues of the concern. This concept is useful for calculating the amount of current assets available to meet the current liabilities. It indicates the liquidity of the concern in the immediate future.
2) Permanent and Temporary Working Capital
Permanent Working Capital
A business organisation must always have a minimum amount of Working Capital to meet the current liabilities as and when they
arise. In other words a concern must have minimum amount of fund to ensure liquidity and solvency. It is the minimum aggregate of cash, inventory and debtors maintained to carry on business operations smoothly at any time during an accounting period such minimum amount of Working Capital required to enable the concern to operate at the any level of activity is called permanent Working Capital. The
quantum of permanent Working Capital will very according to the level of business activities from time to time. Permanent Working Capital is of two types :
a) Initial Working Capital
Gross Working Capital = Total Current Assets

284
b) Regular Working Capital
a) Initial Working Capital
This is the amount of Working Capital required at the inception
of an organisation. In the initial stages, when the revenues are not regular, it may be difficult for a company to obtain credit from banks and at the same time it may be required to grant credit to its customers. In such cases, adequate Working Capital is required to activate the
circulation of capital and keep it moving till the collection from debtors and other cash receipts exceed the payment. Therefore, it is the Working Capital in the initial stage to start the business and to commence the operating cycle.
b) Regular Working Capital :
This is the amount of Working Capital required for the continuous operations of an enterprise. It refers to the excess of current assets over current liabilities. Every organisation has to maintain a
minimum stock of materials, finished goods and cash to ensure its smooth working and to meet its immediate obligations. This is the minimum amount of capital required to enable the concern to operate at the lowest level of activity. Such minimum amount of Working Capital is called Permanent Working Capital or Core Working Capital.
Then Permanent Working Capital is the quantum of funds
required permanently for the production of goods and services on a continuing basis to satisfy the demands of customers Permanent Working Capital has following features.
a) It is constantly changing. They change from one current asset to
another as in case of raw materials. Raw materials as they are in process, become semi finished goods, then finished goods and when they are sold become debtors, debtors when realized become cash and so on.
b) The size of permanent Working Capital will increase as long as the business is growing and expanding.
c) Permanent Working Capital is different from fixed assets which are sunk in the business operations and retain their firm for a long period.
Temporary or Variable Working Capital
If the business organisation wants to increase its level of activity and produce and sell more goods, naturally it will need

285
additional amount of Working Capital. If the increase in level of activity is temporary or seasonal, the additional Working Capital required is called Temporary Working Capital.
The amount of Temporary Working Capital varies with the level
of activity (level of production). When the production is at higher level, larger Temporary Working Capital is needed, when the production level
is lower, smaller amount of Temporary Working Capital is required. Therefore, Temporary Working Capital is also called as Variable or Fluctuating Working Capital.
Sometimes temporary Working Capital may be Seasonal
Working Capital. It is the amount of Working Capital required at stated intervals to meet the changing seasonal requirements. When the season approaches, business needs more funds to meet the seasonal pressure of demand. For e.g. Sugar factories require large amount of Working Capital during peak season and much smaller amount of Working Capital once the season is over.
Temporary Working Capital can be financed through temporary
sources of finance. E.g. short term loans, deposits, bank overdraft etc.
3) Balance sheet and Cash Working Capital
Balance Sheet Working Capital
Working Capital is determined on the basis of the balances of
current assets and current liabilities as per the closing balance sheet of the business. Such Working Capital which is computed on the basis of book values of current assets and current liabilities is called Balance
Sheet Working Capital. Therefore, Balance Sheet Working Capital shows the amount of Net Current Assets as on the last day of accounting year of a concern. This concept of Working Capital helps in judging the liquidity and solvency of a concern.
Cash Working Capital
It is that part of gross Working Capital which is essentially in
liquid term. It is available in cash or cash resources. It is calculated from the items appearing in the Balance sheet. It shows the real flow of money at a particular time. It is considered to be the most realistic approach in Working Capital management. Cash Working Capital indicates the adequacy of the cash flow.
4) Positive and Negative Working Capital
Positive Working Capital
286
When current assets exceed current liabilities, the Working Capital is said to be positive Working Capital. In other words when current assets are more than current liabilities, the net current asset is a positive figure and hence it is called Positive Working Capital. Such Working Capital indicates favourable liquidity and solvency position of
the business.
Negative Working Capital
When the current assets are less than the current liabilities, the
Working Capital is said to be Negative Working Capital. In other words when current assets are less than current liabilities the net current asset is negative figure and hence it is called Negative Working Capital. Such Working Capital indicates lack of liquidity and adverse solvency position of the business.
FACTORS DETERMINING WORKING CAPITAL REQUIREMENTS
The amount of Working Capital required by a business
organisation depends on many factors. They are as follows.
1) Nature of Business : The quantum of Working Capital required by
a business organisation is related to the type and nature of its business activities. Public utilities (like railway companies) require less Working Capital as they sell services on cash basis only. But a trading organisation requires proportionately larger amount of Working Capital as it has to carry large inventories and allow credit
to customers. Similarly, a manufacturing concern requires more Working Capital as compared to a firm engaged in trading. However, the requirement of Working Capital varies from industry to industry and from time to time in the same industry.
2) Size of Business : It is an important factor for determining the
proportion of Working Capital. If the size of the business organisation in big, it require more Working Capital. On the other hand, small scale organisation requires less amount of Working Capital.
3) Production Policies : Production policies of a business
organisation exert considerable influence on the requirement of
Working Capital. But production policies depend on the nature of product. The level of production, decides the investment in current assets which in turn decides the quantum of working capital required.

287
4) Terms of Purchase and Sale : A business organisation making
purchases of goods on credit and selling the goods on cash terms would require less Working Capital whereas an organisation selling the goods on credit basis would require more Working Capital. If the payment is to be made in advance to suppliers, then large amount of Working Capital would be required.
5) Production Process : If the production process requires a long
period of time, greater amount of Working Capital will be required. But, simple and short production process requires less amount of
Working Capital. If production process in an industry entails high cost because of its complex nature, more Working Capital will be required to finance that process and also for other expenses which very with the cost of production whereas if production process is simple requiring less cost, less Working Capital will be required.
6) Turnover of Circulating Capital : Turnover of circulating capital
plays an important and decisive role in judging the adequacy of Working Capital. The speed with which circulating capital completes its cycle i.e. conversion of cash into inventory of raw materials, raw materials into finished goods, finished goods into debts and debts into cash decides the Working Capital requirements of an
organization. Slow movement of Working Capital cycle requires large provision of Working Capital.
7) Dividend Policies : Dividend policies of a business organisation
also influence the requirement of Working Capital. If a business is following a liberal dividend policy, it requires high Working Capital to pay cash dividends where as a firm following a conservative dividend policy will require less amount of Working Capital.
8) Seasonal Variations : In case of seasonal industries like Sugar,
Oil mills etc. More Working Capital is required during peak seasons as compared to slack seasons.
9) Business Cycle : Business expands during the period of prosperity
and declines during the period of depression. More Working Capital is required during the period of prosperity and less Working Capital is required during the period of depression.

288
10) Change in Technology : Changes in Technology as regards
production have impact on the need of Working Capital. A firm using labour oriented technology will require more Working Capital to pay labour wages regularly.
11) Inflation : During inflation a business concern requires more
Working Capital to pay for raw materials, labour and other expenses. This may be compensated to some extent later due to possible rise in the selling price.
12) Turnover of Inventories : A business organisation having low
inventory turnover would require more Working Capital where as a business having high inventory turnover would require limited or less Working Capital.
13) Taxation Policies : Government taxation policy affects the quantum
of Working Capital requirements. High tax rate demands more amount of Working Capital.
14) Degree of Co-ordination : Co-ordination between production and
distribution policies is important in determining Working Capital requirements. In the absence of co-ordination between production and distribution policies more Working Capital may be required.
NEED FOR WORKING CAPITAL (IMPORTANCE OF WORKING CAPITAL)
‘Working Capital’ discussed in the earlier paragraphs mean excess of current assets over current liabilities. Such Working Capital is required to smooth conduct of business activities. It is as important as blood to body. An organisation’s profitability depends on the quantum of
Working Capital available to it. Adequate Working Capital is a source of energy to any business organisation. It is the life blood of an organisation.
The following points will highlight the need of Working Capital.
Adequate Working Capital :
a) Enables a company to meet its obligations.
b) Ensures the credit standing of a company.
c) Facilitates obtaining Credit from banks without any difficulty.
d) Ensures solvency of a company.

289
e) Enables a company to make prompt payments to its creditors and thereby take advantage of cash and quantity discounts offered by them.
f) Enhances the goodwill of a company as it can meet its operational
expenses and maturing liabilities in time.
g) Improves the prospects of prosperity and progress of a company.
h) Enables an organisation to tide over difficult periods successfully.
Thus, adequate Working Capital is an important factor for
prosperity and smooth running of a business organisation. It is rightly called as the “backbone” of the financial structure of a business
organisation.
WORKING CAPITAL MANAGEMENT
Working Capital as it is explained in the earlier paragraphs, means excess of current assets over current liabilities. Working Capital management means all aspects of managing and controlling current assets and current liabilities. It is an attempt to solve the problems that arise in the management of current assets and current liabilities.
The main objective of Working Capital management is to
manage the current assets and current liabilities of a business efficiently with the idea to bring about a satisfactory level of Working Capital so that the business can run smoothly. It aims to strike a judicious balance between individual items of current assets and current liabilities and
thereby achieves a reasonable safety margin.
Working Capital management policies exercise strong influence
on a company’s profitability, liquidity and its structural health. Estimating the amount of Working Capital required and identification of the source
from which the required funds have to be raised, are the two main objectives of Working Capital management. Thus Working Capital management aims at best utilization of scarce resources to bring about satisfactory level of Working Capital and so that the business can run smoothly.
CHANGES IN WORKING CAPITAL
Working Capital means excess of current assets over current liabilities. It ensures the solvency of a company. It also ensures the credit standing of a company. But if the value of current assets increases, the Working Capital also increases and if

290
value of current liabilities increases the Working Capital decrease. Therefore, change in current assets and current liabilities also change the Working Capital of the organisation.
The following list shows the effect of change in current
assets or current liabilities on the Working Capital.
Change in Current Assets or Current Liabilities
Effects on Working Capital
Increase in Current Assets Increase in Working Capital
Decrease in Current Assets Decrease in Working Capital
Increase in Current Liabilities Decrease in Working Capital
Decrease in Current Liabilities Increase in Working Capital
Realization from Debtors No change in Working Capital
Obtaining Bills Receivable from Debtors No change in Working Capital
Bills payable issued to Creditors No change in Working Capital
Sales of goods on credit No change in Working Capital
Purchase of Stocks on credit No change in Working Capital
Payment of cash to Creditors No change in Working Capital
Payments of Cash against Bills Payable No change in Working Capital
Collection of Cash on Bills Receivable No change in Working Capital
KEY POINTS
Working Capital is excess of Current Assets over Current Liabilities.
Current Assets include Stock, Debtors, Work in Progress, Bills Receivables, Cash / Bank, Prepaid Expenses.
Current liabilities include Creditors, Bills Payable, Bank Overdraft, and Outstanding Expenses.
Operating cycle of a manufacturing organisation includes operational activities like purchase of raw materials, payment of wages and expenses, production of finished goods, sale of finished goods on cash and credit, collection from debtors.
Operating cycle of a trading organisation includes operational activities like purchase of finished goods, sale of finished goods on cash and credit, collection from debtors.
Classifications Working Capital
o Gross and Net Working Capital
o Permanent and Temporary Working Capital
291
o Balance Sheet and Cash Working Capital
o Positive and Negative Working Capital
o Determinants of Working Capital
ADDITIONAL READINGS
1) Introduction to Management Accounting by Chopade and Chaudhari
2) Introduction to Management Accounting by Ainapure.
EXERCISE
1) Define Working Capital. Explain the importance of Working Capital in business.
2) What is Working Capital and what are the types of Working Capital?
3) What is Working Capital? Explain the factors determining
Working Capital requirements.
4) Write short notes on :
a) Permanent and Temporary Working Capital
b) Gross and Net Working Capital
c) Balance Sheet and Cash Working Capital
d) Positive and Negative Working Capital.
5) What is Working Capital? Explain the need for Working Capital.

292
13
BUDGETING-I
Unit Structure:
Objectives
Meaning of Budget
Purpose of Budget
Budgetory Control
Preparation of Budget & Types
Methods of Preparation of Cash Budget
Exercises
OBJECTIVES
After studying the unit the students will be able to:
Understand the meaning of Budget and Budgetary control.
Know the purpose of Budget.
Explain the types of Budget.
Understand how to prepare cash budget.
MEANING OF BUDGET
Budget means a financial and quantitative statement prepared and
approved prior to a defined period of time. It is plan of expected achievements
based on most efficient operating standards in effect. It may be considered as a
guide.
PURPOSE OF BUDGET
1. Planning
2. Co-ordination
3. Control
1. Planning – It helps in combining ideas of different management levels.
So that maximum profitability is achieved.
293
2. Co-ordination – It brings different people together in accomplishing the
organizational goals.
3. Control – It helps in comparing the actual results with the estimates and
putting controls wherever required.
BUDGETORY CONTROL
It is a system of planning and controlling costs. It helps in comparing
the actual results with budgeted estimates to secure by individual action the
objective of that policy or to provide basis for its revision.
STEPS IN BUDGETORY CONTROL
1. ESTABLISHMENT OF BUDGETS – Budgets are prepared for each
division and are well co-ordinated with each other to prepare the
master budget of a firm.
2. MEASUREMENT OF ACTUAL PERFORMANCE – The actual
results are measured to compare with the budgets.
3. COMPARISON AND VARIANCES – The actual results after
comparing with standards, deviations are work out known as variances.
4. ANALYSIS OF CAUSES OF VARIATION – The deviations
between budgeted and actual results are studied and analysed help in
taking the right action in right time.
PREPARATION OF BUDGETS AND TYPES
MASTER BUDGET – It is defined as summary budget which
includes different functional budgets and which is finally approved
adopted and employed. It is defined as a budget which summarises all
functional budgets when all functional budgets are prepared they are
summarized to produce.
i. Profit & Loss Account and Profit & Loss Appropriation Account.
ii. Balance Sheet.
Master Budget takes the form of budged Profit & Loss Account and
Balance Sheet. It is overall business plan and familiar to financial statements.
The only difference is that the accountant here deals with expected future data
rather than historical data.
The budget committee will prepare the master budget based on the
functional budget. Once it is approved by the committee it becomes the target
for the firm during the budget period.

294
FIXED BUDGET – Budget prepare at single level of activity are
referred to as Fixed Budget. Such budgets focus only on a specific
activity and a specific level. All adjustments are made considering only
this level of activity.
FLEXIBLE BUDGET – Flexible Budget estimates cost of several
level of activities. Instead of one estimates it contains several estimates in
different assumed circumstances. The construction of flexible budget is
similar to fixed budget is based on cost and other business operations at
one level, the flexible budget consider several operations. The essence of
flexible budget is the presentation of estimated cost date in a manner that
permits there determination at various levels of volume. This means that
all costs must be identified into fixed and variable. Fixed cost remain
unchanged. They are fixed for a relevant range of volume for a given
budget period.
Variable cost fluctuate in direct proportion to the activity/ volume with
in relevant range for a given budget period. Mixed cost contents both fixed and
variable element.
CASH BUDGET – A Cash Budget is a projected cash transaction in
future that is utilized in controlling actual receipts and payments by
mending for the variances. It starts with a given ‘Cash Balance’ which
may be either big or small. But the said balance is, in any case, desired to
be ‘the optimum balance’. The sign of optimality for a given cash balance
is obviously its ability to produce the highest rate of return for the
minimum cost for mainly the said cash balance.
The main aim of Cash Budget is to ascertain whether there is excess or
deficit of cash. It involves different steps.
i. The First element is selection of time period to be covered which is known
as planning horizon. This coverage will differ from firm to firm
depending upon its nature and degree of accuracy.
ii. The Second element is the factors affecting the cash flows. Non cash items
such as, depreciation are excluded from Cash Budget. The cash flow is
affected by two factors operating and financial. The operating category
includes cash flow generated by operations of the firm and are known as
operating cash flows. The other category is known as financial cash flow.
a) Operating Cash Flow contains the following.
INFLOW OUTFLOW

295
1. Cash Sales 1. Cash Purchases
2. Collection from Debtors 2. Payment to Creditors
3. Sale of Assets 3. Purchase of Assets.
4. Operating Expenses Paid
b) Financial Cash Flow contains the following.
INFLOW OUTFLOW
1. Loans taken 1. Repayment of Loan
2. Sale of Investments 2. Purchase of Investment
3. Issue of Shares 3. Redemption of Shares
4. Interest, Divided, 4. Interest, Dividend, Rent Paid
Rent Received.
METHODS OF PREPARATION OF CASH
BUDGET
Methods used for cash forecasting – There are two recognized
ways of preparing a cash forecasting.
The Receipt & Payment Method.
The Income Statement Cash Flow Method (Adjusted Profit & Loss
method)
THE RECEIPT AND PAYMENT METHOD – Under this method,
all expected cash receipts and payments during the period; under
consideration are taken into account. The expected cash balance of a
week or month will be equivalent to the difference between total expected
Cash Receipts including opening balance, if any, and total expected Cash
Payment during that period. The budget is generally prepared from
various plans.
i. Cash Receipts from Customers, based on sales forecast, the term of sale,
lag in payment etc. are generally taken into consideration.
ii. Cash Receipts from other sources, such as dividend on trade investments,
rent, issue of capital, sale of; investment and fixed assets etc.
iii. Cash requirements for materials, wages and salaries and overhead expenses
based on purchasing, personnel and overhead budgets. The policy of the
business with regard to the payment of supplier’s accounts, the term of
cash discount, the lag in payment of wages etc. are given due
consideration.

296
iv. Cash requirements for capital expenditure as per capital expenditure
budget.
v. Cash requirement for other purposes, such as payment of dividend, income
tax, fines, penalties etc.
FORMAT OF CASH BUDGET (Monthly / Quarterly)
Month/
Quarter
1 2 3 4 Total
Particulars
Opening Balance
Cash Sales
Collection from Debtors
Income from Investments
Loans
Share Capital
Others
Total Receipts (A)
Cash Purchases
Creditors
Salaries & Wages
Overhead Expenses
Dividend
Income Tax
Capital
Expenditure
Repayment of
Loan Others
Total Payments (B)
Closing Balance (A-B)
x x
y y
THE INCOME STATEMENT CASH FLOW METHOD
(ADJUSTED PROFIT & LOSS ACCOUNT) –

297
This method is based both on cash and non-cash transactions. Under
this method, budgeted net profit is adjusted by adding back non- cash charges
and deducting non-cash credits and adding or deducting changes in assets or
liability accounts which affect cash. The theory is based upon the basic
assumption that profit will be equivalent to cash, or in other words, the
earning of profit brings equal amount of cash into the business. This also leads
one to another assumption that the business will remain static. That is, there
will not be wearing out or expansion of assets; balances of debtors, creditors,
stock etc will remain unchanged. So that total cash available for distribution
would be equal to the profit earned. But in practice a business does not remain
stationery so that an adjustment will have to be made in respect of many items
like fluctuations of stock, appropriation of profit, provisions, accruals etc.
Thus, the preparation of a cash budget under this method depends on the
availability of the following information :-
a. Budgeted Profit & Loss Account for the budget period in respect of
which the cash budget is to be prepared.
b. Budgeted Balance Sheet as at the end of the same period and
c. The Balance Sheet as at the end of the previous period.
This method may be employed for making long term cash forecasts.
(Note: First Method of Cash Budget is a part of the syllabus.)
13.6 EXERCISE
1. Define Budget. Explain the purpose of Budget.
2. Which are the types of Budget?
3. Explain the Methods of preparation of Cash budget.
4. Explain Cash Budget briefly.

298
14
BUDGETING-II
Unit Structure:
Objectives
Illustrations
OBJECTIVES
After studying the unit the students will be able to solve the practical problems
of Cash Budget.
ILLUSTRATIONS
Illustration 1 : Prepare Cash Budget for the 6 months ending 31st December,
2003 from the monthly budgeted operating results of the company and other
additional information is given below :
Mont
h
Sales Materia
l
Purchas
ed &
Consum
ed
Wages Producti
on
Admini
s-
tration
Selling Distrib
u-
tion
Resear
ch &
Develo
p-
ment
Marc
h
8,00,0
00
3,60,000 80,000 48,000 40,000 20,000 10,000 11,000
April 12,00,0
00
6,00,000 1,28,00
0
64,000 56,000 29,000 14,000 16,000
May 9,60,0
00
5,20,000 1,20,00
0
62,000 48,000 25,000 10,000 12,000
June 6,40,0
00
3,36,000 56,000 30,000 20,000 11,000 6,000 6,000
July 8,00,0
00
3,84,000 80,000 44,000 32,000 16,000 8,000 10,000
Aug. 8,80,0
00
4,00,000 96,000 49,000 40,000 21,000 10,000 12,000
Sept. 11,20,0
00
4,96,000 1,20,00
0
62,000 52,000 26,000 12,000 13,000
Oct. 12,80,0
00
6,00,000 1,04,00
0
54,000 40,000 20,000 10,000 12,000
Nov. 14,40,0
00
6,40,000 1,36,00
0
72,000 56,000 29,000 15,000 16,000
Dec. 16,00,0
00
8,00,000 1,52,00
0
74,000 58,000 30,000 16,000 17,000
1. New machinery which was installed in April at a cost of Rs. 120000 is to
be paid on 1st August. Extension to the Research & Development
Department amounting to Rs. 8,00,000 in total was contemplated from
September, at the rate of Rs. 1,60,000 per month.
2. Rs. 2, 40,000 per month is to be paid under a hire purchase scheme

299
agreement.
3. The Sales Commission of 4% on sales not included in Selling Overheads is
to be paid within the month following actual sales.

300
4. The period of credit allowed by supplier is 4 months, and that allowed to
customers is 3 months. The delay in the payment of overheads is 2 months
and that in payment of wages is one-fourth of a month.
5. Preference Share Dividend of 8% on the capital of Rs. 1,60,00,000 is
payable on 1st December.
6. 8% Calls on Equity shares at the rate of Rs. 9,60,000 is due on 1st July, 1
st
Sept, and 1st November.
7. Taxation of Rs. 8,00,000 is payable on 1st November. Dividend on
investment amounting to Rs. 2,40,000 is expected on 1st July and 1
st
December. Cash sales of Rs. 80,000 per month are expected on which no
commission is payable. This cash sales is not included in the details for
sales given above.
8. Cash balance on 1st July was expected to be Rs. 2,00,000.
SOLUTION :
CASH BUDGET FOR 6 MONTHS ENDED 31ST
December, 2003
Month/ Quarter JULY AUG SEPT OCT NOV DEC
Particulars Opening Balance 2,00,000 8,44,60
0 7,35,60
0 12,48,4
00 10,99,6
00 11,07,4
00
Cash Sales 80,000 80,000 80,000 80,000 80,000 80,000 Collection from Debtors
12,00,000
9,60,000
6,40,000
8,00,000
8,80,000
11,20,000
Share Capital 9,60,000 -- 9,60,000
-- 9,60,000
--
Dividend on Investment
2,40,000 -- -- -- -- 2,40,000
Total Receipts (A) 26,80,000
18,84,600
24,15,600
21,28,400
30,19,600
25,47,400
Creditors 3,60,000 6,00,00
0 5,20,00
0 3,36,00
0 3,84,00
0 4,00,00
0
Wages 62,000 84,000 1,02,000
1,16,000
1,12,000
1,40,000
Production overhead
62,000 30,000 44,000 49,000 62,000 54,000
Administration overhead
48,000 20,000 32,000 40,000 52,000 40,000
Selling overhead 25,000 11,000 16,000 21,000 26,000 20,000 Distribution overheads
10,000 6,000 8,000 10,000 12,000 10,000
Research & Development
12,000 6,000 10,000 12,000 13,000 12,000
Machinery Purchase
--
1,20,000
-- -- -- --
Extension to R & D --
-- 1,60,000
1,60,000
1,60,000
1,60,000
Hire Purchase Installment
2,40,000 2,40,000
2,40,000
2,40,000
2,40,000
2,40,000
Sales Commission 25,600 32,000 35,200 44,800 51,200 57,600 Preference Dividend
--
-- -- -- -- 12,80,000
Taxation --
-- -- -- 8,00,000
--
Total Payments (B)
18,35,400
11,49,000
11,67,200
10,28,800
19,12,200
11,46,400
Closing Balance (A-B)
8,44,600 7,35,600
12,48,400
10,99,600
11,07,400
14,01,000
Working Note : for Wages June July Au
g Sept Oc
t Nov
Dec

301
Actual Wages 56,000 80,000 96,000 1,20,000
1,04,000
1,36,000
1,52,000
Paid 1/4 in Current Month
14,000 20,000 24,000 30,000 26,000 34,000 38,000
3/4 paid in next month
90,000 42,000 60,000 72,000 90,000 78,000 1,02,000
Wages Paid 1,04,000 62,000 84,000 1,02,000
1,16,000
1,12,000
1,40,000
Working Note:

300
Mar April May Jun July Aug Sep Oct Nov
Material
Purchase
d
Paid to Creditors
3,60,000
6,00,000
5,20,000
3,36,000
3,84,000
4,00,000
4,96,000
6,00,000
6,40,000
1 2 3 4
4
mon
ths
Creditor
s
(March paid in July)
3,60,000
6,00,000
5,20,000
3,36,000
3,84,000
Debtors Collection from Debtors
Read
Sales
3
mon
ths
credit
8,00,000
12,00,000
9,60,000
6,40,000
8,00,000
8,80,000
11,20,000
12,80,000
14,40,000
1 2 3 80,00,0
00
12,00,0
00
9,60,0
00
6,40,00
0
8,00,00
0
8,80,00
0
(March Received in June)
Selling
Overheads
(4% of Sales)
Commission
32,000 48,000 38,400 25,600 32,000 35,200 44,800 51,200 57,600
(Paid in the following month it means next months)
Sales
Commiss
ion
-
-
32,000 48,000 38,400 25,600 52,000 35,200 44,800 51,200
(Other overheads for e.g. Production oh./ Administration Overheads /Selling Distribution / Research & Development Exp.)
(Overheads paid after 2 months)
Product
ion on 48,000 64,000 62,000 30,000 44,000 49,000 62,000 54,000 72,000
1 2
(March paid in May)
48,000 64,000 62,000 30,000 44,000 49,000 62,000
Illustration 2 : Prepare a Profit Budget and a Cash Budget for the 1st Quarter
April – June 2004 for KG Industrial Ltd. From the following information:
a. The company produces two products and their unit sale prices and material
contents are as under :-
Sale Price Material Content
Product A Rs.75,000 60% of sale price
Product B Rs.25,000 50% of sale price

301
(In addition Excise duty and sales tax as per item (f) below is recovered)
b. The production target has been fixed as under :

302
Month Product A Product B
April 50 Nos. 50 Nos.
May 60 Nos. 60 Nos.
June 70 Nos. 60 Nos.
Production for January, February and March 2004 was at 80% level of
April 2004 production.
c. The monthly expenses are as under :
i. Salaries & Wages Rs. 7.50,000 payable in the following month.
ii. Variable overheads – 5% of sale value payable in the following month.
iii. Fixed overheads – Rs. 2,00,000 payable 50% in the current month and
50% in the following month.
d. Payment for material is made in the third month from the month of
procurement.
e. The company maintains a constant level of inventory. No Stock of finished
goods is kept and the entire production is invoiced the same month. The
company gives 30 days credit to its customers.
f. Company’s products attract Excise Duty @ 15% and Sales Tax @ 2% on
sales payable to the authorities in the following month.
g. The company enjoys a Cash Credit facility from its Banker to the extent of
Rs. 35,00,000, which is fully drawn. The interest payable is @ 17% which
is charged every quarter that is, June, September, December and March.
The Company carries its banking operation presently through a Current
Account.
SOLUTION :
Cash Budget
PARTICULARS APRIL 04 MAY 04 JUNE 04
RECEIPTS :
Debtors A 3519000 4398750 5278600
B 1173000 1466250 1759500
Total Receipts (1) 4692000 5865000 7038100
Payments :
Creditors 2300000 2300000 2300000
Salaries & Wages 750000 750000 750000
Variable Overheads A 150000 187500 225000
B 50000 62500 75000
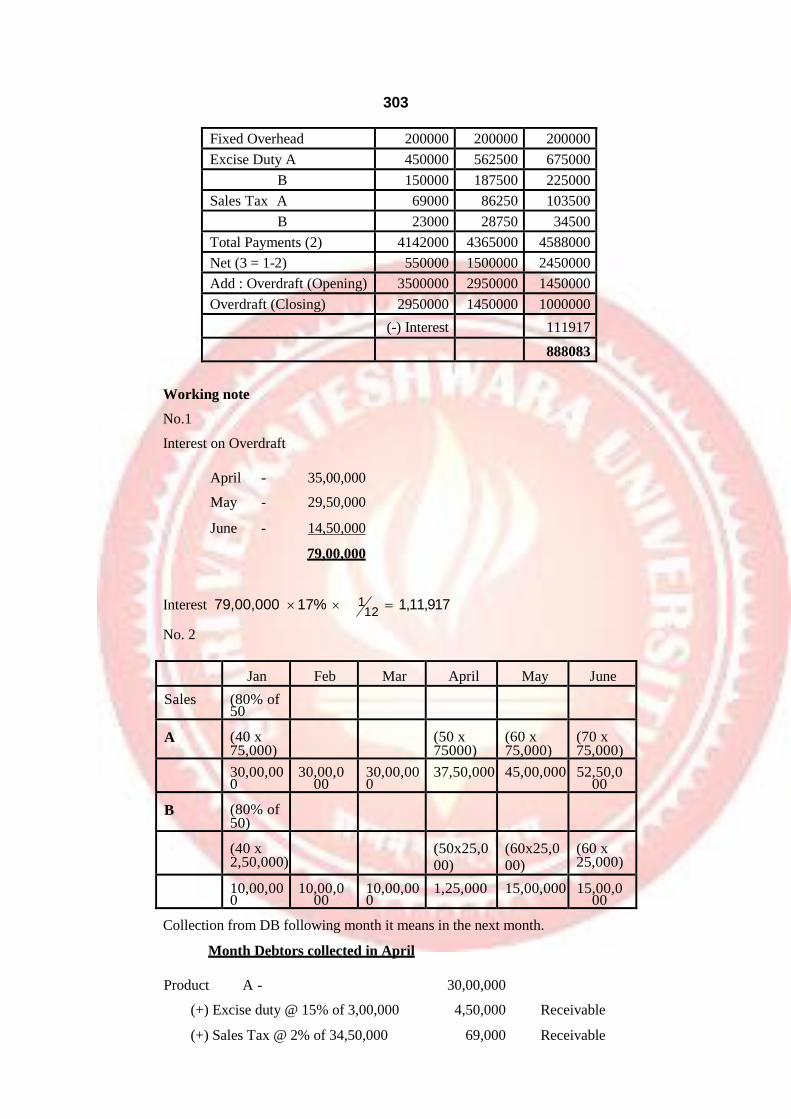
303
1 12
Fixed Overhead 200000 200000 200000
Excise Duty A 450000 562500 675000
B 150000 187500 225000
Sales Tax A 69000 86250 103500
B 23000 28750 34500
Total Payments (2) 4142000 4365000 4588000
Net (3 = 1-2) 550000 1500000 2450000
Add : Overdraft (Opening) 3500000 2950000 1450000
Overdraft (Closing) 2950000 1450000 1000000
(-) Interest 111917
888083
Working note
No.1
Interest on Overdraft
April - 35,00,000
May - 29,50,000
June - 14,50,000
79,00,000
Interest 79,00,000 17% 1,11,917
No. 2
Jan Feb Mar April May June
Sales (80% of 50
A (40 x 75,000)
(50 x 75000)
(60 x 75,000)
(70 x 75,000)
30,00,000
30,00,000
30,00,000
37,50,000 45,00,000 52,50,000
B (80% of 50)
(40 x 2,50,000)
(50x25,0
00)
(60x25,0
00)
(60 x 25,000)
10,00,000
10,00,000
10,00,000
1,25,000 15,00,000 15,00,000
Collection from DB following month it means in the next month.
Month Debtors collected in April
Product A - 30,00,000
(+) Excise duty @ 15% of 3,00,000 4,50,000 Receivable
(+) Sales Tax @ 2% of 34,50,000 69,000 Receivable

304
Collection from Debtors = 35,19,000
Product B - 10,00,000
(+) Excise Duty @ 15% of 10,00,000 1,50,000 Receivable
(+) Sales Tax @ 2% of 11,50,000 23,000 Receivable
Collection from Debtors 1,17,30,000
Same as next month
Material Cost Creditors
Purchases of Jan, Feb & March paid in April, May, June respectively.
Product A (80% of 50 Units)
75,000 x 40 x 60% 18,00,000
B (80% of 50 Units)
25,000 x 40 x 50% 5,00,000
Payment to creditors 23,00,000
Variable overheads 5% of sales value payable in the following month means
next month. (March paid in April)
Product A 75,000 x 40 x 5% 1,50,000
B 25,000 x 40 x 5% 50,000
2,00,000
Illustration 3 : The following is the Balance Sheet of Amar Industries Ltd.
As at 31st March, 2006.
Liabilities Rs. In Lakhs
Capital & Reserves 1,650
12% Debentures 900
Creditors for Purchases 600
Creditors for Expenses 70
Provision for Bonus 30
Provision for Tax 100
Proposed Dividend 50
Total 3,400
Assets Rs. In Lakhs
Fixed Assets at Cost 1,300
Less : Depreciation - 400
Sundry Debtors 900

305
Stocks and Stores 700
Loans and Advances 1,200
Cash and Bank Balances 500
100
The projected Profit & Loss Account for the first four months in the year 2006-
07 shows the followings:
Particulars April May June July
Sales 800 800 900 900
excise duty Recoveries 80 80 90 90
880 880 990 990
Material
opening stock 1,200 1,200 1,260 1,320
Add : Purchases 600 660 720 720
Less : Closing Stock 1,200 1,260 1,320 1,320
Net 600 600 660 7,200
Expenses 180 180 200 200
Excise Duty 80 84 88 90
TOTAL 860 864 948 1,012
Profit / Loss 20 16 42 (20)
The following are relevant additional information:
1. 10% of sales are for cash and the balance on 30 days credit.
2. Creditors for purchases are paid in 30 days.
3. Expenses include :
a. Interest payable at the end of each quarter.
b. Depreciation of Rs. 10 lakhs per month.
c. Provision for bonus to workmen of Rs. 5 lakhs per month, payable only
in October, 2006
d. One half of the rest of the expenses payable in the month concerned
and the following month.
4. Rs. 200 lakhs of debentures are redeemable by 30th June.
5. Provision for taxation includes Rs. 20 lakhs of surplus provisions carried
forward earlier years besides the balance for the year 2005-06 payable
before 31st May, 2006.
6. Annual General Meeting is to be held on 31st May, 2006.
7. Overdraft is permissible interest on which may be ignored.
You are required to prepare Cash Budgets for the months of April to July 2006
on a monthly basis.

306
SOLUTION :
Amar Industries Ltd.
Cash Budget
(Rs. In Lakhs)
Particula
rs
APRIL MAY June July
Opening Balance 100 60 20 --
Cash Sales 88 88 99 99
Credit Sales 700 792 792 891
Overdraft -- -- 272 --
Total Receipts (1) 888 940 1183 990
Payments :
Creditors 600 600 660 720
Expenses (1/2) 78 78 80 80
(1/2) 70 78 78 80
Interest Debentures -- 27 --
Debentures Redem -- 200 --
Dividend -- 50 --
Tax -- 80 -- --
Excise Duty 80 84 88 90
O/D Repayment -- -- -- 20
Total Expenses 828 920 1183 990
Closing Balance/ Overdraft. 60 20 -- - 252
Working Note Collection
from Debtors:
Balance of March 2006 paid in April
Sundry Debtors – 700
May- Sales of April 880
(-) 10% Cash Sales 88
792
June – Sales of May 880
(-) 10% Cash Sales 88
792
July – Sales of June 990
(-) 10% of Cash Sales 99
891
Creditors for purchases
Balance of march 2006 paid in April
Sundry creditors = 600

307
April paid in May = 600
May paid in June = 660
June paid in July = 720
Breaking of expenses:
Particulars April May June July
Total Expenses 180 180 200 200
(-) Non-Cash exp.
Depreciation 10 10 10 10
Int on Debenture 9 9 9 9
Bonus 5 5 5 5
24 24 24 24
Balance Exp 156 156 176 176
Half paid in concern month 78 78 88 88
Half in the next month - 78 78 88
March half exp paid in April 70 - - -
Total Exp paid 148 156 166 176
Illustrations 4 : Prepare Cash Budget for April – October 2011 from the
information supplied by Mahesh Stores.
Balance Sheet as on 31st March, 2011
Liabilities Amount Assets Amount
Proprietors Capital
Outstanding Liabilities
1,00,000
17,000
Cash
Stock in trade
Sundry Debtors
Furniture 25,000
Less : Depreciation 5,000
20,500
50,500
26,000
20,000
1,17,000 1,17,000

308
Expected for Sales (Rs.) Salaries (Rs.)
April 30,000 3,000
May 52,000 3,500
June 50,000 3,500
July 75,000 4,000
August 90,000 4,000
September 35,000 3,000
Other Expenses :- Rent Rs. 1000 pm.
Sales Commission – 1% of sales
Misc. Exp. Rs. 500 pm.
Sales – 80% on Credit and 20% on cash
Out of the Credit sales – 70% collected after one month and remaining in next
month.
Gross margin is 70% purchases equal to requirement of next months sales are
made for which payment is against delivery.
Debtor on 31st March, 2011 included Rs.20,000 for February and remaining
for January.
Cash on Hand should be Rs. 10000 at all times. The deficiency to be met by
short term loans.
Prepare Cash Budget for April to August 2011 and ascertain the borrowing to
be made from time to time.
SOLUTION:
M/s Mahesh Stores
Cash Budget from April to August.
Particula
rs
April May June July Aug
Opening Balance 20,500 10,000 10,000 10,000 10,00
0
Receipts:
Debtors
20% Cash sales 6,000 10,400 10,000 15,000 18,00
0
Out of 80% -70% Credit Sales 14,000 16,800 29,120 28,000 42,00
0
Out of 80% -30% Credit Sales 6,000 6,000 7,200 12,480 12,00
0
Total Receipts (1) 46,500 43,200 56,320 65,480 82,00
0

309
Payments :
Outstanding Liabilities 17,000 -- -- -- --
Salaries 3,000 3,500 3,500 4,000 4,000
Rent 1,000 1,000 1,000 1,000 1,000
Sales Commission 300 520 500 750 900
Misc. Expenses 500 500 500 500 500
Cash Purchases 15,600 15,000 22,500 27,000 10,500
(Next month sales * 30%) --
Short term loan repaid -- 900 -- -- --
Total Payments (2) 37,400 21,420 28,000 33,250 16,900
Short term loan taken 900 -- -- -- --
closing Balance of Cash (3) 10,000 21,780 28,320 32,230 65,100
Invested in Securities (1-2-3) -- 11,780 18,320 22,230 55,100
Working Note
Particulars April May June July Aug Sep
Sales 30,000 52,000 50,000 75,000 90,000 35,000
20% cash sales 6,000 10,400 10,000 15,000 18,000 7,000
80% creditors 24,000 41,600 40,000 60,000 72,000 28,000
70% in next
month
14,000 16,800 29,120 28,000 42,000 50,400
30% in next to
next
6,000 6,000 7,200 12,480 12,000 18,000
Creditors 30% of sales of the next month
Creditor previous month of sales
30% 52,000 50,000 75,000 90,000 35,000 -
15,600 15,000 22,500 27,000 10,500 -
Sales
commission
1% of sales of the respective months
Commission
Sales
300 520 500 750 900 350

310
Illustration 5: Microsoft Ltd. Wants you to prepare the cash budget of the
company for the three months, April to June 2011. You are given the following
information:
1) Operation
2011 Sales
Rs.
Purchases Rs. Wages
Rs.
Other
Rs.
April 60,000 20,000 15,000 10,000
May 50,000 20,000 15,000 10,000
June 80,0000 40,000 15,000 15,000
July 1,00,000 50,000 25,000 20,000
August 1,40,000 70,000 25,000 20,000
September 1,60,000 60,000 30,000 20,000
2) Sales are 20% cash and the balance at two months credit; purchases are at
one months credit; subject to a cash discount of 5%.
3) Wages are paid ½ month in arrear and other expenses are paid one month
in arrear.
4) During August the company pays a dividend of 15% on its equity capital of
Rs. 2,00,000 and during September deferred payment installment
(quarterly) of Rs. 25,000 will fall due.
5) It is expected that at the end of the June 2009 there will be cash balance
of Rs. 14,000.
Prepare the cash budget as requested by the company.
Solution:
M/s Microsoft Ltd.
Cash Budget from July to September 2011.
Particulars
July Aug Sept
Opening Balance 14,000 1,000 - 29,500
Receipts
Cash Sales 20,000 28,000 32,000
Collected from Debtors 40,000 64,000 80,000
Total Receipts (1) 74,000 93,000 82,500
Payments :
Creditors 38,000 47,500 66,500
wages 20,000 25,000 27,500
Other Expenses 15,000 20,000 20,000
Dividend Paid -- 30,000 --
Deferred installment -- -- 25,000
Total Payments (2) 73,000 1,22,500 1,39,000
Closing Balance of Cash (3) (1 – 2) 1,000 - 29,500 - 56,500

310
Working Notes
Particulars April May June July Aug Sep
Sales given 60,000 50,000 80,000 1,00,000 1,40,000 1,60,000
20% Cash 12,000 10,000 16,000 20,000 28,000 32,000
80% credit 48,000 40,000 64,000 80,000 1,12,000 1,28,000
Collection
from
Debtors
- - 48,000 4,00,000 64,000 80,000
Creditors 20,000 20,000 40,000 50,000 70,000 60,000
5% discount 1,000 1,000 2,000 2,500 3,500 3,000
Net payment
to CB
19,000 19,000 38,000 47,500 66,500 57,000
One month
credit
- 19,000 19,000 38,000 47,500 66,500
Wages 15,000 15,000 15,000 25,000 25,000 30,000
50% 1 2
month arrears
7,500 7,500 7,500 12,500 12,500 15,000
50% 1 2
next month
- 7,500 7,500 7,500 12,500 12,500
Total wages
paid
7,500 15,000 15,000 20,000 25,000 27,500
Other Exp 10,000 10,000 15,000 20,000 20,000 20,000
Paid in next
month
- 10,000 10,000 15,000 20,000 20,000
Illustration 6: Mr. Tushar promoted a company Tushar Enterprises Limited on
1st Oct 2011. It received certificate to commence business on 15
th Nov.,2011.
On 1st December, 2011 the company issued 5000 Equity Shares of Rs.
10/- each at par to promoters against full cash payment In the same month
allotted 20,000 shares to friends and relatives at par for full cash payment.
On 15th December, 2011, company bought premises costing Rs.
2,00,000 and equipment costing Rs. 3,00,000 On the same date a loan to

311
the extent of 60% of cost of these assets was received from bank. The loan is
to be repaid by twenty equal quarterly installments payable on 15th March,
June, September, and December each year. Interest @ 15% p.a. on unpaid
balance is to be paid with installment.
The commercial production began from 1st January, 2012. The target
sales are as under:
Jan 1000 units
Feb 1500 units
March 2500 units
The cost and sales per units are as under:
Raw material Rs. 5 units @ Rs. 10/- 50 per unit
Wages 2 hour @ Rs. 20/- 40 per unit.
Factory Expenses Variable
Rs. 20 per unit.
Fixed Rs. 10,000 per month.
Administration Exp. Rs. 5,000 per month
Selling Expenses Rs. 20 per unit.
Sales Price Rs. 200 per unit.
The stock of raw materials is to be maintained at 5,000 units and of
finished goods at 1,000 units. The purchase/ production for the stock should be
effected in January.
The processing time may be ignored. The terms of credit are-
1. Cash sales will be 500 units per month and remaining sales will be on
credit of one month.. It is expected that 60% will pay within credit period
and remaining will pay a month later.
2. Payment for purchases of material is to be made as 25% on delivery and
balance one month later.
3. Wages are to be paid fortnightly but after lapse of 3 days thereafter.
4. Fixed factory expenses are payable at the end of the month to which they
relate.
5) Remaining factory and administration expenses are payable 60% in same
month and balance in following month.
6) Selling expenses are to be paid a month after sales is effected.
You are required to prepare Cash budget for period from December-
2011 to March -2012.
Solution :
Cash Budget from December to March 2012.

312
Particulars
Dec Jan Feb March
Opening Balance -- 35,500 -
74,750
Receipts
Equity Shares issued
to promoters 50,000
50,000 -- --
to friends 2,00,000
-- -- --
Bank Loan 3,00,000
-- -- --
Cash Sales -- 1,00,000 1,00,000 1,00,000
Collected from Debtors -- -- -- 12,000
Collected from Debtors -- -- 60,000 40,000
Total Receipts (1) 5,50,000
1,50,000 1,95,500 1,85,250
Payments :
Plant 2,00,000
-- -- --
Equipment 3,00,000
-- -- --
Bank Loan -- -- -- 15,000
Interest on Bank Loan -- -- -- 11,250
Creditors for -- 37,500 18,750 31,250
Material -- -- 1,12,500 56,250
wages -- 40,000 30,000 50,000
-- -- 40,000 30,000
Factory Exp (Fixed) -- 10,000 10,000 10,000
Factory Exp (Variable) -- 24,000 18,000 30,000
-- -- 16,000 12,000
Administration Expenses -- 3,000 3,000 3,000
-- -- 2,000 2,000
Selling Expenses -- -- 20,000 30,000
Total Payments (2) 5,00,000
1,14,500 2,70,250 2,80,750
closing Balance of Cash (3 = 1 - 2) 50,000
35,500 - 74,750 - 95,500
Working Note 1:-
Production of 1000 units of finished goods - 5000 units.
Closing stock of 1000 units of finished goods - 5000 units.
Closing stock of raw materials - 5000 Units.
15000 Units.
Feb 2012 1500 * 5 7500 Units.
Mar 2012 2500 * 5 12500 Units.
Finished goods to be produced

313
Jan 2012 Production 1000 Units

314
Closing Stock 1000 Units.
Feb 2012 2000 Units.
Mar 2012 2500 Units.
Working Note 2:
Jan – Sales 1,000
Closing stock 1,000
2,000 – Production. Jan
1,500 – Feb
2,500 – Month
Particulars Jan Feb March
Production (op stock + cl. stock
+ Production)
3,000 1,500 2,500
Raw material per unit 50 50 50
Total creditors 1,50,000 75,000 1,25,000
*25% against delivery 37,500 18,750 31,250
*75% in next month - 1,12,500 56,250
Wages (units) 2,000 1,500 2,500
Per unit 40 40 40
Total wages 80,000 60,000 1,00,000
* 50% paid in the month 40,000 30,000 50,000
* 50% paid in the next month - 40,000 30,000
Sales
Cash sales (Units) 500 500 500
Selling price per unit 200 200 200
* Total cash sales 1,00,000 1,00,000 1,00,000
Total sales units 1,000 1,500 2,500
(-) cash sales units 500 500 500
Balance credit sales 500 1,000 2,000
Selling price per units 200 200 200
1,00,000 2,00,000 4,00,000
*60% in the next month - 60,000 1,20,000
* 40% in next-next month - - 40,000

315
Factory expenses-variable @ 20
per unit
40,000 30,000 50,000
*60% in same month 24,000 18,000 30,000
*40% in next month - 16,000 12,000
Administrative overheads 5000
p.m.
* 60% in same month 3,000 3,000 3,000
* 40% in next month - 2,000 2,000
Illustration 7 : Asha Limited is incorporated to take over running business of
Nish and Co. from 1st January, 2000. The tangible assets of Nisha and co.
comprises Premises Rs. 25,000; Plant Rs. 10,000 Equipment Rs. 5,000 and
Stock Rs. 6,000.
The consideration is settled by issue of 5,000 Equity shares of Rs.
10/- each par.
In addition, to provide working capital for initial period of operations,
it issued for cash consideration 500 Equity Shares of Rs. 10 each and 12%
Debentures of same face value. The above transaction were completed in
January, 2000.
a. The expected Sales for January are Rs.16,000. Therefore it is expected to
increase @ 25% over sales of previous month for February and March
thereafter @ 20% of sale of preceding month till June 2000.
b. The cost of goods sold is @ 60% of sales.
c. The 20% of sales and purchases are for cash and rest on credit of one
month.
d. Preliminary expenses will be Rs.10,000 payable 50% in February and
balance in April.
e. Stock level is to remain unchanged.
f. Administration expenses will be Rs. 3,000 for first one month and Rs.5,000
thereafter of these 50% is payable in same month and balance in the
following month.
g. Selling expenses expected @10% of sales payable two months after sales.
Prepare cash budget for January to June 2000.
Solution :
Cash Budget from January to June.
Particulars Jan Feb Mar April May June

316
Opening Balance -- 9,780 7,500 9,300 7,700 12,680
Receipts
Cash Sales 3,200 4,000 5,000 6,000 7,200 8,640
Collected from Debtors -- 12,800 16,000 20,000 24,000 28,800
Equity Shares Capital 5,000 -- -- -- -- --
12% Debentures 5,000 -- -- 50,000 -- --
Total Receipts (1) 13,200 26,580 28,500 1,50,000 38,900 50,120
Payments :
Cash Purchases 1,920 2,400 3,000 3,600 4,320 5,184
Creditors -- 7,680 9,600 12,000 14,400 17,280
Administration
Expenses
1,500 4,000 5,000 5,000 5,000 5,000
Selling Expenses -- -- 1,600 2,000 2,500 3,000
Preliminary Expenses -- 5,000 -- 5,000 -- --
Total Payments (2) 3,420 19,080 19,200 27,600 26,220 30,464
closing Balance of
Cash (3 = 1 - 2)
9,780 7,500 9,300 7,700 12,680 19,656
Working note
Particulars April May June July Aug Sep
Sales 16,000 20,000 25,000 30,000 36,000 43,200
(increase)
+25% +20% +20% +20% +20%
20% sales
cash 3,200 4,000 5,000 6,000 7,200 8,640
80% credit 12,800 16,000 20,000 24,000 28,800 34,560
Collection
from Debtors next
- 12,800 16,000 20,000 24,000 28,800
month
Cost of 9,600 12,000 15,000 18,000 21,600 25,920 goods sold
(60% of
sales)

317
20 % cash
purchase
1,920 2,400 3,000 3,600 4,320 5,184
80% on
month credit
- 7,680 9,600 12,000 14,400 17,280
Preliminary
Exp
- 5,000 - 5,000 - -
Selling
expenses
10% of sales
- - 1,600 2,000 2,500 3,000
Illustration 8 : MG Ltd. Deals in a single product which is sold @ Rs 150
p.m.
a. The cost of goods sold is 80% of sales which includes material cost @ 25%
of sales and wages @ 36% of sales. The remaining portion of cost
represents manufacturing and administration expenses.
b. The sales are seasonal as under – March
to June @ 1000 units per month.
September to December @ 1500 per month.
Remaining months @ 800 units per month.
c. The sales pattern is as under –
i. Cash Sales – 20%
ii. One months credit -40%
iii. Against bill of exchange for 60 days. Bills to be discounted
immediately subject to discount charges @ 5%.
d. Wages to be paid on 7th of the following month
e. The purchase pattern is as under –
i. Cash purchases -30%
ii. One months credit -70%
f. Manufacturing and administration includes fixed expenses @ Rs. 10,000
per month, payable at the end of month to which it relates. The remaining
expenses are subject to credit of half a month.
g. The capital of the company comprises 12% preference Capital Rs.
5,00,000. The dividend for previous year @ 15% is to be paid I

318
November. The current year dividend on preference shares is to be
paid in March.
h. Cash on hand at the end of October is Rs. 20,000. It is the policy of the
company to have minimum balance of Rs. 10,000 and maximum balance
of Rs. 30,000. Excess balance to be invested and shortfall to be met by
en-cashing investment.
Prepare Cash budget for November to March.
Solution :-
In the books of MG Ltd.
Cash Budget from November to March.
Particulars Nov Dec Jan Feb Mar
Opening Balance 20,000 10,000 30,000 27,450 30,000
Receipts
Cash Sales 45,000 45,000 24,000 24,000 30,000
Collected from Debtors 90,000 90,000 90,000 48,000 48,000
Bills discount 85,500 85,500 45,600 45,600 57,000
Total Receipts (1) 2,40,500 2,30,500 1,89,600 1,45,050 1,65,000
Payments :
Wages 81,000 81,000 81,000 43,200 43,200
Cash Purchases 16,875 16,875 9,000 9,000 11,250
Creditors 39,375 39,375 39,375 21,000 21,000
Fixed Manu. & Adm.
Overheads 10,000 10,000 10,000 10,000 10,000
Manu. & Adm. Overheads
(50%)
16,375 16,375 6,400 6,400 9,250
(50%) of previous month 16,375 16,375 16,375 6,400 6,400
Preference Dividend 75,000 -- -- -- 60,000
Total Payments (2) 2,55,000 1,80,000 1,62,150 96,000 1,61,100
closing Balance of
Cash (3 = 1 - 2)
- 14,500 50,500 27,450 49,050 3,900
Investment Sold 24,500 -- -- -- 6,100
Investment Purchased -- 20,500 -- 19,050 --
Closing Balance 10,000 30,000 27,450 30,000 10,000
Working Note 1:

319
Cost Sheet (Per Unit) % to Sale Cost per unit
(Rs.)
Material 25% 37.50
Wages 36% 54.00
Overhead 19% 28.50
Cost of Goods Sold 80% 120
Add : Profit 20% 30
Sales 100% 150
Working note 2:
Particulars Nov Dec Jan Feb Mar
Sales (Units) 1,500 1,500 800 800 1,000
(Per unit selling price) 150 150 150 150 150
Total sales 2,25,000 2,25,000 1,20,000 1,20,000 1,50,000
20% cash sales 45,000 45,000 24,000 24,000 30,000
40% one month credit 90,000 90,000 90,000 48,000 48,000
40% Bills of exchange
(-days) same as Sap,
Oct, Nov sales) 1500 x 150= 2,25,000
85,500 85,500 45,600 45,600 60,000
Wages
(units)
Sep
1,500 1500 1500 800 800 1000
Per unit 54 54 54 54 54 54
Paid in
next month
81,000
81,000 81,000 43,200 43,200 54,000
- 81,000 81,000 81,000 43,200 43,200
Particulars Oct Nov Dec Jan Feb Mar
Units
Produced
1,500 1,500 1,500 800 800 1,000

320
(Material
cost per
unit)
37.50 37.50 37.50 37.50 37.50 37.50
Total
Amount
56,250 56,250 56,250 30,000 30,000 37,500
30% Cash
Purchase
16,875 16,875 16,875 90,000 90,000 11,250
70% on
month credit
- 39,375 39,375 39,375 21,000 21,000
Overheads
(per unit)
28.50 28.50 28.50 28.50 28.50 28.50
Total
Overheads
42,750 42,750 42,750 22,800 22,800 28,500
50% of same
month
16,375 16,375 16,375 6,400 6,400 9,250
50% of next
month
- 16,375 16,375 6,400 6,400 9,250
Fixed Exp 10,000 10,000 10,000 10,000 10,000 10,000
Total overheads – Fixed expenses and Balance will be distributed as 50% of the
same month & 50% to the next month.
EXERCISES
B. Ltd has anticipated sales as under – January
to March Rs. 4,00,000 pm. April
to August Rs. 6,00,000 pm.
September to December Rs. 2,00,000 pm
The Material cost is 25% and Labour cost is 15% of sales. The
production overhead 20% of Sales.
The sales commission is 5% on sales and general overhead are @ 10%
on sales.
The credit period for sales is 1 ½ month and purchases is 1 month.
The Labour Cost is payable at the end of month. The other
expenses have credit period of ½ month.
The minimum cash balance is Rs. 50,000.
Irregular payments–

320
a. Income Tax instrument in June, September, December @ Rs.
50,000
b. Dividend Rs. 2,00,000 in August
c. Interest on borrowing Rs. 1,00,000 in September and March.
Prepare Cash Budget for April to September for 6 months.
Prepare Cash Budget for January – June from the following information:
a. The estimated sales are as follows :
Nov Dec Jan Feb
2,00,000 2,20,000 1,20,000 1,00,000
March April May June
1,50,000 2,40,000 2,00,000 2,00,000
b. 20% of the sales are on cash basis and the balance on credit.
c. The Firm has gross margin of 25% on sales.
d. 50% of the credit sales are collected in the month following the
sales, 30% in the second months and 20% in the third month.
e. Material for sales of each month is purchased on month in advance
on a credit for two months.
f. The time lag in the payment of wages and salaries is one third of a
month and miscellaneous expenses one month.
g. Debentures worth Rs. 40,000 were issued in January.
h. Cash balance at the end of December is Rs. 60,000.
i. Salaries and office Expenses are Rs. 30,000 p.m. in November,
December and April and 80% of the same January to March and
90% in May and June.
j. Dividend is payable in June Rs. 20,000.
k. Selling expenses @ 10% on sales payable one month after sales.
l. The firm can maintained minimum balance should be Rs. 40,000
and the firm can borrow from bank @ 12% pa in multiples of Rs.
1,000. Interest payable at the time of repayment. The borrowing and
repayment should be resorted to as and when required.
Prepare a Cash Budget for three months ending 30thJune, 2006 from the
information given below :
a)
Month Sales Materials Wages Overheads

321
February Rs. 14,000 9,600 3,000 1,700
March Rs. 15,000 9,000 3,000 1,900
April Rs. 16,000 9,200 3,200 2,000
May Rs. 17,000 10,000 3,600 2,200
June Rs. 18,000 10,400 4,000 2,300
b) i. Credit terms are:
Sales/ Debtors 10% sales are on Cash basic.
50% of credit sales are collected next month and balance in the
following month.
ii. Creditors Materials 2 Months
Wages 1/4th Month
Overhead ½ Month
c) Cash and bank balance on 1st April 2006 is expected to be Rs. 6,000.
d) Other relevant information is :
i) Plant and machinery will be installed in February, 2006 at a cost
of Rs. 96,000. The monthly installment of Rs. 2,000 is payable
from April onwards.
ii) Dividend @ 5% on preference share capital of Rs. 2,00,000 will
be paid on 1st June.
iii) Advance to be received for sales of vehicle Rs. 9,000 in June.
iv) Dividend from investment amounting to Rs.1,000 are
expected to be received in June.
v) Income Tax (advance) to be paid in June is Rs. 2,000.
Prepare Cash Budget for July-December from the following information.
1. Estimated Sales, expenses etc. are as follows (Rs. In lakhs)
Jun
e
July Aug Sept Oct Nov Dec
Sales 35 40 40 50 50 60 65
Purchases 14 16 17 20 20 25 28
Wages & Salary 12 14 14 18 18 20 22

322
Misc. Exp. 05 06 06 06 07 07 07
Int. Received 02 -- -- 02 -- -- 02
Sales of Shares -- -- 20 -- -- -- --
2. 20% of the sales are on cash and the balance on credit.
3. 1% of the Credit Sales are returned by Customers, 2% of the Total
Accounts Receivable constitute bad debt Losses. 505 of the good
accounts receivable are collected in the month of the sales and the
rest in the next month.
4. The times lag in payment of miscellaneous expenses and purchases
in one month. Wages and salaries are paid fortnightly with a time lag
of 15 days.
5. The company keeps minimum cash balance of Rs. 5 lakhs. Cash in
Excess of Rs. 7 lakhs in invested in Government Securities in the
multiple of Rs. 1 lakh. Short falls in minimum cash balance are
made good by borrowing from banks. Ignore interest received and
paid.
Q. 5. From the information given below prepare cash budget of ‘X’ Ltd.
From January 2006 to March 2006.
Particulars Dec Jan Feb Mar April
Sales budge units 60 60 65 75 80
Selling Price per unit Rs. 1000 1000 1000 1000 1000
Off season discount 20% 20% 10% -- --
End of month inventory units
10 12 15 25 25
1. Half of the sale proceeds are collected in the month of sales and
other half in the month following.
2. Materials amounting to Rs. 300 per unit manufactured are purchased
one month in advance of manufacture and paid for in cash, earning
5% discount of half of material purchased.
3. Direct labour budget was Rs. 50 per unit and variable overheads Rs.
100 per unit.
4. Indirect labour budget was Rs. 6000 per month.
5. Depreciation was provided uniformly at Rs. 3000 per month.
6. Fixed overhead budget was Rs. 6000 per month during off season
and Rs. 7000 per month during the season. Out of this, the
Quarterly premium for life insurance amounting to Rs. 600 was
payable in the first month of each quarter.
7. Dividends for the year 2006 amounting to Rs. 20,000 were expected
to be declared in March 2006 and payments were to be spread over
March and April equally.
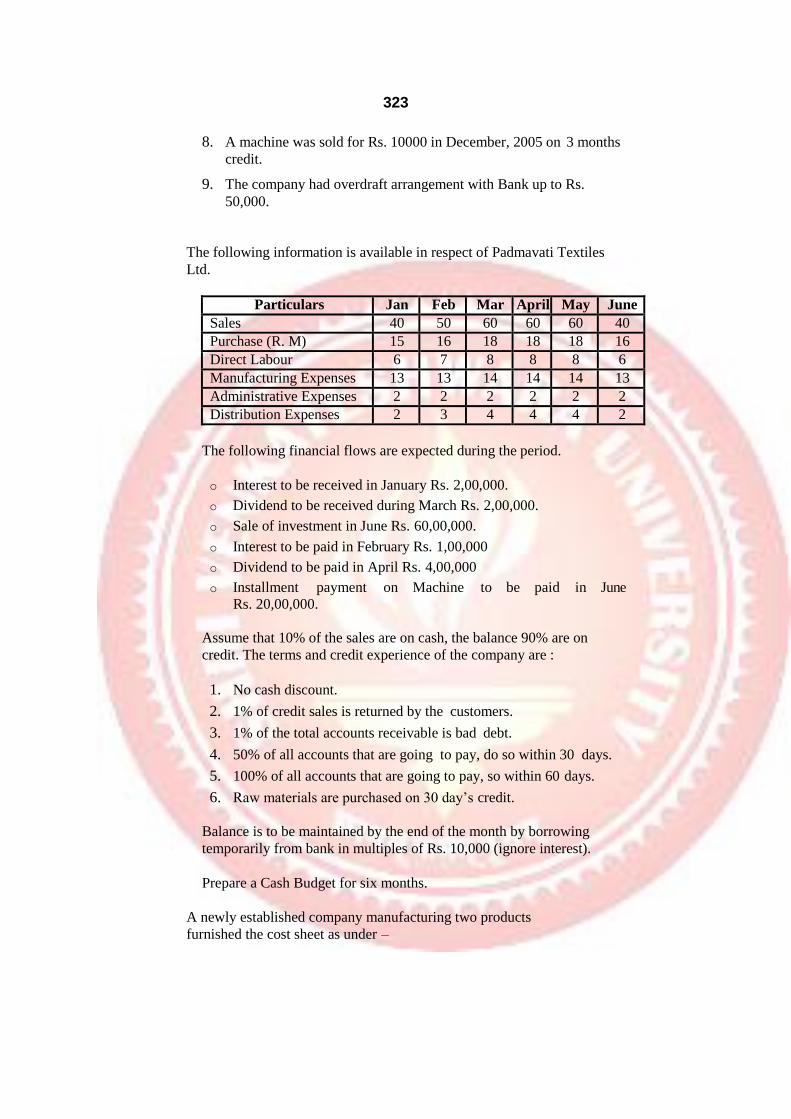
323
8. A machine was sold for Rs. 10000 in December, 2005 on 3 months
credit.
9. The company had overdraft arrangement with Bank up to Rs.
50,000.
The following information is available in respect of Padmavati Textiles
Ltd.
Particulars Jan Feb Mar April May June
Sales 40 50 60 60 60 40
Purchase (R. M) 15 16 18 18 18 16
Direct Labour 6 7 8 8 8 6
Manufacturing Expenses 13 13 14 14 14 13
Administrative Expenses 2 2 2 2 2 2
Distribution Expenses 2 3 4 4 4 2
The following financial flows are expected during the period.
o Interest to be received in January Rs. 2,00,000.
o Dividend to be received during March Rs. 2,00,000.
o Sale of investment in June Rs. 60,00,000.
o Interest to be paid in February Rs. 1,00,000
o Dividend to be paid in April Rs. 4,00,000
o Installment payment on Machine to be paid in June
Rs. 20,00,000.
Assume that 10% of the sales are on cash, the balance 90% are on
credit. The terms and credit experience of the company are :
1. No cash discount.
2. 1% of credit sales is returned by the customers.
3. 1% of the total accounts receivable is bad debt.
4. 50% of all accounts that are going to pay, do so within 30 days.
5. 100% of all accounts that are going to pay, so within 60 days.
6. Raw materials are purchased on 30 day’s credit.
Balance is to be maintained by the end of the month by borrowing
temporarily from bank in multiples of Rs. 10,000 (ignore interest).
Prepare a Cash Budget for six months.
A newly established company manufacturing two products
furnished the cost sheet as under –

324
Particulars Product L Product B
Direct Material 40 20
Direct Labour 30 15
Variable Overhead 14 7
Selling Price 100 50
Fixed overheads excluding bank interest amount to Rs. 6,00,000 p.a.
spread over evenly throughout the year.
Sales forecasts is as under –
Product July Aug Sept Oct Nov.
L units 4200 4600 3600 4000 4500
B Units 2100 2300 1800 2000 1900
Production: 75% of each months sales will be produced in the month of
sales and 25% in the previous month.
Sales Pattern –
Product L -
One third of sales will be on cash basis on which cash discount of 2%
is allowed.
One third will be on documents against payment basis. The
documents will be discounted by the bank in the month of sales itself.
Balance of one third on documents against acceptance basis.
The payments under this scheme will be received in third month
e.g. sales in September payment will be received in November.
Product B –
80% of the sales will be against cash to be received in the month of
sales and the balance.
20% will be received in the following month.
Direct Materials – 50% of the direct materials required for each
month’s production will be purchased in the previous month and the
balance in the month of the production itself. The payments will be
made in the month following the purchases.
Direct Wages – 80% of the direct wages will be paid in the month of
use of direct labour for production and the balance in the following
month.
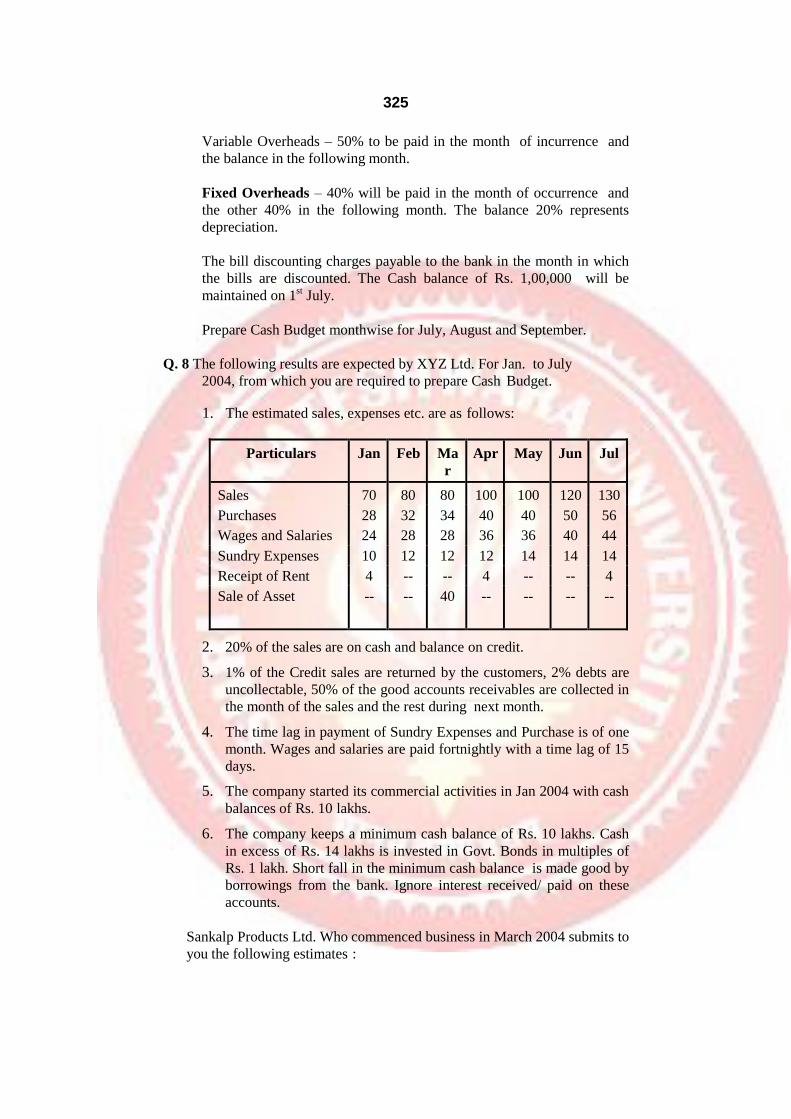
325
Variable Overheads – 50% to be paid in the month of incurrence and
the balance in the following month.
Fixed Overheads – 40% will be paid in the month of occurrence and
the other 40% in the following month. The balance 20% represents
depreciation.
The bill discounting charges payable to the bank in the month in which
the bills are discounted. The Cash balance of Rs. 1,00,000 will be
maintained on 1st July.
Prepare Cash Budget monthwise for July, August and September.
Q. 8 The following results are expected by XYZ Ltd. For Jan. to July
2004, from which you are required to prepare Cash Budget.
1. The estimated sales, expenses etc. are as follows:
Particulars Jan Feb Ma
r
Apr May Jun Jul
Sales 70 80 80 100 100 120 130
Purchases 28 32 34 40 40 50 56
Wages and Salaries 24 28 28 36 36 40 44
Sundry Expenses 10 12 12 12 14 14 14
Receipt of Rent 4 -- -- 4 -- -- 4
Sale of Asset -- -- 40 -- -- -- --
2. 20% of the sales are on cash and balance on credit.
3. 1% of the Credit sales are returned by the customers, 2% debts are
uncollectable, 50% of the good accounts receivables are collected in
the month of the sales and the rest during next month.
4. The time lag in payment of Sundry Expenses and Purchase is of one
month. Wages and salaries are paid fortnightly with a time lag of 15
days.
5. The company started its commercial activities in Jan 2004 with cash
balances of Rs. 10 lakhs.
6. The company keeps a minimum cash balance of Rs. 10 lakhs. Cash
in excess of Rs. 14 lakhs is invested in Govt. Bonds in multiples of
Rs. 1 lakh. Short fall in the minimum cash balance is made good by
borrowings from the bank. Ignore interest received/ paid on these
accounts.
Sankalp Products Ltd. Who commenced business in March 2004 submits to
you the following estimates :
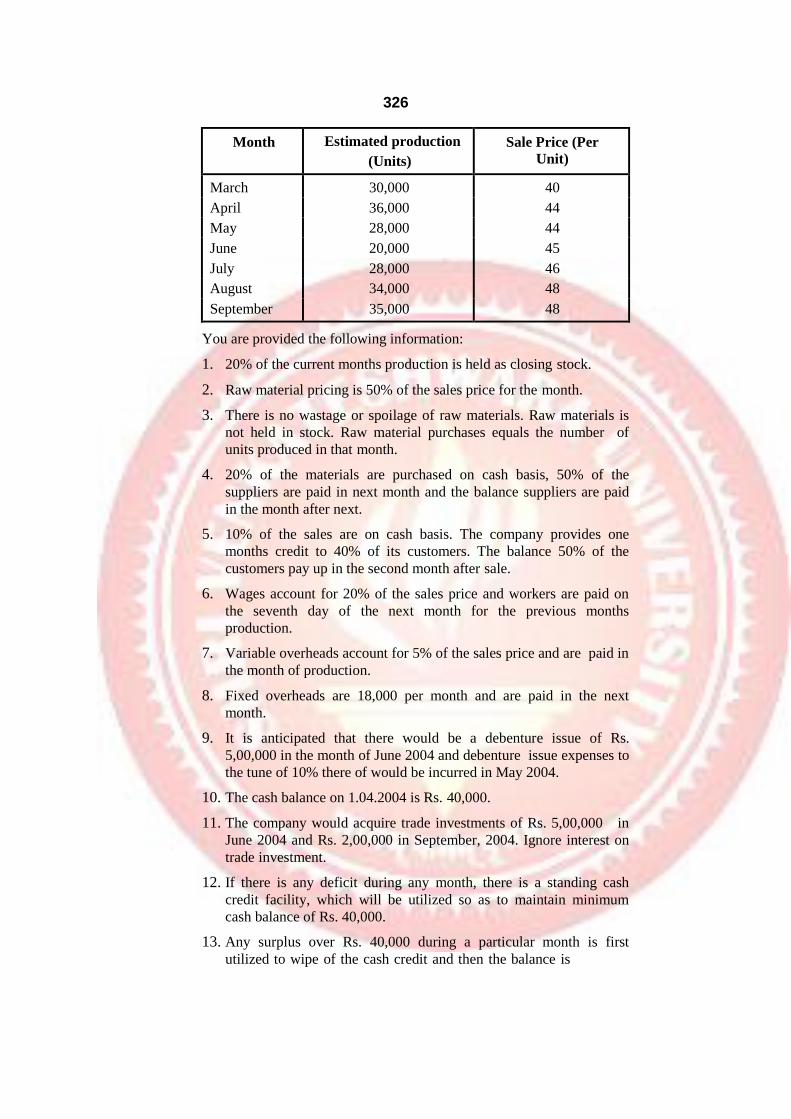
326
Month Estimated production
(Units)
Sale Price (Per
Unit)
March 30,000 40
April 36,000 44
May 28,000 44
June 20,000 45
July 28,000 46
August 34,000 48
September 35,000 48
You are provided the following information:
1. 20% of the current months production is held as closing stock.
2. Raw material pricing is 50% of the sales price for the month.
3. There is no wastage or spoilage of raw materials. Raw materials is
not held in stock. Raw material purchases equals the number of
units produced in that month.
4. 20% of the materials are purchased on cash basis, 50% of the
suppliers are paid in next month and the balance suppliers are paid
in the month after next.
5. 10% of the sales are on cash basis. The company provides one
months credit to 40% of its customers. The balance 50% of the
customers pay up in the second month after sale.
6. Wages account for 20% of the sales price and workers are paid on
the seventh day of the next month for the previous months
production.
7. Variable overheads account for 5% of the sales price and are paid in
the month of production.
8. Fixed overheads are 18,000 per month and are paid in the next
month.
9. It is anticipated that there would be a debenture issue of Rs.
5,00,000 in the month of June 2004 and debenture issue expenses to
the tune of 10% there of would be incurred in May 2004.
10. The cash balance on 1.04.2004 is Rs. 40,000.
11. The company would acquire trade investments of Rs. 5,00,000 in
June 2004 and Rs. 2,00,000 in September, 2004. Ignore interest on
trade investment.
12. If there is any deficit during any month, there is a standing cash
credit facility, which will be utilized so as to maintain minimum
cash balance of Rs. 40,000.
13. Any surplus over Rs. 40,000 during a particular month is first
utilized to wipe of the cash credit and then the balance is

327
converted into temporary Bank Fixed Deposit in multiples of Rs.
1000/- (Ignore interest on Cash Credit and Bank FD).
As Finance Manager of Sankalp Products Ltd., you are required to
prepare monthly based estimated Cash Budget for the six months period
from April 2004 upto September , 2004.
M/s Sudesh sales corporation is a trading concern with three partners.
The sales estimated are as under.
August to October Rs. 1,00,000 per month.
March to May Rs. 1,20,000 per month.
November to February Rs. 80,000 per month.
June and July Rs. 60,000 per month.
The cost of purchases is 60% of sales. The stock level remains
unchanged. Other expenses are as under :
Office Expenses Rs. 5,000 per month.
Selling expenses Rs. 5% of sales.
The partners withdraw for personal use @ Rs. 5,000 per partner per
month. The terms of credit are as under :
a. Sales – 20% of cash,
40% against Bill of Exchange payable 30 days later. Bill are
discounted with bank immediately, discounting charges being 2%.
40% on one month credit.
b. Purchases 30% on cash and balance on one month credit.
c. Selling expenses two month after sale.
The other transactions are as under :
i. Income tax payable Rs. 60,000 in three equal installments due on
Septmber, December and March.
ii. A portion of the premises is let out at a rent of Rs. 5,000 per month
receivable at the end of the relevant month for May to August.
iii. In April one delivery van is purchased at a cost of Rs. 1,20,000. This
is financed to extent of 75% by loan taken from bank and balance
payable immediately. Loan is repayable in three years with quarterly
installment of Rs. 7,500 commencing from July. Interest @ 12% p.a.
is payable separately. You are required to prepare cash budget from
April to December, 2001.
M. ltd. Has anticipated Sales are as under :
January to March Rs. 2,00,000 p.m. April to
August Rs. 3,00,000 p.m.
September to December Rs. 1,00,000 p.m.

328
The material cost is 25% and Labour cost is 15% of sales. The
production overhead 20% of sales.
The sales commission is 5% on sales and general overheads are @ 10%
on sales. The credit period for sales is 1 ½ months and purchases is 1
month.
The labour cost is payable at the end of month. The other expenses have
credit period of ½ month.
The minimum cash balance is Rs. 25,000.
Irregular payments:
a. Income tax installment is June, September and December @ Rs.
25,0000.
b. Dividend Rs. 1,00,000 in August.
c. Interest on borrowings Rs.50,000 in September and March.
Prepare cash budget for April to September.

329
Question Paper
M.C.A. Semester-II
Accounting and Financial Management
(Revised Course) 3 Hours Total Marks: 100
N.B. : 1) Question No. 1 is compulsory.
2) Attempt any two questions from Question Nos. 2 to 4.
3) Attempt any two questions from Question Nos. 5 to 7.
4) Answers to the questions should be grouped and written
together.
5) Figures to the right indicate full marks assigned to the
question.
a) What is the need of a fund flow statement for an organization?
(10)
b) From the following Trial balance, prepare trading, profit and loss
account and balance sheet of Ujwala enterprises for the year ended on 31st March 2009. (10)
Debit balance Rs. Credit balance Rs.
Power and fuel 500 Purchase return 3,700 Land and building 70,000 Sundry creditors 32,000 Plant and machinery 50,000 Sales 1,20,000 Sundry expenses 2,600 Capital 1,78,000
Sales return 6,000 Interest on Investments 2,000
Investments 10,000 Loan 32,300 Insurance 1,600 Purchases 98,000 Carriage outward 1,000 Salary 19,300 Furniture 16,000
Printing & Stationery 1,500
Cash in hand 5,800
Stock (1-4-08) 20,000
Sundry debtors 28,000
Legal charges 500
Drawings 800
Bad debts 1,400
Wages 13,000
Cash in hand 20,000
Carriage inward 2,000
3,68,000 3,68,000
Adjustments: Stock on 31st March 2009 cost price
Rs. 25,000/- market price Rs. 30,000/-

330
a) i) What is the difference between a debit note and credit note? (8)
ii) What is the difference between trade discount and cash discount?
b) Journalise the following transactions in the journal of Mr.
Shashi Raja for the month of June 2008: (12)
June1 Mr. Shashi commenced his business with cash Rs.
10,000/-, building Rs. 1,50,000 and Bank balance Rs.
43,000/-
3 Bought goods worth Rs. 21,000 on credit from ‘Avi’ with
trade discount at 5%.
4 Sold goods of Rs. 5,600/- with a cash discount of Rs. 600/-.
5 Paid wages Rs. 2,000/-.
6 Goods costing Rs. 500/- were distributed as free
samples.
10 Paid Insurance premium for business office Rs. 350/- and for the life of the owners life Rs. 500/- by cheques.
14 Invested Rs. 5,000/- by cheque in debentures of XYZ Co.
Ltd.
30 Settled Avi’s account by issuing a cheque of the necessary amount after deducting cash discount at 3%.
a) What is Bank reconciliation statement? And explain
different reasons for differences in balances. (8)
b) From the following transactions in sonu’s cash book with cash, bank and discount columns: (12)
May
2002 1 Opening cash balance Rs. 25,000 and bank balance Rs. 18,000.
2 Purchased goods worth Rs. 25,000 at 10% trade
discount and 5% cash discount term. Half of the amount paid in cash and half the amount by cheque.
3 Cash sales Rs. 22,000 at 10% TD and 5% CD.
4 Received a cheque of Rs. 5,750/- from Manohar and
deposited the same into bank.
7 Paid to Jyoti by cheque Rs. 4,900 and earned discount of Rs. 100/-.

331
8 Cheque received from Manohar returned dishonored by Bank.
9 Drawn from Bank Rs. 4,000/- for office use.
10 Deposited all the cash in bank in excess of Rs. 500/-
a) Explain trading account and profit and loss account with specimen form. (8)
b) What is an account and explain different types of accounts with examples. (12)
a) What is Cost Accounting and What are elements of cost Accounting? (8)
b) i) Calculate the stock turn-over ratios from the following data: (12)
Opening stock Rs. 8,000, closing stock Rs. 10,000, Sales Rs. 54,000 and Profit 20% on cost.
ii)Calculate the creditors turn over ratio and the payment period from the following:
Credit purchase – Rs. 6,00,000
Creditors – Rs. 1,00,000
a) What are accounting ratios? How can the accounting ratios be
classified? Enumerate any two ratios covered by each classification. (8)
b) Following details are available from the records of a India Ltd. Prepare cash Budget for the three months ending on 30th June 2008: (12)
Month Sales
Rs.
Materials
Rs.
Wages
Rs.
Overheads
Rs.
February 42,000 28,800 9,000 5,100
March 45,000 27,000 9,000 5,700
April 48,000 27,600 9,600 6,000
May 51,000 30,000 10,800 6,600
June 54,000 31,000 12,000 6,900

332
Additional information:
1) 10% sales are on cash basis.
2) 50% of the credit sales are collected in the next month and balance in the following month.
3) Delay in payment of overheads is one month.
4) Delay in payment of wages by ¼ month.
5) Period of credit allowed by suppliers is two months.
6) Advance income tax is to be paid in the month of June
2008 Rs. 5,000/-.
a) Short Notes: (8)
i) Batch costing
ii) Contract costing
b) What is working capital and what are the types of working
capital? (12)


![b.com. third year[semester v & vi]](https://img.dokumen.tips/doc/110x75/586a1f651a28ab123a8b6dd9/bcom-third-yearsemester-v-vi.jpg)