Embed Size (px)
Citation preview

© 2008 The Authors
1
Journal compilation © 2008 Blackwell Publishing Ltd
Parasite Immunology
,
2008,
30
, 1–12
Blackwell Publishing Ltd
ORIGINAL ARTICLES
BCG–malaria co-infection
BCG–malaria co-Infection has paradoxical effects on C57BL/6 and
A/J mouse strains
A.L. LEISEWITZ,
1
K. ROCKETT
2
& D. KWIATKOWSKI
2
1
Department of Veterinary Tropical Diseases, Onderstepoort, South Africa,
2
Wellcome Trust Centre for Human Genetics, Oxford, UK
SUMMARY
Bacillus Calmette-Guérin (BCG) infection of the spleen is apotent modifier of splenic function. Prior to malaria infection,we infected two mouse strains of differing susceptibility to
Plasmodium chabaudi
AS (C57BL/6 and A/J) with thismycobacterium. We then evaluated aspects of spleen cell com-position, architecture and cytokine expression, and correlatedthese with the outcome. BCG preinfection resulted in protectionof the A/J mice but paradoxically resulted in mortality ofthe C57BL/6 mice. The latter developed higher parasitaemiasthat peaked earlier than the A/J mice rendered resistant byBCG. BCG infection induced remarkable changes to splenichistology examined by H&E staining, but there were noconsistent differences between mouse strains. C57BL/6 micehad higher absolute numbers of all immune cell phenotypesthan did A/J mice, and higher macrophage and dendritic cellproportions. BCG-induced resistance in A/J mice was associatedwith an increased CD4
+
expression of IFN-
γ
whilst induceddeath in C57BL/6 mice was associated with excessive IFN-
γ
expression. A moderate TH1 response in the A/J model mayhave been responsible for the improved survival, and an excessiveTH1 response in the C57BL/6 model may have contributed totheir death.
Keywords
BCG, malaria, mouse, TH1, TH2
INTRODUCTION
Depending on the strain of mouse and the species of
Plasmodium
parasite used in experiments, the outcome ofexperimental malaria infection can be manipulated. Typically
Plasmodium chabaudi
AS in C57BL/6 mice is a self-resolvinginfection whilst in A/J mice it is lethal (1). The reasonsfor this have been extensively investigated and it is widelyaccepted that the differing outcomes are due to balance andtiming of the TH1 and TH2 immune response (2). Resistantmodels show an early TH1 response characterized by highlevels of IFN-
γ
and IL-12 release, followed by a later TH2response (3–6). Susceptible models fail to respond to bloodstage infection with early TH1 cytokines, rather respondingwith IL-4 production and allowing uncontrolled parasitaemia(7). Although the early TH1 response is seen in self-curingmouse strains, it is also well-known that the cytokinesassociated with this are responsible for host pathology andmay in fact result in death (8,9). The differences betweensusceptible and resistant mouse models have also beenlinked to various aspects of spleen function; resistant mousestrains develop a greater splenomegaly and haematopoieticresponse than do susceptible ones (10–12). At a cellularlevel, susceptible A/J mice show a deficiency in macrophagefunction not seen in the resistant C57BL/6 model (13).Resistance to
P. chabaudi
infection has been shown to begenetically determined in inbred mouse strains and was foundto be controlled by a dominant, non-H2 linked, autosomalgene or closely linked genes (10,11,14).
The use of microbial organisms/products as immunopo-tentiators to provide a nonspecific protection against malariahas been known for over 60 years [reviewed in Ref. (15)]. Inthe late 1970s it was shown that Bacillus Calmette-Guérin(BCG) given to mice provided long-term (6 months after asingle injection) sterile protection against subsequent malariaor
Babesia
infections (16,17). This protection was shownto be unlikely due to cross-protecting antibodies or theenhancement of phagocytic ability and it was hypothesizedthat protection was provided by a soluble, nonantibodyfactor produced by macrophages (17). This factor could be
Correspondence
: A.L. Leisewitz, Department of Veterinary Tropical Diseases, Private Bag X04, Onderstepoort 0110, South Africa (e-mail: [email protected]).
Received: 8 February 2007Accepted for publication: 14 September 2007

2
© 2008 The AuthorsJournal compilation © 2008 Blackwell Publishing Ltd,
Parasite Immunology
,
30
, 1–12
A L. Leisewitz
et al.
Parasite Immunology
found in the serum of animals primed with BCG and wastoxic to mouse malaria parasites
in vitro
and
in vivo
(18–20)as well as human malaria parasites (21,22). A role for theimmune system in this factor’s production was demonstratedusing silica to ablate macrophages (17), thymectomy,splenectomy and cortisone infusion (16).
In a recent study of how BCG may protect susceptible A/J mice against a
P. yoelii
17XL infection it was shown thatthere was a skewing towards a TH1-type response with adramatic increase in host survival. Neutralization of IFN-
γ
and NO demonstrated their role in the BCG-inducedprotection while a strong correlate of protection was the largeamounts of parasite-specific cytophillic antibody (IgG2a)that was not present in placebo control mice (23). A morerecent investigation reported on the effect of preinfectionwith
Mycobacterium tuberculosis
and subsequent malariaco-infection in two inbred strains of mice (24). WhereasC57BL/6 mice were significantly protected by this infection,no protection was afforded to the BALB/c mice. Microarraygene expression studies, confirmed by real time PCRand measurement of cytokines in splenocyte culturesupernatant, showed a clear trend for a TH1 response in theresistant C57BL/6 mice unlike the susceptible BALB/c mice.
Our study set out to compare the effect of BCG preinfectionin malaria-susceptible (A/J) and malaria-resistant (C57BL/6)mice. We demonstrated a paradoxical effect of BCG preinfec-tion on the outcome of the blood stage malaria infection:A/J mice were protected from
P. chabaudi
AS infectionwhereas the malaria infection became lethal to the C57BL/6mice. The BCG-induced susceptibility was associated with ahigher and earlier peak parasitaemia, massive splenomegalyand higher IFN-
γ
expression in CD4
+
cells. Our results lendsupport to the hypothesis that an excessive TH1 responsecauses severe host pathology.
MATERIALS AND METHODS
Mice and parasites
In all experiments, female 6–8 week-old C57BL/6 or A/Jmice were used. These were purchased from the BiomedicalServices Unit of the University of Oxford and housed underconventional conditions. Normal mouse chow was fed
ad libitum
and drinking water was supplemented with0·05%
p
-aminobenzoic acid (Sigma, Dorset, UK, A-6928).
Plasmodium chabaudi
AS parasites were a kind gift from Prof.David Walliker of Edinburgh University. Parasites were main-tained in passage by intraperitoneal injection of 10
5
parasitesinto two naïve mice approximately every 7 days. All experi-mental infections were established by the intraperitonealinjection of 10
5
parasitized red blood cells in 200
µ
L ofphosphate-buffered saline prepared freshly each time from
the passage mice. No experimental infections were everestablished using frozen parasite stabilates. Parasitaemias werefollowed by counting a minimum of about 1000 red cells inDiff-Quick (Triangle Bio-medical Sciences Ltd, Skelmersdale,UK) stained thin blood films made from tail tip snips.
Murine BCG–malaria co-infection model
Six to eight-week-old female C57BL/6 and A/J mice wereinfected with approximately 2
×
10
7
viable units of the BCG(17) (Copenhagen substrain 1077; Percuvac
TM
, MedevaPharam Limited, Regent Park, Leatherhead, KT22 7PQ,England, Lot 755755) by intravenous injection into the tailvein. The freeze dried BCG vaccine vials were reconstitutedin 500
µ
L sterile saline and the required infective dosecalculated to be contained in a volume of 100
µ
L. The vialsof vaccine were briefly vortexed to disperse the reconstitutedvaccine properly before injection into the mice. Intravenousinjection was facilitated by warming the mice for 10 min beforeinjection which was given with an insulin syringe and 26Gneedle. Some mice showed some weakness after the injectionbut all made a complete recovery and behaved completelynormally within hours. All BCG-infected mice were left for8 weeks before infection with
P. chabaudi
AS as previouslydescribed. No mice died as a result of the BCG infection.All experiments were repeated three times and each timepoint included at least three mouse spleens pooled together.
Spleen and spleen cell preparation
At each time point examined, three mice were killed and thespleens collected into ice-cold RPMI (Sigma, Cat. no. R-0883) with Brefeldin A (Sigma, Cat. no. B-76511) added toa concentration of 10
µ
g/mL. Three spleens were pooled forall experiments to account for any variation in the parasitedensity between individual mice. Fresh spleen cells wereisolated by perfusing each spleen with 1–2 mL of a mixtureof RPMI, Brefeldin A (10
µ
g/mL), Liberase CI purifiedenzyme blend (Roche, Hertfordshire, UK, Cat. no. 1814435)used at a final concentration of 299
µ
g/mL and DNase 1(Roche, Cat. no. 1284932) used at a final concentration of200
µ
g/mL. The organs were allowed to incubate in thismixture at 37
°
C for 30 min before being gently teased througha 70-
µ
m sterile cell strainer (BD Falcon, Oxford, UK, Catno. 352350) into 50 mL Falcon tubes with the aid of an ice-coldmixture of calcium and magnesium free Dulbecco’s PBS(Gibco, Paisley, UK, Cat no. 14190–094), 0·05 m
ethylene-diaminetetaacetic acid (Sigma, E-7889) and Brefeldin A at10
µ
g/mL. Cell suspensions were centrifuged at 200
g
for7 min at 4
°
C and resuspended in 40 mL of the iced PBS–EDTA–Brefeldin A. A small aliquot of cells was stainedwith Trypan Blue (Sigma, Cat. no. T-8154) for counting

© 2008 The Authors
3
Journal compilation © 2008 Blackwell Publishing Ltd,
Parasite Immunology
,
30
, 1–12
Volume 30, Number 1, January 2008 BCG–malaria co-infection
and determination of viability. Using 40
×
10
6
aliquots ofcells from uninfected and BCG–malaria super-infectedspleens were then resuspended in 7 mL of RPMI containing10% foetal calf serum and penicillin, streptomycin, glutamineand Brefeldin A added to a final concentration of 10
µ
g/mL and placed into Teflon Petri dishes (Techmate Ltd, Mil-ton Keynes, UK. Part number 4050) and cultured at 37
°
C in5% CO
2
for 4 h. Cells were not restimulated to encourage
further cytokine production at any point during the 4 h cul-ture. Tissues collected for routine histology were fixed in10% buffered formalin.
Flow cytometry
All cells were prepared for flow cytometric analysis in U bottom96 well plates (Greiner, Gloucestershire, UK, Cat. no. 650101).
Figure 1.1 Representative density plots illustrating the regions used in the collection of cell phenotype data for CD3 (b), CD4 (c), CD8 (c), CD45/B220 (d), F4/80 (e) and CD11c/MHC II (f ) positive cells. Region 1 (R1-top left density plot, a) is the region that all subsequent plots are gated on. SSC: side scatter; FSC: forward scatter: FL1: FITC used to mark CD4, CD45/B220, F4/80, and MHC II receptors; FL2: PE used to mark CD8 and CD11c receptors. All data was acquired on a FACSCalibur machine, Beckton Dickinson, Oxford, UK and data was analysed using CellQuest, Beckton Dickinson, Oxford, UK. Statistics were calculated using the quadrant statistics tool in the software of the CellQuest program. Whole numbers of cells were calculated based on the knowledge of whole cell counts performed manually as described in materials and methods. Cells were prepared as described in the material and methods.
Figure 1 A comparison of the peripheral parasitaemia of A/J and C57BL/6 mice infected with BCG 8 weeks prior to P. chabaudi infection. The C57BL/6 mice show increased mortality and a higher parasitaemia that peaked earlier than A/J mice. There was a significant difference between the parasitaemias of the two models on day 8 (P < 0·001). All error bars represent SD.

4
© 2008 The AuthorsJournal compilation © 2008 Blackwell Publishing Ltd,
Parasite Immunology
,
30
, 1–12
A L. Leisewitz
et al.
Parasite Immunology
All antibodies were supplied by Pharmingen (Oxford, UK)unless stated otherwise. Cell phenotype analysis was doneon fresh cells after blocking with anti-mouse CD16/32FcgIII/II receptor (Cat. no. 01241) according to the manu-facturer’s instructions. Approximately 1·5
×
10
6
cells per wellwere stained with the following fluorochrome conjugatedmonoclonal antibodies according to manufacturers instruc-tions: CD3 (PE conjugated, Cat. no. 0108PA); CD4 (PerCPconjugated, Cat. no. 01065A); CD8 (FITC conjugatedCat. no. 01044A); CD45R/B220 (FITC conjugated Cat. no.01124A); and rat anti-mouse F4/80 (FITC conjugated,Serotec, Oxford, UK, Cat. no. MCA497F). Dendritic cellswere stained with anti-CD11c (PerCP, Cat. no. 0104PA) andMHC II (I-A
b
) (FITC, Cat. no. 06254D). Staining was carriedout on ice and according to the manufacturer’s instructions.Briefly, whole cells were loaded into the 96 well plate andwashed once in FACS buffer (calcium and magnesium freeDulbecco’s PBS, 0·05 m
EDTA, 1% FCS). The concentratedfluorochrome labelled antibody was diluted 1 : 50 in FACSbuffer (with added Brefeldin A in cells stained for intracellularcytokines) and 50
µ
L of this antibody solution was added toeach well. Cells were then incubated at 4
°
C in the dark for30 min and then washed twice in FACS buffer before beingfixed for 30 min in 1% formalin/PBS. After two furtherwashes cells were resuspended in 300
µ
L of FACS bufferand analysed within 24 h.
Cells cultured for 4 h were used for intracellular cytokinedetection and were stained for surface phenotype in thesame way as above with the exception that all solutions usedup until the point of fixing and permeabilizing had Brefeldin
A added to a final concentration of 10
µ
g/mL. All procedureswere performed on ice until the time of cell fixation. Briefly,cells were taken out of culture, aliquotted into the 96 well plateat approximately 1·5
×
10
6
cells per well and washed once inFACS buffer plus Brefeldin A. Following the staining forsurface phenotype the Cytofix/Cytoperm Kit (Pharmingen,Oxford, UK, Cat. no. 2300KK) was used according to themanufacturer’s instructions. Cells were fixed and permeabilizedfor 15 min in the Cyofix/Cytoperm solution and washedtwice in Cytoperm solution. APC conjugated rat anti-mouseanti-IFN-
γ
(Cat. no. 18119A) monoclonal antibody dilutedin Cytoperm solution was used according to manufacturer’srecommendations. The cells were resuspended and stainedat 4
°
C in the dark for 30 min after which they were washedtwice in Cytoperm solution before being resuspended in300
µ
L of FACS buffer ready for analysis within 24 h. Flowcytometry was performed on a FACSCalibur machine(Beckton Dickinson, Oxford, UK). For evaluation of cellphenotype at least 50 000 events were collected. Around100 000 events were collected for intracellular cytokinedetection. All data were analysed using C
Q
(version3·3, Beckton Dickenson, Oxford, UK) software.
The levels of intracellular expression of the cytokines arepresented as the ratio of the level of expression in a BCG–malaria super-infected mouse to the level of expression ina normal mouse. Mouse intracellular cytokine positivecontrol cells were used to ensure that intracellular stainingfor IFN-
γ
was working (MiCK-1, Cat. no. 554652; LotM060492; Pharmingen, BD Biosciences). Figure 1 illustratesa set of representative density plots that shows the region
Figure 1.2 Representative density plots illustrating regions and gating for the capture of intracellular cytokine expression. Region 1 (R1-top left density plot, (a) is the region that plot (b) is gated on. The top right hand quadrant represents a population of CD4 positive cells that are dual positive for a cell surface phenotype receptor and intracellular cytokine FL4: APC as the fluorochrome marker for the cytokine; FL2 – PE: CD4. All data was acquired on a FACSCalibur machine, Beckton Dickinson, Oxford, UK and data was analysed using CellQuest, Beckton Dickinson, Oxford, UK. Statistics were calculated using the quadrant statistics tool in the software of the CellQuest program. Whole numbers of cells were calculated based on the knowledge of whole cell counts performed manually as described in materials and methods. Cells were prepared as described in material and methods.
© 2008 The Authors
5
Journal compilation © 2008 Blackwell Publishing Ltd,
Parasite Immunology
,
30
, 1–12
Volume 30, Number 1, January 2008 BCG–malaria co-infection
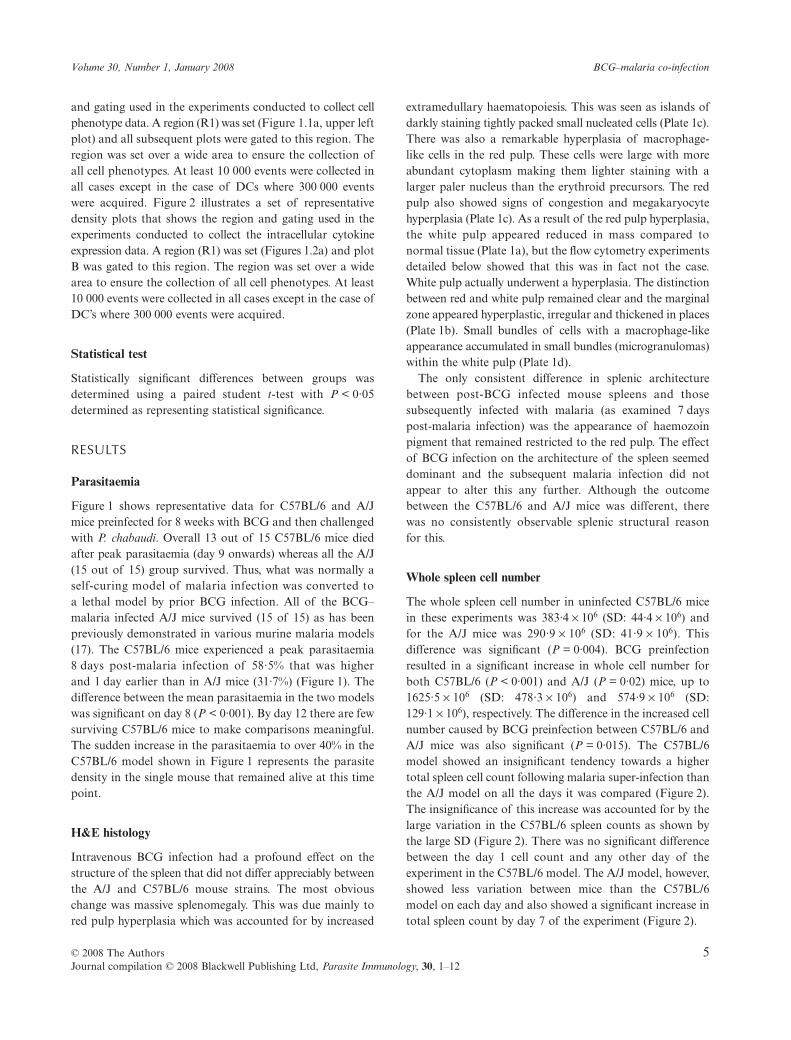
and gating used in the experiments conducted to collect cellphenotype data. A region (R1) was set (Figure 1.1a, upper leftplot) and all subsequent plots were gated to this region. Theregion was set over a wide area to ensure the collection ofall cell phenotypes. At least 10 000 events were collected inall cases except in the case of DCs where 300 000 eventswere acquired. Figure 2 illustrates a set of representativedensity plots that shows the region and gating used in theexperiments conducted to collect the intracellular cytokineexpression data. A region (R1) was set (Figures 1.2a) and plotB was gated to this region. The region was set over a widearea to ensure the collection of all cell phenotypes. At least10 000 events were collected in all cases except in the case ofDC’s where 300 000 events were acquired.
Statistical test
Statistically significant differences between groups wasdetermined using a paired student
t
-test with
P
< 0·05determined as representing statistical significance.
RESULTS
Parasitaemia
Figure 1 shows representative data for C57BL/6 and A/Jmice preinfected for 8 weeks with BCG and then challengedwith
P. chabaudi
. Overall 13 out of 15 C57BL/6 mice diedafter peak parasitaemia (day 9 onwards) whereas all the A/J(15 out of 15) group survived. Thus, what was normally aself-curing model of malaria infection was converted toa lethal model by prior BCG infection. All of the BCG–malaria infected A/J mice survived (15 of 15) as has beenpreviously demonstrated in various murine malaria models(17). The C57BL/6 mice experienced a peak parasitaemia8 days post-malaria infection of 58·5% that was higherand 1 day earlier than in A/J mice (31·7%) (Figure 1). Thedifference between the mean parasitaemia in the two modelswas significant on day 8 (
P <
0·001). By day 12 there are fewsurviving C57BL/6 mice to make comparisons meaningful.The sudden increase in the parasitaemia to over 40% in theC57BL/6 model shown in Figure 1 represents the parasitedensity in the single mouse that remained alive at this timepoint.
H&E histology
Intravenous BCG infection had a profound effect on thestructure of the spleen that did not differ appreciably betweenthe A/J and C57BL/6 mouse strains. The most obviouschange was massive splenomegaly. This was due mainly tored pulp hyperplasia which was accounted for by increased
extramedullary haematopoiesis. This was seen as islands ofdarkly staining tightly packed small nucleated cells (Plate 1c).There was also a remarkable hyperplasia of macrophage-like cells in the red pulp. These cells were large with moreabundant cytoplasm making them lighter staining with alarger paler nucleus than the erythroid precursors. The redpulp also showed signs of congestion and megakaryocytehyperplasia (Plate 1c). As a result of the red pulp hyperplasia,the white pulp appeared reduced in mass compared tonormal tissue (Plate 1a), but the flow cytometry experimentsdetailed below showed that this was in fact not the case.White pulp actually underwent a hyperplasia. The distinctionbetween red and white pulp remained clear and the marginalzone appeared hyperplastic, irregular and thickened in places(Plate 1b). Small bundles of cells with a macrophage-likeappearance accumulated in small bundles (microgranulomas)within the white pulp (Plate 1d).
The only consistent difference in splenic architecturebetween post-BCG infected mouse spleens and thosesubsequently infected with malaria (as examined 7 dayspost-malaria infection) was the appearance of haemozoinpigment that remained restricted to the red pulp. The effectof BCG infection on the architecture of the spleen seemeddominant and the subsequent malaria infection did notappear to alter this any further. Although the outcomebetween the C57BL/6 and A/J mice was different, therewas no consistently observable splenic structural reasonfor this.
Whole spleen cell number
The whole spleen cell number in uninfected C57BL/6 micein these experiments was 383·4
×
10
6
(SD: 44·4
×
10
6
) andfor the A/J mice was 290·9
×
10
6
(SD: 41·9
×
10
6
). Thisdifference was significant (
P =
0·004). BCG preinfectionresulted in a significant increase in whole cell number forboth C57BL/6 (
P <
0·001) and A/J (
P =
0·02) mice, up to1625·5
×
10
6
(SD: 478·3
×
10
6
) and 574·9
×
10
6
(SD:129·1
×
10
6
), respectively. The difference in the increased cellnumber caused by BCG preinfection between C57BL/6 andA/J mice was also significant (
P =
0·015). The C57BL/6model showed an insignificant tendency towards a highertotal spleen cell count following malaria super-infection thanthe A/J model on all the days it was compared (Figure 2).The insignificance of this increase was accounted for by thelarge variation in the C57BL/6 spleen counts as shown bythe large SD (Figure 2). There was no significant differencebetween the day 1 cell count and any other day of theexperiment in the C57BL/6 model. The A/J model, however,showed less variation between mice than the C57BL/6model on each day and also showed a significant increase intotal spleen count by day 7 of the experiment (Figure 2).

6
© 2008 The AuthorsJournal compilation © 2008 Blackwell Publishing Ltd,
Parasite Immunology
,
30
, 1–12
A L. Leisewitz
et al.
Parasite Immunology
CD3
+
cells
The A/J model had a significantly greater proportion of CD3+
cells than the C57BL/6 model on days 1 and 3 post-malariainfection. By day 7 this was reversed and the C57BL/6 model
had a greater proportion of this phenotype than the A/Jmodel. The C57BL/6 model showed a significant increase inthe proportion of positive cells by day 7 of the experimentwhilst the A/J model showed no significant change in theproportion of this phenotype over this time period (Table 1).
Plate 1 (a): Photomicrograph of the spleen of a C57BL/6 mouse stained with H&E (40×) infected with BCG alone. Note the marked red pulp (RP) hyperplasia. Although the WP also underwent hyperplasia, it is not immediately obvious on the sections. (b) and (c) and (d): photomicrographs of the spleen of an A/J mouse preinfected with BCG on day 7 of a malaria infection (200×). Notice the irregular hyperplasia of the marginal zone (MZ) in (b). In (c) note the red pulp hyperplasia (RP) with nests of extramedullary haematopoeisis (yellow circle). Arrows indicate numerous megakaryocytes. Malaria super-infection did not alter the spleen architecture beyond the modifications induced by the prior BCG infection in either model. In (d) the arrows indicate tight bundles of macrophages in microgranulomas within the white pulp (WP).
Figure 2 The total number of spleen cells present in the spleens of A/J and C57BL/6 mice infected with BCG 8 weeks prior to a P. chabaudi infection. *indicates a significant difference from day 1 post-malaria infection in the A/J model. All error bars represent SD.
© 2008 The Authors 7Journal compilation © 2008 Blackwell Publishing Ltd, Parasite Immunology, 30, 1–12
Volume 30, Number 1, January 2008 BCG–malaria co-infection
In terms of the whole number of cells CD3+, the C57BL/6model had a larger population of CD3+ cells than the A/Jmodel on days 3 and 5. Although the number was higher inthe C57BL/6 model for the other days, this was not significant.The C57BL/6 model showed a significant increase in thenumber of CD3+ cells between days 1 and 5. The A/J modelshowed no significant change in this cell number over the7 days evaluated (Table 1).
CD4+ cells
There was no significant variation in the proportion CD4+
cells in the spleen over time between or within the twomodels. There were, however, significantly greater numbersof CD4+ cells in the C57BL/6 compared to the A/J model ondays 1 and 3. Neither model, however, showed a significantincrease in the number of this phenotype over time (Table 1).
CD45/B220+ cells
As in the case of the T cell marker (CD3), this B cell markerdemonstrated a significantly greater proportion of B cellspresent in the A/J model compared to the C57BL/6 modelon days 1 and 3. Although there was no significantchange in the proportion of positive cells over the 7 daysin the A/J model, the C57BL/6 model showed an increasedproportion of positive cells by day 7 of the malaria infection(Table 1). The whole number of CD45+ cells was greater in
the C57BL/6 model throughout the 7 days of the experiment,significantly so on day 1 only, however (Table 1).
F4/80+ cells
The C57BL/6 model had a significantly greater proportionof F4/80+ cells (macrophages) in the spleen than the A/Jmodel on days 1, 3 and 7 (Table 1). This translates to a massiveincrease in the whole number of macrophages on all days inthe C57BL/6 model compared to the A/J model. Indeed byday 5 there was a 5·5-fold greater number of macrophagesin the C57BL/6 spleen than in the A/J spleen. The wholenumber of macrophages in the C57BL/6 model was signifi-cantly increased above the A/J model on days 1, 3 and 5(Table 1). The C57BL/6 model also showed a significantincrease in the proportion of positive cells by day 7 of theinfection. There was no significant change in this proportionin the A/J model over time. Because of the increasing SDin the whole number of this phenotype over time in theC57BL/6 model, despite the mean number of cells increasing,this did not reach significance. There was also no significantchange in the whole number of macrophages in the A/Jmodel.
CD11c+ cells
There was a significant increase in the proportion ofCD11c+ cells in the C57BL/6 model compared to the A/J
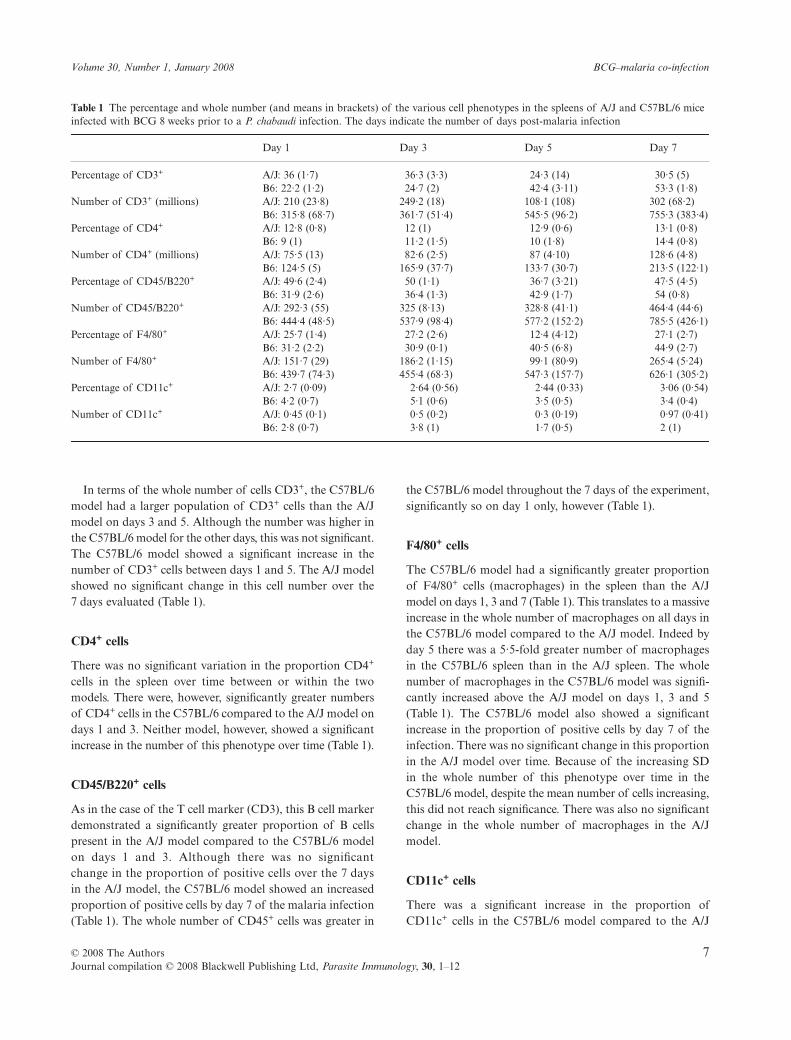
Table 1 The percentage and whole number (and means in brackets) of the various cell phenotypes in the spleens of A/J and C57BL/6 mice infected with BCG 8 weeks prior to a P. chabaudi infection. The days indicate the number of days post-malaria infection
Day 1 Day 3 Day 5 Day 7
Percentage of CD3+ A/J: 36 (1·7) 36·3 (3·3) 24·3 (14) 30·5 (5)B6: 22·2 (1·2) 24·7 (2) 42·4 (3·11) 53·3 (1·8)
Number of CD3+ (millions) A/J: 210 (23·8) 249·2 (18) 108·1 (108) 302 (68·2)B6: 315·8 (68·7) 361·7 (51·4) 545·5 (96·2) 755·3 (383·4)
Percentage of CD4+ A/J: 12·8 (0·8) 12 (1) 12·9 (0·6) 13·1 (0·8)B6: 9 (1) 11·2 (1·5) 10 (1·8) 14·4 (0·8)
Number of CD4+ (millions) A/J: 75·5 (13) 82·6 (2·5) 87 (4·10) 128·6 (4·8)B6: 124·5 (5) 165·9 (37·7) 133·7 (30·7) 213·5 (122·1)
Percentage of CD45/B220+ A/J: 49·6 (2·4) 50 (1·1) 36·7 (3·21) 47·5 (4·5)B6: 31·9 (2·6) 36·4 (1·3) 42·9 (1·7) 54 (0·8)
Number of CD45/B220+ A/J: 292·3 (55) 325 (8·13) 328·8 (41·1) 464·4 (44·6)B6: 444·4 (48·5) 537·9 (98·4) 577·2 (152·2) 785·5 (426·1)
Percentage of F4/80+ A/J: 25·7 (1·4) 27·2 (2·6) 12·4 (4·12) 27·1 (2·7)B6: 31·2 (2·2) 30·9 (0·1) 40·5 (6·8) 44·9 (2·7)
Number of F4/80+ A/J: 151·7 (29) 186·2 (1·15) 99·1 (80·9) 265·4 (5·24)B6: 439·7 (74·3) 455·4 (68·3) 547·3 (157·7) 626·1 (305·2)
Percentage of CD11c+ A/J: 2·7 (0·09) 2·64 (0·56) 2·44 (0·33) 3·06 (0·54)B6: 4·2 (0·7) 5·1 (0·6) 3·5 (0·5) 3·4 (0·4)
Number of CD11c+ A/J: 0·45 (0·1) 0·5 (0·2) 0·3 (0·19) 0·97 (0·41)B6: 2·8 (0·7) 3·8 (1) 1·7 (0·5) 2 (1)
8 © 2008 The AuthorsJournal compilation © 2008 Blackwell Publishing Ltd, Parasite Immunology, 30, 1–12
A L. Leisewitz et al. Parasite Immunology
model for days 1 and 3. This proportion peaked on day 3and in the C57BL/6 model was significantly below the day3 percentage by day 7 (Table 1). There was, however, nochange in the proportion of DCs in the A/J model over time.There were very large and significant differences between thetwo models in respect of the whole number of DCs with theC57BL/6 model showing a sevenfold greater number ofDCs than the A/J model at peak on day 3 (Table 1).
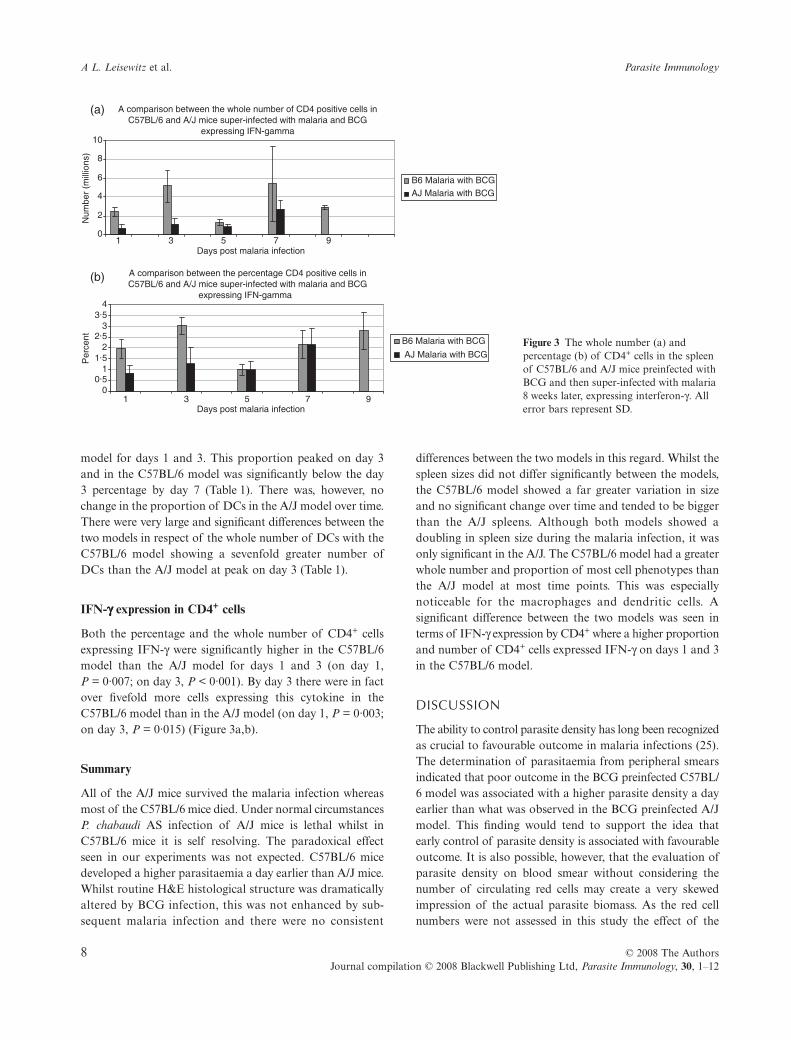
IFN-γγγγ expression in CD4+ cells
Both the percentage and the whole number of CD4+ cellsexpressing IFN-γ were significantly higher in the C57BL/6model than the A/J model for days 1 and 3 (on day 1,P = 0·007; on day 3, P < 0·001). By day 3 there were in factover fivefold more cells expressing this cytokine in theC57BL/6 model than in the A/J model (on day 1, P = 0·003;on day 3, P = 0·015) (Figure 3a,b).
Summary
All of the A/J mice survived the malaria infection whereasmost of the C57BL/6 mice died. Under normal circumstancesP. chabaudi AS infection of A/J mice is lethal whilst inC57BL/6 mice it is self resolving. The paradoxical effectseen in our experiments was not expected. C57BL/6 micedeveloped a higher parasitaemia a day earlier than A/J mice.Whilst routine H&E histological structure was dramaticallyaltered by BCG infection, this was not enhanced by sub-sequent malaria infection and there were no consistent
differences between the two models in this regard. Whilst thespleen sizes did not differ significantly between the models,the C57BL/6 model showed a far greater variation in sizeand no significant change over time and tended to be biggerthan the A/J spleens. Although both models showed adoubling in spleen size during the malaria infection, it wasonly significant in the A/J. The C57BL/6 model had a greaterwhole number and proportion of most cell phenotypes thanthe A/J model at most time points. This was especiallynoticeable for the macrophages and dendritic cells. Asignificant difference between the two models was seen interms of IFN-γ expression by CD4+ where a higher proportionand number of CD4+ cells expressed IFN-γ on days 1 and 3in the C57BL/6 model.
DISCUSSION
The ability to control parasite density has long been recognizedas crucial to favourable outcome in malaria infections (25).The determination of parasitaemia from peripheral smearsindicated that poor outcome in the BCG preinfected C57BL/6 model was associated with a higher parasite density a dayearlier than what was observed in the BCG preinfected A/Jmodel. This finding would tend to support the idea thatearly control of parasite density is associated with favourableoutcome. It is also possible, however, that the evaluation ofparasite density on blood smear without considering thenumber of circulating red cells may create a very skewedimpression of the actual parasite biomass. As the red cellnumbers were not assessed in this study the effect of the
Figure 3 The whole number (a) and percentage (b) of CD4+ cells in the spleen of C57BL/6 and A/J mice preinfected with BCG and then super-infected with malaria 8 weeks later, expressing interferon-γ. All error bars represent SD.

© 2008 The Authors 9Journal compilation © 2008 Blackwell Publishing Ltd, Parasite Immunology, 30, 1–12
Volume 30, Number 1, January 2008 BCG–malaria co-infection
severity of the anaemia on the proportion of red cells that wereparasitized on a peripheral smear could not be evaluated.Although the parasitaemia curves as determined by bloodsmear of these two models appear very different, taking red cellmass into account may have created a different picture.
The purpose of this work was to compare C57BL/6 andA/J mouse strains that show opposite outcomes wheninfected with P. chabaudi AS that is reversed when they arepreinfected with BCG 8 weeks before super-infecting themwith P. chabaudi AS. How these mouse strains respond toP. chabaudi AS alone is well described in the literature asthese models have been used for decades to study variousaspects of murine malaria pathology, pathophysiology andimmunopathophysiology (26,27). Comparative histology(including immunohistochemical studies) of the spleen hasbeen published (28). Spleen cell numbers over the course ofinfection have also been published (29).
BCG infection causes anaemia in mice (30). The nadir ofthe anaemia is noted at 4 weeks after intravenous injectionof a large dose (not dissimilar to the dose used in our malariasuper-infection studies) of bacilli. In the experimentsdescribed here, we infected mice with malaria at what wouldhave been around the nadir of the BCG-induced anaemia.The anaemia of BCG infection has been shown to be theresult of a decrease in the pool of erythropoietin responsivecells (30). Malaria is also responsible for severe anaemia inmice and in fact the ability of the spleen to respond withvigorous erythropoiesis is thought to play a crucial role inprotecting some inbred mouse strains from death due to themalaria infection (31). One factor contributing to thedifferent outcomes in BCG-primed A/J and C57BL/6 miceinfected with P. chabaudi AS infection has been shown torelate to the ability of the spleen to respond to anaemia;A/J mice show impaired amplification of late-stage splenicerythropoiesis (12). The severity of anaemia and the erythro-poietic response to BCG infection has not been comparedbetween C57BL/6 and A/J mice. It has been shown thatBCG induces a rapid and transient modification of the bonemarrow in C57BL/6 mice (but not in C3H/He mice) towardsincrease production of phagocytes at the expense of theerythroid lineage (32). BCG-induced anaemia is most likelymediated by pro-inflammatory cytokines as in bacterialinfection generally (33). Anaemia is common duringmycobacterial infections in humans (34). C57BL/6 mice aregenetically TH1-biased in their immune response (23) andBCG induces a TH1 inflammatory response which togethermay make the degree anaemia experienced by the BCG–malaria infected C57BL/6 mice worse than in the BCG–malaria infected A/J mice. This may in part account for thehigh mortality seen in the C57BL/6 model here, since anover-reactive TH1 response is thought to be partly responsiblefor pathology and poor outcome (8,9).
The effect of a combined infection of BCG and malariaon spleen microanatomy have not been described previously,although differences between the histology of malarialspleens in A/J and C57BL/6 mice have been described (28).Besides the degree of splenomegaly, H&E staining showedno observable differences in microanatomy between thesetwo mouse strains over the course of the malaria infectionexcept that BCG infection appeared to have an overwhelmingeffect of spleen structure that is not further altered in anyobvious and consistent way by subsequent malaria infection.
Although spleen size has been identified as a beingcorrelated with malaria outcome in mouse models (10),despite the outcome being distinctly different in these twomodels, there was no significant difference in the overallwhite cell count. Clearly it is more complex than simplyhaving the capacity to grow a large spleen that providesprotection against malaria infection. The cellular composition(proportion and whole number) and function are thus moreimportant than simply the organ size.
The only cell phenotypes in the C57BL/6 model to besignificantly proportionately below levels of the A/J modelwere CD3+ (T) and CD45/B220+ (B) cells. Despite thisproportionate difference, this did not translate into a lowerwhole number of positive cells in either phenotype (becauseof the relatively higher cellularity of the C57BL/6 model’sspleen). The two cell phenotypes that showed significantlyincreased proportion and whole number in the C57BL/6compared to the A/J model were macrophages and DCs.The proportionate increase in both of these phenotypesresulted in dramatically higher whole numbers of cells in theC57BL/6 model. Despite that fact that both of thesephenotypes have been shown to play crucial roles in innateimmune defence against malaria (20,35–38), simply increasingtheir numbers in the spleen seems to have had the oppositeeffect in that the C57BL/6 model was converted to a lethalmodel by the preinfection with BCG.
Other workers have shown that TNF (a classical TH1cytokine) is toxic to parasites in vivo (39). The kinetics of thiscytokines release also corresponds to a decline in parasitedensity (40). The most important and perhaps biologicallyrelevant finding was the higher proportion and wholenumber of CD4+ cells expressing IFN-γ in the C57BL/6model. It could be argued that prior BCG infection resultedin much higher amounts of this cytokine being producedthat potentiated a stronger TH1 response in the C57BL/6model. Strong TH1 responses are known to cause pathology.It is interesting to note that despite this strong TH1 response,the parasitaemia in this model was higher and peaked earlierthan in the nonlethal A/J model. It has been argued thatthe ability to control parasite density is closely linked tosurvival. It has also been argued that the early strongTH1 response is responsible for control of the parasitaemia.

10 © 2008 The AuthorsJournal compilation © 2008 Blackwell Publishing Ltd, Parasite Immunology, 30, 1–12
A L. Leisewitz et al. Parasite Immunology
Despite these arguments and the experiments that havesupported them, the pro-inflammatory effects of BCGinfection in the spleen in the C57BL/6 model presented hereseem to contradict this. It could perhaps relate to the factthat this study evaluated intracellular expression of cytokinesand not circulating levels of these proteins as others studieshave. It could be argued that the dramatically increasednumber of macrophages in the spleens of C57BL/6 micecoupled with the large number of T-cells expressing IFN-γmay be responsible for excessive red cell phagocytosis andparasite clearance. The parasitaemia curve of the C57BL/6model compared to the A/J one, do not however, support this.
The comparison of the effect of BCG on these two modelsof malaria infection seems to support the theory that BCGinduces just enough of a TH1 inflammatory response inA/J mice to protect them and an excessive TH1 inflammatoryresponse in the C57/BL6 mouse that causes death. It is quitepossible that many different antigens (besides BCG) wouldhave a similar effect through the stimulation of T-cells. Ithas indeed been shown that T-cell activation by Schistosomamansoni antigens induces a TH1 response characterized byIFN-γ release that protects A/J mice from P. chabaudiinfection (41). It also seems plausible that the TH1 effect inthese models may have affected erythropoiesis more severelyin the C57/BL6 model than in the A/J model, harming theone and benefiting the other. It seems possible that thedegree of spleen cell apoptosis and immune exhaustion mayhave been greater in the C57BL/6 model than in the A/Jmodel. A very recent investigation reported on the effect ofpreinfection with M. tuberculosis and subsequent malariaco-infection in two inbred strains of mice (24). The myco-bacterium was given at a low dose by aerosol, and the lungsand spleen were infected this way. The malaria parasite usedwas P. yoelii 17XL which is lethal in both C57BL/6 andBALB/c mice. Whereas C57BL/6 mice were significantlyprotected by this infection, no protection was afforded theBALB/c mice. Protection in the C57BL/6 mice was the resultof a potentiated TH1 immune response in the spleen whichwas assessed by microarray gene expression studies, andconfirmed by real time PCR and measurement of cytokinesin splenocyte culture supernatant. BALB/c mice did not showa TH1-bias with the super-infection and it was hypothesizedthat this was the reason why this strain was not protected bypreinfection with mycobacteria. It is interesting to note thatprotection of the C57BL/6 mice was associated with asignificantly lower parasitaemia that was much slowerin developing. The results of these elegant experimentsconfirmed our findings, namely that providing biologicalmodification with a live mycobacterial infection to bias aTH1 response provides protection. These investigators alsonoted as we did, the diverse effect of mycobacterial infectionon mice of different genetic backgrounds. There are several
differences between this study and the one reported in here.Plasmodium chabaudi AS is not a lethal infection in C57BL/6mice as P. yoelii 17XL is. Although the route of mycobacterialinfection was different between our study and theirs, thespleen was infected in both studies. Although BALB/c micewere not protected in their study as A/J mice were in ours,the reason given for this was the failure of the BALB/c miceto mount an early TH1 response which is the likely reasonthe A/J mice in our study [and one other in Ref. (23)] wereprotected. Essentially the same conclusion is drawn in bothof these previous studies and the one reported here, namelythat modifying splenic responses to a TH1-bias can protectsusceptible mice. We further suggest that BCG primes anexcessive TH1 response in normally protected mice causingdeath.
C57BL/6 and A/J mice have genetically determineddifferences in resistance to intracellular organisms (includingBCG) involving genes controlling innate and adaptive immuneresponses. Nramp1 (natural resistance-associated macrophageprotein one and more recently renamed Slc11a1 (solutecarrier family 11 member 1) regulates intracellular pathogenproliferation and macrophage inflammatory responses (42).Murine Nramp1/S11a1 exhibits a natural polymorphismwith alleles termed resistant and susceptible. Alleles restrictor allow the proliferation of intracellular pathogens (43).A/J mice are more resistant to BCG early in the infectiondue to the influence of Nramp1/S11a1 gene whilst C57BL/6mice express more pronounced MHC II-linked adaptiveimmune responses (44). These genetic differences couldcontribute to the paradoxical effects of BCG infection inthese mice strains co-infected with P. chabaudi AS.
We thus conclude from this study that preinfection of twodifferent mouse strains with BCG 8 weeks prior to P.chabaudi AS super infection results in a reversing of theexpected outcome. The A/J mouse strain (which normallyexperiences high mortality rates following malaria infection),becomes resistant whilst the opposite occurs with theC57BL/6 mouse strain. The possible causes of this paradoxicaleffect of prior BCG infection on malaria super infection arenumerous and almost certainly genetically determined.Some evidence is presented in the experiments describedhere that a priming of the immune system in the A/J straininduces a protective TH1 response (in a mouse strain that isnormally TH2-biased) whilst at the same time resulting in apotentiated TH1 response in the C57BL/6 strain (in a mousestrain that normally TH1-biased), resulting in lethal pathology.
REFERENCES
1 Langhorne J, Quin SJ & Sanni LA. Mouse models of blood-stagemalaria infections: immune responses and cytokines involved inprotection and pathology. Chem Immunol 2002; 80: 204–228.

© 2008 The Authors 11Journal compilation © 2008 Blackwell Publishing Ltd, Parasite Immunology, 30, 1–12
Volume 30, Number 1, January 2008 BCG–malaria co-infection
2 Taylor-Robinson AW, Phillips RS, Severn A, Moncada S &Liew FY. The role of TH1 and TH2 cells in a rodent malariainfection. Science 1993; 260: 1931–1934.
3 Stevenson MM, Tam MF, Belosevic M, van der Meide PH &Podoba JE. Role of endogenous γ interferon in host response toinfection with blood-stage Plasmodium chabaudi AS. InfectImmun 1990; 58: 3225–3232.
4 Stevenson MM, Tam MF, Wolf SF & Sher A. IL-12-inducedprotection against blood-stage Plasmodium chabaudi AS requiresIFN-γ and TNF-α and occurs via a nitric oxide-dependentmechanism. J Immunol 1995; 155: 2545–2556.
5 Langhorne J, Gillard S, Simon B, Slade S & Eichmann K.Frequencies of CD4+ T cells reactive with Plasmodium chabaudichabaudi: distinct response kinetics for cells with Th1 and Th2characteristics during infection. Int Immunol 1989; 1: 416–424.
6 Sam H & Stevenson MM. In vivo IL-12 production and IL-12receptors β1 and β2 mRNA expression in the spleen aredifferentially up-regulated in resistant B6 and susceptible A/Jmice during early blood-stage Plasmodium chabaudi AS malaria.J Immunol 1999; 162: 1582–1589.
7 Stevenson MM & Tam MF. Differential induction of helper Tcell subsets during blood-stage Plasmodium chabaudi AS infectionin resistant and susceptible mice. Clin Exp Immunol 1993; 92:77–83.
8 Yoshimoto T, Takahama Y, Wang CR, et al. A pathogenic roleof IL-12 in blood-stage murine malaria lethal strain Plasmodiumberghei NK65 infection. J Immunol 1998; 160: 5500–5505.
9 Adachi K, Tsutsui H, Kashiwamura S, et al. Plasmodiumberghei infection in mice induces liver injury by an IL-12- andtoll-like receptor/myeloid differentiation factor 88-dependentmechanism. J Immunol 2001; 167: 5928–5934.
10 Stevenson MM & Skamene E. Murine malaria: resistance ofAXB/BXA recombinant inbred mice to Plasmodium chabaudi.Infect Immun 1985; 47: 452–456.
11 Stevenson M, Lemieux S & Skamene E. Genetic control ofresistance to murine malaria. J Cell Biochem 1984; 24: 91–102.
12 Yap GS & Stevenson MM. Plasmodium chabaudi AS: erythro-poietic responses during infection in resistant and susceptible mice.Exp Parasitol 1992; 75: 340–352.
13 Stevenson MM, Ghadirian E, Phillips NC, Rae D & Podoba JE.Role of mononuclear phagocytes in elimination of Plasmodiumchabaudi AS infection. Parasite Immunol 1989; 11: 529–544.
14 Stevenson MM, Lyanga JJ & Skamene E. Murine malaria:genetic control of resistance to Plasmodium chabaudi. InfectImmun 1982; 38: 80–88.
15 Strickland GT & Hunter KW. The use of immunopotentiatorsin malaria. Int J Nucl Med Biol 1980; 7: 133–140.
16 Clark IA, Wills EJ, Richmond JE & Allison AC. Suppression ofbabesiosis in BCG-infected mice and its correlation with tumorinhibition. Infect Immun 1977; 17: 430–438.
17 Clark IA, Allison AC & Cox FE. Protection of mice againstBabesia and Plasmodium with BCG. Nature 1976; 259: 309–311.
18 Taverne J, Dockrell HM & Playfair JH. Endotoxin-inducedserum factor kills malarial parasites in vitro. Infect Immun 1981;33: 83–89.
19 Taverne J, Depledge P & Playfair JH. Differential sensitivityin vivo of lethal and nonlethal malarial parasites to endotoxin-induced serum factor. Infect Immun 1982; 37: 927–934.
20 Clark IA, Virelizier JL, Carswell EA & Wood PR. Possibleimportance of macrophage-derived mediators in acute malaria.Infect Immun 1981; 32: 1058–1066.
21 Haidaris CG, Haynes JD, Meltzer MS & Allison AC. Serumcontaining tumor necrosis factor is cytotoxic for the humanmalaria parasite Plasmodium falciparum. Infect Immun 1983; 42:385–393.
22 Wozencraft AO, Dockrell HM, Taverne J, Targett GA &Playfair JH. Killing of human malaria parasites by macrophagesecretory products. Infect Immun 1984; 43: 664–669.
23 Matsumoto S, Yukitake H, Kanbara H, et al. Mycobacteriumbovis Bacillus Calmette-Guerin induces protective immunityagainst infection by Plasmodium yoelii at blood-stage dependingon shifting immunity toward Th1 type and inducing protectiveIgG2a after the parasite infection. Vaccine 2000; 19: 779–787.
24 Page KR, Jedlicka AE, Fakheri B, et al. Mycobacterium-induced potentiation of type 1 immune responses and protec-tion against malaria are host specific. Infect Immun 2005; 73:8369–8380.
25 Stevenson MM & Riley EM. Innate immunity to malaria. NatRev Immunol 2004; 4: 169–180.
26 Li C, Seixas E & Langhorne J. Rodent malarias: the mouse asa model for understanding immune responses and pathologyinduced by the erythrocytic stages of the parasite. Med MicrobiolImmunol (Berl) 2001; 189: 115–126.
27 Sanni LA, Fonseca LF & Langhorne J. Mouse models forerythrocytic-stage malaria. Meth Mol Med 2002; 72: 57–76.
28 Stevenson MM & Kraal G. Histological changes in the spleenand liver of C57BL/6 and A/J mice during Plasmodium chabaudiAS infection. Exp Mol Pathol 1989; 51: 80–95.
29 Helmby H, Jonsson G & Troye-Blomberg M. Cellular changesand apoptosis in the spleens and peripheral blood of miceinfected with blood-stage Plasmodium chabaudi chabaudi AS.Infect Immun 2000; 68: 1485–1490.
30 Marchal G & Milon G. Decreased erythropoiesis: the origin ofthe BCG induced anaemia in mice. Br J Haematol 1981; 48:551–560.
31 Min-Oo G, Fortin A, Tam MF, Gros P & Stevenson MM.Phenotypic expression of pyruvate kinase deficiency andprotection against malaria in a mouse model. Genes Immun2004.
32 Milon G, Lebastard M & Marchal G. T-dependent productionand activation of mononuclear phagocytes during murine BCGinfection. Immunol Lett 1985; 11: 189–194.
33 Means RT Jr. The anaemia of infection. Bailliere’s Best PracClin Haematol 2000; 13: 151–162.
34 Lewis DK, Whitty CJ, Walsh AL, et al. Treatable factorsassociated with severe anaemia in adults admitted to medicalwards in Blantyre, Malawi, an area of high HIV seroprevalence.Trans R Soc Trop Med Hyg 2005; 99: 561–567.
35 Smith LP, Hunter KW, Oldfield EC & Strickland GT.Murine malaria: blood clearance and organ sequestration ofPlasmodium yoelii-infected erythrocytes. Infect Immun 1982; 38:162–167.
36 Mota MM, Brown KN, Holder AA & Jarra W. Acute Plasmodiumchabaudi chabaudi malaria infection induces antibodies whichbind to the surfaces of parasitized erythrocytes and promotetheir phagocytosis by macrophages in vitro. Infect Immun 1998;66: 4080–4086.
37 Schnitzer B, Sodeman T, Mead ML & Contacos PG. Pittingfunction of the spleen in malaria: ultrastructural observations.Science 1972; 177: 175–177.
38 Nogami S, Watanabe J, Nakagaki K, et al. Involvement ofmacrophage scavenger receptors in protection against murinemalaria. Am J Trop Med Hyg 1998; 59: 843–845.
12 © 2008 The AuthorsJournal compilation © 2008 Blackwell Publishing Ltd, Parasite Immunology, 30, 1–12
A L. Leisewitz et al. Parasite Immunology
39 Taverne J, Bate CA & Playfair JH. Induction of TNF in vitro as amodel for the identification of toxic malaria antigens. LymphokineRes 1989; 8: 317–322.
40 Stevenson MM, Huang DY, Podoba JE & Nowotarski ME.Macrophage activation during Plasmodium chabaudi AS infectionin resistant C57BL/6 and susceptible A/J mice. Infect Immun1992; 60: 1193–1201.
41 Yoshida A, Maruyama H, Kumagai T, et al. Schistosoma mansoniinfection cancels the susceptibility to Plasmodium chabaudithrough induction of type 1 immune responses in A/J mice. IntImmunol 2000; 12: 1117–1125.
42 Wyllie S, Seu P & Goss JA. The natural resistance-associatedmacrophage protein 1 Slc11a1 (formerly Nramp1) and ironmetabolism in macrophages. Microbes Infect 2002; 4: 351–359.
43 Barton CH, Biggs TE, Baker ST, Bowen H & Atkinson PG.Nramp1: a link between intracellular iron transport and innateresistance to intracellular pathogens. J Leukoc Biol 1999; 66:757–762.
44 Buschman E, Vidal S & Skamene E. Nonspecific resistance toMycobacteria: the role of the Nramp1 gene. Behring Inst Mitt1997; 99: 51–57.