Embed Size (px)
Citation preview

BC-12/25: Programme of work and budget for the Basel Convention for the biennium 2016-2017
The Conference of the Parties,
Taking note of the financial reports on the Basel Convention trust funds for 2014 and estimated expenditures for 2015 from the Trust Fund for the Basel Convention on the Control of Transboundary Movements of Hazardous Wastes and Their Disposal (Basel Convention Trust Fund),1
Also taking note of the Office of Internal Oversight Services audit report (number 2014/024), entitled “Provision of efficient and effective Secretariat support to the conventions” and of the efforts made by the Secretariat to quantify the results achieved in implementing joint activities in accordance with the recommendation of the report,
Further taking note of General Assembly resolution 60/283, by which the Assembly approved the adoption of the International Public Sector Accounting Standards by the United Nations,
Recognizing that the International Public Sector Accounting Standards require that full provision be made for doubtful debt in respect of debt that is more than four years in arrears and that proportionate provision be made for more recent arrears and that, as a result, an amount, estimated at 186,984 United States dollars, will have to be deducted from the end 2014 fund balance of the Basel Convention Trust Fund to cover doubtful debt and cannot be used for the benefit of all parties during the biennium 2016–2017,
I Trust Fund for the Basel Convention on the Control of Transboundary
Movements of Hazardous Wastes and Their Disposal 1. Takes note of the recommendation of the Office of Internal Oversight Services to
establish a single operational account for staff costs, and in this regard invites the Executive Director of the United Nations Environment Programme to provide additional information, which will be immediately made available through the bureaux of the conferences of the parties to the Basel Convention on the Control of Transboundary Movements of Hazardous Wastes and Their Disposal, the Rotterdam Convention on the Prior Informed Consent Procedure for Certain Hazardous Chemicals and Pesticides in International Trade and the Stockholm Convention on Persistent Organic Pollutants, on the practical implications of such a measure and on the establishment of a single joint general trust fund for the Basel, Rotterdam and Stockholm conventions and to make proposals on any required changes to the financial rules, which will inform a decision at the next meetings of the conferences of the parties;
2. Invites the Executive Director of the United Nations Environment Programme to explore the possibility of establishing a single joint voluntary trust fund for the Basel, Rotterdam and Stockholm conventions, to provide information to the bureaux as soon as possible and to present proposals at the next meetings of the conferences of the parties;
3. Approves the programme budget for the Basel Convention for the biennium 2016–2017 of 4,800,854 United States dollars for 2016 and 4,603,990 United States dollars for 2017 for the purposes set out in table 1 of the present decision, which are presented by budget code line in table 2 of the present decision;
4. Authorizes the Executive Secretary of the Basel Convention to make commitments in an amount up to the approved operational budget, drawing upon available cash resources;
5. Decides to maintain the working capital reserve at the level of 15 per cent of the annual average of the biennial operational budgets for 2016–2017;
6. Adopts the indicative scale of assessments for the apportionment of expenses for the biennium 2016–2017 set out in table 4 of the present decision, and authorizes the Executive Secretary, consistent with the Financial Regulations and Rules of the United Nations, to adjust the scale to include all parties for which the Convention enters into force before 1 January 2016 for 2016 and before 1 January 2017 for 2017;
1 See UNEP/CHW.12/INF/39.
2
7. Recognizes that contributions to the Basel Convention Trust Fund are due by or on 1 January of the year for which those contributions have been budgeted, requests parties to pay their contributions promptly, encourages parties in a position to do so to pay their contributions by 16 October 2015 for the calendar year 2016 and by 16 October 2016 for the calendar year 2017, and requests the Secretariat to notify parties of the amount of their contributions as early as possible in the year preceding the year in which they are due;
8. Notes with concern that a number of parties have not paid their contributions to the Basel Convention Trust Fund for 2014 and prior years, contrary to the provisions of paragraph 3 (a) of rule 5 of the financial rules, and urges parties to pay their contributions promptly, by or on 1 January of the year to which the contributions apply;
9. Decides, with regard to contributions due from 1 January 2010 onwards, that no representative of any party whose contributions are in arrears for two or more years shall be eligible to become a member of the Bureau of the Conference of the Parties or a member of any subsidiary body of the Conference of the Parties, provided, however, that this shall not apply to parties that are least developed countries or small island developing States or to parties that have agreed on and are respecting a schedule of payments in accordance with the financial rules;
10. Recalls the provisions of paragraph 3 (e) of rule 5 of the financial rules on outstanding contributions due from 1 January 2001 onwards, and decides that no representative of any party whose contributions are in arrears for four or more years and that has not agreed on or is not respecting a schedule of payments implemented in accordance with paragraph 3 (d) of rule 5 of the financial rules shall be eligible to receive financial support to attend intersessional workshops and other informal meetings, as arrears that have been outstanding for more than four years have to be treated as 100 per cent doubtful debts under the International Public Sector Accounting Standards;
11. Requests the Executive Secretary, and invites the President of the Conference of the Parties, to notify, through a jointly signed letter, the ministers of foreign affairs of those parties whose contributions are in arrears, inviting them to take timely action, and to thank those parties that have responded in a positive manner in paying their outstanding contributions;
12. Decides to further consider additional incentives and measures to address arrears in core budget contributions to the Convention in an effective and efficient manner at its next meeting;
13. Takes note of the indicative staffing table for the Secretariat for the biennium 2016–2017 used for costing purposes to set the overall budget, which is set out in table 5 of the present decision;
14. Authorizes the Executive Secretary to continue to determine the staffing levels, numbers and structure of the Secretariat in a flexible manner, provided that he remain within the overall cost of the staff numbers set out in table 5 of the present decision for the biennium 2016–2017 as recommended by the Office of Internal Oversight Services in its audit report;
15. Invites the Executive Director of the United Nations Environment Programme to continue to ensure that staff training to comply with United Nations mandatory training for staff members is financed from programme support costs since it represents an overhead cost in the operations of the Secretariat;
II Trust Fund to Assist Developing Countries and other Countries in Need of
Technical Assistance in the Implementation of the Basel Convention 16. Takes note of the funding estimates included in table 3 of the present decision for
activities under the Convention to be financed from the Trust Fund to Assist Developing Countries and other Countries in Need of Technical Assistance in the Implementation of the Basel Convention on the Control of Transboundary Movements of Hazardous Wastes and Their Disposal (Technical Cooperation Trust Fund) in the amount of 4,719,210 United States dollars for 2016 and 4,333,947 United States dollars for 2017;
17. Notes that the Technical Cooperation Trust Fund requirement presented in the budget represents its best efforts to be realistic and reflects priorities agreed by all parties and urges parties and invites non-parties and others to make voluntary contributions to the Technical Cooperation Trust Fund so as to encourage contributions from donors;
18. Also notes the importance of having funding available in the Technical Cooperation Trust Fund for the participation in the meetings of the Convention of developing-country parties, in

3
particular the least developed countries and small island developing States, and parties with economies in transition;
19. Urges parties, and invites others in a position to do so, to contribute urgently to the Technical Cooperation Trust Fund with a view to ensuring the full and effective participation of developing-country parties, in particular least developed countries and small island developing States, and parties with economies in transition, in the meetings of the Conference of the Parties;
III Preparations for the next biennium
20. Decides that the two trust funds for the Convention shall be continued until 31 December 2017 and requests the Executive Director of the United Nations Environment Programme to extend them for the biennium 2016–2017, subject to the approval of the United Nations Environment Assembly of the United Nations Environment Programme;
21. Requests the Executive Secretary, in the context of the report on the implementation of joint and convention-specific activities, to include a section on the gender action plan;
22. Also requests the Executive Secretary, bearing in mind decision BC.Ex-2/1 on enhancing cooperation and coordination among the Basel, Rotterdam and Stockholm conventions, further to enhance efficiency in the use of financial and human resources in accordance with the priorities set by the Conference of the Parties and to report on the outcome of his efforts in that regard;
23. Further requests the Executive Secretary to prepare a budget for the biennium 2018–2019, for consideration by the Conference of the Parties at its thirteenth meeting, explaining the key principles, assumptions and programmatic strategy on which the budget is based and presenting expenditures for the 2018–2019 period in both a programmatic format and by budget code line;
24. Notes the need to facilitate priority-setting by providing parties with timely information on the financial consequences of various options and, to that end, requests the Executive Secretary to include in the proposed operational budget for the biennium 2018–2019 two alternative funding scenarios that take account of any efficiencies identified as a result of paragraph 22 above and are based on:
(a) The Executive Secretary’s assessment of the required changes in the operational budget, which should not exceed a 5 per cent increase on the 2016–2017 level in nominal terms, to finance all proposals before the Conference of the Parties that have budgetary implications;
(b) Maintaining the operational budget at the 2016–2017 level in nominal terms;
25. Requests the Executive Secretary to report to the Open-ended Working Group and to the Bureau on all sources of income received, including the reserve and fund balances and interest, together with actual, provisional and projected expenditures and commitments, and to report on all expenditures against the agreed budget lines;
26. Also requests the Executive Secretary at the thirteenth ordinary meeting of the Conference of the Parties to provide, where relevant, cost estimates for actions that have budgetary implications that are not foreseen in the draft programme of work but are included in proposed draft decisions before the adoption of those decisions by the Conference of the Parties;
27. Stresses the need to ensure that the proposal for the 2018–2019 Technical Cooperation Trust Fund requirement presented in the budget is realistic and represents agreed priorities of all parties so as to encourage voluntary contributions from all sources.

4
Table 1
Programme budget for 2016–2017 (in United States dollars)
Activities related to the Basel, Rotterdam and Stockholm conventions
Activities
2016 2017
Source of funding Source of funding
Basel Convention Rotterdam Convention Stockholm Convention Annual Basel Convention Rotterdam Convention Stockholm Convention Annual Biennium
BCTF budget
BDTF budget
ROTF budget
RVTF budget SCTF budget SVTF
budget
Total funding
General TF
Total funding
Special TF BCTF BDTF ROTF RVTF SCTF SVTF
Total funding
General TF
Total funding Special
TF
Total funding General
TF
Total funding
Special TF
1 (BC) Thirteenth meeting of the Conference of the Parties to the Basel Convention (including high-level segment of 1 day)
50 000 50 000 507 575 978 163 507 575 978 163 557 575 978 163
2 (RC) Eighth meeting of the Conference of the Parties to the Rotterdam Convention (including high-level segment of 1 day)
422 000 422 000 135 575 978 163
135 575 978 163 557 575 978 163
3 (SC) Eighth meeting of the Conference of the Parties to the Stockholm Convention including high-level segment of 1 day)
30 000 30 000 527 575 978 163 527 575 978 163 557 575 978 163
4 (BC) Tenth meeting of the Open-ended Working Group to the Basel Convention
347 982 669 512 347 982 669 512 347 982 669 512
5 (RC) Twelfth and thirteenth meetings of the Chemical Review Committee (CRC) and orientation workshop for CRC members
258 604 89 535 − 258 604 89 535 258 604 258 604 517 208 89 535
6 (SC) Twelfth and thirteenth meetings of the Persistent Organic Pollutants Review Committee (POPRC)
431 481 20 632 431 481 20 632 431 481 85 102 431 481 85 102 862 962 105 734
7 (BC) Meeting of the Bureau of the conference of the Parties to the Basel Convention and joint meetings of the bureaux to
50 900 50 900 50 900

5
Activities
2016 2017
Source of funding Source of funding
Basel Convention Rotterdam Convention Stockholm Convention Annual Basel Convention Rotterdam Convention Stockholm Convention Annual Biennium
BCTF budget
BDTF budget
ROTF budget
RVTF budget SCTF budget SVTF
budget
Total funding
General TF
Total funding
Special TF BCTF BDTF ROTF RVTF SCTF SVTF
Total funding
General TF
Total funding Special
TF
Total funding General
TF
Total funding
Special TF
the Basel, Rotterdam and Stockholm conventions
8 (RC) Meeting of the Bureau of the conference of the Parties to the Rotterdam Convention and joint meetings of the bureaux to the Basel, Rotterdam and Stockholm conventions
30 200 30 200 30 200
9 (SC) Meeting of the Bureau of the Conference of the Parties to the Stockholm Convention and joint meetings of the bureaux to the Basel, Rotterdam and Stockholm conventions
44 000 44 000 44 000
10 (BC) Meeting of the Basel Convention Implementation and Compliance Committee
42 680 30 280 42 680 30 280 42 680 30 280
11 (RC) Orientation workshop for CRC members- included under activity 5
12 (S6) Support the work of and coordination between the scientific bodies of the conventions
4 000 4 000 4 000 12 000 12 000
2016–2017 totals (non-staff cost)
491 562 703 792 710 804 93 535 505 481 24 632 1 707 847 821 959 507 575 978 163 394 179 978 163
959 056 1 063 265 1 860 810 3 019 591 3 568 657 3 841 550
2016–2017 totals (staff cost)
851 254 197 120 988 973 82 500 1 156 685 136 016 2 996 912 415 636 891 401 232 960 1 067 888 85 800 1 200 052 141 457 3 159 341 460 217 6 156 253 6 571 889

6
2. Technical assistance and capacity-building
a. Development of tools and methodologies Activity No. 2016–2017
Activities 2016 2017
Source of funding Source of funding
Basel Convention
Rotterdam Convention
Stockholm Convention Annual Basel Convention Rotterdam Convention Stockholm Annual Biennium
BCTF budget
BDTF budget
ROTF budget
RVTF budget
SCTF budget
SVTF budget
Total funding General
TF
Total funding Special
TF
BCTF BDTF ROTF RVTF SCTF SVTF
Total funding General
TF
Total funding Special
TF
Total funding General
TF
Total funding
Special TF
13 (S1) Tools and methodologies for training and capacity-building
15 000 307 000 15 000 284 000 15 000 313 000 45 000 904 000 15 000 225 000 15 000 226 000 15 000 245 000 45 000 696 000 90 000 1 600 000
2016–2017 total technical assistance and capacity- building a)
15 000 307 000 15 000 284 000 15 000 313 000 45 000 904 000 15 000 225 000 15 000 226 000 15 000 245 000 45 000 696 000 90 000 1 600 000
b. Capacity-building and training
14 (BC) Training and capacity-building activities to enhance the implementation of the Basel Convention at the regional level
870 000 870 000 600 000 600 000 1 470 000
15 (RC) Training and capacity-building activities to enhance the implementation of the Rotterdam Convention at national and regional levels
1 178 600 1 178 600 778 400 778 400 1 957 000
16 (SC) Training and capacity-building activities to enhance the implementation of the Stockholm Convention at the regional level
1 190 800 - 1 190 800 616 200 - 616 200 1 807 000

7
Activity No. 2016–2017
Activities 2016 2017
Source of funding Source of funding
Basel Convention
Rotterdam Convention
Stockholm Convention Annual Basel Convention Rotterdam Convention Stockholm Annual Biennium
17 (S2/S3) Training and capacity-building activities to enhance the implementation of the Basel, Rotterdam and Stockholm conventions at the regional and national levels
532 000 540 000 530 000 1 602 000 341 000 354 000 368 000 1 063 000 2 665 000
2016–2017 total assistance and capacity building b)
1 402 000 1 718 600 1 720 800 4 841 400 941 000 1 132 400 984 200 3 057 600 7 899 000
c. Partnerships
18 (S4) Partnerships for technical assistance
150 000 190 000 70 000 410 000 122 000 147 000 26 000 295 000 - 705 000
2016–2017 total assistance and capacity building c)
44 150 311 500 44 150 237 500 88 300 549 000 205 000 279 000 484 000 88 300 1 033 000
d. Regional centres 19 (S8/9) Coordination of and
support to the Basel and Stockholm Convention regional centres and cooperation and coordination between regional centres
44 150 311 500 44 150 237 500 88 300 549 000 - 205 000 279 000 1 033 000
2016–2017 total assistance and capacity building d)
44 150 311 500 44 150 237 500 88 300 549 000 279 000 1 033 000
2016–2017 totals
(non-staff cost) 59 150 2 170 500 15 000 2 192 600 59 150 2 341 300 133 300 6 704 400 15 000 1 493 000 15 000 1 505 400 15 000 1 534 200 45 000 4 532 600 178 300 11 237 000
2016–2017 totals (staff cost)
408 590 232 960 496 261 178 750 415 913 374 044 1 320 764 785 754 430 656 293 530 555 654 185 900 429 604 389 006 1 415 914 868 435 2 736 678 1 654 189
8
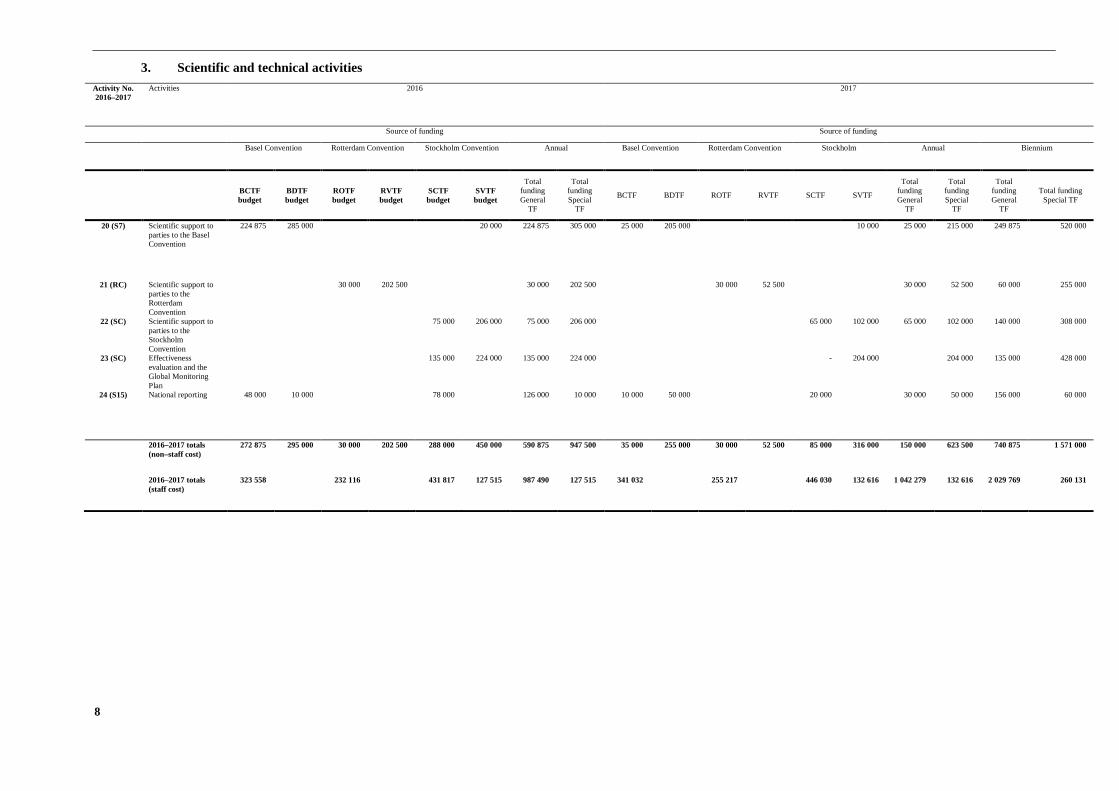
3. Scientific and technical activities Activity No. 2016–2017
Activities 2016 2017
Source of funding Source of funding
Basel Convention
Rotterdam Convention Stockholm Convention Annual Basel Convention Rotterdam Convention Stockholm Annual Biennium
BCTF budget
BDTF budget
ROTF budget
RVTF budget
SCTF budget
SVTF budget
Total funding General
TF
Total funding Special
TF
BCTF BDTF ROTF RVTF SCTF SVTF
Total funding General
TF
Total funding Special
TF
Total funding General
TF
Total funding Special TF
20 (S7) Scientific support to parties to the Basel Convention
224 875 285 000 20 000 224 875 305 000 25 000 205 000 10 000 25 000 215 000 249 875 520 000
21 (RC) Scientific support to parties to the Rotterdam Convention
30 000 202 500 30 000 202 500 30 000 52 500 30 000 52 500 60 000 255 000
22 (SC) Scientific support to parties to the Stockholm Convention
75 000 206 000 75 000 206 000 65 000 102 000 65 000 102 000 140 000 308 000
23 (SC) Effectiveness evaluation and the Global Monitoring Plan
135 000 224 000 135 000 224 000 - 204 000 204 000 135 000 428 000
24 (S15) National reporting 48 000 10 000 78 000 126 000 10 000 10 000 50 000 20 000 30 000 50 000 156 000 60 000
2016–2017 totals (non–staff cost)
272 875 295 000 30 000 202 500 288 000 450 000 590 875 947 500 35 000 255 000 30 000 52 500 85 000 316 000 150 000 623 500 740 875 1 571 000
2016–2017 totals (staff cost)
323 558 232 116 431 817 127 515 987 490 127 515 341 032 255 217 446 030 132 616 1 042 279 132 616 2 029 769 260 131

9
4. Knowledge and information management and outreach
Activity No. 2016–2017
Activities 2016 2017
Source of funding Source of funding
Basel Convention
Rotterdam Convention
Stockholm Convention Annual Basel Convention Rotterdam Convention Stockholm Annual Biennium
BCTF budget
BDTF budget
ROTF budget
RVTF budget
SCTF budget
SVTF budget
Total funding General
TF
Total funding Special
TF
BCTF BDTF ROTF RVTF SCTF SVTF
Total funding General
TF
Total funding Special
TF
Total funding General
TF
Total funding Special
TF
25 (S10) Clearing-house mechanism for information exchange, including PIC database and Rotterdam Convention website in English, French and Spanish
45 600 42 400 14 400 31 700 61 600 42 400 121 600 116 500 45 600 42 400 14 400 31 700 61 600 42 400 121 600 116 500 243 200 233 000
26 (S14) Publications 26 700 26 600 26 700 80 000 6 700 6 600 6 700 20 000 100 000
27 (S12/S13)
Joint communication, outreach and public awareness
1 000 1 000 1 000 3 000 1 000 17 500 1 000 15 000 1 000 17 500 3 000 50 000 6 000 50 000
2016–2017 totals (non-staff cost)
73 300 42 400 42 000 31 700 89 300 42 400 204 600 116 500 53 300 59 900 22 000 46 700 69 300 59 900 144 600 166 500 349 200 283 000
2016–2017 totals (staff cost)
373 661 566 050 13 750 556 234 34 004 1 495 945 47 754 393 841 9 318 632 389 14 300 574 543 35 364 1 600 773 58 983 3 096 718 106 737

10
5. Overall management Activity No. 2016–2017
Activities 2016 2017
Source of funding Source of funding
Basel Convention
Rotterdam Convention
Stockholm Convention Annual Basel Convention Rotterdam Convention Stockholm Annual Biennium
BCTF budget
BDTF budget
ROTF budget
RVTF budget
SCTF budget
SVTF budget
Total funding General
TF
Total funding Special
TF
BCTF BDTF ROTF RVTF SCTF SVTF
Total funding General
TF
Total funding Special
TF
Total funding General
TF
Total funding Special
TF
28 (S18) Executive direction and management
64 400 144 081 106 434 314 915 57 900 81 346 98 434 237 680 552 595
29 (S19) International cooperation and coordination
30 (S16) Resource mobilization
9 000 9 000 166 500 20 000 184 500 20 000 9 000 9 000 - 40 500 - 58 500 243 000 20 000
31 (S17) Support for the review of the synergies decisions
45 200 30 300 45 200 120 700 120 700
2016–2017 totals (non-staff cost)
118 600 183 381 318 134 20 000 620 115 20 000 66 900 90 346 138 934 296 180 916 295 20 000
2016–2017 totals (staff cost)
367 775 288 894 631 385 170 020 1 288 054 170 020 396 555 - 317 645 - 652 168 176 821 1 366 368 176 821 2 654 423 346 841

11
6. Legal and policy Activity No. 2016–2017
Activities 2016 2017
Source of funding Source of funding
Basel Convention
Rotterdam Convention
Stockholm Convention Annual Basel Convention Rotterdam Convention
Stockholm Annual Biennium
BCTF budget
BDTF budget
ROTF budget
RVTF budget
SCTF budget
SVTF budget
Total funding General
TF
Total funding Special
TF
BCTF BDTF ROTF RVTF SCTF SVTF
Total funding General
TF
Total funding Special
TF
Total funding
General TF
Total funding Special
TF
32 (BC) Legal and policy activities specific to the Basel Convention
190 000 190 000 190 000 190 000 380 000
33 (S20) Legal and policy activities under the Basel Rotterdam and Stockholm conventions; national legislation, illegal traffic and trade and enforcement under the Basel, Rotterdam and Stockholm conventions
20 000 20 000 20 000
34 (BC) Coordinate and provide support to parties in follow-up to the country led initiative on environmentally sound management and further legal clarity
217 000 217 000 207 000 207 000 424 000
2016–2017 totals (non-staff cost)
427 000 427 000 - 397 000 397 000 824 000
2016–2017 totals (staff cost)
391 080 107 520 27 934 236 423 8 501 655 437 116 021 409 098 116 480 30 214 238 913 8 841 678 225 125 321 1 333 662 241 342

12
7. Office maintenance and services Activity No. 2016–2017
Activities 2016 2017
Source of funding Source of funding
Basel Convention Rotterdam Convention Stockholm Convention Annual Basel Convention Rotterdam Convention Stockholm Annual Biennium
BCTF budget
BDTF budget
ROTF budget
RVTF budget
SCTF budget
SVTF budget
Total funding
General TF
Total funding
Special TF BCTF BDTF ROTF RVTF SCTF SVTF
Total funding
General TF
Total funding
Special TF
Total funding
General TF
Total funding
Special TF
35 (S21) Office maintenance and services
153 000 74 100 243 000 470 100 153 000 74 100 243 000 470 100 940 200
36 (S11) Joint information technology services
52 500 32 500 72 500 157 500 52 500 32 500 72 500 157 500 315 000
2016–2017 totals (non-staff cost)
205 500 106 600 315 500 627 600 205 500 106 600 315 500 627 600 1 255 200
2016–2017 totals (staff cost)
311 639 2 093 33 059 346 790 328 469 2 301 34 147 364 917 711 708
2016–2017 totals (non-staff cost)
1 220 978 3 638 692 1 087 785 2 520 335 1 575 565 2 878 332 3 884 337 9 037 359 883 275 3 183 063 658 125 2 582 763 1 582 790 2 973 365 3 124 190 8 739 191 7 008 527 17 776 550
2016–2017 totals (staff cost)
3 027 556 537 600 2 602 320 275 000 3 461 516 850 100 9 091 393 1 662 700 3 191 053 652 288 2 861 307 286 000 3 575 458 884 104 9 627 818 1 822 392 18 719 210 3 485 092
2016–2017 Grand totals
4 248 543 4 176 292 3 690 105 2 795 335 5 037 081 3 728 432 12 975 730 10 700 059 4 074 328 3 835 351 3 519 432 2 868 763 5 158 248 3 857 469 12 752 008 10 561 583 25 727 737 21 261 642

13
Summary of the Programme budget for 2016–2017 by heading (in United States dollars)
2016 2017
BCTF BDTF ROTF RVTF SCTF SVTF Total Gen TF
Total Vol TF
BCTF BDTF ROTF RVTF SCTF SVTF Total Gen TF
Total Vol TF
Conferences and meetings
491 562 703 792 710 804 93 535 505 481 24 632 1 707 847 821 959 507 575 978 163 394 179 978 163 959 056 1 063 265 1 860 810 3 019 591
Technical assistance and capacity-building
59 150 2 170 500 15 000 2 192 600 59 150 2 341 300 133 300 6 704 400 15 000 1 493 000 15 000 1 505 400 15 000 1 534 200 45 000 4 532 600
Scientific and technical activities
272 875 295 000 30 000 202 500 288 000 450 000 590 875 947 500 35 000 255 000 30 000 52 500 85 000 316 000 150 000 623 500
Knowledge and information management and outreach
73 300 42 400 42 000 31 700 89 300 42 400 204 600 116 500 53 300 59 900 22 000 46 700 69 300 59 900 144 600 166 500
Overall management
118 600 183 381 - 318 134 20 000 620 115 20 000 66 900 90 346 138 934 296 180
Legal and policy
427 000 427 000 397 000 397 000
Office maintenance and services
205 500 106 600 315 500 627 600 205 500 106 600 315 500 627 600
Total non–staff costs
1 220 987 3 638 692 1 087 785 2 520 335 1 575 565 2 878 332 3 884 337 9 037 359 883 275 3 183 063 658 125 2 582 763 1 582 790 2 973 365 3 124 190 8 739 191
Total staff costs
3 027 547 537 600 2 602 320 275 000 3 461 516 850 100 9 091 384 1 662 700 3 191 053 652 288 2 861 307 286 000 3 575 458 884 104 9 627 818 1 822 392
Total programme requirements
4 248 543 4 176 292 3 690 105 2 795 335 5 037 081 3 728 432 12 975 730 10 700 059 4 074 328 3 835 351 3 519 432 2 868 763 5 158 248 3 857 469 12 752 008 10 561 583
General TF Special TF BCTF BDTF ROTF RVTF SCTF SVTF
BRS total budget
25 727 737 21 261 642 8 322 871 8 011 643 7 209 538 5 664 098 10 195 329 7 585 901
Increase from biennium to biennium
-0.11% 7.02% -2.89% 24.67% 6.66% -11.55% -2.21% 7.79%

14
Table 2
Programme of work for 2016–2017 funded via the general trust funds of the Basel (BC) Rotterdam (RO) and Stockholm (SC) conventions
Operational budget for 2016–2017 (in United States dollars)
Summary table of total costs per budget code level and by convention trust fund
Year 2016 Year 2017 2016-2017
BC RC SC Total BC RC SC Total Total
10 Project personnel component 1100 Professional staff
1101 Executive Secretary (D-2) 125 091 15 255 164 754 305 100 126 922 31 730 158 652 317 304 622 404
1111 Executive Secretary (D-2) (0.25 in kind by FAO)
1131 Deputy Executive Secretary (D-1) 116 563 14 215 153 522 284 300 118 269 29 567 147 836 295 672 579 972
1135 Chief of Branch (P-5) SSB 103 320 12 600 136 080 252 000 107 453 13 104 141 523 262 080 514 080
1133 Chief of Branch (P-5) COB 103 320 12 600 136 080 252 000 107 453 13 104 141 523 262 080 514 080
1134 Chief of Branch (P-5) TAB 103 320 12 600 136 080 252 000 107 453 13 104 141 523 262 080 514 080
1132 Chief of Branch (P-5) ASB
1112 Senior Programme Officer - FAO (P-5) 263 309 263 309 273 841 273 841 537 150
1103 Programme Officer (P-3) (replacing retired P-5 in 2015) 59 733 59 733 186 368 186 368 246 101
1104 Senior Programme Officer (P-5) (only for 2016) 252 000 252 000 252 000
1108 Programme Officer (P-3) (replacing retired P-5 in 2015) 186 368 186 368 186 368
1105 Senior Programme Officer (P-5) 252 000 252 000 262 080 262 080 514 080
1106 Policy and Legal Adviser (P-4) 216 700 216 700 225 368 225 368 442 068
1107 Programme Officer (P-4) 216 700 216 700 225 368 225 368 442 068
OTA Administrative Officer (P-4) (by UNEP OTL)
1109 Programme Officer - National Reporting (P-3) 179 200 179 200 186 368 186 368 365 568
1110 Programme Officer - Information Officer (P-3) 179 200 179 200 186 368 186 368 365 568
1111 Programme Officer (P-3) 179 200 179 200 186 368 186 368 365 568
1112 Associate Programme Officer - Computer Systems (P-2) 146 600 146 600 152 464 152 464 299 064
1113 Associate Legal Officer (upgrade to P-3) 179 200 179 200 186 368 186 368 365 568
Transitional adjustment

15
Subtotal BC staff 2 412 147 330 579 726 516 2 551 037 374 451 731 058
1105 Programme Officer (P-4) 216 700 216 700 225 368 225 368 442 068
1106 Programme Officer (P-4) 216 700 216 700 225 368 225 368 442 068
1107 Senior Programme Officer (P-5) 252 000 252 000 262 080 262 080 514 080
1108 Programme Officer (P-3) - 179 200 179 200 - 186 368 186 368 365 568
OTA Administrative Officer (P-4) (0.5 by UNEP OTL) ¬
1111 Legal Officer (P-3) ¬ 179 200 179 200 186 368 186 368 365 568
1112 Associate Programme Officer (upgrade to P-3) ¬ 179 200 179 200 186 368 186 368 365 568
1114 Project Information System Officer (P-3) ¬ 179 200 179 200 186 368 186 368 365 568
1116 Programme Officer (upgrade to P-4) ¬ 216 700 216 700 225 368 225 368 442 068
1117 Programme Officer (P-3) ¬ 179 200 179 200 186 368 186 368 365 568
1118 Programme Officer (P-4) ¬ 216 700 216 700 225 368 225 368 442 068
Transitional adjustment
Subtotal SC staff 2 741 316 2 826 450
1102 Programme Officer (P-3) (replacing retired P-5 in 2014) 59 733 59 733 186 368 186 368 246 101
1103 Programme Officer (P-4) 216 700 216 700 225 368 225 368 442 068
OTA Administrative Officer (P-4) (0.5 by UNEP OTL) ¬ ¬
1105 Programme Officer (P-3) 179 200 179 200 186 368 186 368 365 568
1104 Programme Officer (P-3) 179 200 179 200 186 368 186 368 365 568
1106 Public Awareness Officer (P-3) 179 200 179 200 186 368 186 368 365 568
1108 Programme Officer (P-3) 179 200 179 200 186 368 186 368 365 568
1113 Programme Officer - FAO (P-4) 229 551 229 551 238 733 238 733 468 285
1114 Programme Officer (P-3) (in kind by FAO) ¬ ¬
1116 Programme Officer - FAO (P-3) 183 242 183 242 190 572 190 572 373 814
1117 Programme Officer- FAO (P-3) 183 242 183 242 190 572 190 572 373 814
1118 Programme Officer - FAO (P-2) 138 226 138 226 143 755 143 755 281 981
Transitional adjustment
Subtotal RC staff 2 058 074 2 295 291
1199 Total 2 412 147 2 058 074 2 741 316 7 211 538 2 551 037 2 295 291 2 826 450 7 672 778 14 884 315
1200 Consultants

16
1203 Consultant (PACE)
1201 Consultant (HSC codes) 25 000 25 000 25 000 25 000 50 000
1202 Consultant (e-waste technical guidelines)
1204 Consultant to develop generic inventory tool for collection of data on hazardous wastes
1205 Consultant for resource mobilization database (funded from fund balance) 1 500 1 500 1 500 4 500 1 500 1 500 1 500 4 500 9 000
1204 Consultants for resource kit
1206 Consultants (scientific support for SC) 20 000 20 000 5 000 5 000 25 000
1207 Consultants (effectiveness evaluation for SC) 50 000 50 000 50 000
1208 Consultants (GMP for SC) 20 000 20 000 20 000
1209 Consultant (fourth review of financial mechnism SC) ¬ 105 000 105 000 105 000
1210 Consultant (needs assessment SC) ¬ 52 500 52 500 31 500 31 500 84 000
1211 Consultant (POPRC review) 10 000 10 000 10 000
1281 Consultant (national reporting BC and SC) 48 000 ¬ 78 000 126 000 10 000 20 000 30 000 156 000
1282 Consultants (clearing- house mechanism)
1283 Consultant (synergies review) 40 200 26 800 40 200 107 200 107 200
1290 Staff training - language
1291 Staff training - management and communication
1299 Total 114 700 28 300 377 200 520 200 36 500 1 500 58 000 96 000 616 200
13 Administrative support
1300 General Service staff
OTA Administrative Assistant (by UNEP OTL) ¬ ¬
1302 Senior Team Assistant 170 200 ¬ 170 200 177 008 ¬ 177 008 347 208
1303 Meetings/Documents Assistant 170 200 ¬ 170 200 177 008 ¬ 177 008 347 208
1306 Information Assistant 137 500 ¬ 137 500 143 000 ¬ 143 000 280 500
OTA Finance and Budget Assistant (by UNEP OTL) ¬ ¬
1307 Programme Assistant 137 500 ¬ 137 500 143 000 ¬ 143 000 280 500
Subtotal BC staff 615 400 640 016
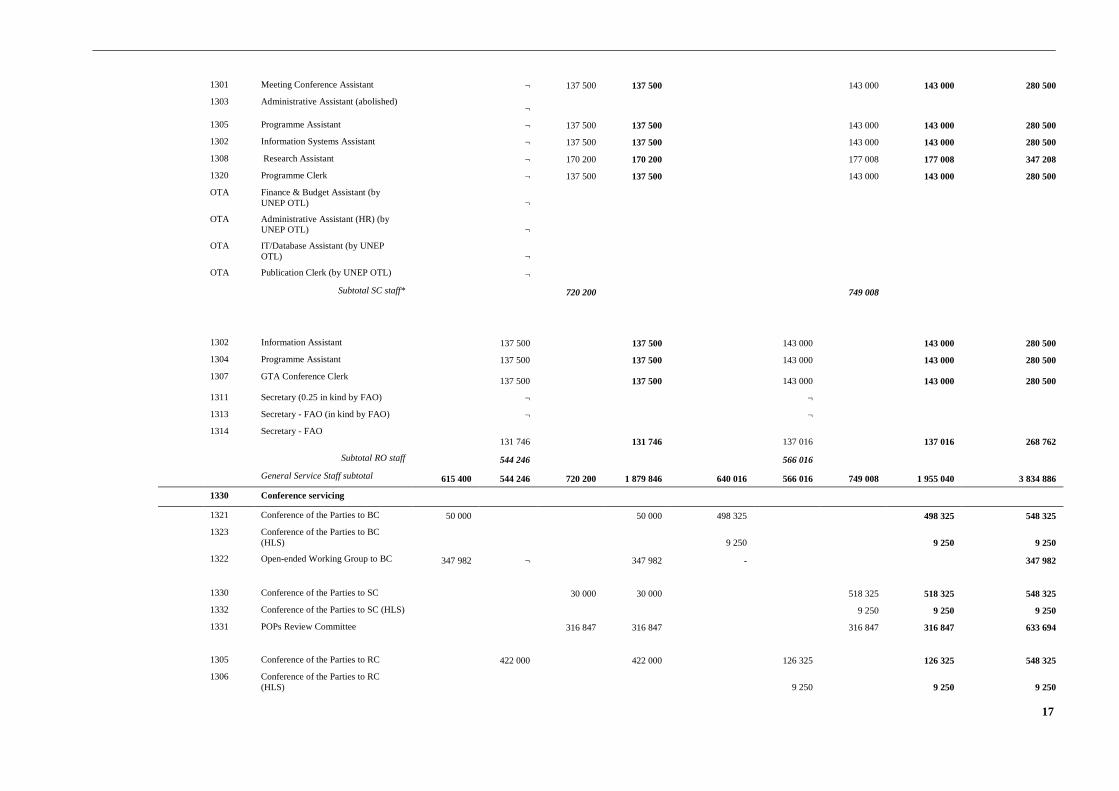
17
1301 Meeting Conference Assistant ¬ 137 500 137 500 143 000 143 000 280 500
1303 Administrative Assistant (abolished) ¬
1305 Programme Assistant ¬ 137 500 137 500 143 000 143 000 280 500
1302 Information Systems Assistant ¬ 137 500 137 500 143 000 143 000 280 500
1308 Research Assistant ¬ 170 200 170 200 177 008 177 008 347 208
1320 Programme Clerk ¬ 137 500 137 500 143 000 143 000 280 500
OTA Finance & Budget Assistant (by UNEP OTL) ¬
OTA Administrative Assistant (HR) (by UNEP OTL) ¬
OTA IT/Database Assistant (by UNEP OTL) ¬
OTA Publication Clerk (by UNEP OTL) ¬
Subtotal SC staff* 720 200 749 008
1302 Information Assistant 137 500 137 500 143 000 143 000 280 500
1304 Programme Assistant 137 500 137 500 143 000 143 000 280 500
1307 GTA Conference Clerk 137 500 137 500 143 000 143 000 280 500
1311 Secretary (0.25 in kind by FAO) ¬ ¬
1313 Secretary - FAO (in kind by FAO) ¬ ¬
1314 Secretary - FAO 131 746 131 746
137 016 137 016 268 762
Subtotal RO staff 544 246 566 016
General Service Staff subtotal 615 400 544 246 720 200 1 879 846 640 016 566 016 749 008 1 955 040 3 834 886
1330 Conference servicing
1321 Conference of the Parties to BC 50 000 50 000 498 325 498 325 548 325
1323 Conference of the Parties to BC (HLS) 9 250 9 250 9 250
1322 Open-ended Working Group to BC 347 982 ¬ 347 982 - 347 982
1330 Conference of the Parties to SC 30 000 30 000 518 325 518 325 548 325
1332 Conference of the Parties to SC (HLS) 9 250 9 250 9 250
1331 POPs Review Committee 316 847 316 847 316 847 316 847 633 694
1305 Conference of the Parties to RC 422 000 422 000 126 325 126 325 548 325
1306 Conference of the Parties to RC (HLS) 9 250 9 250 9 250

18
1331 Chemical Review Committee 143 466 143 466 143 466 143 466 286 932
1387 Donor round table meetings 2 500 2 500 2 500 7 500 2 500 2 500 2 500 7 500 15 000
1388 Conference servicing (Regional Centres)
1389 Conference servicing (Partnerships)
Conference servicing subtotal 400 482 567 966 349 347 1 317 795 510 075 281 541 846 922 1 638 538 2 956 333
1399 Total 1 015 882 1 112 212 1 069 547 3 197 641 1 150 091 847 557 1 595 930 3 593 578 6 791 219
1600 Travel on official business
1601 Official travel 59 400 139 081 101 434 299 915 52 900 76 346 93 434 222 680 522 595
1699 Total 59 400 139 081 101 434 299 915 52 900 76 346 93 434 222 680 522 595
1999 Component total 3 602 129 3 337 667 4 289 497 11 229 294 3 790 528 3 220 694 4 573 814 11 585 036 22 814 329
20 Subcontract component
2200 Subcontracts
2203 Resource kit
2202 Pilot activities (regional centres)
2204 Subcontracts (information management of the Secretariat) 15 675 4 650 15 675 36 000 15 675 4 650 15 675 36 000 72 000
2201 Subcontracts (clearing-house mechanism based on priorities)
13 225 4 650 23 225 41 100 13 225 4 650 23 225 41 100 82 200
2299 Total 28 900 9 300 38 900 77 100 28 900 9 300 38 900 77 100 154 200
2999 Component total 28 900 9 300 38 900 77 100 28 900 9 300 38 900 77 100 154 200
30 Training component
3300 Meetings: participant travel and DSA
3303 Bureau of BC 38 100 38 100 38 100
3305 Joint Bureau of BC 12 800 12 800 12 800
3304 Implementation and Compliance Committee 42 680 42 680 42 680
3307 Intersessional meeting (technical guidelines BC) additional
30 000 ¬ 30 000 30 000
3308 Technical Expert Group
3309 Annual meeting of the Basel Convention regional centres
3304 Bureau of SC 31 200 31 200 31 200
3313 Joint Bureau of SC 12 800 12 800 12 800
3302 POPs Review Committee 114 634 114 634 114 634 114 634 229 268
3309 Annual meeting of the Stockholm Convention regional centres

19
3310 Joint meeting of the Basel and Stockholm convention regional centres 44 150 44 150 88 300 88 300
3305 DDT Expert Group 60 000 60 000 60 000
3311 GMP Global Coordination Group 40 000 40 000 40 000
3312 Effectiveness Evaluation Committee (2 meetings) 70 000 70 000 70 000
3314 Implementation and Compliance Committee
3301 Bureau of RC 17 400 17 400 17 400
3313 Joint Bureau of RC 12 800 12 800 12 800
3302 Chemicals Review Committee 115 138 115 138 115 138 115 138 230 276
3314 Implementation and Compliance Committee
3387 Donor round table meetings 4 000 4 000 4 000 12 000 4 000 4 000 4 000 12 000 24 000
3399 Total 171 730 149 338 316 784 637 852 4 000 119 138 178 634 301 772 939 624
3999 Component total 171 730 149 338 316 784 637 852 4 000 119 138 178 634 301 772 939 624
40 Equipment and premises component
4100 Expendable equipment
4101 Office supplies (Geneva) 7 000 4 250 7 000 18 250 7 000 4 250 7 000 18 250 36 500
4102 Office supplies (Rome) 4 250 4 250 4 250 4 250 8 500
4103 Software (Webinars) 15 000 15 000 15 000 45 000 15 000 15 000 15 000 45 000 90 000
4104 Software/hardware (information management of the Secretariat) 2 800 1 900 2 800 7 500 2 800 1 900 2 800 7 500 15 000
4199 Total 24 800 25 400 24 800 75 000 24 800 25 400 24 800 75 000 150 000
4200 Non-expendable equipment
4201 Non-expendable equipment (Geneva) 5 000 2 500 5 000 12 500 5 000 2 500 5 000 12 500 25 000
4202 Non-expendable equipment (Rome) 2 500 2 500 2 500 2 500 5 000
4203 IT equipment (Geneva) 42 200 8 100 62 200 112 500 42 200 8 100 62 200 112 500 225 000
4204 IT equipment (Rome) 17 500 17 500 17 500 17 500 35 000
4299 Total 47 200 30 600 67 200 145 000 47 200 30 600 67 200 145 000 290 000
4300 Premises
4301 Office space, maintenance, utilities (Geneva) 75 000 35 000 145 000 255 000 75 000 35 000 145 000 255 000 510 000
4399 Total 75 000 35 000 145 000 255 000 75 000 35 000 145 000 255 000 510 000
4999 Component total 147 000 91 000 237 000 475 000 147 000 91 000 237 000 475 000 950 000
50 Miscellaneous component
5100 Operation and maintenance of equipment

20
5101 Maintenance of office equipment (Geneva) 5 000 2 500 5 000 12 500 5 000 2 500 5 000 12 500 25 000
5102 Maintenance of office equipment (Rome) 2 500 2 500 2 500 2 500 5 000
5199 Total 5 000 5 000 5 000 15 000 5 000 5 000 5 000 15 000 30 000
5200 Reporting costs
5201 Publications (core publications) 26 700 26 600 26 700 80 000 6 700 6 600 6 700 20 000 100 000
5202 Printing and translation (information management of the Secretariat) 13 900 3 200 19 900 37 000 13 900 3 200 19 900 37 000 74 000
5203 Information/public awareness materials (regional centres)
5204 Printing and translation (technical guidelines BC) 101 000 101 000 101 000
Printing and translation (technical guidelines BC) additional 68 875 68 875 68 875
5205 Printing/translation (joint communication) 1 000 1 000 1 000 3 000 1 000 1 000 1 000 3 000 6 000
5212 PIC circular 30 000 30 000 30 000 30 000 60 000
5283 Printing/translation (Synergies review) 5 000 3 500 5 000 13 500 13 500
5287 Printing/translation (outreach material for funding partners) 1 000 1 000 1 000 3 000 1 000 1 000 1 000 3 000 6 000
5299 Total 217 475 65 300 53 600 336 375 22 600 41 800 28 600 93 000 429 375
5300 Sundry
5301 Communications (Geneva) 61 000 15 600 81 000 157 600 61 000 15 600 81 000 157 600 315 200
5302 Communications (Rome) 5 000 5 000 5 000 5 000 10 000
5303 Communications (internet line) 10 300 6 900 10 300 27 500 10 300 6 900 10 300 27 500 55 000
5399 Total 71 300 27 500 91 300 190 100 71 300 27 500 91 300 190 100 380 200
5400 Hospitality
5401 Hospitality 5 000 5 000 5 000 15 000 5 000 5 000 5 000 15 000 30 000
5499 Total 5 000 5 000 5 000 15 000 5 000 5 000 5 000 15 000 30 000
5999 Component total 298 775 102 800 154 900 556 475 103 900 79 300 129 900 313 100 869 575
Direct project cost operational budget 4 248 543 3 690 105 5 037 081 12 975 730 4 074 328 3 519 432 5 158 248 12 752 008 25 727 737
UNEP programme support costs 13% 552 311 479 714 654 821 1 686 845 529 663 457 526 670 572 1 657 761 3 344 606
Total operational budget 4 800 854 4 169 819 5 691 902 14 662 575 4 603 990 3 976 959 5 828 820 14 409 769 29 072 343
21
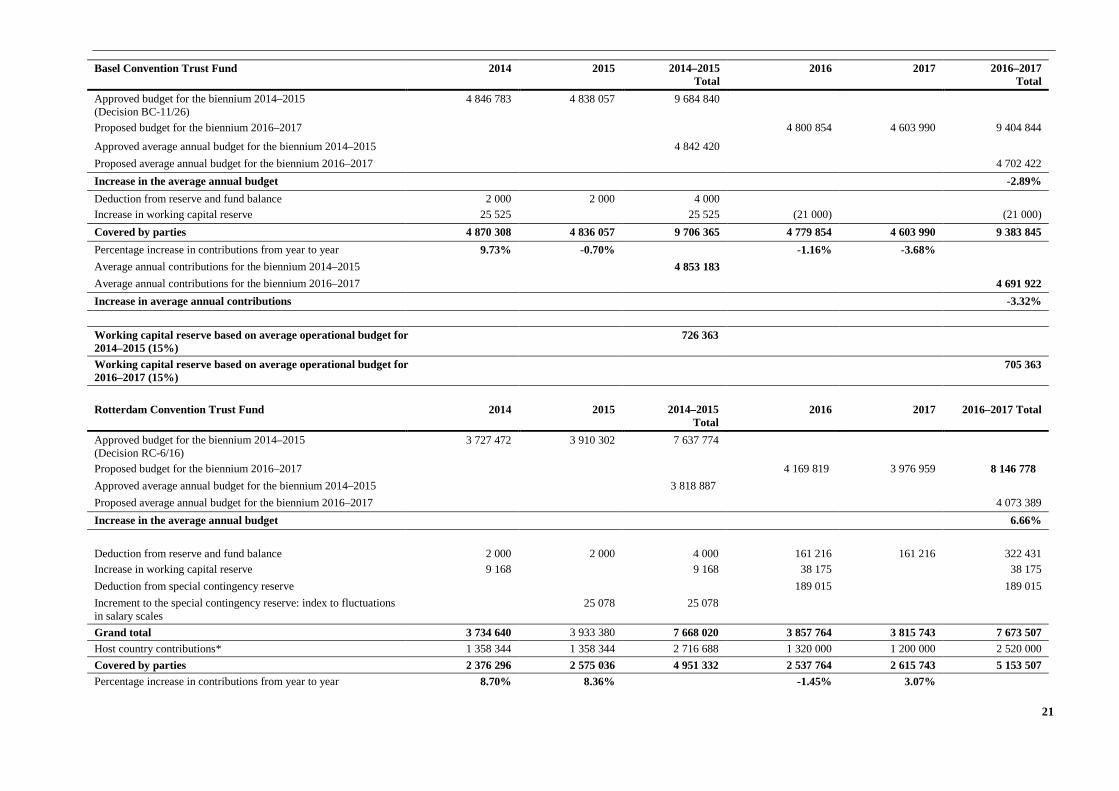
Basel Convention Trust Fund 2014 2015 2014–2015 Total
2016 2017 2016–2017 Total
Approved budget for the biennium 2014–2015 (Decision BC-11/26)
4 846 783 4 838 057 9 684 840
Proposed budget for the biennium 2016–2017 4 800 854 4 603 990 9 404 844
Approved average annual budget for the biennium 2014–2015 4 842 420 Proposed average annual budget for the biennium 2016–2017 4 702 422 Increase in the average annual budget -2.89% Deduction from reserve and fund balance 2 000 2 000 4 000 Increase in working capital reserve 25 525 25 525 (21 000) (21 000) Covered by parties 4 870 308 4 836 057 9 706 365 4 779 854 4 603 990 9 383 845 Percentage increase in contributions from year to year 9.73% -0.70% -1.16% -3.68% Average annual contributions for the biennium 2014–2015 4 853 183 Average annual contributions for the biennium 2016–2017 4 691 922 Increase in average annual contributions -3.32% Working capital reserve based on average operational budget for 2014–2015 (15%)
726 363
Working capital reserve based on average operational budget for 2016–2017 (15%)
705 363
Rotterdam Convention Trust Fund 2014 2015 2014–2015
Total 2016 2017 2016–2017 Total
Approved budget for the biennium 2014–2015 (Decision RC-6/16)
3 727 472 3 910 302 7 637 774
Proposed budget for the biennium 2016–2017 4 169 819 3 976 959 8 146 778 Approved average annual budget for the biennium 2014–2015 3 818 887 Proposed average annual budget for the biennium 2016–2017 4 073 389 Increase in the average annual budget 6.66% Deduction from reserve and fund balance 2 000 2 000 4 000 161 216 161 216 322 431 Increase in working capital reserve 9 168 9 168 38 175 38 175 Deduction from special contingency reserve 189 015 189 015 Increment to the special contingency reserve: index to fluctuations in salary scales
25 078 25 078
Grand total 3 734 640 3 933 380 7 668 020 3 857 764 3 815 743 7 673 507 Host country contributions* 1 358 344 1 358 344 2 716 688 1 320 000 1 200 000 2 520 000 Covered by parties 2 376 296 2 575 036 4 951 332 2 537 764 2 615 743 5 153 507 Percentage increase in contributions from year to year 8.70% 8.36% -1.45% 3.07%

22
Average annual contributions for the biennium 2014–2015
2 475 666
Average annual contributions for the biennium 2016–2017
2 576 753
Increase in the average annual contributions 4.08% Working capital reserve based on the average operational budget for 2014–2015 (15%)
572 833
Working capital reserve based on the average operational budget for 2016–2017 (15%)
611 008
* EUR 1,200,000 per annum for the biennium 2016–2017 equal US$ 1,513,241 based on the United Nations exchange rate of 1 November 2014 – US$ 1.00 = EUR 0.793. Calculated by using the average United Nations exchange rate between January 2013 and November 2014 (23 months), it is US$ 1.00 = EUR 0.75 EUR - equal to US$1,600,000 (calculated at the same level for both years). Of the Swiss portion of the host country contribution, 35 per cent is re-allocated to RVL for 2016 and 50 per cent for 2017, equal to US$ US$280,000 in 2016 and US$400,000 in 2017.
Stockholm Convention Trust Fund 2014 2015 2014–2015 Total
2016 2017 2016–2017 Total
Approved budget for the biennium 2014–2015 (Decision SC-6/30) 5 732 172 6 048 917 11 781 089 Proposed budget for the biennium 2016–2017 5 691 902 5 828 820 11 520 721 Approved average annual budget for the biennium 2014–2015 5 890 545 Proposed average annual budget for the biennium 2016–2017 5 760 361 Increase in the average annual budget -2.21% Deduction from reserve and fund balance 2 000 2 000 4 000 Increase in working capital reserve (2 708) (2 708) 259 932 259 932 Grand total 5 727 464 6 046 917 11 774 381 5 951 833 5 828 820 11 780 653 Host country contributions* 1 004 489 995 615 2 000 104 1 025 155 1 020 775 2 045 930 Covered by parties 4 722 975 5 051 302 9 774 277 4 926 678 4 808 045 9 734 723 Percentage increase in contributions from year to year 7.22% 6.95% -2.47% -2.41% Average annual contributions for the biennium 2014–2015 4 887 139 Average annual contributions for the biennium 2016–2017 4 867 361 Increase in average annual contributions -0.40% Working capital reserve based on average operational budget for 2014–2015 (8.3%) 488 915 Working capital reserve based on average operational budget for 2016–2017 (13%) 748 847
* Swiss contributions of CHF 1,000,000 per annum for the biennium 2016–2017 equal US$1,046,025 based on the United Nations exchange rate of 1 November 2014 – US$ 1.00 = CHF 0.956. Calculated by using the average United Nations exchange rate between January 2013 and November 2014 (23 months) it is US$ 1.00 = CHF 0.916 - equal to US$1,091,703 (calculated at the same level for both years).
2014 2015 2016 2017 Host country contributions 1 004 489 995 615 1 025 155 1 020 775 Assessed contributions 65 030 73 904 66 548 70 928 Total 1 069 519 1 069 519 1 091 703 1 091 703

23
Table 3
Programme of work for 2016–2017 funded via the voluntary special and technical cooperation trust funds of the Basel (BD), Rotterdam (RV) and Stockholm (SV) conventions
Voluntary budget for 2016–2017 (in United States dollars)
Summary table of total costs per budget code level and by convention trust fund
2016 2017 2016–2017
BD RV SV Total BD RV SV Total Total
10 Project personnel component
1100 Professional staff
1101 Programme Officer P-3 179 200 179 200 186 368 186 368 365 568
1114 Programme Officer P-3 179 200 179 200 186 368 186 368 365 568
1115 Programme Officer P-3 179 200 179 200 186 368 186 368 365 568
1116 Programme Officer P-3 (new) 93 184 93 184 93 184
Subtotal BC staff 537 600 652 288 652 288 652 288
1124 Programme Officer P-4 (new) 216 700 216 700 225 368 225 368 442 068
1121 Programme Officer P-3 179 200 179 200 186 368 186 368 365 568
1126 Programme Officer P-3 179 200 179 200 186 368 186 368 365 568
Subtotal SC staff 575 100 575 100 598 104 598 104 1 173 204
1199 Total 537 600 575 100 1 112 700 652 288 598 104 1 250 392 2 363 092
1200 Consultants
1201 Consultants - development of tools and modules 41 000 42 000 42 000 125 000 10 000 10 000 10 000 30 000 155 000
1202 Consultants – capacity-building and training (BC) 30 000 30 000 20 000 20 000 50 000
1203 Consultants – capacity-building and training (RC) 67 000 67 000 38 000 38 000 105 000
1204 Consultants – capacity-building and training (SC) 60 000 60 000 30 000 30 000 90 000
1205
Consultants – capacity-building and training (BC RC SC) 8 000 10 000 8 000 26 000 5 000 5 000 4 000 14 000 40 000
1206 Consultants- partnerships 60 000 30 000 30 000 120 000 10 000 10 000 130 000
1207 Consultants- technical guidelines
1208 Consultants- technical guidelines (E-waste) 70 000 70 000 70 000 70 000 140 000
Consultants- technical guidelines (E-waste) - additional 60 000 60 000 50 000 50 000 110 000

24
2016 2017 2016–2017
BD RV SV Total BD RV SV Total Total
1209 Consultant (ESM household waste) 40 000 40 000 40 000
1210 Consultants - scientific support to RC 30 000 30 000 30 000
1211 Consultants- technical guidelines (E-waste) 10 000 10 000 10 000 10 000 20 000
Consultants- technical guidelines (E-waste) - additional 10 000 10 000 10 000
1210 Consultants - scientific support to SC 150 000 150 000 50 000 50 000 200 000
1212
Consultants - support for development and maintenance of national reporting tools (BC SC) 10 000 10 000 50 000 50 000 60 000
1213 Support for further work on ESM 50 000 50 000 50 000 50 000 100 000
1214 Consultants – CLI-related activities 27 000 27 000 27 000 27 000 54 000
1215
Consultants - Strategic framework (mid-term evaluation report) 20 000 20 000 20 000 20 000 40 000
1216 Consultant (online questionnaire) 20 000 20 000 20 000
1283 Consultant (scientific bodies) 4 000 4 000 4 000 12 000 12 000
1285 Consultants (webinars & online training) 40 000 40 000 50 000 130 000 20 000 20 000 20 000 60 000 190 000
1286 Consultants (technical assistance needs assessment) 10 000 10 000 10 000
1287 Consultants (Resource Kit & e-library) 20 000 20 000 20 000 60 000 15 000 15 000 15 000 45 000 105 000
1289 Consultants - regional centres 12 500 12 500 25 000 25 000
1284 Consultant (illegal traffic) 20 000 20 000 20 000
1282 Consultants (information management of the Secretariat) 14 400 11 200 14 400 40 000 14 400 11 200 14 400 40 000 80 000
1285 Consultants (clearing-house mechanism based on priorities) 28 000 20 500 28 000 76 500 28 000 20 500 28 000 76 500 153 000
1299 Total 554 900 284 700 458 900 1 298 500 389 400 119 700 181 400 690 500 1 989 000
13 Administrative support
1300 General Service staff
1323 GTA Conference Clerk 137 500 137 500 143 000 143 000 280 500
1306 GTA Public Information Clerk 137 500 137 500 143 000 143 000 280 500
Subtotal RO staff 275 000 286 000 286 000 286 000

25
2016 2017 2016–2017
BD RV SV Total BD RV SV Total Total
1322 GTA Programme Clerk 137 500 137 500 143 000 143 000 280 500
1323 Team Assistant (new) 137 500 137 500 143 000 143 000 280 500
Subtotal SC staff 275 000 275 000 286 000 286 000 561 000 General Service staff subtotal 275 000 275 000 550 000 286 000 286 000 572 000 1 122 000
1330 Conference servicing
1322
BC Open-ended Working Group (1 day extra interpretation) 25 960 25 960 25 960
1380 Conference servicing (regional centres) 7 000 7 000 7 000 7 000 14 000
Conference servicing subtotal 32 960 32 960 7 000 7 000 39 960
1399 Total 32 960 275 000 275 000 582 960 286 000 293 000 579 000 1 161 960
1600 Travel on official business
1601 Staff travel - orientation workshop for members of CRC 2 480 2 480 2 480
1602 Staff travel – capacity-building and training BC 56 000 56 000 34 000 34 000 90 000
1603 Staff travel – capacity-building and training RC 30 000 30 000 10 000 10 000 40 000
1604 Staff travel - capacity building and training SC 30 000 30 000 20 000 20 000 50 000
1680 Staff travel – capacity-building and training (BC, RC, SC) 13 000 12 000 13 000 38 000
12 000 15 000 15 000 42 000 80 000
1681 Staff travel -regional centres 15 000 15 000 30 000 5 000 5 000 10 000 40 000
1607 Staff travel - scientific support to BC 15 000 15 000 15 000 15 000 30 000
1608 Staff travel - scientific support to RO 2 500 2 500 2 500 2 500 5 000
1609 Staff travel - scientific support to SC 16 000 16 000 12 000 12 000 28 000
1610 Staff travel – SC GMP 4 000 4 000 4 000 4 000 8 000
1611 Staff travel - CLI and legal clarity 5 000 5 000 5 000 5 000 10 000
1683 Staff travel - regional preparatory meetings 10 977 10 977 10 977 32 931 32 931
1699 Total 104 000 46 980 78 000 228 980 81 977 38 477 66 977 187 431 416 411
1999 Component total 1 229 460 606 680 1 387 000 3 223 140 1 123 665 444 177 1 139 481 2 707 323 5 930 463
20 Subcontract component
2200 Subcontracts
2201 Development of tools and modules 40 000 40 000 40 000 120 000 80 000 80 000 80 000 240 000 360 000

26
2016 2017 2016–2017
BD RV SV Total BD RV SV Total Total
2202 Capacity-building and training (BC) 160 000 160 000 100 000 100 000 260 000
2203 Capacity-building and training (RC) 318 000 318 000 222 000 222 000 540 000
2204 Capacity-building and training (SC) 340 000 340 000 235 000 235 000 575 000
2280 Development of massive open online courses (MOOCs) 45 000 45 000 50 000 140 000 20 000 20 000 20 000 60 000 200 000
2282 Capacity-building and training (BC, RC, SC) 81 000 83 000 77 000 241 000 26 000 27 000 56 000 109 000 350 000
2284
Financial audit of technical assistance projects at national and regional levels 35 000 35 000 35 000 105 000 35 000 35 000 35 000 105 000 210 000
2283 Partnerships 20 000 140 000 20 000 180 000 7 000 127 000 6 000 140 000 320 000
2281 Pilot joint activities (regional centres) 200 000 200 000 400 000 200 000 200 000 400 000 800 000
2287 Resource Kit and e-library 20 000 20 000 20 000 60 000 15 000 15 000 15 000 45 000 105 000
2207 Global Monitoring Plan 220 000 220 000 200 000 200 000 420 000
2208 Work programme of ICC 60 000 60 000 60 000 60 000 120 000
2209 Implementation Fund 75 000 75 000 75 000 75 000 150 000
2212 Support for further work on ESM 50 000 50 000 50 000 50 000 100 000
2199 Total 786 000 681 000 1 002 000 2 469 000 668 000 526 000 847 000 2 041 000 4 510 000
2999 Component total 786 000 681 000 1 002 000 2 469 000 668 000 526 000 847 000 2 041 000 4 510 000
30 Training component
3200 Training
3201 Training and capacity-building BC 563 000 563 000 421 000 421 000 984 000
3303 Training and workshops (RC) 741 600 741 600 494 400 494 400 1 236 000
3203 Training and workshops (SC) 736 800 736 800 319 200 319 200 1 056 000
3283 Training and workshops (BC, RC, SC) 365 000 368 000 365 000 1 098 000 245 000 259 000 248 000 752 000 1 850 000
3282 Training modules 40 000 40 000 40 000
3280 Video training
3299 Total 998 000 1 129 600 1 121 800 3 249 400 736 000 813 400 587 200 2 136 600 5 386 000
3300 Meetings: participant travel and DSA
3301 Conference of the Parties to BC 814 000 814 000 814 000
3302 BC Open-ended Working Group 643 552 643 552 643 552
3303 Implementation and Compliance Committee 30 280 30 280 30 280

27
2016 2017 2016–2017
BD RV SV Total BD RV SV Total Total
3305 Technical expert group (ESM) 50 000 50 000 50 000 50 000 100 000
3306 Meetings of SIWG 35 000 35 000 25 000 25 000 60 000
3307
Intersessional meeting (technical guidelines, BC) additional 30 000 30 000 30 000
3308 Meeting (ESM household waste) 70 000 70 000 70 000 70 000 140 000
3309 Annual meeting of Basel Convention regional centres 67 000 67 000 67 000
3301 Conference of the Parties to SC 814 000 814 000 814 000
3302 POPs Review Committee 20 632 20 632 85 102 85 102 105 734
3305 Expert group meetings (SC) 40 000 40 000 40 000 40 000 80 000
3314 Implementation and Compliance Committee
3309 Annual meeting of Stockholm Convention regional centres 67 000 67 000 67 000
3311 Conference of the Parties to RC 814 000 814 000 814 000
3309
Orientation workshop for members of Chemical Review Committee 87 055 87 055 87 055
3310 Meetings: training and capacity-building RC 50 000 50 000 50 000 50 000 100 000
3313 Workshop on listings not adopted by COP 120 000 120 000 120 000
3314 Implementation and Compliance Committee
3386 Massive open online courses (MOOCs) 10 000 10 000 10 000 30 000 10 000 10 000 10 000 30 000 60 000
3382 Joint meetings of Basel and Stockholm regional centres
3384 Outreach and public awareness (joint media workshop) 17 500 15 000 17 500 50 000 50 000
3385 Conference servicing (regional prepartory meetings) 153 186 153 186 153 186 459 558 459 558
3399 Total 935 832 267 055 70 632 1 273 519 1 139 686 1 042 186 1 186 788 3 368 660 4 642 179
3999 Component total 1 933 832 1 396 655 1 192 432 4 522 919 1 875 686 1 855 586 1 773 988 5 505 260 10 028 179 40 EQUIPMENT AND PREMISES COMPONENT
4100 Expendable equipment
4101 Software (development of training tools and modules) 20 000 20 000 40 000 40 000
4199 Total 20 000 20 000 40 000 40 000 4999 Component total

28
2016 2017 2016–2017
BD RV SV Total BD RV SV Total Total
50 Miscellaneous component 5200 Reporting costs 5201 Information/public awareness materials
(capacity-building BC) 5201 Information/public awareness materials
(capacity-building RC) 61 000 61 000 25 000 25 000 86 000 5201 Information/public awareness materials
(capacity-building SC) 22 000 22 000 14 000 14 000 36 000 5202 Information/public awareness materials
(partnerships) 24 000 24 000 12 000 12 000 36 000 5203 Translation of notifications 35 000 35 000 35 000 5210 Printing/translation (training tools and
modules) 35 000 35 000 35 000 35 000 70 000 5212 Information/public awareness materials
(regional centres) 63 000 43 000 53 000 159 000 42 000 2 000 62 000 106 000 265 000 5213 Information/public awareness materials
(capacity building BC, RC, SC) 10 000 10 000 20 000 20 000 5215 Information/public awareness materials
(Newsletter) 30 000 32 000 32 000 94 000 18 000 13 000 10 000 41 000 135 000 5221 Printing/translation (technical assistance needs
assessment) 5 000 5 000 5 000 5 000 10 000 5222 Resource Kit and e-library 4 000 4 500 4 000 12 500 4 000 4 500 4 000 12 500 25 000 5299 Total 4 000 4 500 4 000 12 500 9 000 4 500 9 000 22 500 35 000 5999 Component total 207 000 111 000 127 000 445 000 168 000 43 000 97 000 308 000 753 000 Direct project cost operational budget
4 176 292 2 795 335 3 728 432 10 700 059 3 835 351 2 868 763 3 857 469 10 561 583 21 261 642 UNEP programme support costs 13% 542 918 363 394 484 696 1 391 008 498 596 372 939 501 471 1 373 006 2 764 013 Total operational budget 4 719 210 3 158 729 4 213 128 12 091 067 4 333 947 3 241 702 4 358 940 11 934 589 24 025 655

29
Basel Convention Technical Cooperation Trust Fund (BD) 2014 2015 2014–2015 total
2016 2017 2016–2017 total
Programme requirements approved for the biennium 2014–2015 (Decision BC-11/26) 3 620 847 3 640 605 7 261 452 Programme requirements for 2016–2017 4 719 210 4 333 947 9 053 157 Approved average annual budget for 2014–2015 3 630 726 Proposed average annual budget for 2016–2017 4 526 578 Decrease in the average annual budget 24.67% Voluntary Special Trust Fund for the Rotterdam Convention (RV) 2014 2015 2014–2015 total 2016 2017 2016–2017 total Programme requirements approved for the biennium 2014–2015 (Decision RC-6/16) 3 195 442 4 041 011 7 236 453 Programme requirements for the biennium 2016–2017 3 158 729 3 241 702 6 400 431 Approved average annual budget for the biennium 2014–2015 3 618 227 Proposed average annual budget for the biennium 2016–2017 3 200 215 Increase in the average annual budget -11.55% Special Trust Fund for the Stockholm Convention (SV) 2014 2015 2014-2015 total 2016 2017 2016-2017 total Programme requirements approved for the biennium 2014–2015 (Decision SC-6/30) 3 765 550 4 186 982 7 952 532 Programme requirements for the biennium 2016–2017 4 213 128 4 358 940 8 572 068 Approved average annual budget for the biennium 2014–2015 3 976 266 Proposed average annual budget for the biennium 2016–2017 4 286 034 Increase in the average annual budget 7.79%

30
Table 4 Indicative scale of assessments for the General Trust Fund of the Basel Convention (BC) for the operational budget for the biennium 2016–2017 (in United States dollars)
Portion of operational budget to be covered by assessed contributions: 2016 4 777 85479
2017 4 601 99080
Party United Nations scale
of assessments
2013***
Adjusted scale of contributions with 22% ceiling
and no least developed
country paying more than
0.01%
Assessed contributions to be covered by the Parties
2016
Assessed contributions to be covered by
the Parties 2017
No. Percentage Percentage US dollars US dollars
1 Afghanistan * 0.005 0.0063 299 288
2 Albania 0.010 0.0125 597 575
3 Algeria 0.137 0.1713 8 185 7 884
4 Andorra 0.008 0.0100 478 460
5 Antigua and Barbuda 0.002 0.0025 119 115
6 Argentina 0.432 0.5402 25 811 24 861
7 Armenia 0.007 0.0088 418 403
8 Australia 2.074 2.5935 123 915 119 354
9 Austria 0.798 0.9979 47 678 45 923
10 Azerbaijan 0.040 0.0500 2 390 2 302
11 Bahamas 0.017 0.0213 1 016 978
12 Bahrain 0.039 0.0488 2 330 2 244
13 Bangladesh 0.010 0.0125 597 575
14 Barbados 0.008 0.0100 478 460
15 Belarus 0.056 0.0700 3 346 3 223
16 Belgium 0.998 1.2480 59 627 57 433
17 Belize 0.001 0.0013 60 58
18 Benin 0.003 0.0038 179 173
19 Bhutan 0.001 0.0013 60 58
20 Bolivia (Plurinational State of) 0.009 0.0113 538 518
21 Bosnia and Herzegovina 0.017 0.0213 1 016 978
22 Botswana 0.017 0.0213 1 016 978
23 Brazil 2.934 3.6690 175 297 168 845
24 Brunei Darussalam 0.026 0.0325 1 553 1 496
25 Bulgaria 0.047 0.0588 2 808 2 705
26 Burkina Faso 0.003 0.0038 179 173
27 Burundi 0.001 0.0013 60 58
28 Cabo Verde 0.001 0.0013 60 58
29 Cambodia 0.004 0.0050 239 230
30 Cameroon 0.012 0.0150 717 691
79 The 2016 and 2017 costs apportioned among parties have been reduced by US$2,000 annually to correct an error in the calculation of parties’ contributions for the 2014–2015 biennium arising from the fact that costs that should have been funded from the Fund Balance were inadvertently apportioned among parties. 80 Ibid.

31
Party United Nations scale
of assessments
2013***
Adjusted scale of contributions with 22% ceiling
and no least developed
country paying more than
0.01%
Assessed contributions to be covered by the Parties
2016
Assessed contributions to be covered by
the Parties 2017
31 Canada 2.984 3.7315 178 285 171 722
32 Central African Republic 0.001 0.0013 60 58
33 Chad 0.002 0.0025 119 115
34 Chile 0.334 0.4177 19 955 19 221
35 China 5.148 6.4376 307 577 296 256
36 Colombia 0.259 0.3239 15 474 14 905
37 Comoros 0.001 0.0013 60 58
38 Congo 0.005 0.0063 299 288
39 Cook Islands 0.001 0.0013 60 58
40 Costa Rica 0.038 0.0475 2 270 2 187
41 Côte d’Ivoire 0.011 0.0138 657 633
42 Croatia 0.126 0.1576 7 528 7 251
43 Cuba 0.069 0.0863 4 123 3 971
44 Cyprus 0.047 0.0588 2 808 2 705
45 Czech Republic 0.386 0.4827 23 062 22 213
46 Democratic People’s Republic of Korea 0.006 0.0075 358 345
47 Democratic Republic of the Congo 0.003 0.0038 179 173
48 Denmark 0.675 0.8441 40 329 38 845
49 Djibouti 0.001 0.0013 60 58
50 Dominica 0.001 0.0013 60 58
51 Dominican Republic 0.045 0.0563 2 689 2 590
52 Ecuador 0.044 0.0550 2 629 2 532
53 Egypt 0.134 0.1676 8 006 7 711
54 El Salvador 0.016 0.0200 956 921
55 Equatorial Guinea 0.010 0.0125 597 575
56 Eritrea 0.001 0.0013 60 58
57 Estonia 0.040 0.0500 2 390 2 302
58 Ethiopia 0.010 0.0125 597 575
59 European Community 2.500 2.5000 119 446 115 050
60 Finland 0.519 0.6490 31 009 29 867
61 France 5.593 6.9940 334 165 321 865
62 Gabon 0.020 0.0250 1 195 1 151
63 Gambia 0.001 0.0013 60 58
64 Georgia 0.007 0.0088 418 403
65 Germany 7.141 8.9298 426 653 410 948
66 Ghana 0.014 0.0175 836 806
67 Greece 0.638 0.7978 38 119 36 715
68 Guatemala 0.027 0.0338 1 613 1 554
69 Guinea 0.001 0.0013 60 58
70 Guinea-Bissau 0.001 0.0013 60 58
71 Guyana 0.001 0.0013 60 58
72 Honduras 0.008 0.0100 478 460

32
Party United Nations scale
of assessments
2013***
Adjusted scale of contributions with 22% ceiling
and no least developed
country paying more than
0.01%
Assessed contributions to be covered by the Parties
2016
Assessed contributions to be covered by
the Parties 2017
73 Hungary 0.266 0.3326 15 893 15 308
74 Iceland 0.027 0.0338 1 613 1 554
75 India 0.666 0.8328 39 791 38 327
76 Indonesia 0.346 0.4327 20 672 19 912
77 Iran (Islamic Republic of) 0.356 0.4452 21 270 20 487
78 Iraq 0.068 0.0850 4 063 3 913
79 Ireland 0.418 0.5227 24 974 24 055
80 Israel 0.396 0.4952 23 660 22 789
81 Italy 4.448 5.5622 265 754 255 972
82 Jamaica 0.011 0.0138 657 633
83 Japan 10.833 13.5466 647 238 623 415
84 Jordan 0.022 0.0275 1 314 1 266
85 Kazakhstan 0.121 0.1513 7 229 6 963
86 Kenya 0.013 0.0163 777 748
87 Kiribati 0.001 0.0013 60 58
88 Kuwait 0.273 0.3414 16 311 15 711
89 Kyrgyzstan 0.002 0.0025 119 115
90 Lao People's Democratic Republic 0.002 0.0025 119 115
91 Latvia 0.047 0.0588 2 808 2 705
92 Lebanon 0.042 0.0525 2 509 2 417
93 Lesotho 0.001 0.0013 60 58
94 Liberia 0.001 0.0013 60 58
95 Libya 0.142 0.1776 8 484 8 172
96 Liechtenstein 0.009 0.0113 538 518
97 Lithuania 0.073 0.0913 4 362 4 201
98 Luxembourg 0.081 0.1013 4 840 4 661
99 Madagascar 0.003 0.0038 179 173
100 Malawi 0.002 0.0025 119 115
101 Malaysia 0.281 0.3514 16 789 16 171
102 Maldives 0.001 0.0013 60 58
103 Mali 0.004 0.0050 239 230
104 Malta 0.016 0.0200 956 921
105 Marshall Islands 0.001 0.0013 60 58
106 Mauritania 0.002 0.0025 119 115
107 Mauritius 0.013 0.0163 777 748
108 Mexico 1.842 2.3034 110 054 106 003
109 Micronesia (Federated States of ) 0.001 0.0013 60 58
110 Monaco 0.012 0.0150 717 691
111 Mongolia 0.003 0.0038 179 173
112 Montenegro 0.005 0.0063 299 288
113 Morocco 0.062 0.0775 3 704 3 568
114 Mozambique 0.003 0.0038 179 173

33
Party United Nations scale
of assessments
2013***
Adjusted scale of contributions with 22% ceiling
and no least developed
country paying more than
0.01%
Assessed contributions to be covered by the Parties
2016
Assessed contributions to be covered by
the Parties 2017
115 Myanmar ** 0.010 0.0125 597 575
116 Namibia 0.010 0.0125 597 575
117 Nauru 0.001 0.0013 60 58
118 Nepal 0.006 0.0075 358 345
119 Netherlands 1.654 2.0683 98 821 95 184
120 New Zealand 0.253 0.3164 15 116 14 560
121 Nicaragua 0.003 0.0038 179 173
122 Niger 0.002 0.0025 119 115
123 Nigeria 0.090 0.1125 5 377 5 179
124 Norway 0.851 1.0642 50 845 48 973
125 Oman 0.102 0.1276 6 094 5 870
126 Pakistan 0.085 0.1063 5 078 4 892
127 Palau 0.001 0.0013 60 58
128 Panama 0.026 0.0325 1 553 1 496
129 Papua New Guinea 0.004 0.0050 239 230
130 Paraguay 0.010 0.0125 597 575
131 Peru 0.117 0.1463 6 990 6 733
132 Philippines 0.154 0.1926 9 201 8 862
133 Poland 0.921 1.1517 55 027 53 001
134 Portugal 0.474 0.5927 28 320 27 278
135 Qatar 0.209 0.2614 12 487 12 027
136 Republic of Korea 1.994 2.4935 119 135 114 750
137 Republic of Moldova 0.003 0.0038 179 173
138 Romania 0.226 0.2826 13 503 13 006
139 Russian Federation 2.438 3.0487 145 663 140 301
140 Rwanda 0.002 0.0025 119 115
141 Saint Kitts and Nevis 0.001 0.0013 60 58
142 Saint Lucia 0.001 0.0013 60 58
143 Saint Vincent and the Grenadines 0.001 0.0013 60 58
144 Samoa 0.001 0.0013 60 58
145 Sao Tome and Principe * 0.001 0.0013 60 58
146 Saudi Arabia 0.864 1.0804 51 621 49 721
147 Senegal 0.006 0.0075 358 345
148 Serbia 0.040 0.0500 2 390 2 302
149 Seychelles 0.001 0.0013 60 58
150 Singapore 0.384 0.4802 22 943 22 098
151 Slovakia 0.171 0.2138 10 217 9 841
152 Slovenia 0.100 0.1250 5 975 5 755
153 Somalia 0.001 0.0013 60 58
154 South Africa 0.372 0.4652 22 226 21 408
155 Spain 2.973 3.7177 177 628 171 089
156 Sri Lanka 0.025 0.0313 1 494 1 439

34
Party United Nations scale
of assessments
2013***
Adjusted scale of contributions with 22% ceiling
and no least developed
country paying more than
0.01%
Assessed contributions to be covered by the Parties
2016
Assessed contributions to be covered by
the Parties 2017
157 State of Palestine ** 0.001 0.0013 60 58
158 Sudan 0.010 0.0125 597 575
159 Suriname 0.004 0.0050 239 230
160 Swaziland 0.003 0.0038 179 173
161 Sweden 0.960 1.2005 57 357 55 246
162 Switzerland 1.047 1.3093 62 555 60 252
163 Syrian Arab Republic 0.036 0.0450 2 151 2 072
164 Thailand 0.239 0.2989 14 280 13 754
165 The former Yugoslav Republic of Macedonia 0.008 0.0100 478 460
166 Togo 0.001 0.0013 60 58
167 Tonga 0.001 0.0013 60 58
168 Trinidad and Tobago 0.044 0.0550 2 629 2 532
169 Tunisia 0.036 0.0450 2 151 2 072
170 Turkey 1.328 1.6607 79 344 76 423
171 Turkmenistan 0.019 0.0238 1 135 1 093
172 Uganda 0.006 0.0075 358 345
173 Ukraine 0.099 0.1238 5 915 5 697
174 United Arab Emirates 0.595 0.7440 35 549 34 241
175 United Kingdom of Great Britain and Northern Ireland 5.179 6.4763 309 429 298 040
176 United Republic of Tanzania 0.009 0.0113 538 518
177 Uruguay 0.052 0.0650 3 107 2 992
178 Uzbekistan 0.015 0.0188 896 863
179 Venezuela (Bolivarian Republic of) 0.627 0.7841 37 461 36 082
180 Viet Nam 0.042 0.0525 2 509 2 417
181 Yemen 0.010 0.0125 597 575
182 Zambia 0.006 0.0075 358 345
183 Zimbabwe 0.002 0.0025 119 115
Total 80.4690 100 4 777 85481 4 601 990 82
* New parties that have ratified the Convention.
** New parties that have ratified the Convention after posting of the proposed programmes of work and budgets for 2016–2017. *** United Nations scale of assessments for the 2016–2017 period per resolution 67/238 adopted at the sixty-seventh session of the General Assembly for the years 2013, 2014 and 2015 on 24 December 2012.
81 Ibid. 82 Ibid.

35
Table 5 Indicative staffing table for the BRS Secretariat for the biennium 2016–2017 Funded from the general trust funds (used for costing purposes)
Staff category and level
Approved 2014–2015 Total proposed 2016–2017 Remarks
Core funded
FAO UNEP PSC
Total Core funded
FAO UNEP PSC
Total
A. Prof. category
D-2 1.00 0.25 1.25 1.00 0.25 1.25 D-1 1.00 1.00 1.00 1.00 P-5 7.00 1.00 8.00 7.50 7.50 (1) P-4 7.00 2.00 9.00 8.00 2.00 10.00 (2) P-3 14.00 1.00 15.00 17.50 1.00 18.50 P-2 4.00 4.00 2.00 2.00
Subtotal A 34.00 2.25 2.00 38.25 37.00 1.25 2.00 40.25
B. General Service category
GS 14.00 1.25 6.00 21.25 13.00 1.25 6.00 20.25 (3)
Subtotal B 14.00 1.25 6.00 21.25 13.00 1.25 6.00 20.25
Total (A+B) 48.00 3.50 8.00 59.50 50.00 2.50 8.00 60.50
Remarks (1) Including 0.5 P-5 retiring December 2016 (BC), one P-5 retiring July 2017 (BC) and one P-5 post for FAO coordinator. (2) Two administrative officers funded via programme support costs (PSC) (1 BC, 0.5 RC and 0.5 SC). (3) Six General Service positions funded from programme support costs (2 BC and 4 shared between RC and SC). Funded from the voluntary special and technical cooperation trust funds (used for costing
purposes)
Staff category and level Approved 2014–2015 Total proposed 2016–2017
A. Professional category
D-2
D-1
P-5
P-4 1.00 P-3 8.00 5.25 P-2 Subtotal A 8.00 6.25
B. General Service category
GS 3.00 4.00
Subtotal B 3.00 4.00
Total (A+B) 11.00 10.25
36
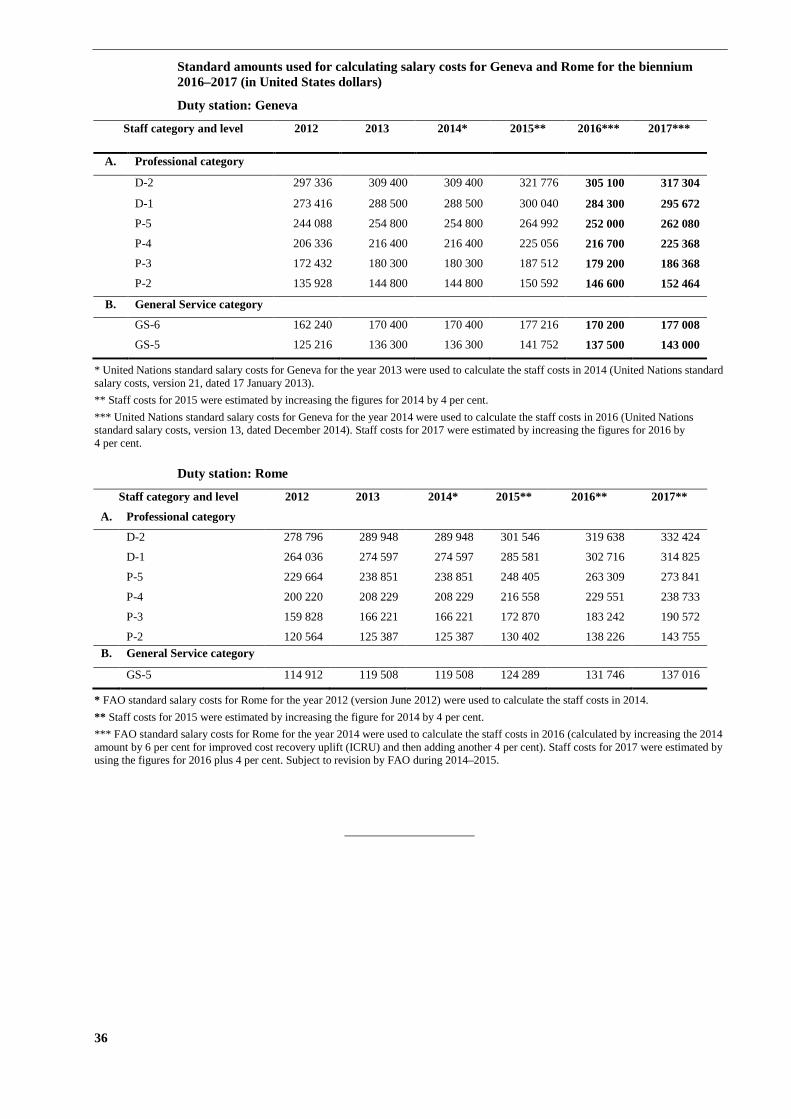
Standard amounts used for calculating salary costs for Geneva and Rome for the biennium 2016–2017 (in United States dollars)
Duty station: Geneva
Staff category and level 2012 2013 2014* 2015** 2016*** 2017***
A. Professional category
D-2 297 336 309 400 309 400 321 776 305 100 317 304
D-1 273 416 288 500 288 500 300 040 284 300 295 672 P-5 244 088 254 800 254 800 264 992 252 000 262 080 P-4 206 336 216 400 216 400 225 056 216 700 225 368 P-3 172 432 180 300 180 300 187 512 179 200 186 368 P-2 135 928 144 800 144 800 150 592 146 600 152 464
B. General Service category
GS-6 162 240 170 400 170 400 177 216 170 200 177 008 GS-5 125 216 136 300 136 300 141 752 137 500 143 000
* United Nations standard salary costs for Geneva for the year 2013 were used to calculate the staff costs in 2014 (United Nations standard salary costs, version 21, dated 17 January 2013). ** Staff costs for 2015 were estimated by increasing the figures for 2014 by 4 per cent. *** United Nations standard salary costs for Geneva for the year 2014 were used to calculate the staff costs in 2016 (United Nations standard salary costs, version 13, dated December 2014). Staff costs for 2017 were estimated by increasing the figures for 2016 by 4 per cent.
Duty station: Rome
Staff category and level 2012 2013 2014* 2015** 2016** 2017**
A. Professional category
D-2 278 796 289 948 289 948 301 546 319 638 332 424
D-1 264 036 274 597 274 597 285 581 302 716 314 825
P-5 229 664 238 851 238 851 248 405 263 309 273 841
P-4 200 220 208 229 208 229 216 558 229 551 238 733
P-3 159 828 166 221 166 221 172 870 183 242 190 572
P-2 120 564 125 387 125 387 130 402 138 226 143 755 B. General Service category
GS-5 114 912 119 508 119 508 124 289 131 746 137 016
* FAO standard salary costs for Rome for the year 2012 (version June 2012) were used to calculate the staff costs in 2014. ** Staff costs for 2015 were estimated by increasing the figure for 2014 by 4 per cent. *** FAO standard salary costs for Rome for the year 2014 were used to calculate the staff costs in 2016 (calculated by increasing the 2014 amount by 6 per cent for improved cost recovery uplift (ICRU) and then adding another 4 per cent). Staff costs for 2017 were estimated by using the figures for 2016 plus 4 per cent. Subject to revision by FAO during 2014–2015.


![Basel, March 2007 - BC) 2 · PDF fileBasel, March 2007 Dear USGEB / [BC]2 participant, ... Carl Zeiss AG, Feldbach ... Macherey-Nagel AG, Oensingen](https://img.dokumen.tips/doc/110x75/5abe73597f8b9a5d718cfe7b/basel-march-2007-bc-2-march-2007-dear-usgeb-bc2-participant-carl-zeiss.jpg)