Embed Size (px)
Citation preview

BBI CORPORATE PLAN 2020/21 TO
2024/25

Corporate Plan for FY2021/22 – 2024/25
P a g e | 1
OFFICIAL SIGN-OFF
It is hereby certified that in preparation of the document, the following was undertaken:
1. The Management Team of BBI under the guidance of the Board formulated the Strategy;
2. All relevant policies, legislation and other mandates for which the BBI is responsible were
considered; and
3. The strategy accurately reflects the strategic outcome-oriented goals and objectives which
BBI will endeavour to achieve over the financial period 2020/21–24/25.
COMPILED BY:
Ms Motlatso Okine
Manager: PIME Date
RECOMMENDED BY:
Mr Andrew Matseke Date
Chair of EXCO
APPROVED BY:
Mr Mandla Ngcobo Date
Chairperson of the Board

Corporate Plan for FY2021/22 – 2024/25
P a g e | 2
TABLE OF CONTENTS
Official Sign-Off ............................................................................................................................................... 1
Table of Contents ............................................................................................................................................ 2
Annexures ........................................................................................................................................................ 3
Table of Figures ............................................................................................................................................... 3
List of Tables .................................................................................................................................................... 4
Glossary of Terms ........................................................................................................................................... 5
Executive Summary ......................................................................................................................................... 8
1. Organisational Overview .................................................................................................................... 9
Introduction ........................................................................................................................................... 9
Regulatory Environment ....................................................................................................................... 9
Governance Framework ..................................................................................................................... 13
Description of Operations ................................................................................................................... 16
Products and Services ........................................................................................................................ 17
Customers ........................................................................................................................................... 19
2. Corporate Ethos ................................................................................................................................ 20
Vision .................................................................................................................................................. 20
Mission ................................................................................................................................................ 20
Values ................................................................................................................................................. 20
Critical Success Factors ..................................................................................................................... 20
3. Performance Review......................................................................................................................... 21
Five-Year Performance Review .......................................................................................................... 21
Intellectual Capital ............................................................................................................................... 21
Financial Capital ................................................................................................................................. 22
Manufactured Capital .......................................................................................................................... 22
Social and Relationship Capital .......................................................................................................... 27
Human Capital .................................................................................................................................... 27
Future Outlook .................................................................................................................................... 29
4. Environmental Analysis ................................................................................................................... 32
Regulatory Environment Amendments ............................................................................................... 32
Macro Environment Analysis .............................................................................................................. 33
Industry Analysis ................................................................................................................................. 36
SWOT Analysis ................................................................................................................................... 38
5. Corporate Strategy ........................................................................................................................... 40
Overview of Corporate Strategy ......................................................................................................... 40
Key Strategic Enablers ....................................................................................................................... 41
Focus Areas and Outcomes ............................................................................................................... 44
Strategy Map ....................................................................................................................................... 47
6. Key Performance Indicators (KPIS) ................................................................................................. 49
Five-Year Performance Plan .............................................................................................................. 49
Annual Performance Plan ................................................................................................................... 59
7. Strategic Priorities ............................................................................................................................ 64
Financial and Operational Sustainability............................................................................................. 64
Collaboration and Innovation with Other SOEs .................................................................................. 65
Stable Network .................................................................................................................................... 65
Regional Redundancy......................................................................................................................... 65
Customer Sales Support ..................................................................................................................... 65
Network Expansion and Fourth Industrial Revolution (4IR)......................................................... 65
Network Capacity Increase ................................................................................................................. 65
IP Transit ............................................................................................................................................. 65
Agile and Knowledgeable Workforce .................................................................................................. 65

Corporate Plan for FY2021/22 – 2024/25
P a g e | 3
8. Strategy Execution ........................................................................................................................... 67
Programmes and Sub-Programmes ................................................................................................... 67
9. Financial Plan .................................................................................................................................... 78
Income Statement ............................................................................................................................... 78
Balance Sheet ..................................................................................................................................... 78
Cash Flow Statement.......................................................................................................................... 79
Dividend Policy ................................................................................................................................... 80
Capital Expenditure and Investments ................................................................................................. 80
Valuation Analysis ............................................................................................................................... 81
Three-Year Borrowing Programme ..................................................................................................... 81
ANNEXURES
A – Financial Plan 2020 – 2025
B – Annual Performance Plan FY2020/21
C – Employment Equity Plan 2020 – 2023
D – Risk Management Plan
E – Fraud Prevention Plan
F – KPI Technical Descriptions for FY2020/21
G – Qualification and Experience of the Board and EXCO
H – CAPEX Plan
I – Significance and Materiality Framework
TABLE OF FIGURES
Figure 1 BBI’s Dual Mandate ........................................................................................................ 10
Figure 2 BBI Mandate relative to National Plans and Outcomes .......................................................
Figure 3: BBI's Governance Framework ........................................................................................ 14
Figure 4: Organisational Structure ................................................................................................ 15
Figure 5: Summary of Operations ................................................................................................. 16
Figure 6: BBI’s Number of Customers ........................................................................................... 19
Figure 7: BBI Values ..................................................................................................................... 20
Figure 8: Milestones over the Previous Five-Years ....................................................................... 21
Figure 9: Nominal Revenue, OPEX and Cost of Sales - Historical and Forecasted ....................... 22
Figure 10: BBI’s Fibre Footprint .................................................................................................... 23
Figure 11: Regional Centres ......................................................................................................... 24
Figure 12: Current Status of Fibre, PoPs and Completed SA Connect Sites ................................. 25
Figure 13: Year-on-year change in number of employees ............................................................. 28
Figure 14: PESTEL Analysis ......................................................................................................... 35
Figure 15: BBI’s Position within the Industry Value Chain ............................................................. 40
Figure 16: 2030 Strategic Horizon ................................................................................................. 41
Figure 17: Impacts, Focus Areas and Outcomes........................................................................... 45
Figure 18: Strategy Map ................................................................................................................ 47
Figure 19: Six Pillar Marketing Strategy ........................................................................................ 64

Corporate Plan for FY2021/22 – 2024/25
P a g e | 4
LIST OF TABLES
Table 1: Services and Products by Layers .................................................................................... 17
Table 2: Description of Services and Products .............................................................................. 17
Table 3: Fibre Network Owned, Leased and ROU ........................................................................ 19
Table 4: Total Number of Policies ................................................................................................. 22
Table 5: Network Operational Sites ............................................................................................... 23
Table 6: Employment Equity Demographics as at 30 September 2019 ......................................... 28
Table 7: Age Profile by Job Level .................................................................................................. 28
Table 8: Market Segments of Customers ...................................................................................... 36
Table 9: SA Connect Market Segments ........................................................................................ 37
Table 10: Gap Analysis ................................................................................................................. 37
Table 11: SWOT Analysis ............................................................................................................. 38
Table 12 Outcomes descriptions ................................................................................................... 46
Table 13: Five Year Performance Targets for Outputs .................................................................. 49
Table 14: Annual Performance Plan FY20/21 ............................................................................... 59
Table 15: Income Statement Assumptions .................................................................................... 78
Table 16: Balance Sheet Assumptions .......................................................................................... 78
Table 17: Profit and Liquidity Ratios .............................................................................................. 79
Table 18 Cash Flow Statement ..................................................................................................... 80
Table 19 CAPEX Classification ..................................................................................................... 80
Table 20 CAPEX Classification ..................................................................................................... 81
Table 21 Valuation of BBI Assets .................................................................................................. 81
Table 22 Funding .......................................................................................................................... 82
Corporate Plan for FY2021/22 – 2024/25
P a g e | 5
GLOSSARY OF TERMS
ABBREVIATION TERM
4IR Fourth Industrial Revolution
5G Fifth generation of cellular network technology
ADLash Lashed All-Dielectric Cable
ADSS All-Dielectric Self-Supporting
AI Artificial Intelligence
APP Annual Performance Plan
ARC Audit and Risk Committee
ASON Automatically Switched Optical Network
ANP Access Network Provider
AWS Amazon Web Services
BBI Broadband Infraco SOC Limited
BCX Business Connexion
Board Board of Directors of Broadband Infraco SOC Limited
BPM Business Process Management
BSC Balanced Score Card
BSS Business Support System
CAGR Compound Annual Growth Rate
CAPEX Capital Expenditure
CEO Chief Executive Officer
CFO Chief Financial Officer
CIPC Companies and Intellectual Property Commission
CMSO Chief Marketing and Sales Officer
COLA Cost of Living Annual Salary Adjustment
COS Cost of Sales
CRA Executive Compliance, Risk and Audit
CSI Corporate Social Investment
CTO Chief Technical Officer
DCDT Department of Communications and Digital Technologies
DDM District Delivery Model
DFA Dark Fibre Africa
DFF Digital Development Fund Act
DOE Department of Energy
DOH Department of Health
DPE Department of Public Enterprises
DPW Department of Public Works
DSL Digital Subscriber Line
DTPS Department of Telecommunications and Postal Services
DWDM Dense Wavelength Division Multiplexing
EBITDA Earnings Before Interest, Tax, Depreciation and Amortisation
ECA Electronic Communications Act No. 36 of 2005
ECNS Electronic Communications Network Service Licence
EXCO Executive Management Committee
EXCOPS Executive Procurement Sub-Committee

Corporate Plan for FY2021/22 – 2024/25
P a g e | 6
ABBREVIATION TERM
FCAPS Fault, Configuration, Accounting, Performance and Security
FSAPP Framework for Strategic and Annual Performance Plans
FTTH Fibre-to-the-Home
FY Financial Year
Gbps Gigabit Per Second
GDP Gross Domestic Product
HR Human Resources
HRRC Human Resource and Remuneration Committee
I-ECNS Individual Electronic Communications Network Services
ICASA Independent Communications Authority of South Africa
ICT Information and Communication Technology
IDC Industrial Development Corporation
IFTPC Investment, Finance, Tender and Procurement Committee
IoT Internet of Things
IP Internet Protocol
ISP Internet Service Provider
IT Information and Technology
ITC Information and Technology Committee
ITU International Telecommunication Union
IXPs Internet Exchange Points
KPIs Key Performance Indicators
M2M Machine-to-Machine
MB/s Megabytes Per Second
Mbps Megabit Per Second
MICT SETA Media, Information and Communication Technologies Sector Education
and Training Authority
MNO Mobile Network Operators
MoI Memorandum of Incorporation
MPLS Multiprotocol Label Switching
MTSF Medium Term Strategic Framework
NBN National Broadband Network
NDP National Development Plan
NLD National Long Distance
NOC Network Operations Centre
OPEX Operating Expenditure
OPGW Optical Ground Wire
OSI Open Systems Interconnection
OSS Operations Support System
OTT Over-the-Top
PC Portfolio Committee
PESTEL Political, Economic, Social, Technologic, Environment and Legal Factors
PFMA Public Finance Management Act
PIME Performance Information Monitoring and Evaluation
PoP Points of Presence
R&D Research and Development

Corporate Plan for FY2021/22 – 2024/25
P a g e | 7
ABBREVIATION TERM
ROU Right of Use
SADC Southern African Development Community
SCM Supply Chain Management
SDG Sustainable Development Goal
SDH Synchronous Digital Hierarchy
SEC Social and Ethics Committee
Shareholders Department of Telecommunications and Postal Services and Industrial
Development Corporation
SHEQ Safety, Health, Environmental and Quality
SIP Strategic Infrastructure Project
SITA State Information Technology Agency
SLA Service Level Agreements
SMMEs Small, Medium and Micro-Enterprises
SOC State Owned Company
SOE State Owned Enterprise
STM Synchronous Transport Module
SWOT Strengths, Weakness, Opportunities and Threats
Tbits/s Terabit Per Second
the Act Refers to the Broadband Infraco Act No. 33 of 2007
U/G Underground (cable)
USO Universal Service Obligations
WACS West Africa Cable System
WEF World Economic Forum (ranking)
WOAN Wholesale Open Access Network

Corporate Plan for FY2021/22 – 2024/25
P a g e | 8
EXECUTIVE SUMMARY
The FY2020/21 – FY2024/25 Corporate Plan reflects the five-year implementation plan of the ten-
year strategy. Broadband Infraco (BBI) is a Schedule 2 entity, in terms of the Public Finance
Management Act, No. 01 of 1999 (PFMA), mandated through the Broadband Infraco Act (No. 33 of
2007) (the Act), amongst other key pieces of legislation. The main objectives as set out in the Act
include:
• expanding the availability and affordability of access to electronic communications, including
but not limited to underdeveloped and underserviced areas, in accordance with the Electronic
Communications Act (No. 25 of 2002); and
• the provision of electronic communications network services and electronic communications
services commensurate with international best practice and pricing.
BBI provides long-distance national and international connectivity to licensed and license-exempt
customers, for projects of national importance and to previously underserviced areas. The existence
of BBI is intended to improve market efficiency in the long-distance connectivity segment by
increasing available long-distance network infrastructure. It will also avail capacity to stimulate
private sector innovation in the telecommunications services and content offerings. BBI is in a unique
position to deploy both a commercial and social mandate, thereby contributing to the
competitiveness and development of the South African economy. Essential to the sustainability is
the requirement for the commercial mandate to be competitive and viable; thereby enabling the
social mandate of the organisation.
Industry trends reveal that there has been large-scale investment in the telecommunications industry
within South Africa despite low economic growth. Furthermore, as the industry is rapidly evolving
and highly competitive – clear strategic decisions must be made regarding both positioning and
resource allocation. That is, choosing a strategic path that leverages internal competences, resource
availability and the most relevant opportunities is a necessity. In this regard, it must be noted that
private investment has been focused on key routes and metros with limited investment in
underdeveloped and underserviced areas – providing a distinct area of focus for BBI – which broadly
aligns with the mandate.
Driving towards fulfilling the mandate through alignment of commercial viability, service delivery, and
socio-economic upliftment is therefore central to BBI’s strategy and competitive positioning. A
collaborative process drove the development of BBI’s strategy, which has been re-imagined for
relevance in a highly competitive, resource intensive industry. An enabling legislation, the existing
competitive advantage of customer intimacy and Government as a key partner are the main drivers
of the strategy. Through this, BBI aims to provide communication services to enable a connected
and transformed society.
Corporate Plan for FY2021/22 – 2024/25
P a g e | 9
1. ORGANISATIONAL OVERVIEW
Introduction
The Board and Executive Management of Broadband Infraco hereby present the organisation’s five-
year Corporate Plan for FY2020/21 to FY2024/25 and the Annual Performance Plan (APP) for
2020/2021. The Corporate Plan and Annual Performance Plan are prepared and presented to the
shareholders, namely, the Minister of Communications and Digital Technologies (DCDT) - the
Executive Authority in terms of the Public Finance Management Act, No. 01 of 1999 (PFMA),as
amended, in her capacity as the Executive Authority and shareholder representative on behalf of the
Government of the Republic of South Africa, the Industrial Development Corporation (IDC) of South
Africa, as the secondary shareholder, and to Parliament.
The organisation utilises the Corporate Plan, Shareholders Compact and Annual Performance Plan,
Quarterly Reports, Integrated Annual Report, and Annual Financial Statements as its main
accountability instruments, including any other information that may be requested by the
shareholders from time to time.
The Corporate Plan is tabled annually in Parliament in compliance with the requirements of the
PFMA as amended, the Money Bills Amendment Procedures and Related Matters Act, No. 09 of
2009, the National Treasury Regulations issued in terms of the PFMA, and the Companies Act, No.
71 of 2008.
The primary aim of this Corporate Plan is to provide insight into BBI’s value proposition and strategy,
opportunities and risks, its business model and governance framework. It also serves to provide a
synopsis of past performance against its strategic objectives in a manner that affords stakeholders
a holistic view of the organisation and its potential to successfully deliver on its future commitments.
The Corporate Plan as presented, includes information on the rollout of SA Connect (Phase 1) and
forward-looking material to enable stakeholders to make an insightful assessment of the
organisation’s prospective value creation ability.
BBI was established in 2007 in terms of BBI Act No 33 of 2007 (the Act) as a State-Owned Entity
(SOE). The organisation was registered in 2008 with the then Companies Intellectual Property
Registration Office (CIPRO), now known as the Companies and Intellectual Property Commission
(CIPC) as an entity owned by the Government of the Republic of South Africa and the Industrial
Development Corporation (IDC) of South Africa. The Company launched commercially on 18
November 2010. As per the requirements of the Companies Act, No. 71 of 2008, BBI was converted
from a private company to a State-Owned Company (SOC) with the CIPC with effect from 2013. BBI
is a Schedule 2 public entity in terms of the PFMA.
Regulatory Environment
Legislative Mandate
BBI’s legislative mandate and objectives are set out in the Act. The main objectives are to expand
the availability and affordability of access to electronic communications, including but not limited to
underdeveloped and underserviced areas, in accordance with the Electronic Communications Act,
No. 36 of 2005 (the ECA), and commensurate with international best practice and pricing, through
the provision of electronic communications network services and electronic communications
services.
Corporate Plan for FY2021/22 – 2024/25
P a g e | 10
Below is an excerpt from the Act about the main objects of BBI:
(1) The main objects of Infraco are to expand the availability and affordability of access to
electronic communications, including but not limited to underdeveloped and underserviced areas,
in accordance with the Electronic Communications Act and commensurate with international best
practice and pricing, through the provision of—
(a) electronic communications network services; and
(b) electronic communications services.
(2) For the purposes of section 33(1) of the Companies Act, none of the objects ancillary to the
main objects of Infraco are excluded.
(3) The powers of Infraco include the common powers contained in Schedule 2 to the Companies
Act and none of those powers are excluded or qualified.
(4) Subject to subsection (1), with effect from the transfer date the Minister may, in consultation
with the Ministers of Finance and of Communications and subject to the Public Finance
Management Act, in one or more transactions transfer the whole or any part of the shares, assets,
rights, obligations or interests of the State in relation to Infraco to such transferees as the Minister
and the Ministers of Finance and of Communications deem in the public interest.
The Act draws on the ECA for alignment on purpose and objectives, as BBI supports the fulfilment
of the ECA.
In addition, the broader applicable legislative and regulatory framework includes, but is not limited
to:
• The Constitution of the Republic of South Africa, No. 08 of 1996;
• Companies Act, No. 71 of 2008;
• Public Finance Management Act, No. 01 of 1999 (as amended); and
• Protection of Personal Information Act, No. 04 of 2013.
Legislative/ Policy Amendments
The following legislative amendments are under consideration:
• Electronic Communications Amendment Bill
• SOC Rationalisation
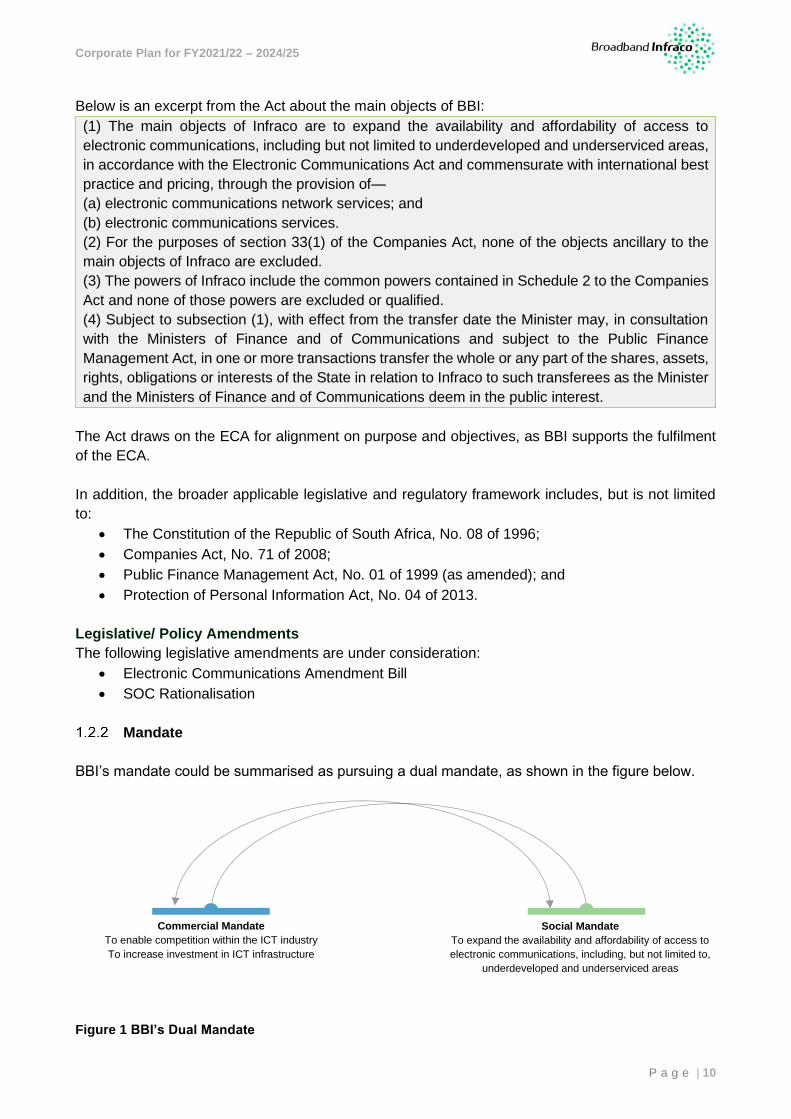
Mandate
BBI’s mandate could be summarised as pursuing a dual mandate, as shown in the figure below.
Figure 1 BBI’s Dual Mandate
Commercial Mandate
To enable competition within the ICT industry
To increase investment in ICT infrastructure
Social Mandate
To expand the availability and affordability of access to
electronic communications, including, but not limited to,
underdeveloped and underserviced areas

Corporate Plan for FY2021/22 – 2024/25
P a g e | 11
The organisation’s purpose is in line with the National Development Plan (NDP) of establishing
national, regional and municipal fibre-optic networks to provide the backbone for broadband access.
The NDP aims to “eliminate poverty and reduce inequality by 2030”. BBI operates on the premise
that the national backhaul, provincial backhaul, and districts backhaul require State intervention to
allow services into underserviced areas. The private sector intervention needs to be complemented
by public funds in the form of incentives, subsidies and grants to address the social objective of
bridging the digital divide and connecting all.
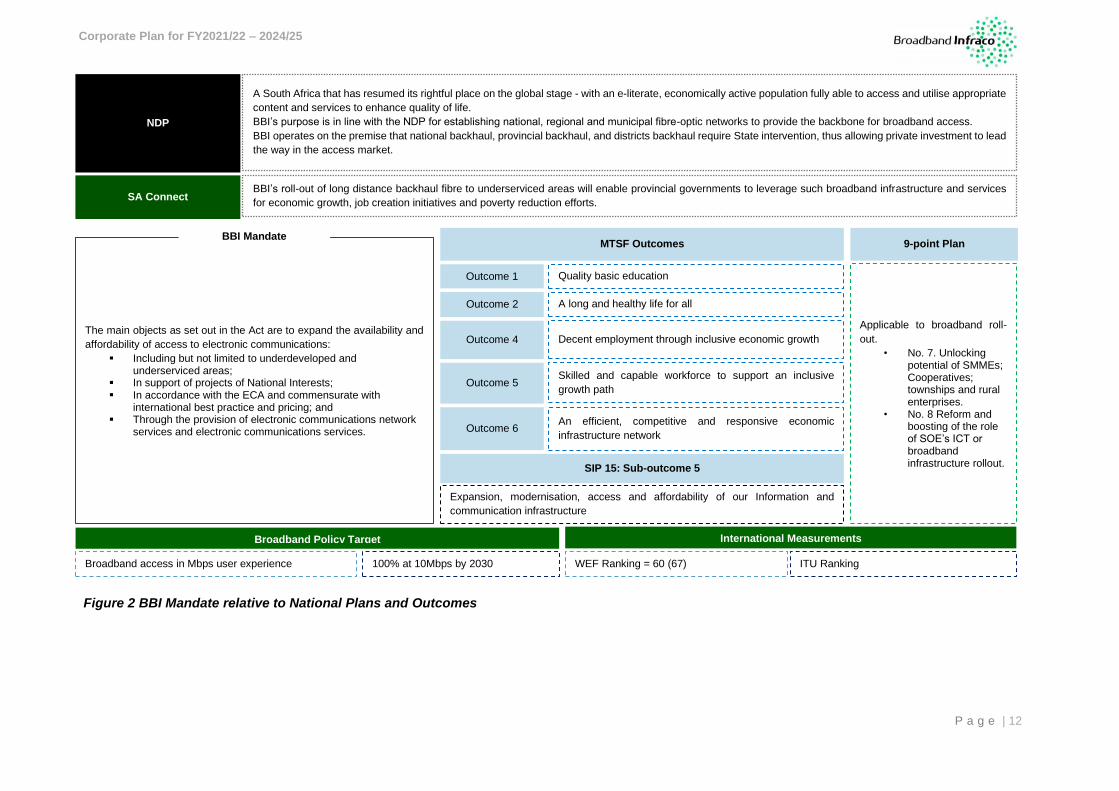
A summary of BBI’s mandate relative to national plans and outcomes is summarised in the figure
below.
Corporate Plan for FY2021/22 – 2024/25
P a g e | 12
The main objects as set out in the Act are to expand the availability and
affordability of access to electronic communications:
▪ Including but not limited to underdeveloped and underserviced areas;
▪ In support of projects of National Interests; ▪ In accordance with the ECA and commensurate with
international best practice and pricing; and ▪ Through the provision of electronic communications network
services and electronic communications services.
BBI Mandate
NDP
A South Africa that has resumed its rightful place on the global stage - with an e-literate, economically active population fully able to access and utilise appropriate
content and services to enhance quality of life.
BBI’s purpose is in line with the NDP for establishing national, regional and municipal fibre-optic networks to provide the backbone for broadband access.
BBI operates on the premise that national backhaul, provincial backhaul, and districts backhaul require State intervention, thus allowing private investment to lead
the way in the access market.
SA Connect BBI’s roll-out of long distance backhaul fibre to underserviced areas will enable provincial governments to leverage such broadband infrastructure and services
for economic growth, job creation initiatives and poverty reduction efforts.
MTSF Outcomes
Quality basic education
Expansion, modernisation, access and affordability of our Information and
communication infrastructure
Broadband Policy Target
Outcome 1
A long and healthy life for all Outcome 2
An efficient, competitive and responsive economic
infrastructure network Outcome 6
SIP 15: Sub-outcome 5
International Measurements
Broadband access in Mbps user experience 100% at 10Mbps by 2030 WEF Ranking = 60 (67) ITU Ranking
Decent employment through inclusive economic growth Outcome 4
Skilled and capable workforce to support an inclusive
growth path Outcome 5
9-point Plan
Applicable to broadband roll-
out.
• No. 7. Unlocking potential of SMMEs; Cooperatives; townships and rural enterprises.
• No. 8 Reform and boosting of the role of SOE’s ICT or broadband infrastructure rollout.
Figure 2 BBI Mandate relative to National Plans and Outcomes

Corporate Plan for FY2021/22 – 2024/25
P a g e | 13
Governance Framework
The figure below depicts the Governance Framework, which regulates the relationship with the
shareholders and guides the way BBI conducts its business. The framework indicates that there are
clear roles and responsibilities and policies in place. The Board has established a new committee to
focus on IT governance in line with King IV principles.
New operational committees accountable to the Executive Management Committee (EXCO) to
enhance compliance and strategic deliverables which are aligned with international best governance
practices are in place.
Composition of the Board of Directors
The Memorandum of Incorporation indicates that the Board shall consist of nine Directors, of whom
seven, including the Chairman, should be independent Non-Executive Directors, and two should be
Executive Directors. The Executive Directors are the Chief Executive Officer and Chief Financial
Officer. Non-Executive Directors are appointed to the Board by the Shareholders, approved by
Parliament, for a period of three years, renewable annually at the Annual General Meeting. Refer to
Appendix G for details of the qualifications and experience of Board members.
Board Committees
In line with the requirements of the Companies Act and the Memorandum of Incorporation (MoI), the
Board of Directors established the Audit and Risk Committee (ARC), the Human Resource and
Remuneration Committee (HRRC), the Investment, Finance, Tender and Procurement Committee
(IFTPC), the Social and Ethics Committee (SEC), and the Technology, Knowledge and Information
Committee (TKIC).
The figure below encapsulates our governance framework:

Corporate Plan for FY2021/22 – 2024/25
P a g e | 14
Figure 3: BBI's Governance Framework
SHAREHOLDERS: DPTS and IDC
This sets out the rights, duties and responsibilities of Shareholders, Directors and others within BBI, and by which BBI is incorporated.
This is not an Act but is central to ensuring that BBI is able to pursue its mission, not only today but also in the future. This requires strategic thinking, leadership, courage and care.
• Broadband Infraco Act • Companies Act • Public Finance Management Act • Electronic Communications Act • Any other relevant legislation
Responsibility and ethical leadership
Statement of Strategic Intent This is the statement of strategic directions provided by the shareholders
Corporate Plan This outlines our mandate, vision, mission, values, strategic goals and objectives
Relevant Policies and Procedures Set out key strategies and processes for BBI to implement
The Shareholder Compact This details the annual key performance indicators and targets
EXCO Sub-Committees • Senior Management Forum • IT Oversight Committee • EXCOPS • Capital Investment Steering Committee • Product Development Committee • Sales Pipeline Review Committee • Pricing Committee • SA Connect Committee • SOC Rationalisation
Statutory Committees • Skills Development Committee • Employment Equity Committee
BOARD OF DIRECTORS Company Secretary
CHIEF EXECUTIVE OFFICER
Executive Management Committee
Audit and Risk Committee
Social and Ethics Committee
Investment, Finance, Tender and Procurement Committee
Human Resource and Remuneration Committee
IFT
PC
H
RR
C
SE
C
AR
C
EX
CO
Relevant Legislation
Code of Good Governance
Memorandum of Incorporation
Technology, Knowledge and
Information Management Committee
TKIMC

Corporate Plan for FY2021/22 – 2024/25
P a g e | 15
Organisational Structure
The Chief Executive Officer (CEO) is the Accounting Officer of the organisation. There are six
Executive Managers, four of whom report directly to the CEO. This includes the Chief Financial
Officer (CFO), Chief Technical Officer (CTO), Chief Marketing and Sales Officer (CMSO) and the
Executive: Human Resources. Two of the Executive Managers, the Company Secretary and the
Executive Compliance, Risk and Audit (CRA) report administratively to the CEO and functionally to
the Board and the ARC, respectively. The organisation has seven divisions including the Office of
the Chief Executive.
The qualifications and experience of Executive Managers is detailed in Annexure G and the
organisational structure is depicted in the figure below:
Figure 4: Organisational Structure
Mr AD MatsekeChief Executive
Officer
Mrs ME MopeliExecutive: Human
Resources
Ms CI MokgohloaSnrManager: HR
Ops
Mr II Van NiekerkChief Financial
Officer
Mr P NkhereanyeSnr Manager:
Regulatory Affairs & Gov. Relation
Miss HL SmitSnr Manager: Management Accounting
VacantGM: Supply Chain
Mr T MatjeniSnr Manager:
Finance
Mr MM MojapeloExecutive:
Compliance Risk & Audit
Ms P DyaniExecutive:
Marketing & Sales Officer
Ms G PeteSnr Manager:
Business Development
Vacant
Snr Manager: Key Accounts
Mr K KingSnr Manager: Key
Accounts
Mr E PadiSnr Manager: Key
Accounts
Mrs C NwaokorieSnr Manager: Key
Accounts
Mr Sello KgakatsiSnr Manager: Key
Accounts
Mr G ZowaChief Technical
Officer
Mr KP MafaganaSnr Manager:
NOC
Mr P MalebanyeChief Engineer: Transmission
Mr H Van TonderSenior Managers
OPS and Maintenance
Mr Sivuyile PeterProgramme
Management Officer
Vacant
Snr Manager: Information Technology
VacantCompany Secretary
Active
Vacant
Positions

Corporate Plan for FY2021/22 – 2024/25
P a g e | 16
Description of Operations
The figure below outlines the functions of the BBI demonstrating the high-level value chain.
Figure 5: Summary of Operations
Marketing is the start of the value chain as BBI is market led. Business Development is instrumental
as it supports market insights with tangible prospects of opportunities, for example, potential new
markets, new products and investment opportunities. As this is a revenue generating function, it
allows for the commercial and social mandate to be delivered through revenues generated from
Sales, using relevant funding mechanisms. The second component, a core function that makes up
the largest portion of the organisation, is the Chief Technical Office. Out of this office is the
development, customisation and delivery of products and services. This core also ensures the
maintenance of, and upgrading of, infrastructure and networks.
Core functions are enabled by support functions, ensuring the provision of sufficient direction,
resources and management of funds. Lastly, the organisation is underpinned by adequate controls
from compliance and audit functions as well as the company secretary.
Operating Principles
BBI is shifting the operating model to a new model that maintains customer-centricity and drives
innovation through strategic partnerships. The following principles may be applied:
1. Becoming the backbone provider of choice for all of Government’s broadband connectivity
requirements while establishing collaborative partnerships with other ICT State-owned
companies;
2. Being a true neutral broadband carrier-of-carriers with a multi-level commercial approach to
the market;
3. Providing commercialised backhaul services to its direct customers;
4. Establishing a Next Generation Network that can provide a range of capacities from as small
as 10 Megabits Per Second (Mbps) to as large as 100 Gigabits Per Second (Gbps);
5. Targeting corporate and Government clients;
6. Providing service that is underpinned by high service levels;
7. Developing an autonomous, resilient and reliable network that would ensure that there are
no performance penalties incurred and no rebates paid out;
Strategy
Chief Technical Officer
NOC Transmission OPS and
Maintenance
Capital Project Management
Chief Marketing and Sales Officer
Business Development
SHEQ Finance
Compliance, Risk Management and Audit Company Secretary
Sales and Revenue
Generation
Function Value chain represented through the structure
Product and Service
development and rendering
Core Functions
Support Functions
Support Services
Governance
Product Management
Marketing
Commercial Operations
Account Management
Processes IT HR

Corporate Plan for FY2021/22 – 2024/25
P a g e | 17
8. Network footprint that ensures that the organisation is embedded within its customers’
footprint; and
9. Building capacity and capability to be a true provider of choice.
Products and Services
BBI provides long-distance national and international connectivity to licensed and license-exempt
customers; as well as connectivity for projects of national importance, while providing services to
previously underserviced and underdeveloped areas through broadband connectivity projects. The
organisation aims to improve the long-distance connectivity segment by increasing available long-
distance network infrastructure. Furthermore, it will avail capacity to stimulate private sector
innovation in telecommunications services and content offerings.
National, provincial, and district backhaul require State intervention allowing private investments to
facilitate market access. The private sector intervention must be complemented by public funds in
the form of incentives, subsidies and grants to address the social objective of bridging the digital
divide.
BBI’s portfolio of products and services is based on the provision of high capacity bandwidth from
Points of Presence (PoP) to PoP, delivered on BBI’s National Long-Distance network. BBI has
implemented next generation Dense Wavelength Division Multiplexing (DWDM) in its core network.
BBI adopted the Open Systems Interconnection (OSI) model to define products rather than use
definitions based on the technology. Most of BBI’s services are in the first three layers of the OSI
model, which is described in Table 1 and further details are provided in Table 2 below.
BBI’s products include the following:
• Bandwidth services
• Synchronous Digital Hierarchy (SDH), DWDM and Ethernet Services
• West African Cable System (WACS) Connectivity
• Customer Tie Cable Maintenance Service
• Colocation
• Mast Colocation
• Network Operations Centre (NOC) as a service
• Maintenance as a Service
Portfolio of Products and Services Description
The evolution of technology, with the high consumption of Internet Protocol (IP) based services, has
resulted in customers requesting high bandwidth service delivered through our National Long-
Distance network (NLD). Some of the services provided by BBI are in the first three layers of the OSI
model, as depicted in the table below.
Table 1: Services and Products by Layers
Layer Layer 1 Layer 2 Layer 3
Description of Layer Physical Layer Data Link Layer Network Layer
Products Embedded in Layer SDH and DWDM IP Connectivity and Transit
The detail description of BBI’s product are as follows:
Table 2: Description of Services and Products

Corporate Plan for FY2021/22 – 2024/25
P a g e | 18
Services Description Remarks
Layer 1 Bandwidth services
This is the physical network connection. BBI offers bandwidth services of up to 10 Gig using SDH technology. It also offers bandwidth higher than 10 Gig using DWDM technology.
The products are packaged in STM equivalents of up to STM 64 for SDH technology and multiples of 10 Gigs using DWDM technology.
Layer 2 Bandwidth services
These are packet-based bandwidth services where ethernet services are offered over the SDH or DWDM or native IP technology.
These services are already being offered to current customers albeit inefficiently. The planned network upgrade will allow more efficient provisioning of these services which many small ISPs are interested in.
Layer 2 Services
BBI’s Remote Peering service provides customers with the cost-effective Virtual Layer 2 Ethernet connectivity to the Internet Exchange Points (IXPs) via a single port.
With this connection our customers benefit from enhanced network performance due to lower latency and are then able to arrange peering directly with content providers and network(s) operators.
Layer 3 Services
IP Transit is a service access to the internet. Availing a full routing table to the service provider customers of the organisation and provides a connection with an upstream provider for IP Transit at Teraco Isando.
The proof of concept with one of the international customers was successful.
WACS Connectivity A Tier-1 owner that connects the West Coast of Africa to Portugal and London.
The service enables BBI to provide back-up services and connections for the landlocked countries in the region and beyond.
Customer Tie Cable Maintenance Service
A one-stop solution for a direct connection to BBI sites.
This allows our customers to use this service for repair and maintenance of handover links between our PoPs and customer’s PoP.
Colocation Containerised hosting facility where customers rent space inside these containers and colocate their equipment inside our PoP sites and yards.
This product already exists and will be marketed more strongly to new and existing customers. It provides power, air-conditioning, interconnect and basic engineering services for the equipment. Including landing sites, that offers interconnect capabilities to local and international operators.
Mast Colocation This is designed to allow customers to lease space on a mast owned by BBI to locate their equipment to connect to the organisation’s network.
This product is still in its infancy, but the concept has been successfully trialled with current customers.
Network Operations Centre (NOC) as a service
Disaster Recovery NOC is a service where customers can utilise BBI premises to monitor their networks in cases of a disaster.
Remote monitoring service offered to third-party networks/operators, offering network reports and performance of the customer network components. NOC as a service is currently under development for launch in the next financial year.
Maintenance as a Service
Human resources and technical expertise are available to efficiently repair and maintain third-party fibre networks and communication equipment systems.

Corporate Plan for FY2021/22 – 2024/25
P a g e | 19
Service Availability
BBI’s objective is to promote joint infrastructure planning to avoid duplication of fibre network rollouts.
BBI utilises optic fibre in its network to deliver broadband services to its customers which enables
provision of high-speed transmission that accommodates the end-user. The organisation owns optic
fibre cables and leases primarily from Eskom and Transnet.
The table below depicts the type of fibre optic cable that is owned, leased or has ROU by BBI.
Table 3: Fibre Network Owned, Leased and ROU
BBI has a fibre network connecting all South Africa’s neighbouring countries. The strategic intention
is to strengthen the existing network connections so that the current SLAs are improved by
introducing redundant links. The prime result will be to ensure improved service levels which are
required for backhauling high volumes of data between South Africa and its neighbouring countries.
With the capacitation of national and regional inclusivity in the Fourth Industrial Revolution (4IR), the
SA Connect project, envisions a social agenda of connecting people in remote areas and is
implemented as part of the NDP. The project encompasses the connection of Government facilities,
such as, schools, clinics, hospitals, post offices, Thusong Centres and the police stations, to the
internet for enabling of access to Government services.
Customers
At present, BBI has 61 customers across various segments as shown in the figure below:
Figure 6: BBI’s Number of Customers
Infraco Status OPGW ADSS ADLash U/G Total
Total Owned 0 2 370 3 107 1 020 6 497
Total Leased 448 5 976 65 1 245 7 774
Total ROU 687 0 0 0 687
Total Fibre 1 175 8 346 3 172 2 265 14 958
Customers
37 Internet Service
Providers
2 Metros and Major
Local Municipalities
4 High Data SOCs
10 Infrastructure
Players
3 Mobile Network
Operators
5 Content Providers

Corporate Plan for FY2021/22 – 2024/25
P a g e | 20
2. CORPORATE ETHOS
Vision
Provide communication services to enable a connected and transformed society. This vision is the
intended impact of the ten-year strategy.
Mission
BBI strives to:
• Expand the availability and affordability of access to communication services, including, but
not limited to, underdeveloped and underserviced areas; and
• Enable the acceleration of the State’s digital transformation through broadband connectivity.
Values
BBI strives to deliver excellence, efficiently and effectively, through active engagement with
stakeholders, a customer-centric approach, innovation that is guided by the highest levels of
integrity. These are reflected through their core values, as shown below:
Figure 7: BBI Values
Critical Success Factors
• Access to funding;
• Customer-centricity;
• Resilient network;
• Participation in WACS;
• High-speed broadband connectivity for all provinces, districts and municipalities in South Africa;
• Continuing to delivery of SA Connect Project;
• Adding redundant links to all six neighbouring countries of South Africa; and
• Good relationship with Transnet, Eskom and the provinces.
Excellence in service
delivery
Integrity and
transparency in all that
we do
Fostering an
innovative culture
Deepen customer-
centricity Active
engagement with
stakeholders

Corporate Plan for FY2021/22 – 2024/25
P a g e | 21
3. PERFORMANCE REVIEW
Five-Year Performance Review
BBI’s milestones for the previous five financial years are highlighted in the diagram below:
Figure 8: Milestones over the Previous Five-Years
Intellectual Capital
The Corporate Plan for 2020-2024, including the Annual Performance Plan, was submitted to
shareholders. The strategic planning process resulted in a change of Key Performance Indicators
(KPIs) with five new KPIs identified, and five retired and cascaded to operational level.
The market is shifting from long-term lease contracts of five-years to shorter periods of 12 to 24
months, which impacts on both the price and sales strategy by way of continuous improvement and
evaluation. Further to this, more operators are exploring Alien Wavelength technology in the absence
of Dark Fibre as a solution.
Processes
Management has accelerated the review of current business processes to build effective internal
business process capability and excellence. The progress cascades to the detailed methods and
procedures. In the year under review, we will continue focusing on key end-to-end business
• OHSAS 18001 certification
retention
• ISO 9001-2015 certification 2
external audits completed successfully
• Number of customers increased
to 61
• B-BBEE level 7 • Positive EBITDA
• Positive cash flow generated
from operations
• 89% achievement of the Shareholder Compact
• Unqualified audit opinion
• 313 SA Connect sites connected
and 258 sites tested successfully end-to-end
• 72% increase in Sales volume • ISO 9001-2015 certification 2
external audits completed successfully
• B-BBEE level 7 • The number of customers
increased to 57 • Positive EBITDA • Positive Cash flow generated
from operations • 95% achievement of the
Shareholder Compact • Unqualified audit opinion
• Irregular expenditure • OHSAS 18001 certification
retention
• ISO 9001-2015 certification 2
external audits completed successfully
• Number of customers increased
to 46
• B-BBEE level 7 • Positive EBITDA
• Positive cash flow generated
from operations
64% achievement of the Shareholder Compact
• Unqualified audit opinion
• Zero irregular expenditure • OHSAS 18001 certification
retention • ISO 9001-2015 certification
process started • 18 PoPs optimised • Number of customers
increased to 30 • B-BBEE level 2 • Positive EBITDA • 72% achievement of the
Shareholder Compact • Unqualified audit opinion
• Zero irregular expenditure
• NOSA accreditation
• OHSAS 18001 certification retention
• 33 PoPs optimised
• Number of customers increased to 23
• B-BBEE level 3
• Positive EBITDA
• 87.50% achievement of the Shareholder Compact
• Unqualified audit opinion
2016
2017 2018
2019 2020 (2nd Quarter)

Corporate Plan for FY2021/22 – 2024/25
P a g e | 22
processes and supporting individual processes that span across the core operations and support
functions. It is envisaged that other processes will be completed and implemented in the new
financial year to eradicate any silos and improve collaboration among various divisions and
departments.
Policies
BBI will continue to monitor and update progress reports on approved, new and existing policies and
report quarterly to relevant governance structures.
Table 4: Total Number of Policies
Quality
The Company retained its ISO 9001:2015 certification.
Financial Capital
Over the past few years, the ICT sector continued to experience economic pressures. As a result,
revenue continued to be under pressure even though BBI revenue was on the rise. The momentum
for revenue growth is expected to continue to increase with the implementation of the sales strategy.
This forecast is reflected in the figure below.
Figure 9: Nominal Revenue, OPEX and Cost of Sales - Historical and Forecasted
Manufactured Capital
- 100,00 200,00 300,00 400,00 500,00 600,00 700,00 800,00 900,00
Ran
d in M
illio
ns
Financial Years
Cost of Sales OPEX Revenue
Forecasted
Policy Status Number of Policies
Total number of policy documents in good standing 40
Total number of policies due for review 8
Total number of policy documents published on SharePoint 48
Total number of policy documents in draft (new) 6
Total number of policies 54

Corporate Plan for FY2021/22 – 2024/25
P a g e | 23
BBI has collaborative and commercial engagements with other African and international markets.
The figure below depicts the national and international connectivity footprint.
Figure 10: BBI’s Fibre Footprint
The organisation operates and maintains 147 PoPs, of which 127 are Open Access PoPs. The table
below denotes the number of operational sites per ownership.
Table 5: Network Operational Sites
BBI’s has presence in all nine of the Country’s provinces, with Head Office based in Gauteng and
13 regional offices. The map below exhibits the sites of the regional offices and future expansion
offices.
Site Description Number 3rd Party Access
Yes No
Infraco-owned LD sites 57 56 1
SOC colocation sites 16 10 6
SOC site sharing sites 48 43 5
Customer PoPs 6 0 6
Open Access PoPs 10 10 0
Private lease 8 8 0
Private colocation 2 0 2
Total sites 147 127 20

Corporate Plan for FY2021/22 – 2024/25
P a g e | 24
Figure 11: Regional Centres

Corporate Plan for FY2021/22 – 2024/25
P a g e | 25
Figure 12: Current Status of Fibre, PoPs and Completed SA Connect Sites
Network Footprint
National Connectivity
BBI’s national long-distance fibreoptic network is comprised of more than 14 958 km of optic fibre cable, utilising DWDM equipment to provide
combinations of base capacities ranging from 2.5 Gbps to 100 Gbps lambdas along major network routes. BBI supports small Internet Service
Providers (ISPs) by offering sub-gigabit capacity connections on an IP platform. This allows smaller businesses to provide services to their clients.
The expansion of SA Connect into the rural areas and other underserviced areas, will assist in increasing the number of SMMEs with access to
internet connectivity.
Regional Connectivity
BBI’s network covers all nine provinces, major cities and towns of South Africa and extends to the borders of our neighbouring countries of Botswana,
Lesotho, Mozambique, Namibia, Swaziland and Zimbabwe to provide required interconnectivity.
In line with the Southern African Development Community (SADC) Protocol, BBI has connected all the SADC PoPs. BBI offers services to all the
neighbouring countries through interconnections at border posts.

Corporate Plan for FY2021/22 – 2024/25
P a g e | 26
The following are the border connectivity points:
• Ramatlabama at the border with Botswana;
• Maseru at the border with Lesotho;
• Onseepkans at the border with Namibia;
• Mahamba at the border with Swaziland;
• Beitbridge at the border with Zimbabwe; and
• Komatipoort at the border with Mozambique.
International Connectivity
BBI is a Tier 1 Investor in the 5.1 Terabits Per Second (Tbps) WACS. The cable connects South
Africa to the United Kingdom, with landing stations in Portugal and along the West Coast of Africa.
The interlink between international cables landing on the East coast and international cables landing
on the West coast of South Africa is crucial to our plans. This forms an important backup link for
undersea cables on the east and west coasts. It also provides connectivity between the two regions.
SA Connect and Other Projects
BBI has been mandated to provide network connectivity for the SA Connect Project. This will drive
the rollout of broadband infrastructure to rural and underserviced areas with the goal to achieve an
average universal connection speed of 100 Mbps by 2030. The target is to be achieved progressively
by increasing user experience speed of 5 Mbps in 2016 to 50% of the population and to 90% by
2020.
The SA Connect Phase 1A project (313 sites) is complete. One hundred percent of these sites have
been successfully tested across eight nominated districts. Phase 1B is being implemented in
2019/20 financial year and 339 sites have been installed. 297 sites successful tests have been
conducted.
Network Performance
Network performance is focused on service assurance and fulfilment to BBI’s customers. This is
achieved through proactive monitoring of the network performance indicators, configuration
management, provisioning of services, re-routing of services, and, to prompt the use of BBI’s
maintenance department to repair failures in the shortest possible period.
The goal is to ensure that BBI delivers an acceptable quality service which complies with the
performance metrics specified in the SLAs. In order to ensure business continuity, a fully equipped
disaster recovery Network Operations Centre (NOC) is based in Centurion.
The five classical network management functional areas, namely, Fault, Configuration, Accounting,
Performance and Security (FCAPS) are key to providing network reliability:
• Fault Management – functions and procedures that enable the detection, isolation and
correction of abnormal operation of the network.
• Configuration Management – responsible for system and service activations, addition of
new channels/systems, switching and rerouting traffic and keeping track of the current
condition of the system.
• Performance Management – provides functions to evaluate and report on the behaviour of
the network equipment and the effectiveness of the network, or network elements. This is

Corporate Plan for FY2021/22 – 2024/25
P a g e | 27
done through the gathering and analysis of statistical data for the purpose of monitoring
and correcting the behaviour and effectiveness of the network.
• Network Security and Accounting
The emphasis is on automation of the core business processes through the implementation of
Operations Support System (OSS)/ Business Support System (BSS), upgrading key servers that we
rely on for network management, reducing key personnel dependency through transfer of skills and
recruitment of additional resources.
Social and Relationship Capital
The customer base increased from 55 to 61 in various segments. The organisation adopted a High
School in the year 2013 to support the Maths and Science programme through the provision of
broadband connectivity as a responsible corporate citizen. In previous years, interactive teaching
and learning aids, such as interactive whiteboards, telematics programme, computer tablets and a
laboratory were provided. In the year 2018/19, cybersecurity was installed, and the educators and
learners were trained on cybersecurity as a close-out of the CSI Programme. This programme will
be replicated in more schools in underserviced areas of the country.
In an effort to assure sustainability of the CSI initiatives deployed thus far, BBI has partnered with
Google to deliver ICT training to the students of the adopted schools. The first roll out started in the
third quarter of 2019 and will continue to the 2020 financial years.
Human Capital
The information below displays the workforce profile for BBI. This section details the key staff, the
workforce statistics including productivity and employment cost efficiency evaluation, the
organisation’s employee relations dynamics; training and development initiatives; and lastly the
employment equity status.
Workforce Statistics
The figure below shows the year-on-year change in headcount of employees (excl. contract workers)
from 2008/09 to 2019/20 (Q2).

Corporate Plan for FY2021/22 – 2024/25
P a g e | 28
Figure 13: Year-on-year change in number of employees
Table 6: Employment Equity Demographics as at 30 September 2019
Job Levels Male Female FN Sub Totals
Total A C I W A C I W M F M F
Executives 2 0 0 1 2 0 0 0 1 0 4 2 6
33% 0% 0% 17% 33% 0% 0% 0% 17% 0% 67% 33% 100%
Senior
Management
6 1 0 2 2 0 0 1 1 1 10 4 14
43% 7% 0% 14% 14% 0% 0% 7% 7% 7% 71% 29% 100%
Professional
Specialist and
Middle
Management
25 1 2 4 13 1 0 0 0 0 32 14 46
54% 2% 4% 9% 28% 2% 0% 0% 0% 0% 70% 30% 100%
Supervisory
and Junior
Management
12 0 0 3 4 0 0 0 0 0 15 4 19
63% 0% 0% 16% 21% 0% 0% 0% 0% 0% 79% 21% 100%
Operational 28 0 1 0 13 0 0 0 0 0 29 13 42
67% 0% 2% 0% 31% 0% 0% 0% 0% 0% 69% 31% 100%
Support
0 0 0 0 6 0 0 1 0 0 0 7 7
0% 0% 0% 0% 86% 0% 0% 14% 0% 0% 0% 100
% 100%
Total
Permanent
and fixed term
contracts
73 2 3 10 40 1 0 2 2 1 90 44 134
54% 1% 2% 7% 30% 1% 0% 1% 1% 1% 67% 33% 100%
Note: A=Africans, C=Coloureds, I=Indians and W=Whites, FN= Foreign Nationals
The table below depicts the age profile as per job level.
Table 7: Age Profile by Job Level
37
76
156168
144
170 175
151 152141 144
131
0
20
40
60
80
100
120
140
160
180
200
HE
AD
CO
UN
T
YEARS
Year-on-year Change in Number of Employees
Headcount

Corporate Plan for FY2021/22 – 2024/25
P a g e | 29
Job Levels Average Age
Executives 47
Senior Management 45
Professional Specialist and Middle Management 38
Supervisory and Junior Management 37
Support 35
Average Company Age Profile 40,4
Employee Matters
There are challenges that BBI currently face with regards to employee matters that requires
management in the 2020/21 financial year. Currently BBI has an overstretched human resource
capacity and has potential for health risk. The organisation has a risk of losing critical skills and
knowledge due to lack of retention capability. There is a lack of succession planning and career
pathing resulting from inadequately established organisational structure (vacancies, stagnation, no
promotional opportunities). A low workplace morale and risk of poor performance results from a lack
of affordability of employee appreciation imperatives and future uncertainty attributable to impending
SOC rationalisation. Lastly, the new trade union now has majority membership while the existing
union has been reduced to minority.
Future Outlook
The future outlook for BBI has improved significantly in the past two years. This is partly due to the
implementation of SA Connect and how this has been perceived by various stakeholders. This has
generated an increased interest in BBI from the market, which can also be seen by the increase in
the number of customers within the same period, as well as the growth of the organisations’
opportunities pipeline.
The strategic outlook of BBI for the medium to long term period will consider the impact of the
rationalisation of SOEs. In December 2017, Cabinet approved the framework for the rationalisation
of SOEs. This approved framework includes the formation of the State ICT Infrastructure Company,
which will be formed out of the merger of BBI and Sentech.
When the next phases of the SA Connect project are implemented, various models will be
considered for the last mile of the network, to maintain a balance between non-duplication of existing
infrastructure owned by both private and public entities; and the strategic need for the state to
guarantee the availability of services to under-developed and under-serviced areas. Some of these
models have already been discussed with some of the current SA Connect service providers and
there are agreements that a workable model can be achieved.
In addition to the plan above, in order to minimise duplication of infrastructure at the expense of a
constrained fiscus, engagements have already started with various provinces in order to align
common project goals and utilise existing municipal infrastructure for rolling out the essential
services to some of the underserviced areas.
BBI has an excellent wide area network (WAN) infrastructure spanning thousands of kilometres and
is offering both Layer 2 and Layer 3 services. It is envisaged that this current strength will continue,
through the new State ICT Infrastructure Company which includes BBI with strong fibre connectivity
expertise and Sentech with a strong wireless expertise. A full end-to-end solution can thus be

Corporate Plan for FY2021/22 – 2024/25
P a g e | 30
provided based on a wholesale model. This model is based on the current SA Connect project in
which both these SOCs are participating. For BBI to take advantage of these opportunities, it requires
funding to, amongst others, extend its network footprint, upgrade its core transmission network and
build a national IP/MPLS layer in its network in conjunction with other relevant SOCs, like Sentech
and municipals with ICT infrastructure.
As in the current SA Connect model, the repurposed SITA will the roll out the required services to
these institutions.
There are positive indications in the market that this will occur with the rollout of SA Connect, the
momentum generated in the sales environment, and the effective cost containment measures. It is
expected that the implementation of SA Connect will strengthen BBI’s financial position in the short-
term as BBI moves closer to becoming profitable.
The five-year corporate plan will create a foundation from which BBI will create sustainability and
profitability to ensure continued delivery on its mandate of expanding the availability and affordability
of access to electronic communications in underdeveloped and underserviced areas.
The organisation requires social reengineering as a preventative measure to create hope for future
stability, sustainability and employment. Communication can be leveraged to ensure transparency
and to ensure due processes are followed where necessary. A participative and inclusive approach
must be employed.
Building of requisite capacity for the implementation of BBI’s strategic intent is essential. Significant
investment is required to identify future skills and knowledge requirements, perform competency gap
analysis and the execution of appropriate interventions, so as to ensure the continued competency
of BBI’s human resources. The lack of financial resources needed to enhance organisational
competence means that internal creativity is required to upskill and enable access to career
advancement opportunities, establish a succession pipeline and strengthen leadership
effectiveness.
SOE collaborations can be used to borrow technical expertise, for job rotation and SETA offerings.
Sponsored international seminars should be considered as opportunities for upskilling the
organisation for technological advancement trends, such as the fourth industrial revolution.
To be recognised as an employer committed towards the transformational objectives of the country,
the human resource management function needs to continue to find ways of assisting the
organisation to achieve affirmative action measures intended to eradicate any forms of discrimination
associated with the injustices of our historical background. Lack of internal HR capacity and financial
resources has hindered the ability to address the transformation agenda.
The Corporate Plan also evaluated the potential products that can be presented by the process of
SOC Rationalisation in the context of:
- Immediate products that can be sold to the market;
- Enhanced and stronger proposition that can be launched into the market in the short to
medium term;
- Additional products that will require some investment and quicker returns;

Corporate Plan for FY2021/22 – 2024/25
P a g e | 31
- A long-term view of Products that should be explored as parallel offerings to the current
value proposition.
The products falling under ‘VAS’ and those requiring Enhancement are currently offered by the
entities but would require better co-ordination as well as building at scale in order to access the
markets they are intended for. The last category requires investment.
Corporate Plan for FY2021/22 – 2024/25
P a g e | 32
4. ENVIRONMENTAL ANALYSIS
The following section seeks to highlight the evolution of the external environment including
amendments within the regulatory environment, the macro landscape and industry analysis, target
market and market position of BBI.
Regulatory Environment Amendments
The following legislative changes are under review.
Electronic Communications Amendment Bill
The Department of Telecommunications and Postal Services (DTPS) published a draft Policy
Direction on the licensing of unassigned high-demand spectrum. The National Integrated ICT White
Paper has been converted into the draft Electronic Communications Amendment (ECA) Bill. The Bill
is intended to give legislative and regulatory effect to the policy objectives outlined in the White
Paper. The Bill seeks to govern the establishment of the Wholesale Open Access Network (WOAN)
and includes details around the WOAN’s spectrum allocation, ownership structure and pricing of
facilities leased from MNOs as well as BBI’s participation.
An amendment in favour of additional responsibilities allocated to the BBI will benefit the BBI in terms
of a consolidated mandate reducing overlaps with other entities.
SOC Rationalisation
The formation of the State ICT Infrastructure Company will require the drafting of new legislation to
replace the BBI Act, No 33 of 2007, as well as the Sentech Act, No. 63 of 1996. BBI and Sentech
have started engagements with the transaction advisor on how the planned merger will be
functionally structured, based on the current and proposed future market opportunities of the State
ICT Infrastructure Company.
BBI believes that SOC Rationalisation would benefit both organisations in terms of:
• The total value of the combined entity;
• The consolidated infrastructure as well as asset base which will enable complimentary
services in the value chain;
which will in turn, boost the combined entity’s market position and competitive offering, along
with increased financial capability.
BBI believes that the SOC rationalisation will benefit the State Developmental objectives through:
1. Connectivity of the masses as mandated, enabling access to connectivity for all as well as smart
cities through infrastructure deployment;
2. Reduction of duplication in infrastructure roll-out as well as enabling fiscal savings through scale
and efficiency;
3. Shared efficiency across distribution channel and an end-to-end connectivity offering;
4. Integrated end to end content delivery;
5. Sustainability through State ownership of Infrastructure;
6. Developmental of core country skill and capability in readiness for 4IR;
7. An ethical and responsible corporate organisation with a focus on the social developmental
mandate;
8. Distinguished and strategic ICT partner to business, government and SOCs instrumental to the
digitisation of the country.

Corporate Plan for FY2021/22 – 2024/25
P a g e | 33
BBI recognises the role this merged entity can play in the transformation of society, uplifting the
quality of life citizens as well as being a catalyst for rapid change and enabler of Service Delivery to
citizens. ICT is a critical catalyst to the country closing the gap on the National Development Goals
which are linked to the Sustainable goals. BBI believes that the State ICT Infrastructure Company
will contribute greatly to the achievement of these goals. The merged entity will, from Day 1, enable
a seamless offering of the current product range as well as contribute to expanded future products,
services and solutions.
Financial Impact
R2.4 million has been budgeted by BBI to fund the next phase of the SOC Rationalisation during
the 2021 financial year, which will entail a full due diligence, development of a corporate strategy
and business plan and business model.
A view on the merged State ICT Infrastructure Company consolidated financial position is as
follows:
Financial Position
The overall financial position of the State ICT Infrastructure Company would require further analysis
and strategic restructuring to ensure that the financial position is stabilised and appropriately geared
to embark on expansive growth initiatives in core telecoms / broadband business offerings.
The operating cash flows are forecasted to show a steady growth as both businesses are highly
liquid and the impact of settlement of current debt by existing customers. The cash that will be
invested into the network will be primarily to drive business growth within the existing service
offerings with a national broadband network company that provides end-to-end connectivity offering.
What is clear is that the State ICT Infrastructure Company’s financial position would be stronger
consolidated and would enable access to third party funding to finance the envisaged growth
opportunities. This, coupled with the good corporate governance base and sound financial policies,
would ensure long-term financial sustainability.
Financial Performance
The financial projections for the State ICT Infrastructure Company are expected to show growing
revenues as well as a modest profit. The growth will be primarily driven by the growth in connectivity
revenues whilst cost savings that are anticipated will be offset by the costs that will be incurred in
integrating the business processes of the two companies in the short term. In the medium-term,
efficiency improvements should come into play, coupled with the expected growth opportunities,
which should see overall profitability of State ICT Infrastructure Company improving.
The benefits and risks of SOC Rationalisation are encapsulated in the key strategic enablers on
page 42 to 44.
Macro Environment Analysis
Global Market
The global telecommunications market continues its transformation and is underpinning the digital,
sharing and interconnected economy. This evolution is mainly driven by the ongoing innovations and
Corporate Plan for FY2021/22 – 2024/25
P a g e | 34
technological developments relating to Machine-to-Machine (M2M), Big Data Analytics, Artificial
Intelligence (AI), Cloud Computing and the over-arching Internet of Things (IoT).
While fibre-based projects capture a large portion of capital expenditure (CAPEX); BBI has
witnessed a growth in CAPEX as operators begin spending on infrastructure in preparation for 5G
technology. With more video applications being used by consumers and initiatives around M2M and
the IoT beginning to increase; there is a widespread interest in upgrading to higher-speed services.
There are now approximately 1-billion fixed broadband subscribers worldwide.
The high-speed transmission technologies can be used to connect the end-users to the internet.
Broadband technologies currently being used are digital subscriber line, fibre optics, wireless and
broadband over powerlines. The global fibre market is on the rise and this is driven mainly by the
telecommunication industry.
National Market
In 2018, investment towards fixed broadband services totalled R4.66 billion while infrastructure
totalled R5.92 billion, reflecting an approximate spend of R10.5 billion in the sector1. For the period
of 4-years, fixed broadband subscriptions increased significantly by 61.7%. Over the same period,
DSL Internet subscriptions increased significantly by 41.9%, Fibre-to-the-home (FTTH)/building
internet subscriptions increased by 278.8%, and other fixed broadband subscriptions increased by
3%. There is a very significant level of penetration of fixed broadband subscriptions especially with
regards to consumer adoption of FTTH solutions especially in metropolitan areas.
The key players that offer fixed broadband solutions predominantly offer their services in
Metropolitan areas. However, with the key exceptions of providers such as BBI that extend their
services to remote areas.
Due to a focus on major routes, there has been an increase in investments in the provision of national
long-distance networks. Other routes have remained uncompetitive, resulting in the cost to connect
remote locations remaining high. There is an issue of access in South Africa and national long-
distance networks can be used to increase internet access in remote access.
The ICT industry is ever-changing and requires that BBI remain agile and proactive to continue to
be valuable and sustainable. Cloud services and data centre services are market trends that will
impact the face of broadband connectivity in Africa at large in the near future, hence solid
infrastructure is required. BBI needs to improve its vertical product offerings and reselling of cloud
services to SMMEs, ISP market and Government departments. There is a need for collaborations
with some of the SOEs for cloud and data centre proposition.
Within the South African context, the relationship between South Africa’s National GDP and the
South African telecommunication industry as well as telecommunication investment, indicates that
the industry has been resilient in the face of economic downturn and stagnation. Furthermore, the
total telecommunication investment increased by 25.7% over the 4-year period from 2015 to 2018.
1 ICASA, 2019. The state of the ICT sector report in South Africa, South Africa: ICASA.

Corporate Plan for FY2021/22 – 2024/25
P a g e | 35
Factors Impacting Sector Trends
BBI’s success is linked to the macro-environment it operates in and this will be analysed using PESTEL, the figure below summarises the political,
economic, social, technologic, environment and legal factors.
Figure 14: PESTEL Analysis
POLITICAL ECONOMIC SOCIAL TECHNOLOGY ENVIRONMENT LEGAL
• Government’s National Development Plan SIP 15 which drives to achieve expansion of access to communication technology
• Good political relations with other African and International countries – enables business relations
• Stable local political climate enables the safety of growing the broadband infrastructure
• SOC rationalisation between BBI and Sentech • Policy directive for setting up a WOAN
• Potential for other end user areas of broadband applications to increase community access to Government services e.g. education, health, and economic solutions
• Internet is becoming a basic commodity in many households
• Transition from cable TV to streaming services
• Implementation of broadband infrastructure should be in line with environmental requirements
• The laying of fibre is expected to be done in a manner that is aligned with environment imperatives
• Infrastructure sharing as a vehicle for avoiding unnecessary duplication
• Connectivity prices lowering as a result of increased availability of long haul in many areas
• Decrease in telecoms margins driven by an increase in competition
• Possibility of market consolidation over time driven by business focus on exploiting ICT investments, skills and capabilities
• Landing of undersea cables placing pressure on reducing local national long-distance pricing
• SDG Goal 9 which focuses on Industry, Innovation and Infrastructure
• Increased need for bandwidth to support end user application requirements e.g. video streaming, smart cities
• Cloud computing enabling cloud-based services and applications such as m-health, m-commence, m-education, etc. Resulting in high demand for broadband
• Enablement of relational communications (Machine-to-Machine, Peer-to-Peer)
• Various measures directed towards freeing-up additional spectrum in the 800 MHZ to 2,6 MHZ bands

Corporate Plan for FY2021/22 – 2024/25
P a g e | 36
The main factor that is going to affect BBI’s operation is the possibility of consolidation with Sentech
facilitated by the Government.
Industry Analysis
Competitor Landscape
BBI’s main competitors are Telkom, Liquid Telecom, Vodacom, SEACOM and Dark Fibre Africa
(DFA). Each of these entities have varying strategies evident in their current spread of network. At
present, the underserviced and underdeveloped areas appear as less of a focus area of competitors
as the competitors appear to be focused largely on metros and building network chains across the
African continent.
The South African wholesale backhaul bandwidth market currently lies predominantly with Telkom
due to its extensive fibre infrastructure.
Other competitors are:
• Liquid Telecom that acquired Neotel and has intensified competition in the open access
wholesale market and plan to invest in national long-distance fibre. Additionally, they have
invested in data centres via means of a shareholding; however, the data centres are carrier
neutral.
• SEACOM has acquired FibreCo Telecommunications and plans to increase their wholesale
bandwidth market competition and expand their network in South Africa.
• Vodacom and MTN (and to a lesser extent Cell C) offer wholesale on an opportunistic basis
with long-distance fibre self-build initiatives by FibreCo and mobile operators. However, this
has declined significantly with the Durban-Port Elizabeth-Cape Town route still being
underserved, providing a significant competitive advantage for BBI. Vodacom and MTN have
fully fledged divisions for carrier services with a staff complement that is comparable with
BBI. Vodacom also stretches into Africa.
• Demand for dark fibre has increased and there is a significant decline in demand for managed
bandwidth. This is due to the scale opportunity provided by SOEs, who are disrupting the
market and offering dark fibre to wholesale customers.
Existing and Target Markets
BBI’s market segments can be sub-divided by customers essential to the commercial mandate
(revenue generating customers) and customers who are service recipients of the social mandate.
Existing and Target Markets Essential to the Commercial Mandate
BBI has identified eight market segments that can form part of its customer base. The table below
summarises the different market segments in both public and private sectors.
Table 8: Market Segments of Customers
Segment Description
Mobile Network Operators (MNOs) Mobile network operators requiring national backhaul from base
station controllers/mobile switching centres and redundancy
Other broadband infrastructure
companies
Other wholesale broadband infrastructure operators, both
competitors and partners as well as potential clients e.g. for
redundancy
High data usage Government
departments / SOCs
Government departments or SOCs with high national backhaul
requirement – primarily licensed or license exempt

Corporate Plan for FY2021/22 – 2024/25
P a g e | 37
Segment Description
Major metropolitan municipalities Large urban municipalities developing own metro networks
ICT firms and ISPs / Content providers Systems, infrastructure and services firms with large data centre
International / Regional Telecoms and
Broadband operators
Telecoms and broadband operators in neighbouring SADC
countries and internationally requiring regional connectivity,
international backhaul and redundancy
Provincial Government, DOH, DOE,
DPW
Areas of Government tasked with provincial economic, and
supporting infrastructure development, and improving access to
Government services in underserved areas
Existing and Target Markets for the Delivery of the Social Mandate
The goal of the South African government is to achieve a universal average download speed of 100
Mbps by 2030. The target to be achieved in a progressive manner, reviewable targets by increasing
user experience speed of 5 Mbps in 2016 to 50% of population and to 90% by 2020. Targets are set
for schools, clinics and the public sector at 10Mbps for Phase 1 of SA Connect.
BBI has been mandated to provide network connectivity for the SA Connect Project that will drive
the rollout of broadband infrastructure to rural and under-serviced areas. The table below reflects
targets for existing and targets markets in the public sector.
Table 9: SA Connect Market Segments
Target Market Penetration Measure
Baseline (2013)
By 2016 By 2020 By 2030
Broadband access in Mbps user experience
% of population
33.7% internet access
50% at 5 Mbps
90% at 5 Mbps 50% at 100 Mbps
100% at 10 Mbps 80% at 100 Mbps
Schools % of schools 25% connected
50% at 10 Mbps
100% at 10 Mbps 80% at 100 Mbps
100% at 1 Gbps
Health facilities
% of health facilities
13% connected
50% at 10 Mbps
100% at 10 Mbps 80% at 100 Mbps
100% at 1 Gbps
Government Facilities
% of Government facilities
50% at 5 Mbps
100% at 10 Mbps
100% at 100 Mbps
Gap Analysis
Tabulated below are the factors that demonstrate where the gap lies for BBI.
Table 10: Gap Analysis
FACTOR DESCRIPTION
Market structure and regulatory regime
Regulatory bottlenecks are hampering expansion of the sector, the fairness of competition and ultimately, the welfare of consumers is impacted.
Universal access Failure to enforce universal service obligations on mobile operators had done little to close the digital divide and unintended outcomes have been compounded by failure to enforce universal service obligations (USOs) and the utilise universal service funds
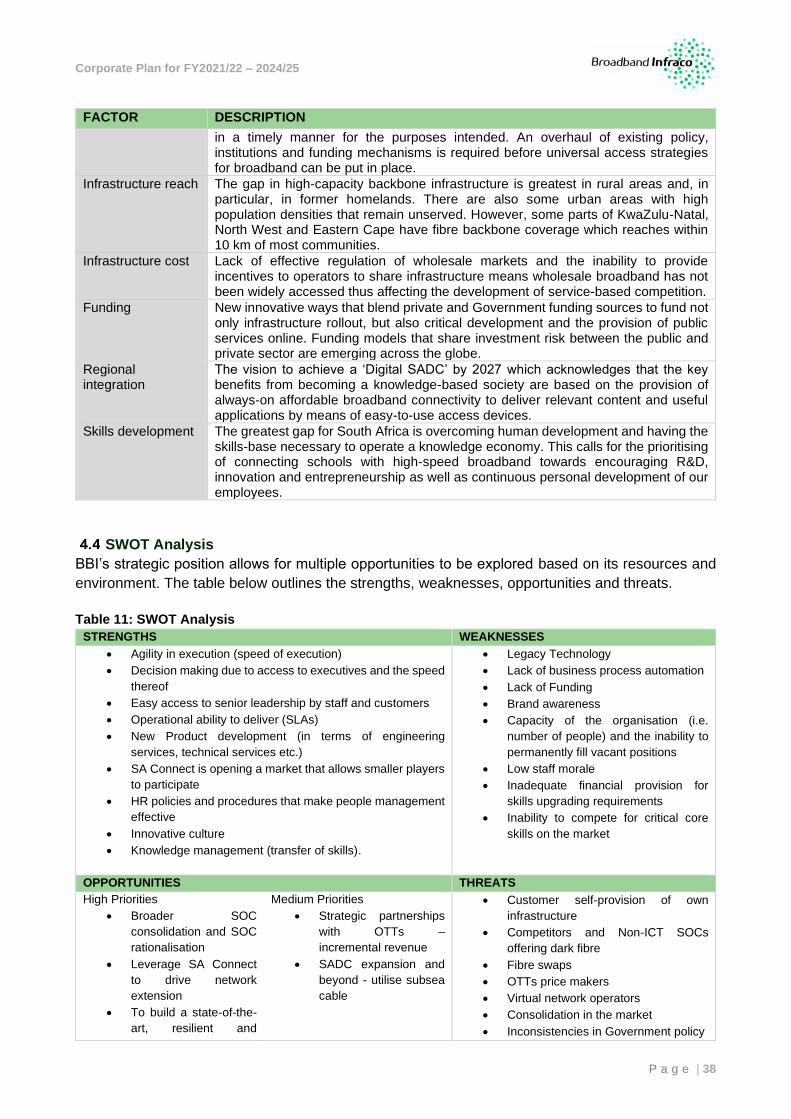
Corporate Plan for FY2021/22 – 2024/25
P a g e | 38
FACTOR DESCRIPTION
in a timely manner for the purposes intended. An overhaul of existing policy, institutions and funding mechanisms is required before universal access strategies for broadband can be put in place.
Infrastructure reach The gap in high-capacity backbone infrastructure is greatest in rural areas and, in particular, in former homelands. There are also some urban areas with high population densities that remain unserved. However, some parts of KwaZulu-Natal, North West and Eastern Cape have fibre backbone coverage which reaches within 10 km of most communities.
Infrastructure cost Lack of effective regulation of wholesale markets and the inability to provide incentives to operators to share infrastructure means wholesale broadband has not been widely accessed thus affecting the development of service-based competition.
Funding New innovative ways that blend private and Government funding sources to fund not only infrastructure rollout, but also critical development and the provision of public services online. Funding models that share investment risk between the public and private sector are emerging across the globe.
Regional integration
The vision to achieve a ‘Digital SADC’ by 2027 which acknowledges that the key benefits from becoming a knowledge-based society are based on the provision of always-on affordable broadband connectivity to deliver relevant content and useful applications by means of easy-to-use access devices.
Skills development The greatest gap for South Africa is overcoming human development and having the skills-base necessary to operate a knowledge economy. This calls for the prioritising of connecting schools with high-speed broadband towards encouraging R&D, innovation and entrepreneurship as well as continuous personal development of our employees.
SWOT Analysis
BBI’s strategic position allows for multiple opportunities to be explored based on its resources and
environment. The table below outlines the strengths, weaknesses, opportunities and threats.
Table 11: SWOT Analysis
STRENGTHS WEAKNESSES
• Agility in execution (speed of execution)
• Decision making due to access to executives and the speed
thereof
• Easy access to senior leadership by staff and customers
• Operational ability to deliver (SLAs)
• New Product development (in terms of engineering
services, technical services etc.)
• SA Connect is opening a market that allows smaller players
to participate
• HR policies and procedures that make people management
effective
• Innovative culture
• Knowledge management (transfer of skills).
• Legacy Technology
• Lack of business process automation
• Lack of Funding
• Brand awareness
• Capacity of the organisation (i.e.
number of people) and the inability to
permanently fill vacant positions
• Low staff morale
• Inadequate financial provision for
skills upgrading requirements
• Inability to compete for critical core
skills on the market
OPPORTUNITIES THREATS
High Priorities
• Broader SOC
consolidation and SOC
rationalisation
• Leverage SA Connect
to drive network
extension
• To build a state-of-the-
art, resilient and
Medium Priorities
• Strategic partnerships
with OTTs –
incremental revenue
• SADC expansion and
beyond - utilise subsea
cable
• Customer self-provision of own
infrastructure
• Competitors and Non-ICT SOCs
offering dark fibre
• Fibre swaps
• OTTs price makers
• Virtual network operators
• Consolidation in the market
• Inconsistencies in Government policy

Corporate Plan for FY2021/22 – 2024/25
P a g e | 39
redundant network and
IP network
• Automation – (1)
business process
internally (2)
operational externally
• Expansion of IP based
product suite
• Alien wavelength
• Dark Fibre
• Competitive advantage
of reach and network
capacity
• Leveraging off
entrepreneurs and
start-ups to drive
innovation in the public
sector (e.g. Innovation
hubs, attend
entrepreneur summits
and identify potential
opportunities)
• Data centres
• Broader SOC
consolidation and SOC
rationalisation
Low Priorities
• FTTH
• Continuous loss of critical and scare
skills
• Speculations about the proposed
merger
• Lack of National Treasury funding
allocation to continue with the roll-out
of SA Connect

Corporate Plan for FY2021/22 – 2024/25
P a g e | 40
5. CORPORATE STRATEGY
Overview of Corporate Strategy
BBI’s mandate enables the organisation to be one of the central drivers of the fourth industrial
revolution. Fibre is an essential product to enable connectivity and drive a gigabit society. BBI is
mandated to increase accessibility to electronic communications and transactions across South
Africa (and beyond). At present, the core of BBI’s products and services is within the hardware and
connectivity elements of the value chain, as shown below.
Figure 15: BBI’s Position within the Industry Value Chain
Overall, BBI seeks to reach its desired vision to: “Provide communication services to enable a
connected and transformed society”. This impact will be enabled through three key phases: (1)
Stabilise and Mobilise, (2) Build Infrastructure and Grow Customer Base, and (3) Grow Services to
Enable Digital Transformation. The phases, together with the strategic goals are summarised in the
figure below, where Phase 1 and 2 commence in the short-term while Phase 3 is expected to
commence in the medium- to long-term.
Stabilise and mobilise is a critical precursor to Phase 2 and 3. Within Phase 1, critical levers to
enable financial stability is necessary, such as the securing of funds to expand on infrastructure.
Similarly, key internal-focused activities are required to gear the organisation towards delivery of the
strategy, for example review of the business model, operating model, processes and implementation
of automation systems.
Phase 2 focuses on the directed efforts of customer attraction and retention through a customer-
centric model developing new business within both the private and public sector. The commercial
mandate will aid in the subsidisation of the social mandate, allowing BBI to expand faster into the
underdeveloped and underserviced areas.
Telecom Infrastructure
Network Equipment
Network Operator
Cloud and IoT Services
Content Portals /
Aggregators Subscribers
Dark Fibre Africa;
SEACOM; Telkom
OpenServeLiquid
Nokia-Siemens Huawei Ericsson Alcatel Cisco
Vodacom Telkom Liquid
Telecom MTN
CELL C
AWS IBM
Azure
Social Media
OTT Media Entities
IoT Applications
Hardware Connectivity Value Added Services
Valu
e C
hain
C
om
ponent
Pre
dom
inant
Com
petito
rs
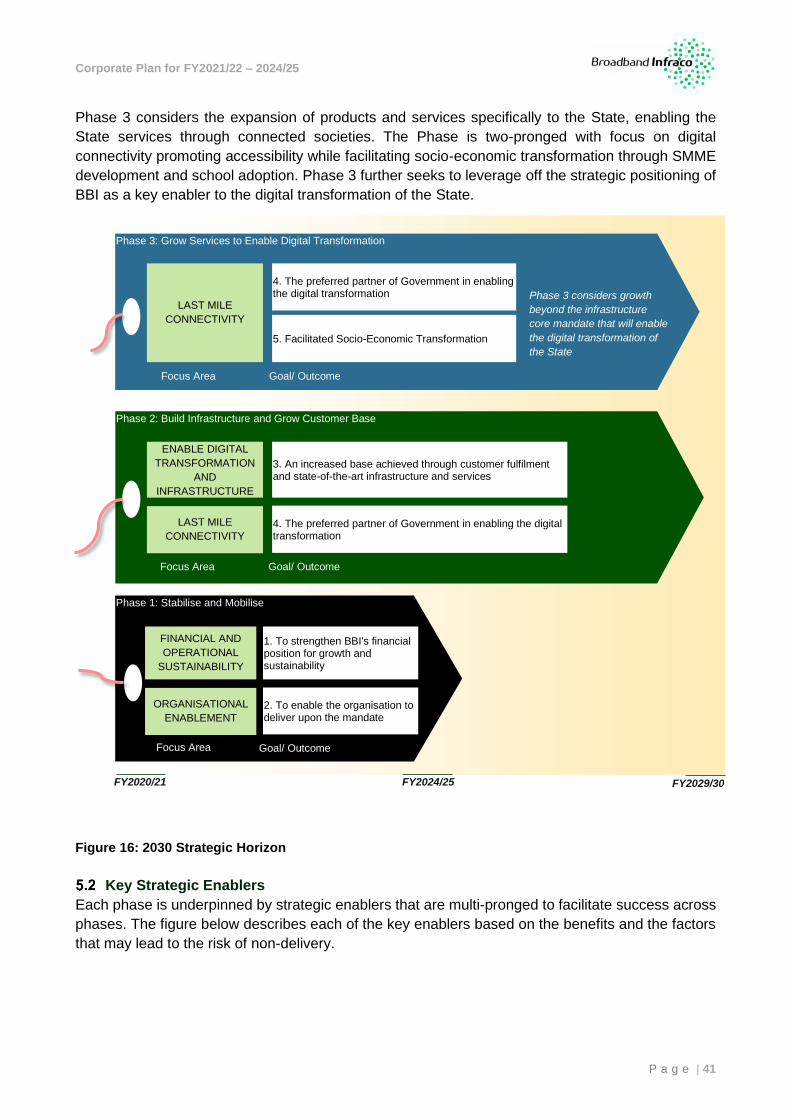
Corporate Plan for FY2021/22 – 2024/25
P a g e | 41
Phase 3 considers the expansion of products and services specifically to the State, enabling the
State services through connected societies. The Phase is two-pronged with focus on digital
connectivity promoting accessibility while facilitating socio-economic transformation through SMME
development and school adoption. Phase 3 further seeks to leverage off the strategic positioning of
BBI as a key enabler to the digital transformation of the State.
Figure 16: 2030 Strategic Horizon
Key Strategic Enablers
Each phase is underpinned by strategic enablers that are multi-pronged to facilitate success across
phases. The figure below describes each of the key enablers based on the benefits and the factors
that may lead to the risk of non-delivery.
FY2020/21 FY2024/25 FY2029/30
Phase 2: Build Infrastructure and Grow Customer Base
3. An increased base achieved through customer fulfilment and state-of-the-art infrastructure and services
4. The preferred partner of Government in enabling the digital transformation
Phase 1: Stabilise and Mobilise
2. To enable the organisation to deliver upon the mandate
1. To strengthen BBI's financial position for growth and sustainability
Phase 3: Grow Services to Enable Digital Transformation
4. The preferred partner of Government in enabling the digital transformation Phase 3 considers growth
beyond the infrastructure
core mandate that will enable
the digital transformation of
the State
ORGANISATIONAL
ENABLEMENT
FINANCIAL AND
OPERATIONAL
SUSTAINABILITY
LAST MILE
CONNECTIVITY
ENABLE DIGITAL
TRANSFORMATION
AND
INFRASTRUCTURE
LAST MILE
CONNECTIVITY
Focus Area Goal/ Outcome
Focus Area Goal/ Outcome
Focus Area Goal/ Outcome
5. Facilitated Socio-Economic Transformation

Corporate Plan for FY2021/22 – 2024/25
P a g e | 42
BE
NE
FIT
S
PR
IOR
ITY
KEY ENABLERS
RIS
K O
F N
ON
-DE
LIV
ER
Y
• Loss of opportunities • Hinders ability to deliver services
on time • Reduced customer trust • Increased internal conflict • Loss of revenue • Lower network resilience • Future uncertainty regarding
merger affects morale • Lack of resources creates inability
to retain critical and scarce skills • Lack of opportunity to implement
transformational succession and career-pathing
• Expanded network • Faster conversion of sales into
revenue • Increase customer satisfaction
and experience • Flexible product offering • Increase market share • Increase competitive advantage • Resilience/meshed network • Intense technical training skills • Optimisation of capacity through
HR strategies • Knowledge and skills sharing
through collaborations with other SOCs and MICT SETA
•
High
CAPACITY
• Expand infrastructure and products
• Develop new service offerings • Increase competitive edge and
access to new markets • Skill transfer and sharing of
knowledge • Improved revenue and lower
COS base • Increase customer base • Drive innovation
PARTNERSHIPS/ COLLABORATIONS/
ALLIANCES
High
• Higher cost to deliver • Siloed state delivery • Limited product range • Duplication of infrastructure and
CAPEX spend • Loss of revenue • Limited customer acquisition • Limited company growth
• Allows spectrum that is needed and access to the expertise from Sentech
• Expansion of mandate • Potential new business model • Access to and expansion of business
networks • Enhanced human resources capacity • Strengthen cash reserves (short-
term)
SOC RATIONALISATION
Medium to High
• Challenges of infrastructure growth
• Challenges of Network Expansion • Critical to provincial roll-out
• Conversion of shareholder loan will improve BBI’s chances to acquire funding
• Enable BBI to prioritise builds outside of third-party requirements
• Enable BBI to deliver projects of national interest
• Enable faster service delivery
ACCESS TO FUNDING
High
• Threat to BBI’s sustainability
• A sole provider of state ICT connectivity
• Internal reduction of CAPEX and OPEX
• Provide with competitive advantage • Minimise duplication of resources
and CAPEX spend for the state • Connectivity time frames will be
minimised • Service delivery will be quicker
CONSOLIDATION OF STATE FIBRE
High
• Threat to the sustainability of BBI • Impact Government’s delivery on
social mandate especially the issue of accessibility and affordability
PH
AS
E

Corporate Plan for FY2021/22 – 2024/25
P a g e | 43
Implementation of SOC Rationalisation
The State ICT Infrastructure Company will be a telecoms/broadband provider which is what BBI is
already. The State ICT Infrastructure Company could possibly be mirrored along the lines of
Australia’s National Broadband Network (NBN) Company. Australia’s NBN has the following policy
/ business objectives:
• ensuring that all Australians have access to very fast broadband as soon as possible,
• at affordable prices, and
• at least cost to taxpayers.
Being a telecoms company, State ICT Infrastructure Company will lean heavily on Broadband
Infraco’s personnel and expertise. This includes functions, such as Network Engineering, Project
Management, Sales (customer on-boarding processes), WACS, telecoms process framework,
maintenance systems (NOC and O&M), customers, SLA management, regulatory compliance.
BBI believes that there are key success factors that need to be considered for the success of the
State ICT Infrastructure Company and these include amongst others:
• Firming up the mandate of the State ICT Infrastructure Company as well as defining the role
of non-ICT SOCs to manage the possible distortion of the market;
• Government aggregation of broadband demand across the three spheres of government and
enabling the State ICT Infrastructure Company to be a preferred Provider to Government;
• Spectrum decision and allocation for rural deployment to ease on the cost of deployment;
• Business Model (funded or unfunded);
Below are options of possible legal structures of the merger:
1. One holding company with two subsidiaries; or
2. Sentech being incorporated into BBI; or
3. BBI being incorporated into Sentech.
BBI believes the most probable and beneficial option is Sentech being incorporated into BBI due to
the following benefits:
• Broadband Infraco Act: The Act entitles or empowers Broadband Infraco to:
▪ A statutory right of access to Eskom’s and Transnet’s servitudes. This is critical for time
to market as it will allow the merged entity to expand its electronic communications
network quicker without being subjected to timely wayleave acquisition issues.
▪ Rights of Expropriation of land for network roll-out and expansion. To the extent that the
State ICT Infrastructure Company needs to acquire land to deploy or extend its electronic
communications network, it may expropriate third-party land to do so. Such a right will,
however, be subject to section 25 of the Constitution.
• Tax: Broadband Infraco’s assessed tax loss could, among other things, mean that State ICT
Infrastructure Company will potentially not have to pay corporate income tax until the
assessed loss is depleted. The details of this benefit is being investigated by the transaction
advisor.
• Schedule 2 Public Entity: BBI is a schedule 2 that is in line the future outlook of the state that
public entities should be sustainable to reduce dependency on the fiscus. It is envisaged that
the State ICT Infrastructure Company will be a schedule 2 entity; and

Corporate Plan for FY2021/22 – 2024/25
P a g e | 44
Progress
The first phase of the SOC Rationalisation process performed a high-level analysis of the current
functions within the entities as well as the design of a possible merged entity, the outputs of which
will be:
• The valuation of the merged entity; and
• The Post merger integration plan.
Focus Areas and Outcomes
Drawing from the Revised Framework for Strategic Plans and Annual Performance Plans (FSAPPs)
released in 2019, the framework outlines the identification of an intended impact that is cascaded
down through achievable outcomes and outputs. As such, BBI has identified five essential outcomes
required to attain the impact: “Provide communication services to enable a connected and
transformed society”. BBI’s outcomes are categorised into the segments depicted below.

Corporate Plan for FY2021/22 – 2024/25
P a g e | 45
Figure 17: Impacts, Focus Areas and Outcomes
Each outcome has set out outputs to achieve the defined focus areas as set out above. Outcomes identify a five-year intention while Outputs are
updated annually.
IMP
AC
T
Pro
vid
e c
om
mu
nic
ati
on
serv
ices t
o e
na
ble
a c
on
ne
cte
d a
nd
tra
ns
form
ed
so
cie
ty
•In
cre
ased a
vaila
bili
ty a
nd a
fford
abili
ty to c
om
mu
nic
atio
n s
erv
ices inclu
din
g,
but
not
limited t
o, underd
evelo
ped a
nd u
nders
erv
iced a
reas
•Im
ple
mente
d in
novative, effic
ient and c
ost-
effective c
om
munic
atio
n s
erv
ices
•A
Sta
te s
upport
ed t
hro
ugh b
roadband c
onnectivity
•A
str
ate
gic
ally
positio
ned,
reputa
ble
, com
petitive a
nd p
rofita
ble
in
dustr
y p
layer
OUTCOME INDICATORS
• Increased State-owned fibre infrastructure accessed and managed
• Improved cash position • Improved financial ratios • Increased year-on-year revenue growth (including SA Connect) • Improved cost optimisation
• Aligned organisational establishment and development models • Increased Overall Employee Performance • Reviewed and implemented improved Corporate Governance • Improved Leadership Effectiveness Rating (through survey) • Improved innovative culture •
OUTCOMES
A strengthened financial position for
growth and sustainability
An organisation enabled to deliver
upon the mandate
• Increased market share value • Increased fibre infrastructure (excl. SA Connect) • Increased innovations implemented • Improved network restoration turnaround time
Lowered cost of network infrastructure
An increased base achieved through
customer fulfilment and state-of-the-
art infrastructure and services
• Increased collaborations established and executed with relevant stakeholders and other SOEs to facilitate innovation
• Increased delivery of SA Connect Sites
The preferred partner of Government
in enabling the digital transformation
Facilitated Socio-Economic
Transformation • Increased initiatives supporting socio-economic transformation
FOCUS AREAS
Organisational
Enablement
Financial and
Operational
Sustainability
Last Mile
Connectivity
Enable Digital
Transformation and
Infrastructure

Corporate Plan for FY2021/22 – 2024/25
P a g e | 46
Table 12 Outcomes descriptions
OUTCOME DESCRIPTION
1. A strengthened financial position for growth and
sustainability
To achieve an enhanced financial position of the business that ensures stable and
increasing revenue streams, and optimised costs (expenses) to result in an
improved cash position that is sustainable
2. An organisation enabled to deliver upon the mandate
To ensure that the BBI is operationally aligned and geared to deliver upon the
mandate. This includes ensuring aligned and optimised business and operating
models and processes, maintained consistent and effective leadership,
strengthened governance, enhanced employee effectiveness and an innovative
culture.
3. An increased base achieved through customer
fulfilment and state-of-the-art infrastructure and
services
To increase the customer base and market-share by offering state-of-the-art
infrastructure and services to customers. This includes delivering innovative and
quality products and services to offer an enhanced value proposition to customers.
4. The preferred partner of Government in enabling the
digital transformation
To position BBI as the preferred partner in Government by enabling the digital
transformation of South Africa through increased collaboration and execution with
relevant stakeholders and other SOEs to facilitate innovation and to deliver upon
SA Connect sites.
5. Facilitated Socio-Economic Transformation
To facilitate Socio-Economic Transformation within South Africa through targeted
initiatives such as increasing access to fibre by schools and supporting the
development and involvement of SMMEs in the sector.

Corporate Plan for FY2021/22 – 2024/25
P a g e | 47
Strategy Map
Applying the Balanced Scorecard (BSC) Model, Outputs were transposed to outline the requirements to achieve the Outcomes and intended Impact.
Figure 18: Strategy Map
Financial
Customer Value
Internal
Business
CA
US
E
EF
FE
CT
Additional State-
owned fibre
infrastructure
accessed and
managed
Increased
Investment and
Funding
Improved Debt to
Equity Ratio
New Sales
Contracts
Managed
Working
Capital
Increase in sales
within the SADC
region
Deployed demand and
sourcing strategy
Aligned company structure
Improved corporate
governance
Improved business
process execution
and implementation
Automated
processes and
build business
process inventory
Operation of an
efficient, reliable
and cost-effective
network
Improved
turnaround time
between sales
and revenue
earned
OUTPUTS
Revenue Growth Strategy Effective Resource Usage
Improve Shareholder Value
A strengthened financial position for
growth and sustainability
An organisation enabled to deliver
upon the mandate
Innovation and
Learning
Aligned HR
Capacity building
and optimisation
Enhanced
Leadership
Effectiveness
Fostered
Innovative Culture
An increased base achieved through
customer fulfilment and state-of-the-
art infrastructure and services
The preferred partner of Government
in enabling the digital transformation
Facilitated Socio-Economic
Transformation
OUTCOMES
New Products, Responsive Supply, Preferred Supplier, Customer Partnership
Technology Capability, Operational Excellence, Design Productivity
Technology Leadership, Product Focus, Time to Market, Workforce Capacitation
Improved EBITDA
Expanded network
ensuring
robustness and
resilience
Timeous Delivery of
SA Connect Sites
SMMEs supported
Schools connected
Increased product
innovation through
partnerships
Implemented
collaborations with
other SOEs
Increased Brand
Equity
Quality Customer
Attraction &
Retention
Optimised Costs
Competitive
Reward and
Remuneration
Practices
Increased
Resellers
Pro
vid
e c
om
mu
nic
atio
n s
erv
ices to
enable
a c
onnecte
d a
nd tra
nsfo
rmed s
ocie
ty

Corporate Plan for FY2021/22 – 2024/25
P a g e | 48
Applying the BSC Model, the financial perspective seeks to capture four key elements within the
perspective: (a) revenue, (b) profit, (c) optimised business costs and (d) asset utilisation. Elements
(a) and (b) make up the revenue growth strategy while (c) and (d) contribute to effective resource
usage. Overall, these elements seek to measure financial growth and sustainability, and are a result
of the innovation and learning, internal business and customer perspective together with financial
strategies. The above BSC identifies the outputs that BBI will utilise to drive the revenue growth
strategy while ensuring effective resource utilisation. These activities will lead to the fulfilment of
Outcome 1 (a strengthened financial position for growth and sustainability is directly linked to the
attainment of these components).
The customer value perspective addresses areas that will lead to customer acquisition, retention
and satisfaction. These are made up of elements that address product and service attributes, the
relationship with the customer and image of the organisation. Applied to BBI, the outputs associated
with product and service attributes include expanded network ensuring robustness and resilience,
SA Connect sites delivered and maintained, increased product innovation through partnerships as
well as implemented collaborations with other SOEs. The relationship with the customer is measured
through quality customer attraction and retention; while the image of the organisation is measured
through brand equity.
Included as part of customer relationship are the SMMEs and schools that will be supported. Outputs
such as SA Connect sites, supported SMMEs and schools are linked to BBI’s social mandate as well
as the NDP vision (see Section 1) by connecting individuals in underdeveloped and underserviced
areas while focusing on socio-economic transformation in the process.
These outputs are linked to the delivery of three outcomes essential for the business: (a) an
increased base achieved through customer fulfilment and state-of-the-art infrastructure and services;
(b) preferred partner of Government in enabling the digital transformation; and (c) facilitated socio-
economic transformation.
The internal business perspective is made up of areas that drive BBI towards organisational
alignment, which will ultimately underpin the organisation’s internal ability to deliver upon the dual
mandate. The outputs include improved business process execution and implementation, automated
processes and build business process inventory, aligned organisational structure, and improved
corporate governance. It also focuses on the technology capability of BBI with focus on outputs such
as operation of an efficient, reliable and cost-effective network as well as improved turnaround time
between sales and revenue earned. A key enabler is the access and management of State-owned
fibre infrastructure that will enable greater technology capability (linked to increased capacity to sell),
operational excellence and design productivity.
Lastly, the innovation and learning perspective is essential to building and maintaining a competitive
edge. These are to align the HR capacity building and optimisation, enhanced leadership
effectiveness, fostered innovative culture and a competitive reward and remuneration practices.
These outputs will ensure that BBI remains relevant, innovative and offers cost-effective solutions.
This perspective is a key enabler of the remaining perspectives.
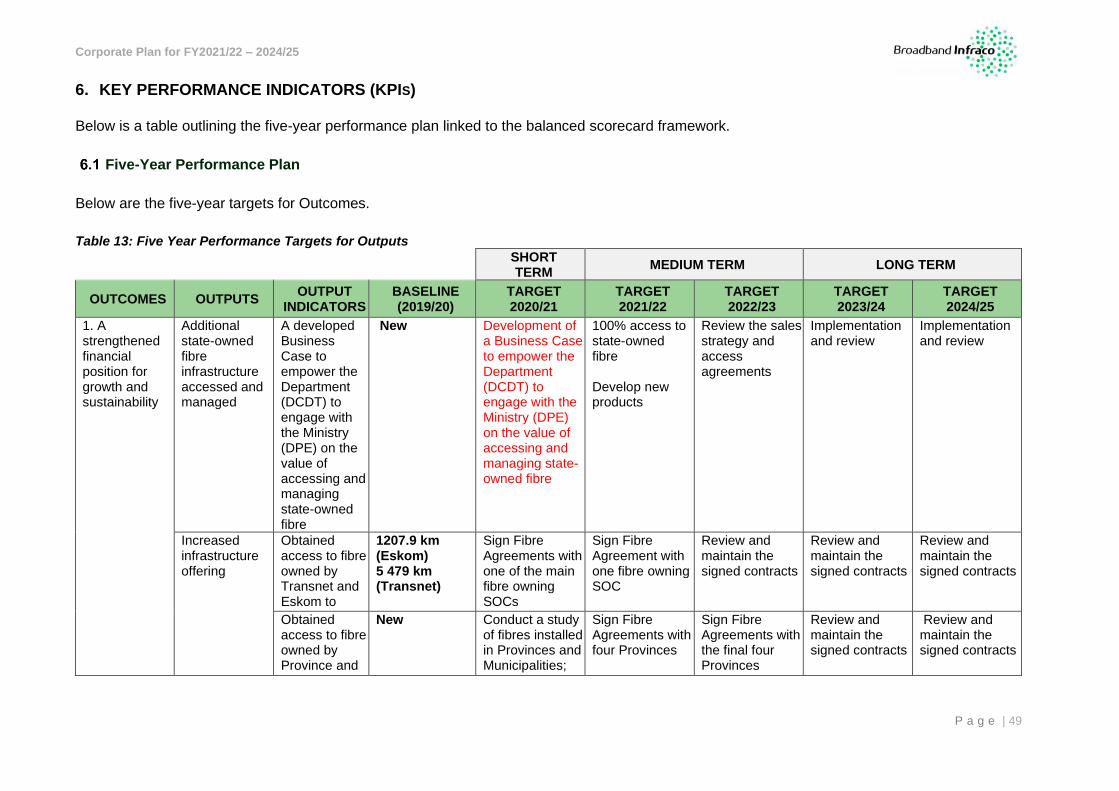
Corporate Plan for FY2021/22 – 2024/25
P a g e | 49
6. KEY PERFORMANCE INDICATORS (KPIS)
Below is a table outlining the five-year performance plan linked to the balanced scorecard framework.
Five-Year Performance Plan
Below are the five-year targets for Outcomes.
Table 13: Five Year Performance Targets for Outputs
SHORT TERM
MEDIUM TERM LONG TERM
OUTCOMES OUTPUTS OUTPUT
INDICATORS BASELINE (2019/20)
TARGET 2020/21
TARGET 2021/22
TARGET 2022/23
TARGET 2023/24
TARGET 2024/25
1. A strengthened financial position for growth and sustainability
Additional state-owned fibre infrastructure accessed and managed
A developed Business Case to empower the Department (DCDT) to engage with the Ministry (DPE) on the value of accessing and managing state-owned fibre
New Development of a Business Case to empower the Department (DCDT) to engage with the Ministry (DPE) on the value of accessing and managing state-owned fibre
100% access to state-owned fibre Develop new products
Review the sales strategy and access agreements
Implementation and review
Implementation and review
Increased infrastructure offering
Obtained access to fibre owned by Transnet and Eskom to
1207.9 km (Eskom) 5 479 km (Transnet)
Sign Fibre Agreements with one of the main fibre owning SOCs
Sign Fibre Agreement with one fibre owning SOC
Review and maintain the signed contracts
Review and maintain the signed contracts
Review and maintain the signed contracts
Obtained access to fibre owned by Province and
New Conduct a study of fibres installed in Provinces and Municipalities;
Sign Fibre Agreements with four Provinces
Sign Fibre Agreements with the final four Provinces
Review and maintain the signed contracts
Review and maintain the signed contracts

Corporate Plan for FY2021/22 – 2024/25
P a g e | 50
SHORT TERM
MEDIUM TERM LONG TERM
OUTCOMES OUTPUTS OUTPUT
INDICATORS BASELINE (2019/20)
TARGET 2020/21
TARGET 2021/22
TARGET 2022/23
TARGET 2023/24
TARGET 2024/25
Local Government
Sign Fibre Agreements with at least one Province
New Sales Contracts
New Sales Contracts Signed Annually
R116 million New Sales Contracts Signed
R350 million New Sales Contracts Signed Annually
R400 million New Sales Contracts Signed Annually
R450 million New Sales Contracts Signed Annually
R500 million New Sales Contracts Signed Annually
R550 million New Sales Contracts Signed Annually
Increased sales within the SADC region
Rand amount of sales within the SADC region
New 10% sales increase year-on-year within SADC region
30% increase year-on-year within SADC region
20% increase year-on-year within SADC region
20% increase year-on-year within SADC region
20% increase year-on-year within SADC region
Increased Resellers
Increased facilitation to resellers
New 10 New Resellers Contracted
10 New Resellers Contracted
Five New Resellers Contracted
Five New Resellers Contracted
Two New Resellers Contracted
Increased investment and funding
Rand increase in investment and funding
R0 R450 million funding secured
R200 million funding secured
R200 million funding secured
R200 million funding secured
R200 million funding secured
Improved cash position
% Revenue year-on-year growth (including SA Connect)
12% revenue year-on-year growth
22% revenue year-on-year growth
10% revenue year-on-year growth
9% revenue year-on-year growth
10% revenue year-on-year growth
11% revenue year-on-year growth
# of days per outstanding customer invoice per month
54 Debtors days
Debtors collection of 60 days per contract
Debtors collection of 60 days per contract
Debtors collection of 60 days per contract
Debtors collection of 60 days per contract
Debtors collection of 60 days per contract

Corporate Plan for FY2021/22 – 2024/25
P a g e | 51
SHORT TERM
MEDIUM TERM LONG TERM
OUTCOMES OUTPUTS OUTPUT
INDICATORS BASELINE (2019/20)
TARGET 2020/21
TARGET 2021/22
TARGET 2022/23
TARGET 2023/24
TARGET 2024/25
Improved Debt to Equity Ratio
Increased Gearing Ratio
63% Gearing Ratio
212% Debt to Equity
293% Debt to Equity
363% Debt to Equity
461% Debt to Equity
515% Debt to Equity
Increased EBITDA
Improved Operating Profit before Depreciation after Interest
Decline by R34 million
Improve profit before depreciation after interest by R12 million
Improve profit before depreciation after interest by R2 million
Improve profit before depreciation after interest by R31 million
Improve profit before depreciation after interest by R14 million
Improve by R15 million profit before depreciation after interest
Managed Working Capital
Increased Working Capital Ratio
36% working capital
34% working capital
44% working capital
58% working capital
70% working capital
94% working capital
Maintain Positive Cash Balance monthly
R18 million cash and cash equivalent available
R15 million cash and cash equivalent available
R15 million cash and cash equivalent available
R15 million cash and cash equivalent available
R15 million cash and cash equivalent available
R15 million cash and cash equivalent available
# of days within which SMMEs invoices are paid
SMME invoice paid within 20 days
SMME invoice paid within 30 days
SMME invoice paid within 25 days
SMME invoice paid within 20 days
SMME invoice paid within 20 days
SMME invoice paid within 20 days
Deployed demand and sourcing strategy
New sourcing and demand planning strategy and policy developed and deployed
New Detailed scoping of the terms of engagement
100% compliance with strategy and policies
100% compliance with strategy and policies
100% compliance with strategy and policies
100% compliance with strategy and policies
New contracts management monitoring strategy implemented
New 100% compliance with strategy and policies
100% compliance with strategy and policies
100% compliance with strategy and policies
100% compliance with strategy and policies

Corporate Plan for FY2021/22 – 2024/25
P a g e | 52
SHORT TERM
MEDIUM TERM LONG TERM
OUTCOMES OUTPUTS OUTPUT
INDICATORS BASELINE (2019/20)
TARGET 2020/21
TARGET 2021/22
TARGET 2022/23
TARGET 2023/24
TARGET 2024/25
Improved turnaround time between sales and revenue earned
Time between sales and revenue reduced
New Review the process of service provisioning and sign off
Set a list of prerequisite requirements for expeditions implementation
Review effectiveness of re-established structure process
2. An organisation enabled to deliver upon the mandate
Drive the SOC Rationalisation process
Completed business case and plan for merger
Post-merger integration plan
Complete merger details and refine integration plan
Implement merger and integration of BBI and Sentech
Improved business process implementation
Number of key end-to-end business processes implemented
3 end-to-end processes reviewed
4 identified end-to-end processes developed
4 identified end-to-end processes developed
4 identified end-to-end processes measured
4 identified end-to-end processes measured
8 identified end-to-end processes reviewed
Improved business process visibility
Percentage of process visible on the Dashboard
New 60% of Processes visible on the Dashboard
40% of Processes visible on the Dashboard
BPM tool (system) Implemented
Review Business process conformance and performance
Business process improvement
Fostered Innovative Culture
Implemented change management interventions across the organisation
New Develop and implement appropriate change management interventions
Conduct employee satisfaction surveys to track the organisational culture
Conduct employee satisfaction surveys to track the organisational culture
Conduct employee satisfaction surveys to track the organisational culture of the organisation
Conduct employee satisfaction surveys to track the organisational culture
Aligned Company Structure
Reviewed and implemented Organisational Structure
155 approved head count
Implement Shareholder approved Company structure
Implement Shareholder approved Company structure
Implement Shareholder approved Company structure
Implement Shareholder approved Company structure
Revise Shareholder approved Company structure

Corporate Plan for FY2021/22 – 2024/25
P a g e | 53
SHORT TERM
MEDIUM TERM LONG TERM
OUTCOMES OUTPUTS OUTPUT
INDICATORS BASELINE (2019/20)
TARGET 2020/21
TARGET 2021/22
TARGET 2022/23
TARGET 2023/24
TARGET 2024/25
Aligned HR Capacity building and optimisation
Talent resourced and developed and Succession Plan Implemented
Talent resourcing and development succession planning strategy
Revise and implement talent sourcing and development and Succession Planning Strategy
Monitor implementation of Talent sourcing and development and Succession Planning strategy
Monitor implementation of Talent sourcing and development and Succession Planning strategy
Revise and implement talent sourcing and development and development and Succession Planning strategy
Revise and implement, talent sourcing and development and Succession Planning strategy
Maintained talent retention within market norm
9.2% talent turnover
90% retention of permanent headcount
90% retention of permanent headcount
85% retention of permanent headcount
90% retention of permanent headcount
90% retention of permanent headcount
Approved career pathing framework for core areas
50% implementation in core areas and develop tools for execution
Review the technical career pathing framework according to the revised professional engineering structure
Review the technical career pathing framework according to the revised professional engineering structure
Align competency framework to the revised professional technical stream
50% implementation of the revised technical career pathing framework
Implementation of the remaining technical job families
Number of intake of interns recruited requiring experience
Programme implementation in accordance with curricula framework
Five interns to be allocated to various environments
Five interns who require experience to obtain qualifications
Five interns who require experience to obtain qualifications
Five interns who require experience to obtain qualifications
Five interns who require experience to obtain qualifications
Providing required HR capacity for strategy execution
Fill 50% vacant management level positions
80% of activated SA Connect positions filled
80% of activated SA Connect positions filled
80% of activated SA Connect positions filled
80% of activated SA Connect positions filled
80% of activated SA Connect positions filled

Corporate Plan for FY2021/22 – 2024/25
P a g e | 54
SHORT TERM
MEDIUM TERM LONG TERM
OUTCOMES OUTPUTS OUTPUT
INDICATORS BASELINE (2019/20)
TARGET 2020/21
TARGET 2021/22
TARGET 2022/23
TARGET 2023/24
TARGET 2024/25
Improved representation of females, PwDs and minority groups
35% Females 65% Males 3% PwDs
Improve representation of females, PwDs and minority groups
Improve representation of females, PwDs and minority groups
Improve representation of females, PwDs and minority groups
Achieve Employment equity targets
Achieve Employment equity targets
Maintained employment costs for optimum benefit
Employee cost efficiency ratio per industry norm
Employment cost at 30% of revenue
Cost efficiency ratio as per industry survey
Cost efficiency ratio as per industry survey
Cost efficiency ratio as per industry survey
Cost efficiency ratio as per industry survey
Payroll spent on training per annum
2.1% of payroll spend on training per annum
1% of the salary bill spend on targeted training and development by end of year
1.5% of the salary bill spend on targeted training and development by end of year
2% of the salary bill spend on targeted training and development by end of year
1% of the salary bill spend on targeted training and development by end of year
1% of the salary bill spend on targeted training and development by end of year
Improved productivity per employee
New Acceptable standard of quality and time frame of outputs per employee/team
Acceptable standard of quality and time frame of outputs per employee/team
Acceptable standard of quality and time frame of outputs per employee/team
Acceptable standard of quality and time frame of outputs per employee/team
Acceptable standard of quality and time frame of outputs per employee/team
Enhanced Leadership Effectiveness
Increased interventions development by leadership
New Conduct a needs analysis and identify the interventions in support of a cohesive and coherent leadership team
Conduct a need analysis and identify the intervention in support of a cohesive and coherent leadership team
Implement leadership interventions
Implement leadership interventions
Conduct a need analysis and identify the intervention in support of a cohesive and coherent leadership team

Corporate Plan for FY2021/22 – 2024/25
P a g e | 55
SHORT TERM
MEDIUM TERM LONG TERM
OUTCOMES OUTPUTS OUTPUT
INDICATORS BASELINE (2019/20)
TARGET 2020/21
TARGET 2021/22
TARGET 2022/23
TARGET 2023/24
TARGET 2024/25
Improved Corporate Governance
% of Strategic Risks
Mitigated
New 70% of Strategic Risks
Mitigated
80% of Strategic Risks
Mitigated
90% of Strategic Risks
Mitigated
95% of Strategic Risks
Mitigated
95% of Strategic Risks
Mitigated
% compliance with key legislations
New 100% compliance with key legislations
100% compliance with key legislations
100% compliance with key legislations
100% compliance with key legislations
100% compliance with key legislations
% of Internal Audit Findings Resolved by Deadline
New 90% of Internal Audit Findings Resolved by Deadline
95% of Internal Audit Findings Resolved by Deadline
95% of Internal Audit Findings Resolved by Deadline
95% of Internal Audit Findings Resolved by Deadline
95% of Internal Audit Findings Resolved by Deadline
Repeat External Audit Findings Reduced
Zero repeat external audit findings
Zero repeat external audit findings
Zero repeat external audit findings
Zero repeat external audit findings
Zero repeat external audit findings
Zero repeat external audit findings
3. An increased base achieved through customer fulfilment and state-of-the-art infrastructure and services
Quality Customer Attraction and Retention
Number of new customers
72 customers Five new customers
Five new customers
Eight new customers
Four new customers
Two new customers
Increased Brand Equity
Percentage increase in customer satisfaction
New 5% year-on-year
change 5% year-on-year
change 5% year-on-year
change 5% year-on-year
change 5% year-on-year
change
Percentage increase in Net Promoter Score
New Improve by 1%
Improve by 1%
Improve by 1%
Improve by 2%
Improve by 2%
Expanded network ensuring
Reduced gross revenue paid as network
0.16% of gross revenue paid as network
≤0.3% of gross revenue paid as network
≤0.3% of gross revenue paid as network
≤0.3% of gross revenue paid as network
≤0.2% of gross revenue paid as network
≤0.2% of gross revenue paid as network

Corporate Plan for FY2021/22 – 2024/25
P a g e | 56
SHORT TERM
MEDIUM TERM LONG TERM
OUTCOMES OUTPUTS OUTPUT
INDICATORS BASELINE (2019/20)
TARGET 2020/21
TARGET 2021/22
TARGET 2022/23
TARGET 2023/24
TARGET 2024/25
robustness and resilience
performance rebates
performance rebates
performance rebates
performance rebates
performance rebates
performance rebates
performance rebates
Actual time to restore core network faults
6.17 hours Actual Time to Restore Core Network Faults
7.5 hours Actual Time to Restore Core Network Faults
7.5 hours Actual Time to Restore Core Network Faults
7.25 hours Actual Time to Restore Core Network Faults
7.0 hours Actual Time to Restore Core Network Faults
6.75 hours Actual Time to Restore Core Network Faults
Increased refurbishment of existing network and infra-structure
30% old network elements
Identify the full scope of old network elements and replace 10%
Replace 20% of existing old infrastructure
Replace 30% of existing old infrastructure
Replace 25% of existing old infrastructure
Replace rest o the 15% of existing old infrastructure and complete the project
Increased expansion and upgrade of IP network
3 X IP PoPs One major PoP and increase redundancy 4 upgraded PoPs with route redundancy
London PoP Upgrade
Nine Provincial Capital PoP Upgrades
15 Regional PoP Upgrades
500G Capacity PoP Upgrades for the Golden Triangle plus Bloemfontein
Increased product innovation through partnerships
A developed fit-for-purpose and innovative products and services with the private-sector and public-sector
New Conduct market demand study to determine sector trends and requirements
Implement relevant solutions
Implement relevant solutions
Implement relevant solutions
Implement relevant solutions
New Engage with government partners to drive delivery of innovative solutions
Roll-out increased offerings to customers
Roll-out increased offerings to customers
Roll-out increased offerings to customers
Roll-out increased offerings to customers
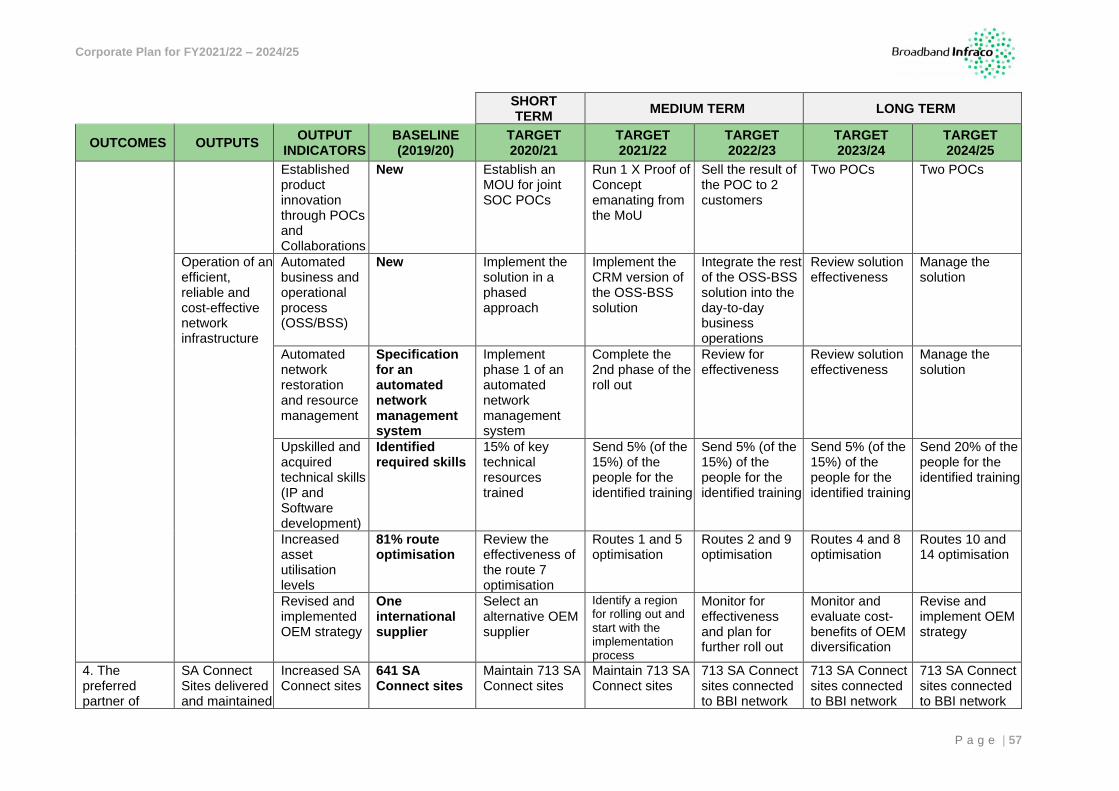
Corporate Plan for FY2021/22 – 2024/25
P a g e | 57
SHORT TERM
MEDIUM TERM LONG TERM
OUTCOMES OUTPUTS OUTPUT
INDICATORS BASELINE (2019/20)
TARGET 2020/21
TARGET 2021/22
TARGET 2022/23
TARGET 2023/24
TARGET 2024/25
Established product innovation through POCs and Collaborations
New Establish an MOU for joint SOC POCs
Run 1 X Proof of Concept emanating from the MoU
Sell the result of the POC to 2 customers
Two POCs Two POCs
Operation of an efficient, reliable and cost-effective network infrastructure
Automated business and operational process (OSS/BSS)
New Implement the solution in a phased approach
Implement the CRM version of the OSS-BSS solution
Integrate the rest of the OSS-BSS solution into the day-to-day business operations
Review solution effectiveness
Manage the solution
Automated network restoration and resource management
Specification for an automated network management system
Implement phase 1 of an automated network management system
Complete the 2nd phase of the roll out
Review for effectiveness
Review solution effectiveness
Manage the solution
Upskilled and acquired technical skills (IP and Software development)
Identified required skills
15% of key technical resources trained
Send 5% (of the 15%) of the people for the identified training
Send 5% (of the 15%) of the people for the identified training
Send 5% (of the 15%) of the people for the identified training
Send 20% of the people for the identified training
Increased asset utilisation levels
81% route optimisation
Review the effectiveness of the route 7 optimisation
Routes 1 and 5 optimisation
Routes 2 and 9 optimisation
Routes 4 and 8 optimisation
Routes 10 and 14 optimisation
Revised and implemented OEM strategy
One international supplier
Select an alternative OEM supplier
Identify a region for rolling out and start with the implementation process
Monitor for effectiveness and plan for further roll out
Monitor and evaluate cost-benefits of OEM diversification
Revise and implement OEM strategy
4. The preferred partner of
SA Connect Sites delivered and maintained
Increased SA Connect sites
641 SA Connect sites
Maintain 713 SA Connect sites
Maintain 713 SA Connect sites
713 SA Connect sites connected to BBI network
713 SA Connect sites connected to BBI network
713 SA Connect sites connected to BBI network

Corporate Plan for FY2021/22 – 2024/25
P a g e | 58
SHORT TERM
MEDIUM TERM LONG TERM
OUTCOMES OUTPUTS OUTPUT
INDICATORS BASELINE (2019/20)
TARGET 2020/21
TARGET 2021/22
TARGET 2022/23
TARGET 2023/24
TARGET 2024/25
Government in enabling the digital transformation
connected to BBI network
connected to BBI network
connected to BBI network
connected to BBI network
Investigate the feasibility of SA Connect sites that can be used for DDM and if feasible connect them
Connect DDM sites that are feasible
Make inputs into Feasibility Study
Implement next phase of SA Connect
Implement next phase of SA Connect
Implement next phase of SA Connect
Implement next phase of SA Connect
Implemented collaborations with other SOEs
Improved innovation collaboration with partners
New Sign secondments and infrastructure sharing agreements
Revise the Stakeholder Engagement Policy
Draft Stakeholder Engagement Framework
Approved Stakeholder Engagement Framework
Implemented Stakeholder Engagement Framework
Signed secondments agreement for HR skills sharing
New Identify and implement critical positions required for secondments for HR skills sharing
Implement critical positions required for secondments for HR skills sharing
Review the secondments agreement for HR skills sharing
Evaluate the success of secondment agreements terms and conditions
Evaluate the success of secondment agreements terms and conditions
5. Facilitated Socio-Economic Transformation
SMMEs supported
Increased allocated installation work for SMMEs
Three SMMEs allocated installation work
Three SMMEs allocated installation work
One SMMEs allocated installation work
Five SMMEs allocated installation work
Five SMMEs allocated installation work
10 SMMEs allocated installation work
Increased targeted procurement
% of total discretionary budget to be spend on B-BBEE
119% of total discretionary budget spend on B-BBEE
70% of total discretionary budget to be spend on B-BBEE
70% of total discretionary budget to be spend on B-BBEE
70% of total discretionary budget to be spend on B-BBEE
70% of total discretionary budget to be spend on B-BBEE
70% of total discretionary budget to be spend on B-BBEE

Corporate Plan for FY2021/22 – 2024/25
P a g e | 59
SHORT TERM
MEDIUM TERM LONG TERM
OUTCOMES OUTPUTS OUTPUT
INDICATORS BASELINE (2019/20)
TARGET 2020/21
TARGET 2021/22
TARGET 2022/23
TARGET 2023/24
TARGET 2024/25
% of total B-BBEE spend to be spend on black owned entities
54% of total spend B-BBEE spend on black owned entities
40% of total B-BBEE spend to be spend on BOE
40% of total B-BBEE spend to be spend on BOE
40% of total B-BBEE spend to be spend on BOE
40% of total B-BBEE spend to be spend on BOE
40% of total B-BBEE spend to be spend on BOE
% of total spend on BOEs to be spend on Black Women Owned entities
43% of total spend on BOEs spend on Black Women Owned entities
10% spend of 40% spend on BWO
10% spend of 40% spend on BWO
10% spend of 40% spend on BWO
10% spend of 40% spend on BWO
10% spend of 40% spend on BWO
Improved B-BBEE Level
Improve B-BBEE Level
Level 8 Level 4 Level 3 Level 2 Level 1
Increased connected schools
Increase number of Schools with broadband Connectivity
One school with broadband Connectivity
One school with broadband Connectivity
One school with broadband Connectivity
One school with broadband Connectivity
One school with broadband Connectivity
One school with broadband Connectivity
Annual Performance Plan
Tabulated below is the Annual Performance Plan for FY2020/21
Table 14: Annual Performance Plan FY20/21
OUTCOME OUTPUTS KPI 2019/20
BASELINE
2020/21
TARGET
Q1
TARGETS
Q2
TARGETS Q3 TARGETS Q4 TARGETS
1. A strengthened
financial position
for growth and
sustainability
New Sales
Contracts
New sales
contracts signed
annually
R116 million R350 million
new sales
contracts
signed
R100 million
new sales
contracts
signed
R100 million
new sales
contracts
signed
R50 million
new sales
contracts
signed
R100 million
sales contracts
signed
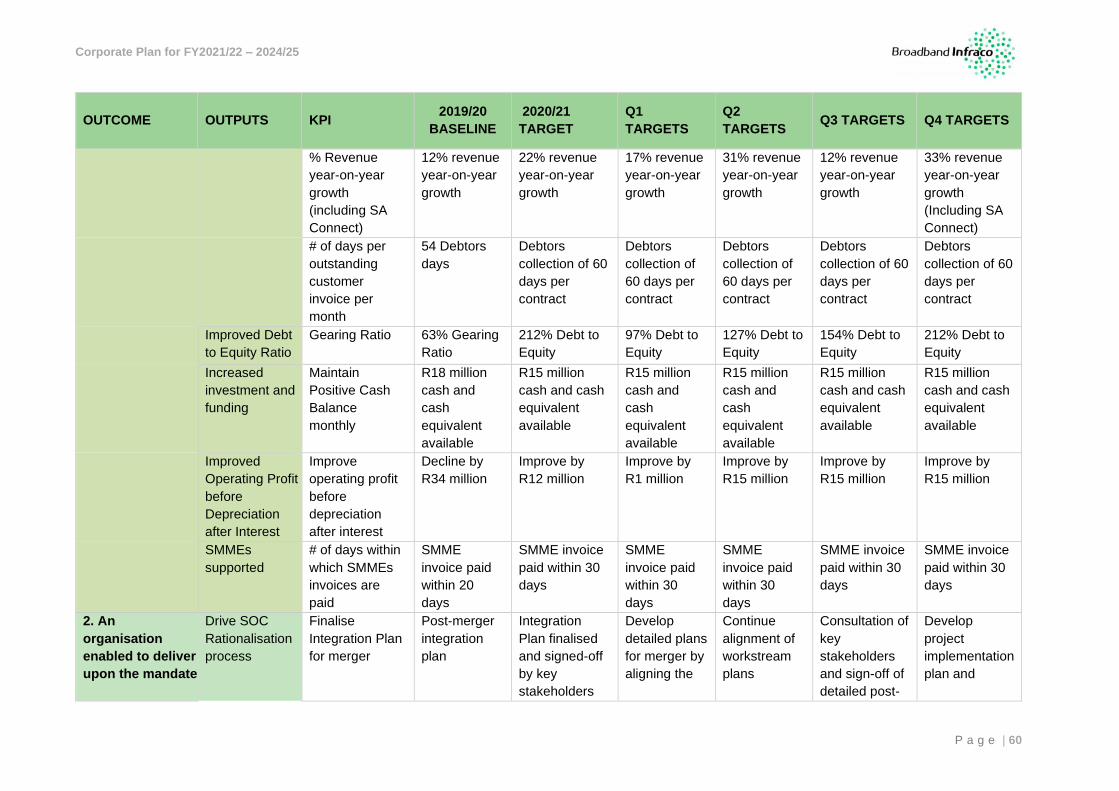
Corporate Plan for FY2021/22 – 2024/25
P a g e | 60
OUTCOME OUTPUTS KPI 2019/20
BASELINE
2020/21
TARGET
Q1
TARGETS
Q2
TARGETS Q3 TARGETS Q4 TARGETS
% Revenue
year-on-year
growth
(including SA
Connect)
12% revenue
year-on-year
growth
22% revenue
year-on-year
growth
17% revenue
year-on-year
growth
31% revenue
year-on-year
growth
12% revenue
year-on-year
growth
33% revenue
year-on-year
growth
(Including SA
Connect)
# of days per
outstanding
customer
invoice per
month
54 Debtors
days
Debtors
collection of 60
days per
contract
Debtors
collection of
60 days per
contract
Debtors
collection of
60 days per
contract
Debtors
collection of 60
days per
contract
Debtors
collection of 60
days per
contract
Improved Debt
to Equity Ratio
Gearing Ratio 63% Gearing
Ratio
212% Debt to
Equity
97% Debt to
Equity
127% Debt to
Equity
154% Debt to
Equity
212% Debt to
Equity
Increased
investment and
funding
Maintain
Positive Cash
Balance
monthly
R18 million
cash and
cash
equivalent
available
R15 million
cash and cash
equivalent
available
R15 million
cash and
cash
equivalent
available
R15 million
cash and
cash
equivalent
available
R15 million
cash and cash
equivalent
available
R15 million
cash and cash
equivalent
available
Improved
Operating Profit
before
Depreciation
after Interest
Improve
operating profit
before
depreciation
after interest
Decline by
R34 million
Improve by
R12 million
Improve by
R1 million
Improve by
R15 million
Improve by
R15 million
Improve by
R15 million
SMMEs
supported
# of days within
which SMMEs
invoices are
paid
SMME
invoice paid
within 20
days
SMME invoice
paid within 30
days
SMME
invoice paid
within 30
days
SMME
invoice paid
within 30
days
SMME invoice
paid within 30
days
SMME invoice
paid within 30
days
2. An
organisation
enabled to deliver
upon the mandate
Drive SOC
Rationalisation
process
Finalise
Integration Plan
for merger
Post-merger
integration
plan
Integration
Plan finalised
and signed-off
by key
stakeholders
Develop
detailed plans
for merger by
aligning the
Continue
alignment of
workstream
plans
Consultation of
key
stakeholders
and sign-off of
detailed post-
Develop
project
implementation
plan and

Corporate Plan for FY2021/22 – 2024/25
P a g e | 61
OUTCOME OUTPUTS KPI 2019/20
BASELINE
2020/21
TARGET
Q1
TARGETS
Q2
TARGETS Q3 TARGETS Q4 TARGETS
workstream
plans
merger
integration
plan
assign
resources
Aligned HR
Capacity
building and
optimisation
% of payroll
spend on
training per
annum
1.55% of the
salary bill
spend on
Targeted
training and
development
by end of
year
1% of the
salary bill
spend on
Targeted
training and
development
by end of year
Compile
Workplace
Skills Plan
and Annual
training report
Training
spent at
0.30% of
payroll
Training spent
at 0.35% of
payroll
Training spent
at 0.35% of
payroll
Improved
Corporate
Governance
# of repeat
external audit
findings reduced
ZERO repeat
external audit
finding
ZERO repeat
external audit
findings
Resolve
external audit
findings
ZERO repeat
external audit
findings
Resolve
external audit
findings
Resolve
external audit
findings
3. An increased
base achieved
through customer
fulfilment and
state-of-the-art
infrastructure and
services
Expanded
network
ensuring
robustness and
resilience
Improve Actual
Time to Restore
Core Network
Faults
8hrs to
Restore Core
Network
Faults
7.5hrs to
Restore Core
Network Faults
7.5hrs to
Restore Core
Network
Faults
7.5hrs to
Restore Core
Network
Faults
7.5hrs to
Restore Core
Network Faults
7.5hrs to
Restore Core
Network Faults
% of gross
revenue paid as
network
performance
rebates
0.16% of
gross
revenue
≤0.3% of gross
revenue
≤0.3% of
quarterly
gross
revenue
≤0.3% of
quarterly
gross
revenue
≤0.3% of
quarterly gross
revenue
≤0.3% of
quarterly gross
revenue
4. The preferred
partner of
Government in
enabling the
digital
transformation
SA Connect
Sites delivered
and maintained
# of SA Connect
Sites connected
to Broadband
Infraco network
641 SA
Connect Sites
connected to
Broadband
Infraco
Network
Maintain 713
SA Connect
Sites
connected to
Broadband
Maintain 713
SA Connect
Sites
connected to
Broadband
Maintain 713
SA Connect
Sites
connected to
Broadband
Maintain 713
SA Connect
Sites
connected to
Broadband
Maintain 713
SA Connect
Sites
connected to
Broadband

Corporate Plan for FY2021/22 – 2024/25
P a g e | 62
OUTCOME OUTPUTS KPI 2019/20
BASELINE
2020/21
TARGET
Q1
TARGETS
Q2
TARGETS Q3 TARGETS Q4 TARGETS
Infraco
Network
Infraco
Network
Infraco
Network
Infraco
Network
Infraco
Network
5. Facilitated
Socio-Economic
Transformation
SMMEs
supported
# of SMMEs
allocated
installation work
Three
SMMEs
allocated
installation
work
Three SMMEs
allocated
installation
work
Identify the
SMMEs
Allocate work
to first SMME
Allocate work
to second
SMME
Allocate work
to third SMME
% of total
discretionary
budget to be
spend on B-
BBEE
119% of total
discretionary
budget spend
on B-BBEE
70% of total
discretionary
budget to be
spend on B-
BBEE
70% of total
discretionary
budget to be
spend on B-
BBEE
70% of total
discretionary
budget to be
spend on B-
BBEE
70% of total
discretionary
budget to be
spend on B-
BBEE
70% allocation
of B-BBEE
budget
discretionary
spend annually
% of total B-
BBEE spend to
be spend on
black owned
entities
54% of total
spend B-
BBEE spend
on black
owned
entities
40% of total B-
BBEE spend to
be spend on
BOE
40% of total
B-BBEE
spend to be
spend on
BOE
40% of total
B-BBEE
spend to be
spend on
BOE
40% of total B-
BBEE spend
to be spend on
BOE
40% increase
on black
owned entities
spend annually
% of total spend
on BOEs to be
spend on Black
Women Owned
entities
43% of total
spend on
BOEs spend
on Black
Women
Owned
entities
10% spend of
40% spend on
BWO
10% spend of
40% spend
on BWO
10% spend of
40% spend
on BWO
10% spend of
40% spend on
BWO
10% spend of
40% spend on
BWO
Improve B-
BBEE Level
Level 8 Level 4 Appoint
service
provider
Conduct audit

Corporate Plan for FY2021/22 – 2024/25
P a g e | 63
OUTCOME OUTPUTS KPI 2019/20
BASELINE
2020/21
TARGET
Q1
TARGETS
Q2
TARGETS Q3 TARGETS Q4 TARGETS
Connected
schools
# of Schools
provided with
broadband
connectivity
One school
adopted in
Eastern Cape
One school
adopted in
DDM area of
OR Tambo
Identify the
province and
the school
Identify
partners to
provide
sponsorship
Acquire and
connect
telematics on
distance
platform
Train teachers
on the use of
telematics and
cybersecurity
for also
learners

Corporate Plan for FY2021/22 – 2024/25
P a g e | 64
7. STRATEGIC PRIORITIES
The strategic priorities for BBI are highlighted below.
Financial and Operational Sustainability
Essential to the delivery of the strategy is focus on financial and operational sustainability. This
entails obtaining access to additional infrastructure as well as investment and funding. These are
pertinent to BBI’s growth strategy which will enable greater offerings to customers (network and
connectivity). It also includes the internal enablement of the organisation through alignment
initiatives such as business model optimisation, operating model review and implementation of
improved processes, systems, structures and governance. This will allow for organisational
optimisation to maximise benefits for customers and stakeholders.
Effective Market Strategies
The implementation of effective market strategies is essential to drive revenue growth. This will
depend on the internal market strategy that segments customer markets based on requirements and
the development of tailored solutions to meet market requirements. The strategy will be an essential
lever to attraction and retention of customers, key to BBI’s customer-centric approach.
BBI has started focus on the six-pillar strategy aimed at accelerated the targeted areas of growth for
the entity:
Figure 19: Six Pillar Marketing Strategy
Retention of major accounts will be instrumental for the entity, especially in the context of the current
market conditions which render acquisition even much more difficult. Acquisition will also be
significantly driven as revenue dilution will be felt as contracts come to end of term.
SADC
Channel
Partner-
ships
Public
Sector
Key
Accounts
Retention
Acquisition
Strategic
Partnership
1
2
3 4
5
6 Top Accounts: by Revenue
contribution Strategic Accounts: Growth
potential and market share
indicators Work in–progress Management New Product Development
Equipment Reseller
Must Win Accounts: Business Development activities
• Named accounts • Secondary accounts
Engage in Strategic Relationships: 1. For joint Go-to-Market 2. For company-product
development 3. For positioning
Growth: Increase reach
through major Channel
Partners
Growth Area: 1. Retention of existing
business through resilience building
2. Strengthening Mining belts: Botswana and Beitbridge
3. Extension of connectivity further North
Leverage SA Connect: Key Departments focus:
1. SITA focus 2. Limpopo
acceleration 3. Eastern Cape
Focus 4. Health
Departments 5. SEZ focus 6. Local Government

Corporate Plan for FY2021/22 – 2024/25
P a g e | 65
Collaboration and Innovation with Other SOEs
Innovation is critical enabler within the telecommunications industry with regards to digital
technologies. BBI seeks to continuously offer innovative and customised solutions through the
leveraging of existing technologies and partnerships with other SOEs.
Stable Network
A stable network is critical for reducing customer churn and maintaining a sustainable business
growth. Broadband Infraco has planned to improve network reliability, performance and route
redundancy. The strategy will be to focus on prioritizing the key weak spots of the network.
Regional Redundancy
Network expansion into the SADC Region requires building network redundancy in order to improve
network reliability and service availability that will strengthen customer relationship and business
growth. Route redundancy and lower latency is critical. For this to happen cost effectively, existing
network infrastructure from other SOCs, should be utilised.
Customer Sales Support
The following activities are main drivers for the successful implementation of the sales strategy:
• Network expansion (reach)
• Network capacity upgrade to cater for higher bandwidth demand, i.e. 100 Gbps and higher.
• Implementation of the packet based services to enable cost effective sales of small capacity.
Network Expansion and Fourth Industrial Revolution (4IR)
The Fourth Industrial Revolution will require huge network capacity in the core network, and fast and
flexible connectivity in the access layer. In preparation for the fourth industrial revolution various
specific projects have been planned in different categories to support 4IR. The broad categories of
these projects are briefly described below, and the details are contained in Annexure H.
Network Capacity Increase
One of the key challenges that will be addressed urgently is the lack of available capacity on the
network. Capacity is required both for redundancy as well as direct customer provisioning. The base
for the capacity upgrade has been set up by the execution of the core transmission network upgrade
(mTera) project in the previous financial year. Further investment for additional capacity upgrade is
required in order to run a resilient network smoothly. A scalable network is required to match the
growing demand for bandwidth. The network capacity increase needs to cater for the expected
introduction of 5G.
IP Transit
Phase 1 of the IP Transit implementation involves building an IP Transit PoP in London. A link from
Yzerfontein (South Africa) to Global Switch in London (United Kingdom) will be commissioned.
Broadband Infraco is a Tier 1 investor in WACS (West African Cable System) and will use its own
capacity to commission this link. Once this is completed, the IP Transit product will be mature enough
to on-sell to third parties.
Agile and Knowledgeable Workforce

Corporate Plan for FY2021/22 – 2024/25
P a g e | 66
The telecommunications industry is fast-changing and ever-evolving which requires continuous
development of people and skillsets to remain agile and knowledgeable. To achieve this, BBI will
implement continuous development initiatives.
Broadband Infraco has technical staff with good experience and expertise in the telecommunications
arena, including transmission technologies, optic fibre splicing and cable jointing, and microwave
radio technologies. Due to the trend in the market of migration to IP products and the network
evolution to IP based technology, it is necessary that our employees are trained and re-skilled in IP
and MPLS technologies. This re-skilling has been in progress for the past financial year and will be
accelerated in 2020/21.

Corporate Plan for FY2021/22 – 2024/25
P a g e | 67
8. STRATEGY EXECUTION
BBI requires a company-ordinated effort in order to implement the Strategy. As strategic projects are
required to be initiated, a programmatic approach must be taken, to drive efforts towards a unified
vision. The CEO will be accountable for delivery of the strategy and will drive delivery through the
co-ordinated Programme Management. Department Heads will deliver on the Projects.
Programmes and Sub-Programmes
Programme 1: Strategy Management
This programme is aimed at driving enterprise effectiveness through developing the strategic
direction, execution of strategy, monitoring and evaluation of the performance, process and quality
management and state-of-the-art information systems. This programme is aligned to the Intellectual
Capital that enables strategic execution in all areas of BBI.
Purpose: This is internally focused and seeks to measure execution of strategy and entrench
the adoption of process management.
This programme executes Outcome 1, a strengthened financial position for growth
and sustainability focused on Output (1.1) additional State-owned fibre infrastructure
accessed and managed. Additionally, it seeks to, execute Outcome 2, an organisation
enabled to deliver upon the mandate with Outputs (2.1) reviewed business model,
(2.2) enhanced process operating model and systems and (2.8) fostered innovative
culture.
The Key Performance Areas of this programme include: Strategy Management and Monitoring,
Quality Management, Process Management and Information and Systems Management.
Objectives:
• Ensure business sustainability;
• Develop and implement corporate strategy and annual performance plans;
• Facilitate development of end-to-end processes;
• Ensure quality management systems continuous improvement;
• Effective information management systems; and,
• Monitor and Evaluate implementation of strategy.
The programme has four sub-programmes as per below.
Sub-Programme 1: Strategy Management and Monitoring
The purpose for this sub-programme is to develop and implement the strategy of BBI. The
implementation of the strategy is cascaded through the Corporate Plan and Divisional Business
Plans.
Sub-Programme 2: Process Development
This sub-programme aims to develop processes by ensuring that critical organisational policies are
embedded in processes and that processes are standardised. It also aims at ensuring that the
organisation adheres to global quality standards.

Corporate Plan for FY2021/22 – 2024/25
P a g e | 68
Sub-Programme 3: Quality Management System (QMS)
The purpose of this sub-programme is to ensure that BBI retains the ISO9001:15 certification that
was attained in 2018. The focus is on closing the gaps that have been identified during the interim
audit, as well as to inculcate a culture of continuous improvement in the workplace in support of
maintaining global operating standards.
Sub-Programme 4: Information and Systems Management
This sub-programme ensures that the platform created supports the organisational IT requirements
in a cost-effective manner. It is responsible for managing the internal corporate enterprise network,
to support the business objectives of BBI whilst ensuring compliance to IT Governance. The
programme aims to ensure automation of manual tasks and integration of management and
business processes into a single, coherent information system. It is measured by the successful
safeguarding of organisation information and assurance of business continuity under any adverse
situations.
Programme 2: Financial Capital
This programme is at the core of the organisation’s financial sustainability. It is concentrated on
ensuring that BBI focuses energy on prioritised opportunities and delivers on the set revenue targets.
It is also focused on ensuring that the pricing strategy is aligned to the business strategy and factors
in it the market pressures.
This programme is also responsible for the reduction of organisational costs within the approved
budget parameters. It will limit unnecessary expenditures enabling BBI to meet its outcomes, outputs
and financial targets.
Purpose: To diversify and grow revenue whilst retaining and increasing the customer base through
cost effective customer solutions and marketed related prices. In addition, this programme
is concerned with the management of all matters associated with the cash flow of the
organisation, both short‐term and long-term, how the organisation uses its resources, and
sourcing of funds to fund its working capital needs.
This programme executes Outcome 1, a strengthened financial position for growth and
sustainability with Outputs (1.2) increased cash position, (1.3) improved debt to equity,
(1.4) improved operating profit before depreciation after interest, (1.5) managed working
capital, (1.6) increased sales within the SADC region, (1.7) increased resellers, and, (1.8)
increased revenue through new sales contracts. Additionally, it will execute on Outcome
3, an increased base achieved through customer fulfilment with Output (3.1) quality
customer attraction and retention.
The programme has two sub-programmes as per below.
Sub-Programme 1: Market and Sell
This sub-programme is directed at developing a structured method of identifying revenue
opportunities. This will enable better network planning, improved prioritisation of projects, and
greater coordination across the fulfilment value chain. To build new relationships with clients and
optimise existing relationships through loyalty/customer retention programmes. In order for the
organisation to be able to sell the product effectively, the market is segmented geographically based
on the type of customer.

Corporate Plan for FY2021/22 – 2024/25
P a g e | 69
Objectives:
• Implement the approved sales strategy;
• Build Key Account Managers’ capacity to sell;
• Grow revenue; and
• Review pricing annually.
Sub-Programme 2: Financial Management
Financial management is concerned with the management of all matters associated with the cash
flow of BBI both in the short‐term and long-term, how the organisation uses its funds and funding of
its working capital and seeking funding from third parties through loans/debt.
This sub-programme is responsible for ensuring long-term business sustainability. It is also
responsible for the reduction of organisational costs within the approved budget parameters. It will
limit unnecessary expenditures enabling BBI to meet its outcomes, outputs and financial targets.
This sub-programme is further directed at developing a structured method of identifying revenue
opportunities. This will enable better network planning, improved prioritisation of projects, and
improved asset management and position BBI to access funding and meet return on investment
requirements.
The objective of Financial Management is to drive Financial Sustainability of BBI. The objectives
embedded in this is:
• Maintain operation cost increases to below inflation;
• Actively manage the current ration levels to acceptable ratio;
• Maintain debtors’ days within acceptable levels; and
• Improve overall profitability of the organisation.
Programme 3: Network Infrastructure
This programme ensures the delivery of Government mandate and customer requirements. This
includes the deployment of wholesale communication services including in underserviced areas. The
services delivered must be sustainable and allow for economic activity in the areas where those
services are consumed. This provides an opportunity for collaboration with other SOCs. In addition,
as part of its core planning, BBI will ensure that existing infrastructure, including that from other
entities, are fully taken into consideration to minimise infrastructure duplication. For the customers
running on the network, it is crucial that all SLAs are adhered to, so that prospects of additional
business increases.
Purpose: To ensure that key Government projects such as SA Connect and all network
refurbishments as well as customer requirements are fulfilled cost effectively, and
timeously. Projects are identified from the Masterplan and socialised with various
departments to ensure that the correct priority is recorded to the critical requirements.
This programme executes Outcome 1, a strengthened financial position for growth and
sustainability with Outputs (1.9) deployed demand and sourcing strategy, (1.10) improved
turnaround time between sales and revenue earned and (1.11) optimised costs.
Additionally, it will execute on Outcome 3, an increased base achieved through customer

Corporate Plan for FY2021/22 – 2024/25
P a g e | 70
fulfilment and state-of-the-art infrastructure and services with Outputs (3.3) expanded
network ensuring robustness and resilience, (3.4) increased product innovation through
partnerships, and (3.5) operation of an efficient, reliable and cost-effective network
infrastructure. It will also execute on Outcome 4, the preferred partner of Government in
enabling the digital transformation with focus on Output (4.2.) timeous delivery of SA
Connect sites.
Objectives:
• Planning and designing of the transmission network, the OTN, DWDM SDH and the IP/
Multiprotocol Label Switching (MPLS) network;
• Ensure integration and interoperability of the various architectures and network
elements of the network;
• Research and evaluate new network technologies and make recommendations on their
viability;
• Develop high-level design plan for the overall convergence of the logical and technical
network architecture of the transmission and IP network;
• Design and implement cost effective customer specific solutions for our clients;
• Identify new products and services for the organisation and initiate the product/service
development; and,
• WACS (Development, Operations, Restorations, Procurement and Maintenance).
The programme has five sub-programmes as per below.
Sub-Programme 1: Product Management
This sub-programme ensures that the network organically migrates to an IP network to allow for sub-
STM1 connections and optimal routing capability. The roll out of an IP network outside the current
Golden Triangle will be driven by customer demand and sustainable business cases. The products
include Maintenance Offerings, NOC as a service and a host of IP services.
This sub-programme focuses on the Product Portfolio management including product development.
Objectives:
• Effectively manage products.
Sub-Programme 2: Network Planning
This sub-programme focuses on network infrastructure planning and proactive management of the
network.
Sub-Programme 3: Supply Chain Management
The purpose of this sub-programme is to ensure that best practice Supply Chain Management
principles are embedded in the organisation using long-term demand planning, supplier
management and expedient procurement processes. It is responsible for ensuring that organisation-
wide needs/demands are properly coordinated and structured in a forecasted procurement plan.
This measure will significantly increase efficiency in the turn-around-time (TAT) of procurement
transaction, by establishing framework agreements.
Corporate Plan for FY2021/22 – 2024/25
P a g e | 71
The objective of Supply Chain Management is to drive Socio-Economic Transformation. The
objectives embedded in this is:
• Develop an effective and efficient Demand Planning Model;
• Implement Strategic Sourcing for core commodities and services;
• Reduce Total Cost of Ownership (TCO);
• Ensure compliance to all Regulatory Requirements;
• Manage BEE expenditure;
• Develop and implement an effective Enterprise and Supplier Development Strategy;
• Reduce annual costs;
• Formulate Strategic Alliances;
• Implement an effective Vendor management strategy and manage supplier
performance;
• Provide appropriate training to ensure that adequate skills and experience are
maintained within the Department; and,
• Develop an extensive supplier database.
Sub-Programme 4: Network Build
The network will organically migrate to an IP network to allow for sub-STM1 connections and optimal
routing capability by running the M-Tera project. The programme also ensures that the projects are
planned and executed successfully within budget and planned timelines. The roll out of an IP network
outside the current Golden Triangle will be driven by customer demand and sustainable business
cases. The network plans will include the increase of core network capacity to service increasing
customer demands.
This sub-programme deals with the network build and the various projects linked to network
expansion, customer projects and fortification of the network.
Sub-Programme 5: Operate and Maintain Network
This sub-programme’s purpose is to track the effectiveness of the network maintenance regime and
team responsiveness to network failures:
• Conduct preventative maintenance routines;
• 24-hour call-out for maintenance and faults restoration (Remedial actions);
• Execute planned maintenance programme to eradicate network defects and temporary
repairs; and
• Service provisioning (hardware), fulfilment and assurance (testing and evaluation).
Programme 4: Stakeholder Management
Stakeholder Management focuses on continuous engagement with key stakeholders to ensure an
integrated strategy execution in pursuit of operational excellence and good citizenship.
Purpose: The purpose of the programme is to create positive relationships with stakeholders,
through appropriate management of their expectations and agreed objectives.
This programme will execute Outcome 3, an increased base achieved through customer
fulfilment and state-of-the-art infrastructure and services through Output (3.2) increased
brand equity. Additionally, it will Outcome 4, the preferred partner of Government in
enabling the digital transformation through Output (4.1.) implemented collaborations with

Corporate Plan for FY2021/22 – 2024/25
P a g e | 72
other SOEs. It will also facilitate Outcome 5, facilitate socio-economic transformation
through Outputs (5.1) SMMEs supported and (5.2.) connected schools.
Objectives:
• Stakeholder relationship management;
• Increase Branding Equity;
• Unlocking SMME Opportunities;
• Effective communication; and
• Responsive corporate citizen.
The programme has six sub-programmes as per below.
Sub-Programme 1: Shareholder and Parliamentary Engagement
BBI attends Parliamentary Portfolio Committee meetings on its own or in support of the DTPS on a
regular basis. It does so to report on the organisation’s Performance and Annual Performance Plan
and to support a briefing by Department and entities of its Quarterly Reports and reports rollout. It
also attends Portfolio Committee (PC) meetings as and when requested and facilities oversight
meetings from the PC to its sites.
Sub-Programme 2: Brand and Events Management
To promote BBI’s products and services to key customers with the intention of creating a recognised
brand and increasing revenues. The sub-programme also focuses on building a strong brand
internally and externally by developing initiatives that enhance the reputation of the brand while
ensuring consistent application of the corporate identity.
Sub-Programme 3: Employee Relations Management
The sub-programme is aimed at ensuring mutually beneficial and constructive relations between the
employer and the employees through ongoing engagements and through their representative
structures. It is about proactive approaches to create an environment where trust level is high, there
is adequate transparency, consistency and fairness in dealing with matters of mutual interest
between the employer and employee(s).
It also seeks to drive alignment of people management practices to labour legislation framework by
facilitating social transformation initiatives that are intended to eradicate the injustices of the past,
e.g., the Basic Conditions of Employment Act on fairness and equitable practices, Employment
Equity Act on creating employment opportunities with the intention to increase the number of women
at leadership levels in organisations and persons with disabilities across the board.
Sub-Programme 4: Enterprise Development
The purpose of the sub-programme is to ensure that best practice Supply Chain Management
principles are embedded in the organisation using long term demand planning, supplier
management and expedient procurement processes. This sub-programme will focus on ensuring
that BBI conducts business in line with Government empowerment goals, ensuring that business
increases their procurement from historically disadvantage individuals (HDI).
This programme executes Outcome 5, socio-economic transformation through output (5.1) SMMEs
supported.

Corporate Plan for FY2021/22 – 2024/25
P a g e | 73
Sub-Programme 5: Corporate Communication
The purpose of this sub-programme is to ensure regular communication to external shareholders as
well as internally, to employees.
It further focuses on establishing and maintaining a favourable reputation with stakeholder groups
with whom BBI has dependable relationships.
The sub-programme seeks to actively:
• Improve its corporate profile as an ICT sector leader;
• Position BBI as the leading and reputable agency on backhaul fibre connectivity;
• Promote the leadership of BBI as industry 'thought-leaders' and commentators; and,
• Create communications channels and platforms to engage stakeholders (internal and
external), decision makers and opinion-formers.
Two-way communication between BBI and all its stakeholders is imperative to influence the
framework of communication to achieve BBI’s business objectives.
Sub-Programme 6: Corporate Social Responsibility
This sub-programme seeks to plough back in the communities where there are BBI PoPs in the
vicinity of schools that have no connectivity to broadband, which in the main are in marginalised and
underserviced areas. The aim is to expand broadband connectivity in an effort to elevate
disadvantaged schools to the technological level of their more privileged counterparts in urban areas,
thus bridging the digital divide and contributing to the improvement of education outcomes through
ICT.
Corporate Social Investment (CSI) encompasses projects that are external to the normal business
mandate and activities of a company and not directly for purposes of increasing company profit.
These projects have a strong developmental approach and utilise company resources to benefit and
uplift communities within which the company operates and are not primarily driven as marketing
initiatives.
Programme 5: Human Capital
The programme is fulfilled through integrated human resources management strategies. The main
objective of the HR function is to ensure that the efforts of the people deployed in various roles at
different levels of responsibility ultimately converge towards the achievement of a common purpose.
In this way, BBI will achieve its legislated mandate and periodical strategic business objectives that
it has set itself to make a meaningful contribution to the success of the organisation.
Purpose: This programme is focused on creating human resources capacity and capability for the
effective execution of the organisational strategy and ensuring optimisation thereof. To
create an environment of good human resource management principles practices for
overall performance and sustainability.
This programme executes Outcome 2, an organisation enabled to deliver upon the
mandate through Outputs (2.3) aligned company structure, (2.4) optimum people

Corporate Plan for FY2021/22 – 2024/25
P a g e | 74
competence and performance, (2.5) competitive reward and remuneration practices, and
(2.7) enhanced leadership effectiveness.
Objectives:
• Review organisational structure;
• Maintain labour cost for optimum benefit;
• Create opportunities for youth to gain work experience and requisite skills;
• Maintain the ability to compete for scarce skills on the market;
• Enhance employee reward and recognition programmes;
• Enhance employee competencies and knowledge;
• Development of career management and tools for execution;
• Developed pool of talent ready to take up new opportunities for effective business
continuity;
• Integrated Performance management framework;
• Ensure compliance to safety and health standards; and,
• Improve safe working environment for the employees.
The Human Resource Management Strategy is premised on a global model:
• Unlocking employee performance with focus on the enterprise development;
• Leadership effectiveness through empowerment of teams and collaborations; and,
• Continuous review of the HR function to deliver services that are aligned to organisational
needs and foresights.
Human Resources Operational Efficiency and Effectiveness Enhancement
The HR division reviews its short- to medium-term strategies on an annual basis, to ensure that the
governance framework (policies, procedures) and management practices are aligned to labour
legislation, industry employment cost efficiency measures and human resources optimisation
strategies.
The programme has five sub-programmes as per below.
Sub-Programme 1: Organisational Capacity Building
The sub-programme is dedicated towards the design and continuous review of the required
functional organisational structure that is aligned to the corporate plans and strategic business
objectives. It is about ensuring the adequate capacity and appropriate capability is available for the
organisation to execute its plans cost effectively and efficiently.
Sub-Programme 2: Talent Attraction and Retention
HR enables the organisation to acquire people who possess the knowledge and skills it requires by
being a preferred employer and competing for best talent on the market. Labour legislation aligned
people management practices, competent leadership, integrated strategies for employee
development, support, recognition and rigorous employee engagement create an employment
environment of commitment, loyalty and high-performance levels at both individual and team levels.
However, initiatives can be limited in this regard by BBI’s financial constraints.

Corporate Plan for FY2021/22 – 2024/25
P a g e | 75
Sub-Programme 3: Human Resources Development
Through the sub-programme, HR plays a pivotal role in determining requisite job competencies for
successful appointments to jobs, assessment of competency levels and skills gaps, as well as the
identification of appropriate interventions for desired improvements. The responsible unit produces
annual training plans and ensures execution. It oversees the application of acquired skills, sharing
of skills and knowledge. Collaboration with the MICT SETA is crucial for contributing towards the
national socio-economic imperatives through skills development programmes.
Sub-Programme 4: Employee Performance Management
The crux of the sub-programme is the monitoring of individual and team outputs in line with BBI’s
goals and targeted key deliverables. HR must ensure that all the pillars of performance enhancement
are intact and aligned to the business mission; among others, clarity of roles and responsibilities,
empowered line management, availability of resources enabling set performance standards and a
conducive employee relations environment.
Sub-Programme 5: Safety and Health
This sub-programme will focus on the health and well-being of the employees. The implementation
and maintenance of a holistic Safety and Health is key to running a sustainable business and is at
the core of an infrastructure-based organisation like BBI. This function is performed in consultation
with internal and external stakeholders. The purpose of the SHEQ environment is to ensure
compliance and conformance to the Occupational Health and Safety Act 85 of 1993, and the
conformance to the OSHAS18001:2011 standard as well as local and provincial regulations. In the
end, this will assist in reducing costs, attracting more customers and maintaining a safe working
environment. The key measurement used to track the success of this sub-programme is the Lost
Time Injury Frequency Rate.
Programme 6: Governance
This programme ensures that there is establishment of governance structures and policies, and
continuous monitoring of their oversight and compliance by the Board of Directors and management
alike. The programme encamps effective and ethical leadership within the prescripts of good
governance. It includes the mechanisms required to balance the powers of the members (with the
associated accountability), and their primary duty of enhancing the prosperity and viability of BBI.
Proper governance comprises of the rules, norms and actions are structured, sustained, regulated
and held accountable.
Purpose: This programme is focused on ensuring that the governance assurance management
services are provided efficiently and effectively to improve compliance, internal controls,
and ensure that risk mitigation interventions are implemented.
This programme executes Outcome 2, an organisation enabled to deliver upon the
mandate through Outputs (2.6) improved corporate governance.
Objectives:
• Effective management of the Board, EXCO and Sub-Committees;
• Review the business processes to provide independent assurance;
• Improve internal controls;
• Assess and monitor the level of compliance with all applicable legislation, regulations and

Corporate Plan for FY2021/22 – 2024/25
P a g e | 76
internal policies; and
• Ensure holistic approach to implementation of risk management across the organisation.
The programme has five sub-programmes as per below.
Sub-Programme 1: Company Secretariat
This sub-programme ensures that all Board, EXCO and Sub-Committees meetings are organised,
and minutes are recorded and kept efficiently and effectively. This sub-programme’s objective is to
provide efficient administration of the organisation; particularly about ensuring compliance with
statutory and regulatory requirements and that decisions of the Board of Directors and EXCO are
recorded and implemented.
Sub-Programme 2: Legal and Regulatory
This sub-programme ensures that BBI concludes commercial transactions on terms and conditions
favourable to its business, and complies with its licence terms and conditions, and applicable
legislation when conducting its business operations, to ensure that BBI always operates within the
applicable laws. It also ensures that legal agreements entered by BBI provide the necessary
prescripts to protect the organisation’s asset base, finances and other resources.
The objective of Legal and Regulatory is to support overall compliance of BBI. The objectives
embedded in this is:
• Influence ICT Policy and Regulation;
• Influence the changes to the ECA Amendment Act;
• Ensure that the financial outcomes of the Digital Development Fund Act (DDF) is not
detrimental to the organisation;
• Source and secure an operating licence;
• Ensure compliance to the ECNS Licence Compliance Programme;
• Support SA Connect from a legal and regulatory point; and,
• Deal with litigation matters.
Sub-Programme 3: Compliance
The purpose of compliance is to ensuring compliance with applicable legislation, policies, codes and
standards to prevent financial loss, reputational damage and eroding the goodwill of an organisation.
Sub-Programme 4: Enterprise Risk Management
The purpose of this sub-programme is to manage strategic and operational risks, insurance of assets
including employees to ensure business continuity. This sub-programme is also responsible for fraud
management. A tip-offs anonymous hotline, which is managed by an independent service provider,
has been implemented. The monthly hotline reports are monitored, and investigation will be
conducted on reported cases.
The development of the Strategic Risk Register for 2020/21 is the culmination of an extensive
exercise by EXCO, Board of Directors and Shareholders to re-assess all current and new risks
identified. Most of the risks compared to the previous year have not changed. The risk mitigation
and action plans agreed with the Executives will be monitored quarterly and be reported to EXCO
and Board for approval.

Corporate Plan for FY2021/22 – 2024/25
P a g e | 77
Sub-Programme 5: Internal Audit
The purpose of Internal Audit is to provide assurance by assessing the adequacy of internal controls
and compliance through checking the processes and recommending improvements of the internal
control, risk management and compliance with policies and procedures.
Furthermore, the aligned performance management framework and system to be implemented
ensures a co-ordinated approach, with appropriate incentive mechanisms and the ability to track,
manage and report on the organisational strategy.
In this regard project delivery is central to the realisation of financial, operational and organisational
objectives the organisation has set. Due to resource constraints, a defined project prioritisation
framework, with a capable and competent team, needs to be implemented in order to prioritise
projects based on their financial return and the risk appetite of the organisation. As a minimum, all
projects initiated should undergo the same selection criteria, to ensure uniformity in selection while
removing individual bias.
Finally, several resource considerations should be made to ensure there is adequate capacity to
implement the strategy. These considerations include but are not limited to:
• Financial considerations;
• Human resource considerations; and
• Processes and systems considerations.
Financially, strengthening the balance sheet through debt/equity swap is a necessity in order to
facilitate unlocking additional capital for infrastructure and other investments. Due to the nature of
the agreements with infrastructure owners, structural limitations of the balance sheet have prevented
debt funding thereby inhibiting BBI’s ability to compete.
From a human resource perspective, mechanisms are required to ensure the highly-skilled
resources currently employed continue to deliver, while maintaining a suitable pipeline. This,
together with process enhancements are central to the organisations viability and is elevated through
the organisational enablement focus within the strategy itself.

Corporate Plan for FY2021/22 – 2024/25
P a g e | 78
9. FINANCIAL PLAN
Income Statement
These are the following major assumptions made in formulating the forecast for revenue, cost of
sales, operating and capital expenditure.
The table below show the assumptions made related to the income statement.
Table 15: Income Statement Assumptions
Year ended Mar-20 Mar-21 Mar-22 Mar-23 Mar-24 Mar-25
Amounts in R ‘000 Projection Budget Budget Budget Budget Budget
Revenue R454 189 R556 000 R611 528 R669 229 R737 385 R818 034
Cost of Sales R395 015 R429 333 R429 476 R430 004 R463 269 R518 592
Gross Profit R59 174 R126 667 R182 052 R239 225 R274 117 R299 442
OPEX R248 224 R217 887 R232 162 R234 998 R262 619 R276 631
EBIT (R27 180) R88 537 R114 789 R139 201 R146 960 R158 117
Profit/Loss (R193 915) (R116 770) (R99 430) (R53 113) (R25 344) (R9 241)
Assumptions of the forecast for revenue, cost of sales and operating expenditure:
• Revenue is based on signed contracts (including the new contracts signed-up in 2019/20)
and SA Connect. Contracts that will be expiring during 2020/21 are included in revenue,
based on specific probabilities of respective client relationships, at prevailing market pricing
for similar services. High probability pipeline revenue is included at assumed probability
percentages.
• Cost of Sales is based on actual contracted costs and new contracted costs for Eskom and
TFR. The Eskom lease costs is expected to increase by more than 151% to mitigate ADLash
risk and to extend the core network. Specific contracted reductions and inflationary increases
include a year on year reduction of 0.8% (excluding SA Connect) and 6.4% (including SA
Connect).
• Operating Expenditure: average inflation projected at 6.5% and specific inflation is factored
in for IT costs and building rentals. Also, a renewed focus on training budgeted at 1% of total
salaries cost. Overall operating expenditure reduces by 12% year-on-year. This reduction is
driven by further cost optimisations and specific reductions of targeted costs.
Balance Sheet
The table below show the assumptions made related to the balance sheet statement.
Table 16: Balance Sheet Assumptions
Year ended 31-Mar-20 31-Mar-21 31-Mar-22 31-Mar-23 31-Mar-24 31-Mar-25
Amounts in R ‘000
Projection Budget Budget Budget Budget Budget
Total Non-Current Assets
R1 073 903 R1 375 913 R1 244 992 R1 127 482 R1 124 581 R1 122 570
Total Current Assets
R97 930 R108 884 R146 683 R212 939 R281 856 R354 176

Corporate Plan for FY2021/22 – 2024/25
P a g e | 79
Year ended 31-Mar-20 31-Mar-21 31-Mar-22 31-Mar-23 31-Mar-24 31-Mar-25
Amounts in R ‘000
Projection Budget Budget Budget Budget Budget
Total Assets R1 171 833 R1 484 797 R1 391 676 R1 340 421 R1 406 437 R1 476 745
Non-Current Liabilities
R400 105 R779 939 R784 145 R753 765 R713 666 R923 832
Current Liabilities
R339 878 R389 779 R391 880 R424 118 R455 578 R424 961
Total Liabilities
R739 983 R1 169 717 R1 176 025 R1 177 884 R1 269 244 R1 348 793
Equity attributable to owners of the parent
R431 850 R315 080 R215 651 R162 537 R137 194 R127 953
Total Equity and Liabilities
R1 171 833 R1 484 797 R1 391 676 R1 340 421 R1 406 437 R1 476 745
The key changes to the statement of financial position is demonstrated above.
It is assumed that the Shareholders’ Loans would have been converted into equity by the start of the
Corporate Plan period.
Concluding the Capex spend during the 2020/21, further described below, will bring the Net Book
Value of Assets of the Company to R1.4 billion.
Trade debtors are maintained at around R100 million, and collections are budgeted at an average
of 60 days.
The deferred income liability is budgeted at R501 million at year end.
Financial Ratios
The table below depicts performance and liquidity ratios for the forecasted period
Table 17: Profit and Liquidity Ratios
Year end Mar-20 Mar-21 Mar-22 Mar-23 Mar-24 Mar-25
EBITDA/Revenue -4.3% 15.9% 18.8% 20.8% 19.9% 19.3%
Operating Profit -35% -29% -2% 5% 10% 14%
Current Ratio 36% 34% 44% 58% 70% 94%
Gearing Ratio 63% 212% 293% 363% 461% 515%
The current ratio is highly variable over the years; however, it increases steadily from 2022 year-
end. By the year 2024/25 the current ratio will have liquid assets to cover any short-term liabilities,
as the figures before that are less than one implying that there are insufficient current assets to pay
off current liabilities. Additionally, the operating profit to revenue and EBITDA to revenue also
improves steadily over the 4-year period to 2023/24.
Cash Flow Statement
The table below demonstrates the key line items of the cash flow statement.

Corporate Plan for FY2021/22 – 2024/25
P a g e | 80
Table 18 Cash Flow Statement
Year ended 31-Mar-20 31-Mar-21 31-Mar-22 31-Mar-23 31-Mar-24 31-Mar-25
Amount in R '000 Forecast Budget Budget Budget Budget Budget
Cash Generated from
Operations R32 625 R97 578 R139 473 R180 989 R201 471 R218 358
Cash Flows from
Investing Activities (R79 974) (R481 956) (R34 119) (R31 956) (R132 601) (R133 278)
Cash Flows from
Financing Activities (R17 387) R404 688 (R52 752) (R50 385) R24 295 R6 322
Net
Increase/Decrease in
Cash
(R70 267) (R6 190) R2 284 R54 661 R55 224 R58 195
Cash Equivalents at
beginning of year R95 139 R24 872 R18 682 R20 967 R75 628 R130 852
Cash Equivalents at
end of year R24 872 R18 682 R20 967 R75 628 R130 852 R189 047
It is budgeted that Broadband Infraco will generate a positive cash flow from operations for the fourth
year in a row during 2020/21. Management continues to drive sales and optimise costs and thus
ensuring a positive cash flow outlook and the Company’s financial sustainability.
Dividend Policy
BBI does not have a Dividend Policy and all cash resources generated by the operations are utilised
to maintain and invest in the network infrastructure.
Capital Expenditure and Investments
The capital expenditure and investment allocations from Own Funding, Debt Funding, Vendor
Financing, Project Finance and Medium-Term Debt Funding have been made for various projects
which have specific strategic outcomes.
These outcomes are as follows:
• Protection of Revenue
• Generation of Revenue
• Essential Upgrades and Refurbishments
• Operational CAPEX (Non-Infrastructure)
The total capital expenditure is budgeted at R482 million for the 2020/21 financial year and covers
all the priority 1 projects included in the Capital Plan (Annexure H attached herewith). The capital
expenditure is classified per the table below:
Table 19 CAPEX Classification
Amount in R'000 2020/21 2021/22 2022/23 2023/24 2024/25 Total
Non-infrastructure R52 254 R630 R662 R0 R0 R53 546
Service Engineering
Cards R7 500 R7 875 R8 269 R8 682 R9 116 R41 442
Infrastructure R415 950 R19 050 R19 050 R19 050 R19 050 R692 150
Salaries Capitalised R6 252 R6 564 R3 975 R4 174 R4 383 R25 348

Corporate Plan for FY2021/22 – 2024/25
P a g e | 81
Amount in R'000 2020/21 2021/22 2022/23 2023/24 2024/25 Total
Total R481 956 R34 119 R31 956 R131 906 R132 549 R812 486
From the above table it can be observed that the total CAPEX per year is the same for the
combination of projects related to the various classifications.
Table 20 CAPEX Classification
Amount in R'000 2019/20 2020/21 2021/22 Total
Protection of Revenue R13 100 R0 R0 R13 100
Generation of Revenue R255 729 R0 R0 R255 729
Essential upgrades and
refurbishments R152 421 R16 050 R16 050 R184 521
Operational Capex R54 454 R11 505 R11 930 R77 889
Total R475 704 R27 555 R27 980 R531 239
Generation of revenue projects will be most important (54%) in delivering services to customers and
network capacity upgrade. Essential upgrades and refurbishments (32%) will ensure better network
autonomy and management and includes IP network upgrade. Approximately 3% of total Capex
budget is required to protect revenue by relocating data centres and replacement of certain poor
performing links. Operating capex (11%) is required to ensure continues monitoring of the network
and the required maintenance tools.
Valuation Analysis
Ownership of these shares are as follows:
• 74 Ordinary shares are held by the State as represented by the Department of
Communications and Digital Technologies.
• The remaining 26 shares are held by the Industrial Development Corporation of South Africa.
Table 21 Valuation of BBI Assets
Assets
31-Mar-20 31-Mar-21 31-Mar-22 31-Mar-23 31-Mar-24 31-Mar-25
Forecast Budget Budget Budget Budget Budget
Total Assets R1 171 833 R1 484 797 R1 391 676 R1 340 421 R1 406 437 R1 476 745
Net Assets R431 850 R315 080 R215 651 R162 537 R137 194 R127 953
YoY Net Assets growth rate -27.0% -31.6% -24.6% -15.6% -6.7%
Total assets are on a decline with an increase in debt-to-equity over the budgeted period causing
the net assets to decline. Net assets are measured on the 100 ordinary shares outstanding at par
(2015: R1).
Three-Year Borrowing Programme
Broadband Infraco continues to follow a funding strategy that is designed to cater for a transitioning
business model that will enable sustainability. The Company’s business model has transitioned from
a single customer to one based on multiple customers, ranging from the private to the public sector.
The Company’s planned capital investment programme is supportive of long-term financial
sustainability, with four key priorities:
• Revenue protection projects;

Corporate Plan for FY2021/22 – 2024/25
P a g e | 82
• Revenue generating projects;
• Mandate and license obligations projects; and
• Essential asset upgrades and refurbishment projects.
The funding strategy remains focused on sourcing funding from various financial institutions,
selective Vendor Financing alternatives and other providers of medium-term debt financing. The
financial institutions are targeted as a source of short-term cash and liquidity provisioning facilities
and to support the Company with long-term debt capital. The medium-term funders will also be
expected to support the Company with long-term debt capital whereas Vendors will be sought to
support medium- and long-term balancing of operational costs with revenue through the financing of
technology enhancements.
The total funding required is based on the projected capital spend above. Based on this planned
capital spend, total funding to the value of R462 million is planned to be raised during 2020/21.
These funds will be used as and when required on a draw down basis to optimally manage the cash
resources of the Company.
The funding to be raised can be categorised per the table below:
Table 22 Funding Funding Mixture
Project Finance
Debt Funding
Vendor Finance
Own Funding
Asset Funding
Total
Amount R74 775 R265 829 R101 646 R13 454 R20 000 R475 704
Project Finance will be utilised to fund specific capacity upgrades and secondary routes to SADC
countries. Asset Finance will be utilised to finance moveable assets and debt funding to supplement
funding generated from operations, required for customer and refurbishment projects and includes
capacity upgrades. Vendor Financing will be utilised to fund the IP upgrade.
In determining the funding strategy for the corporate planning period, the Company considered
several funding mechanisms and sources, ultimately deciding on the following five options to support
primarily the capital investment programme. These options are in line with the funding plan and
options considered during the previous planning periods:
Development Finance Institutions
The Company continues to engage DFIs actively to secure medium term funding. During the
2018/19 and 2019/20 financial year the Company did secure funding from a DFI for a specific
project and is currently working through the governance processes and conditions precedent
contained in the term sheet to access the funding to ensure timeous capital rollout.
Project-based structured financing
Previously Broadband Infraco was not able to secure funding for client generated projects
due to the lack of a track record and the weak balance sheet. The Company is now able to
demonstrate that they can win, plan and execute major projects successfully and profitably.
This coupled with the eminent conversion of the shareholders’ loans into equity the Company
is positive that they will be able to secure funding off the back of these case studies for future,
customer specific requested projects where revenue will improve.

Corporate Plan for FY2021/22 – 2024/25
P a g e | 83
Financial Institutions facilities
The Company has demonstrated its ability to manage cash optimally over the past three
years. This was achieved through proactively and continuously applying cost optimisation
strategies, engaging with suppliers to extend payment terms and appealing to customers to
pay the Company as quickly as possible. This will have a positive effect on future
engagements with financial institutions.
Vendor financing
Many of the strategic suppliers of equipment to Broadband Infraco have indicated that they
will be willing to consider longer term financing of technology and client enhancements, over
the useful life of the equipment. Access to this funding will also be forth coming once the
conversion of the shareholders’ loans have been concluded.
Asset financing
Broadband Infraco envisage engaging financiers to fund motor vehicles required for
operations and maintenance. This mechanism of funding will be explored further during the
next financial year.
These options sought to secure funding for the Company either directly onto the Company’s balance
sheet or on an “off balance sheet” basis.
Industry norms relating to participation of public entities within the financial market space requires
that Broadband Infraco take into consideration the following:
a. Adherence to National Treasury Regulations relating to management of
borrowings undertaken by SOC’s;
b. Application approval by Executive Authority to increase borrowing powers of
Broadband Infraco in terms of significant and materiality framework (refer to
Annexure I) and Section 66 of the PFMA; and
c. There will also be a need to strengthen the balance sheet of the Company through
a structured recapitalisation initiative, which will further enable the Company to
deliver on its mandate.
Depending on the type of instruments to be sourced, there might be a need to look at the processes
and systems within the company to ensure proper liability management and adherence to applicable
risk management practices.