Embed Size (px)
Citation preview


Baywide and Coordinated
Chesapeake Fish Stock Monitoring
CRC-NCBO Workshop
7 – 9 March 2006
The Chesapeake Research Consortium
Edgewater, Maryland
and
The National Oceanic and Atmospheric Administration
Chesapeake Bay Office
Annapolis, Maryland

2
The Chesapeake Research Consortium (CRC) and NOAA’s Chesapeake Bay Office (NCBO) co-hosted a baywide workshop of scientists and managers from academic, federal, and state agencies in early March 2006. The workshop’s focus was discussion of a potential baywide, integrated, fish stock monitoring program that facilitates cross-bay fisheries management. The opening remarks by J. Travelstead, Virginia Marine Resources Commission (VMRC), outlined fisheries management needs for the three tidal fisheries management organizations — the VMRC, the Potomac River Fisheries Commission (PRFC), and Maryland’s Department of Natural Resources (MD DNR). Following presentations highlighted other successful fish monitoring programs in Canada and the Eastern U.S. These presentations served as the foundation for workshop participant discussions on linking management needs with monitoring possibilities for the tidal waters of the Chesapeake Bay and its tributaries. The discussions by participants, along with a compilation and consensus on future steps in developing a baywide fish monitoring program for the Chesapeake, yielded the following initial concepts for advancing such a program.
Kevin G. Sellner, Executive Director, CRC Steve Giordano, Fisheries Team Lead, NCBO Workshop Steering Committee: C. Bonzek, Virginia Institute of Marine Science (VIMS) A.C. Carpenter, Potomac River Fisheries Commission (PRFC) S. Giordano, NOAA Chesapeake Bay Office (NCBO) E. Houde, University of Maryland Center for Environmental Science - Chesapeake Biological Laboratory H. King, Maryland Department of Natural Resources (MD DNR) R. Latour, Virginia Institute of Marine Science (VIMS) T. Miller, University of Maryland Center for Environmental Science - Chesapeake Biological Laboratory D. Orner, NOAA Chesapeake Bay Office (NCBO) P. Jones, Maryland Department of Natural Resources (MD DNR) K. Sellner, Chesapeake Research Consortium (CRC) J. Travelstead, Virginia Marine Resources Commission (VMRC) Image on the cover courtesy of CHESMMAP Survey Report Reference: Bonzek, C., E. Houde, S. Giordano, R. Latour, T. Miller, and K.G. Sellner. 2007. Baywide and Coordinated Chesapeake Bay Fish Stock Monitoring. CRC Publication 07-163, Edgewater, MD. 70 pp.

3
Table of Contents Executive Summary…….………………………………………………………………………… 4 Preface: Workshop Description ..………………………………………………………………... 7 Introduction ……………………………………………………………………………………… 8 Lessons from Elsewhere ………………………………………………………………………… 9 Existing Management and Monitoring Organizational Structure ……………………………… 10 Management Data and Information Needs .…………………………………………………….. 11 Species of Interest ……………………………………………………………………………… 13 Consensus Recommendations ………………………………………………………………….. 14 Appendices
1. Steering Committee and Workshop Participants …………………………………… 19 2. Workshop Agenda .…………………………………………………………………. 20
3. Fish Stock Monitoring Programs in Canada and the Eastern U.S. .………………… 22 4. Current Fish Monitoring Programs in the Chesapeake Bay Region .……………….. 35 Maryland Programs ………………………………………………………… 37 Virginia Programs ………………………………………………………….. 52 5. Assorted Chesapeake Bay Maps .…………………………………………………… 63

4
Executive Summary
Workshop Fishery-independent (F-I) surveys provide critical estimates of both the relative abundance and the biological characteristics of exploited populations. As such, these surveys are essential tools for stock assessment and fishery management and are widely used to support single-species management. More recently, however, resource managers have also recognized their use in supporting the emerging needs of ecosystem-based management. In March 2006, the Chesapeake Research Consortium (CRC) and the NOAA Chesapeake Bay Office (NCBO) convened a workshop to review the existing fishery-independent surveys in Chesapeake Bay and to recommend how best to ensure that F-I surveys in Chesapeake Bay support management requirements. Specifically, the workshop identified needs for additional surveys, modifications of ongoing surveys, and the institutions or infrastructure required to support and coordinate such surveys. The workshop brought together approximately 50 fishery managers and scientists from the Chesapeake Bay region along with five invited external experts. The participants developed four broad consensus recommendations as a foundation for a baywide, integrated fish stock monitoring program.
Needs of Management Managers in Chesapeake Bay jurisdictions require appropriately designed surveys to provide information on the status and trends in abundance, age structure, and recruitment variability of managed fish stocks. Reliable estimates of relative abundance for managed fish species are key inputs to assessment models. Additionally, survey data may support the definition of biological reference points and control rules, providing managers with easily understandable targets and thresholds for regulation of landings. Survey data can form the basis for forecasting future trends in abundance of fish stocks. Managers require such information to forecast the consequences of proposed management actions.
F-1 surveys are required by regional management agencies with responsibilities beyond the Chesapeake Bay. For example, the Atlantic States Marine Fisheries Commission (ASMFC) has mandated monitoring for many coastal migratory stocks. In these cases, states must collect specified monitoring data on stocks to comply with ASMFC specifications and avoid sanctions or closures of state fisheries. In addition, other regional management councils, such as the Mid-Atlantic Fisheries Management Council, can use survey data on juvenile fish in Chesapeake Bay for stocks that reside primarily on the continental shelf during their fishable ages.
Ultimately, as we move to multi-species and ecosystem-based approaches to fisheries management, fisheries and other resource management agencies will require survey data on exploited and non-exploited fish species of the Chesapeake Bay fish assemblage. Data requirements for forecasting or predicting trends in abundance in single-species or multi-species management are similar in many respects to those required for stock assessment and should be specifically considered in the development of surveys.

5
Consensus Recommendations Four broad consensus recommendations emerged from workshop discussions. 1. General Surveys A key recommendation from the workshop was the need for the development and implementation of coordinated cross-jurisdictional fish monitoring surveys conducted on a regular and dependable basis in the mainstem Bay and its tributaries. Effective and appropriate coordination and modification of several extant surveys described in Appendix 4 could form the foundation of an integrated program. Trawl and seine surveys are the probable best candidates for general application. Such surveys provide data on multiple species from multiple habitats. A single survey will likely not fulfill these goals simultaneously. Four specific survey platforms were identified for collecting the most critical fish information:
1. Deep (>~20 ft) mainstem and tributary sampling with large bottom trawl(s) for both juveniles and adults;
2. Shallow (~8 ft to ~20 ft) mainstem and tributary sampling with small bottom trawl(s) for both juveniles and adults;
3. Littoral zone (<8 ft) mainstem and tributary sampling with a small mesh seine and possibly a large haul seine; and
4. Longline surveys in appropriate areas for large and uncommon fishes not vulnerable to trawl and seine gears (e.g., elasmobranches, drums, cobia).
The rationale for an integrated system of general purpose surveys includes the following considerations: 1) fish stock monitoring must directly support both stock assessments and fisheries management; 2) many fish stocks in Chesapeake Bay are assessed and managed on a coast-wide basis, however, an ongoing need exists both for regional assessments and for managers to forecast and evaluate the effects of within-Bay management actions; and 3) recruitment to many offshore stocks comes from young-of-the-year stocks in the Chesapeake Bay nursery which vary in abundance from year to year. 2. Special Survey Workshop participants also recognized the need for regular and dependable special surveys of key species that are inaccessible or vulnerable to standard survey gears. In some cases, specific mandates from interstate management agencies require particular survey methodologies and sampling platforms. Species/surveys in this category include mandated spawning area surveys for anadromous species (shads, herrings, striped bass), mandated juvenile abundance surveys for American eel, a Bay-specific abundance survey for Atlantic menhaden, and specified surveys for certain undersampled species. Blue crab and oyster, though not fishes, fall into this category and require surveys using appropriate gear. 3. Coordinating Committee A supporting recommendation from the workshop called for the immediate establishment of a Chesapeake Bay Fish Stock Monitoring Coordinating Committee for monitoring program oversight. Initially, a Coordinating Panel for Survey Design (CPSD) — a panel of national and regional experts and regional managers — would shape the Bay-specific monitoring program. Since the CPSD would design the core survey elements, the panel should consist of experts in survey design from across the nation, regional experts on the Chesapeake fishery ecosystem, and regional managers. The CPSD would be charged with assessing the development and cost of each core survey element along with recommendations for data management.

6
Once the regional administrative fisheries body (the Fishery Science Committee) has adopted the survey design, , a long-standing committee (Coordinating Committee Chesapeake Bay Fisheries Stock Monitoring) would be established and charged with ensuring that the fish survey is conducted according to rigorous specifications. Because the goals of the survey and data collections are to provide managers with high quality information, this committee of regional scientists and managers would exercise oversight and advise the survey programs on data needed, data quality, data products, and adequacy of program designs. The coordinating committee also would advise on the need for new surveys, new survey designs, and survey modifications. Additionally, this committee would assure that Chesapeake Bay fish surveys and monitoring are complementary to and linked with federal and other coastal fish surveys.
4. Administration and Survey Management A designated administrative body is required to assure that the surveys are dependably administered, managed, funded, and coordinated across jurisdictions. The Coordinating Committee would report to the administrative body, which would approve survey designs and standards, implement personnel training, purchase gear, certify and maintain sample processing procedures, manage the data and data distribution, and provide jurisdictional coordination of fishery management bodies, public outreach, and finance. A “home” for this administrative body must be identified.

7
Preface: Workshop Description The design of the workshop and supporting documents allowed fisheries biologists and managers of Chesapeake Bay fisheries to review current Bay monitoring programs and other Atlantic Coast monitoring programs, leading to a discussion of ways to improve current regional fisheries-independent surveys and monitoring. A steering committee of regional biologists and managers (see Appendix 1) designed and developed the workshop. Prior to the workshop, participants received background materials on: 1) goals for ecosystem-based fisheries management in the Chesapeake Bay; 2) the need for monitoring in support of fisheries management; and 3) summary descriptions of fisheries-independent surveys around the Bay. The Chesapeake Research Consortium (CRC) website (www.chesapeake.org/fishstock.htm) offers access to these materials. The first day of the workshop provided additional information on Bay surveys, other regions’ surveys, and manager needs. Participants were then able to fully appreciate: 1) what managers need to know to manage Bay fisheries for effective, long-term sustainable use, 2) what information is currently collected, and 3) what other agencies collect to manage their resources effectively. With this information in hand, the next two days were dedicated to development of conceptual monitoring plans that would enable baywide, systematic surveys of all the major fisheries across the Chesapeake’s jurisdictions. Participants were divided into three breakout groups with each group assigned the task of developing the broad outlines for future integrated regional monitoring programs (see Appendix 2 for the workshop agenda). Participants focused on: 1) the scope and breadth of surveys required to meet single-species, multi-species, and ecosystem-based management needs, including focal species of surveys, Young-Of-Year (YOY) surveys, surveys to capture age structure, transient species surveys, and the incorporation of new technologies into surveys; 2) survey design and application/ implementation that address the required gear as well as the temporal and geographic coverage based on the scope and breadth of surveys; and 3) data management needs, summarized as dedicated baywide fisheries data, centralized data distribution methodologies, routine data/ products for jurisdiction managers, and data standardization over time to account for changes in methodologies. From the conceptual plans exercise, workshop participants produced a set of recommendations for a new baywide monitoring strategy. This new strategy adopts new surveys (or improves and modifies current surveys) to create a set of systematic, coordinated, baywide monitoring plans that fulfill resource management information needs.

8
Introduction The recent emphasis on multi-species and ecosystem-based approaches to fisheries management has mandated the collection of fish data along with subsequent data distribution and fish stock assessment that use data, data products, and related environmental and ecological information. The responsibility for managing the fisheries of the Chesapeake’s fisheries ecosystem remains complex. Both individual states (Maryland and Virginia), and multi-state compacts (e.g., PRFC and ASMF) have responsibility for managing different components of the fishery ecosystem. Thus, both coastal and baywide information are required to create the most effective and coordinated management of our mobile resources. Toward this end, fish stocks have been monitored in the Chesapeake Bay region for over 50 years (e.g., the Maryland Striped Bass Seine Survey and the Virginia Trawl Survey were initiated in the mid-1950s). To date, however, little coordination of fish stock monitoring among the jurisdictions (or, at times, among various programs within a jurisdiction) has taken place. Data, as well as information delivered, remain heterogeneous across jurisdictions; routine, manager-identified data products are few and irregularly generated. Fishery-independent (F-I) surveys offer many benefits for fisheries management. For example, stock assessments depend on data of abundance, age structure, and recruitment variability for model input. Surveying and monitoring form the basis for informed fishery management decisions. Fish populations obviously do not recognize jurisdictional and organizational boundaries; our surveys, therefore, should not be constrained by such limits either. A fractional approach is also not consistent with the broader regulatory scale for the Chesapeake Bay and its fish resources as the interstate and federal management bodies that make regulatory decisions often view these resources as a single unit. High quality F-I survey data provide the state regulatory agencies with defensible and reliable quantitative information, ensuring a scientific basis for management of the region’s fisheries resources. Such data provide the strongest case for representing the stakeholders’ interests to interstate and federal management bodies. Conducting surveys is becoming more difficult for local agencies and institutions due, in part, to the ever-increasing number of mandated data collection efforts. This demand is further compounded by the national commitment to multi-species and ecosystem-based management. The data required to support these approaches for both exploited and unexploited species are substantial. Obtaining such data often proves difficult since funding for surveying and monitoring is not keeping pace with requirements. Finally, while considerable monitoring has taken place, and substantial sums are spent on monitoring each year, sufficient data to support baywide, spatially explicit stock assessments exist for only a few species. With support from the NOAA Chesapeake Bay Office, the research and management community recognized the need to assess potential development of coordinated, baywide fish stock monitoring programs to provide baywide continuity in both data and delivered products. A clear need exists to support development of a coordinated set of fish survey programs that: provides the basis for developing Chesapeake Bay-specific stock assessments; supports coastal interstate assessments; and supplies managers with data for informed management decisions.
9
Ideally, a fishery-independent monitoring plan is required. This plan, if implemented, would provide managers and scientists with baywide data (now and into the future) to assess and manage fish stocks in the Chesapeake region. Specifically, the program should be defined by the following conceptual model:
1. Managers define the broad parameters within which a fishery will be prosecuted along with management goals.
2. Assessment scientists collect or obtain required data, analyze the data, produce routine data and visual products required by managers, and determine appropriate models that support management goals.
3. Mathematical models, including biological reference points, targets, thresholds, and “control rules,” are developed and contain defined input parameter requirements supplied by monitoring programs.
4. Model output must support current management objectives and become available for timely application by managers across bay jurisdictions.
Additionally, defining affordable and practical monitoring and surveying systems remain essential. Given the status of the jurisdictions’ current fiscal resources, new funds are necessary to support an integrated fishery monitoring system.
Lessons from Elsewhere Fishery-independent monitoring is conducted in most regions having substantial commercial and recreational fisheries. The extent of these programs, their nature, and the sampling gear used vary; however, considerable community knowledge can assist in developing a Chesapeake Bay fish stock monitoring program (Appendix 3). Shared experiences across geographic regions in Canada and the U.S. East Coast suggest several common characteristics. First, F-I monitoring should always consider the needs of fishery managers and assessment scientists. Second, in many other areas, the core F-I monitoring program contains one or more general purpose (multi-species/multi-habitat) geographically and temporally broad-scale surveys, usually using trawl and seine gear. Smaller-scale specialized surveys supplement the general surveys to allow sampling in more complex or inaccessible habitats or for sampling species susceptible only to certain gear. Researchers should collect as much information as possible from the surveys because putting boats, people, and fishing gear in the field is expensive and maximum benefit should be gained. Third, core survey/monitoring programs form the basis for cooperative and supplemental work with outside researchers and organizations, thus amplifying the value of basic monitoring work and providing important selling points for the programs. Fourth, an important attribute of successful monitoring programs is the production and consistent provision of timely and relevant data and decision-support tools to resource managers and, increasingly, to the public at large. Because of the many successes of these programs, the proposed Coordinating Panel for Survey Design (see below) will carefully examine such programs for components that can be reproduced and applied to the monitoring programs in the Chesapeake Bay.
10
Existing Management and Monitoring Organizational Structure
Currently, management and monitoring are structured differently in the three jurisdictions that regulate fish resources in Chesapeake Bay. Historically, these differences have affected how monitoring has been funded and conducted (Appendix 4). Such differences also will affect the organization of any future integrated monitoring program. Maryland In Maryland, the Department of Natural Resources (DNR) is the regulatory authority for most species and also conducts most of the significant monitoring programs. The DNR is a state agency, led by a department secretary and advised by stakeholder committees. Additional fish-related work is supported through research awards or contracts from agencies and organizations independent of Maryland state government. The major advantages of this organizational structure are: monitoring programs can be designed to support the needs of managers directly; data collected in the department remain openly available; and funding for monitoring is concentrated in an agency that controls relatively large pools of state and federal funds. Potential disadvantages of this structure include: the prospect for fishery stakeholders to perceive bias on the part of a regulatory agency conducting scientific monitoring; the potential for survey programs to remain in place regardless of recommendations (defended on the basis of duration); and the possibility of adding monitoring programs in response to short-term management issues rather than based on a long-term strategic plan. Virginia The Virginia Marine Resources Commission (VMRC) regulates fishery resources in Virginia. The governor appoints commissioners for specified terms; they make regulatory decisions with the support of a permanent state staff. The VMRC collects most fishery-dependent monitoring data. By Virginia statute, the Virginia Institute of Marine Science (VIMS) is charged with conducting investigations into the fish resources of Chesapeake Bay. In practice, this charge means that VIMS conducts F-I monitoring to support management and other research programs. The VMRC also contracts with other academic and private institutions for fisheries-related research. Additional fish-related work is supported through research awards or contracts from agencies and organizations independent of Virginia’s state government. The major advantages of this organizational structure are: the separation of regulation from management and collection should remove any perception of bias; and studies from academic institutions must meet standards of academic rigor (assessed through peer-reviewed publication of results) ensuring production of only the highest quality information. Potential or actual disadvantages resulting from this structure include: the priorities and products of academic researchers may not adequately match those of the management agency; decisions on funding priorities are made in non-Virginia agencies (currently most monitoring programs are funded under awards other than state-allocated funds); a time lag in public access of data may occur; and a lack of coordination among academic scientists conducting monitoring can result in differing data, information, and products from the suite of institutions.

11
Potomac River The mainstem Potomac River to the mean low water is within the boundaries of the state of Maryland. A jointly appointed body — the Potomac River Fisheries Commission (PRFC) — regulates this water body since the river’s fish resources are important to citizens of both Maryland and Virginia. The PRFC’s small staff collects catch-and-effort data and sets the regulations. All monitoring and research conducted by the states occurs in cooperation with PRFC staff.
Management Data and Information Needs
At present, data requirements for effective fisheries management and resource conservation are substantial and will only increase as management emphasis shifts to multi-species and ecosystem-based approaches in the future. Federal law relating to fisheries management mandates development of quantitative performance benchmarks or reference points. The benchmarks are often expressed in relation to abundance (overfished threshold) and exploitation rate (overfishing threshold). These benchmarks identify biological limits to sustainability for an exploited population. Ultimately, managers should avoid these limits altogether and seek a target reference point that defines a management regime that is sustainable and accrues desirable societal benefits. A hierarchy of approaches for developing reference points or control rules is recognized. At a minimum, all of these approaches require information on the abundance and pattern of removals from the exploited population. More sophisticated, and presumably more reliable, approaches require additional data on the characteristics of both the population and the removals. Such characteristics may include size and age structure, reproductive effort, and information on the distribution and movement patterns of the population. High quality information on these latter characteristics allows consideration of a wide range of benchmarks and management alternatives. To be of the greatest utility, information on the dynamics of the exploited population should come from fishery-independent surveys. Data derived from the fisheries are compromised because changes in the pattern of exploitation, likely driven by economic considerations rather than biological ones, cause the exploited population to be incompletely and inconsistently sampled. Only fishery-independent surveys offer unbiased information on the abundance and status of exploited species. Well-designed surveys can provide the wide range of data required to develop control rules and assess stock status. Additionally, such surveys provide the platform from which to assess the efficacy of management action. Surveys need to be conducted regularly using a consistent methodology so that temporal trends can be clearly identified. Moreover, data from the surveys, and the survey design itself, should be regularly reviewed and reassessed to determine if data are of the requisite quality.
12
Minimum Data Requirements In an ideal situation, both exploited and unexploited species of fishes and important invertebrates would be surveyed and monitored repeatedly during the year. Managers require several kinds of data from fisheries surveys to support stock assessments, especially for implementing fair and equitable regulations. Minimum data requirements include:
• Annual indices and trends of fully recruited (often age 1 and older) fish and shellfish; • Life history and reproductive characteristics (growth rates, fecundity, age/size at first
spawning, sex ratios, migration patterns, spawning season); • Annual indices and trends of juvenile (young-of-the-year) recruitment; and • Annual estimates and trends in stock age composition.
These basic and derived data from fisheries surveys provide the foundation for stock assessments along with identification of target and threshold abundance and demographic parameters. Ultimately, they support development of control rules by management. Extended/Multispecies/Habitat Data Requirements Environmental data should be routinely collected in fisheries surveys and analyzed to explain the probable causes of shifts in the abundance and distribution of key species. As ecosystem-based approaches take on greater importance, collection of supplementary environmental data will become more important in the surveys. In addition, recent federal and regional mandates oblige managers to obtain data on critical or essential habitat, trophic (predator-prey) interactions, and age-specific natural mortality rates of key species. They must also specifically identify stocks when more than one stock of a species may be sampled in an ecosystem.
Habitat is now identified as critical not only for fish but also for associated water quality and other living resources essential to the Bay’s restoration. Fish habitat is restricted by several factors in the tidal system, with the largest habitat loss associated with increasingly smaller volumes of open water containing sufficient oxygen to support the high metabolic demands of these mobile taxa. Dissolved oxygen squeeze, which forces many fish into small oxygenated areas, is considered a frequent Bay condition for open waters and tributaries. Additional habitat loss is coincident with the loss of structure and prey in submersed aquatic vegetation (SAV), coastal marshes, and oyster reefs — all three covering small areas relative to historical maxima of less than a century ago. Access to spawning habitat and nursery areas is also a concern, due to these same conditions, as is limited fish passage in some tributaries. Collecting fish across the heterogeneous and often perturbed tidal system has proved important in assessing environmental controls of fish distributions. It may also prove help assess fecundity, recruitment, and disease, which ultimately govern fish stock size for resident and some life stages of regional transient fishes. Coincidence of water quality and related physical and biological parameters (temperature, salinity, dissolved oxygen, chlorophyll, prey densities) with fish community characteristics will ultimately permit identification of environmental controls or stresses potentially limiting fish in the tidal system. Another of the principal functions of the coordinated multi-habitat, multi-species survey in an ecosystem-approach-to-management context is to determine and translate fisheries habitat requirements to the non-fisheries resource managers so that they can manage the ecosystem with their specific legal authorities for the benefit of the fisheries.

13
Management Needs: Control Rules Fishery survey data should serve management needs. Clearly understood decision tools are preferred by the management community and often expressed as a “control rule” for each managed stock. Control rules plot a reliable measure of abundance (X-axis) versus a measure of exploitation (Y-axis) over a period of years from which target and threshold levels are established for abundance and exploitation rate. Diverse measures of abundance (e.g., relative abundance, absolute abundance, combined surveys abundance) and exploitation (e.g., fishing mortality rate, exploitation fraction) may be the metrics in control rules. However, monitoring data from fish surveys must be consistent to derive parameter estimates for fisheries management. These data include:
• Life history data: - Growth rates - Age at maturity/maturity schedule - Fecundity - Natural mortality - Partial recruitment schedule - Longevity
• Abundance data – Annual fishery-independent survey-derived estimates of:
- Absolute total abundance (very rarely obtained) - Relative abundance indices (more commonly obtained)
These data serve an important role as tuning indices for local and regional stock assessment modeling designed to estimate exploitation and fishing mortality rates. Young-of-the-year survey indices provide a relative measure of stock productivity and information on the interannual recruitment variability, while adult survey indices yield similar types of abundance information along with age- and length-structure data for the harvestable portion of a stock. Collectively, they are used to calibrate stock assessment models to ensure that the derived mortality information comes from models that accurately characterize stock dynamics.
Species of Interest The design for a baywide integrated survey should rest on a multi-species, multi-habitat approach to monitoring fisheries stocks. Nevertheless, the following species are those of major commercial/recreational interest and ecological importance and are, therefore, important for monitoring. Life history characteristics for some species require specialized monitoring programs which should also be considered as the program is designed. Alosids
alewife (Alosa pseudoharengus) American shad (Alosa sapidissima) blueback herring (Alosa aestivalis)
hickory shad (Alosa mediocris) American eel (Anguilla rostrata)

14
Atlantic croaker (Micropogonias undulatus) Atlantic menhaden (Brevoortia tyrannus) Atlantic and shortnose sturgeons (Acipenser oxyrinchus and A. brevirostris) Atlantic silversides (Menidia menidia) Bay anchovy (Anchoa mitchilli) black sea bass (Centropristis striata) blue crab (Callinectes sapidus) bluefish (Pomatomus saltatrix) catfish (Family Ictaluridae) drum black drum (Pogonias cromis) red drum (Sciaenops ocellatus) mackerel king mackerel (Scomberomorous cavalla) Spanish mackerel (Scomberomorous maculatus) mummichog (Fundulus heteroclitus) naked goby (Gobiosoma bosc) spot (Leiostomus xanthurus) striped bass (Morone saxatilis) summer flounder (Paralichthys dentatus) tautog (Tautoga onitis) weakfish (Cynoscion regalis) white perch (Morone americana) yellow perch (Perca flavescens)
Consensus Recommendations General Need A consensus developed that fish stock monitoring must directly support both stock assessments and fishery management. This approach has three critical components. For species not assessed by quantitative stock assessment, the F-I survey provides a time series of relative abundance, which itself serves as a proxy for stock status and for identifying changes in stock status over time. Second, when possible, F-I surveys should provide data that can be used directly in stock assessments. Historically, this consideration has driven survey design to yield data in a specific format usable by one of a few classes of an assessment model. For example, VPA-based assessments require age-structured survey data. Thus, it was not uncommon for the needs of the assessment model to drive the surveys. Recently, more flexible approaches to assessment have been developed which can use a wider range of data types; thus, the justification of survey design purely for assessment needs has weakened. Fundamental data on relative abundance and recruitment are still required, however. In this context, survey longevity by itself is not an adequate justification to continue a program if the data have not proved useful for management. Workshop participants recognized the need for establishment of coordinating committees and an administrative authority to ensure sound survey designs and the provision of high quality data to management agencies and the public in a timely fashion.

15
Many fish stocks can be adequately monitored with an integrated system of general purpose surveys. Such a system would sample a variety of habitats with common sampling gears (e.g., trawls and seines), which could incorporate (perhaps with modification) many of the survey programs presently in place. Some species, however, often due to their life history characteristics or behaviors, can only be adequately monitored with species- or habitat-specific sampling gear. General Purpose Surveys Outlined recommendations for a coordinated program are synthesized below, including at least four major sampling platforms. Some details are provided (e.g., specific depth strata and timing), but should be considered as options. Final designs will result from deliberations of the proposed Coordinating Committee for Survey Design and from recommendations of future workshops and studies. Platform 1: Deep mainstem and tributary (>~20ft) The survey platform would be conducted with large bottom trawls in deeper waters targeting juvenile and adult fish. This set-up may require two separate trawl nets (small and large mesh); alternatively, a small-mesh, cod-end line might prove sufficient (determined experimentally with various trawl gears). Mid-water sampling with appropriate gear (e.g., mid-water trawls) should also be considered part of this survey platform. Serious deliberation should be given to a hydroacoustics-based element of the survey, which may greatly reduce the need for a mid-water trawl element. The likelihood of employing modern technologies to reduce reliance on traditional net-based surveys is a distinct possibility. For example, electronic bottom typing, CUFES, and continuous-flow plankton sampling may prove useful in expanding survey utility. Surveys would be conducted seasonally at a minimum. Data collected on the survey should be evaluated and “challenged” through data analyses by the coordinating committee (see below) The proposed survey design is stratified random, with the strata to be determined. Partial replacement of survey stations should be considered; the parameters on which stratification decisions are based should also be carefully evaluated. A principal challenge with such a survey is ensuring adequate accounting for vessel effects. Currently, only a few vessels in the region — VIMS’ R/V Bay Eagle, University of Maryland Center for Environmental Science’s (UMCES) R/V Aquarius, and the center’s new research vessel (commissioning planned for 2008) are capable of conducting this survey, which limits the scope of the problem. Samples from these surveys will be provided to several regional agencies and institutions to ensure rapid and full workup of appropriate samples. Quality assurance procedures are needed to ensure that work conducted by different groups is comparable. Each data stream (e.g., age, diet, reproductive status) must be clearly identified and a timeline for sample workups provided and adhered to during the survey. Platform 2: Shallow mainstem and tributary (8 ft to ~20 ft) A sampling platform parallel to Platform 1 is required in shallower waters — implemented primarily with a smaller trawl net. The survey should be conducted on a baywide basis, involving all principal tributaries of the Chesapeake. Sampling some tributaries on a rotating basis may prove necessary, meaning that these tributaries only get sampled periodically. The same considerations for sampling design and

16
implementation for Platform 1 also apply. Similar to the mainstem survey, discussed above, vessel effects must remain a design consideration. Determination of protocols for handling survey samples must take place prior to initiation of the survey. Platform 3: Shallow mainstem, tributary, littoral zone (<8 ft) At least two sampling elements were recommended for surveying these shallowest of habitats. One is use of mall-mesh beach seines. Survey periodicity and timing and survey design considerations are similar to those for the platforms described above. Recommended survey design parameters include multiple sampling surveys, possibly four or more times per year with a focus along shores of tributaries and the mainstem Bay. Stratified random designs (proportional to area allocation) would be used to the extent possible in these habitats (collecting habitat descriptors as part of the sampling strategy as well) or stratified random sampling with partial replacement designs might be substituted. The second option for shallow habitats is a large-haul seine survey. A similar frequency is recommended (i.e., a minimum of four times per year with seasonal considerations). The seine would be deployed off a small vessel along edges of tributaries and the mainstem Bay, again using stratified random (proportional to area allocation) or stratified random with partial replacement designs. Platform 4: Longline survey Historically, this survey gear has been used for elasmobranchs in the lower Bay and nearshore ocean. The Coordinating Committee should consider this survey gear for routine monitoring of elasmobranches and possibly other species such as drums and cobia. Specialized Surveys Some species are essentially unavailable to trawls and seines (see longline survey above), or must be sampled following specific protocols required by interstate management agencies. These circumstances necessitate special-purpose survey platforms. Species/surveys falling into this category include mandated spawning area surveys for anadromous species (shads, herrings, striped bass). In some cases, these specialized needs could be met by an expansion of one of three proposed core survey elements. In other instances, however, additional mandated surveys cannot easily be incorporated into the core survey elements, and will require purpose-designed surveys. Examples of such mandates include juvenile abundance surveys for American eel, the Bay-specific abundance survey for Atlantic menhaden, and collections of under-sampled species including spadefish, tautog, black drum, red drum, black seabass, sheepshead, cobia, bluefish, and king and Spanish mackerels. The coordinating committee must consider the sampling of these species and such surveys might be implemented in addition to the general-purpose surveys. Data to be Collected/Provided by Surveys Many standard measurements are common to most fish monitoring surveys including, at a minimum, enumeration and measurement for the size of target species. Conducting surveys that frequently commit personnel and equipment to the field, however, is expensive. A general philosophy and recommendation for surveys, therefore, is to collect as much relevant fish and environmental data as logistics allow. The proposed coordinating committee (below) will recommend specific parameters for measurement and inclusion in surveys. A reasonable list of variables for consideration includes primary products such as measures of abundance (index or absolute) of finfish and selected invertebrates, size structure (age) as length, weight, and

17
biomass, community structure and composition (diversity, frequency of occurrence), spatial distributions, maturity data and sex ratios, prey (gut analyses for ecosystem-based management), hydrographic data, biogenic habitat and related observations, and evaluations of gear performance. Secondary products in the surveys should assess non-target invertebrate measures (biomass, species), information on lower trophic levels (e.g., prey abundance, plankton from tows, phytoplankton, chlorophyll a, benthos), and sediment/bottom type (e.g., fine/coarse sediments, reef/structure present). Administration and Coordination The multiple jurisdictions and several agencies currently responsible for monitoring fish in the Bay region significantly complicate development of an integrated monitoring strategy. While examples exist of closely coordinated surveys (e.g., blue crab winter dredge survey, striped bass tagging programs) and of baywide surveys (e.g., CHESFIMS, ChesMMAP) already in place, they remain the exception and not the rule. Despite jurisdictional boundaries, a level of institutional coordination over baywide survey programs is mandatory. Coordinating Committee A Chesapeake Bay Fish Stock Monitoring Coordinating Committee is strongly recommended. The committee would focus on scientific and technical oversight of the monitoring program designed by a temporary expert advisory panel on survey design. The expert advisory organization, perhaps designated the Coordinating Panel for Survey Design (CPSD), would design the core survey elements and should include survey design experts from around the nation, regional experts on the Chesapeake fishery ecosystem, and regional managers. The CPSD would be charged with the development and costing of each core survey element, with recommendations for data management. It would report its recommended design to the Fishery Steering Committee, which would then assemble the recommended Chesapeake Bay Fish Stock Monitoring Coordinating Committee. The priorities of fisheries management would drive the decisions and recommendations of the coordinating committee. This standing committee would oversee all future activities including:
1) examining and evaluating historical/existing fish survey programs, data for duplication, and the possible need for expansion or contraction;
2) ranking quality of required data for important species and specifying acceptable levels of precision;
3) examining and evaluating external survey programs for design elements and/or specific components for possible incorporation into the design of the comprehensive Chesapeake Bay fishery monitoring program;
4) recommending and designing new surveys (tasks will include defining survey parameters such as gear including new technologies, sampling area, survey periodicity, sample sizes, sampling procedures, stratification, expected levels of precision, and data products); and
5) linking Bay surveys with current federal and coastal surveys, including fish, other living resources, water quality, and physical assessments.
Survey Management A critical need remains for survey administration, management, financing, and jurisdictional coordination. Administrative coordination and oversight are essential to ensure

18
that fish monitoring and survey programs function well. Securing and administering funds to support surveys and to assure continuity of programs are critical functions of an effective administrative body. Data management, product development, distribution, adoption, and use of standardized procedures and gears, along with outreach all constitute responsibilities of the administrative body. Currently, the determination of whether an existing agency in the Bay region, such as the Fishery Steering Committee, or a new institutional body might be most appropriate to take on these tasks remains undecided.

19
Appendix 1
Steering Committee and Workshop Participants Steering Committee C. Bonzek (chair), VIMS A.C. Carpenter, PRFC S. Giordano, NCBO E. Houde, UMCES-CBL P. Jones, MD DNR H. King, MD DNR
R. Latour, VIMS T. Miller, UMCES-CBL D. Orner, NCBO K. Sellner, CRC J. Travelstead, VMRC
Attendees Jerry Ault, Rosentiel School of Marine and Atmospheric Science Chris Bonzek, VIMS Eric Brasseur, VIMS Denise Breitburg, Smithsonian Environmental Research Center Nancy Butowski, MD DNR A.C. Carpenter, PRFC Mary Christman, University of Florida Bill Connelly, UMCES CBL Kristen Delano, VIMS Julia Ellis, VIMS Mary Fabrizio, VIMS Lynn Fegley, MD DNR Jim Gartland, VIMS Steve Giordano, NCBO Dean Grubbs, VIMS Chris Hager, VA Sea Grant Mandy Hewitt, VIMS Jay Hixson, Morgan State University- Estuarine Research Center Harry Hornick, MD DNR Ed Houde, UMCES CBL RaeMarie Johnson, VIMS Howard King, MD DNR Rob Latour, VIMS Jon Lucy, VIMS Pat Lynch, VIMS
Steve Meyers, NOAA Kathleen McNamee, VIMS Bob Michael, Florida Fish and Wildlife Research Institute Marcel Montane, VIMS John Olney, VIMS Debra Parthree, VIMS Paul Piavis, MD DNR Bill Richkus, Versar Harry Rickabaugh, MD DNR Bill Riordan, VMRC Phil Sadler, VIMS Dave Secor, UMCES CBL Kevin Sellner, CRC Gary Shepherd, NOAA Northeast Fisheries Science Center Maddy Sigrist, MD DNR Howard Townsend, NOAA Cooperative Oxford Laboratory Jack Travelstead, VMRC Jim Uphoff, MD DNR Jon Volstad, Versar Nancy Wallace, ASMFC Durand Ward, VIMS Dale Weinrich, MD DNR Charles Wenner, SC DNR Paul Winger, Memorial University
20
Appendix 2 Workshop Agenda
Chesapeake Fish Stock Monitoring Workshop 7 – 9 March 2006
Day 1 9:00 Introduction and objectives (Kevin Sellner, Ph.D. – CRC Director and
Steve Giordano – NOAA Chesapeake Bay Office, NCBO) 9:20 Workshop goals and logistics (Chris Bonzek - VIMS) 9:40 Keynote addresses – Lessons from Elsewhere
• Canada (Paul Winger, Ph.D.) • Northeast (Gary Shepherd, Ph.D.) • SEAMAP (Charles Wenner, Ph.D.) • Florida (Robert McMichael, Ph.D.) • Florida Coral Reef Resources (Jerald Ault, Ph.D.)
12:00 Lunch (provided) 1:00 Major Bay Fisheries – Species and Gears
(Rob O’Reilly - VMRC & Dale Weinrich - MDNR) 1:30 What Managers Need to Know (Jack Travelstead - VMRC) (with Discussion) 2:15 Overview of Existing Surveys (Harry Hornick – MDNR, Rob
Latour, Ph.D. and Chris Bonzek – VIMS) 3:00 Survey Priorities – Presentation of Charge to Workgroups (Ed Houde, Ph.D.) Assignment to workgroups and initial workgroup meetings
Facilitator Rapporteur Ed Houde Bill Connelly – student, CBL Rob Latour Kathleen McNamee – student, VIMS Derek Orner (NCBO) Patrick Lynch – student, VIMS
5:30 Adjourn

21
Day 2
8:30 Three workgroups will each develop conceptual monitoring plans. At a minimum, plans should address:
– Scope and breadth of surveys • YOY survey(s) • Age-structured survey(s) • New technologies survey(s) • Transitory species survey(s)
– Design and application • Gear(s) • Temporal coverage • Geographic coverage
– Data management
12:00 Lunch (provided) 1:00 Workgroup progress reports – Presented by facilitators at plenary session 2:00 Workgroups continue 5:30 Adjourn
Day 3 8:30 Integration of workgroup reports 12:00 Lunch (provided) Mid- afternoon Closing expert summaries Adjourn

22
Appendix 3
Fish Stock Monitoring Programs in Canada and the Eastern United States
Newfoundland Dr. Paul Winger, Director, Centre for Sustainable Aquatic Resources, Marine Institute, Memorial University of Newfoundland Prepared in cooperation with Dr. Stephen Walsh, Northwest Atlantic Fisheries Centre Offshore/Nearshore Surveys Random-stratified trawl surveys conducted by the Northwest Atlantic Fisheries Centre (NAFC) of Fisheries and Oceans Canada (FOC) in the spring (1971 – present) and fall (1977 – present) cover approximately 900,000 km2 from Davis Strait to the Flemish Cap and along the south coast to the Gulf of St. Lawrence in depths between 40 and 1,500 meters. In addition, Newfoundland’s inshore coastal bays have been surveyed since 1995. Data collected during these surveys include:
• Numbers and weights for all commercial finfish and shellfish • Length, weight, sex, maturity, otoliths, and stomach contents for commercial species • Preserved samples for future special-purpose laboratory analyses • Bottom classification using the RoxAnn system • Oceanographic information from each tow using a trawl-mounted CTD
During the decades of these surveys, several different survey trawls have been used, including:
• Yankee 41.5 otter trawl, 1971 – 1983 • Engel 145 otter trawl, 1984 – 1994 • Yankee 41.5 shrimp trawl 1985 – 1994 • Campelen 1800 shrimp trawl 1995 – 2005
Several vessels were employed; comparison tows documented changes when possible. Data from these surveys are used as fishery-independent indices either separately or in catch-at-age models to estimate resource size. Data are used in yearly assessments for within-Canada stocks and for Canadian-American, trans-boundary stocks. Inshore Cod Surveys Juvenile cod indices are generated from a survey at 31 fixed-station trawling sites in southern Bonavista Bay. The objectives of this survey are to:
• determine areas of high and low abundance of juvenile cod • determine distribution and abundance of adult cod and other fish species • classify juvenile cod seabed habitats using acoustics and video • determine distribution and abundance of juvenile cod in relation to their biological and
physical habitats Data collected during this survey include:

23
• Numbers, lengths, weights, otoliths, stomach contents (for cod) • Numbers, weights, lengths (for other fish species) • Trawl geometry (depth, door and wing spreads, clearance, net opening) • CTD (temperature, salinity, density profiles at each tow location) • Echosounder acoustics (selected trips) for fish distribution and density • Sediment typing, with acoustic seabed classification
Other NAFC Surveys
• Inshore pot/trawl surveys for snow crab • Offshore capelin acoustics on the Grand Bank • Offshore sea scallops on St. Pierre Bank • Trinity Bay acoustics/ecosystem surveys • Offshore marine salmon drift net surveys
NAFC-Industry Surveys • Inshore pot/trawl surveys for snow crab • Offshore capelin acoustics on the Grand Bank • Offshore sea scallops on St. Pierre Bank • Trinity Bay acoustics/ecosystem surveys • Offshore marine salmon drift net surveys
University-Industry Surveys
• Hagfish (slime eels) • Toad crab • Softshell clam
Survey Gear Standardization Winger spoke about the necessity of developing survey gear standardization specifications and standard, well-documented deployment protocols. He presented an example from Newfoundland in which two survey vessels were using supposedly identical “Engel 145 high-lift otter trawls,” but because no single set of standards existed, a significant amount of “drift” had occurred which caused substantial differences between the gears. Such differences were caused by:
• Multiple versions of ambiguous and erroneous net plans • Inconsistent quality and specification of parts • RV crews who did not understand the difference between fishing for science and fishing
for commerce • Scientific staff not trained or unwilling to share in ownership of the survey trawl (scientific
tool) • No one checking to ensure that the gear was constructed correctly • Absence of clearly defined and written protocols that everybody could understand
24
Beginning in the 1990s, and continuing today, a standardization program has been implemented. The premise of this program is that survey gears are scientific sampling instruments and should be treated as such. The program’s philosophy is based on the following:
• Standardized surveys should minimize the variability typical in commercial fisheries data and generate more consistent indices of stock abundance
• An essential feature of surveys is maintaining consistency from one survey to the next so that survey catchability (q) remains constant over time
• Constancy in catchability can be achieved by ensuring constancy in sampling efficiency of the trawl through consistent construction, repairs, and fishing procedures
• Rigid standardization of equipment, procedures, and routines is assumed to minimize the effects of the variable, unknown, and unseen underwater reality
In practice, this philosophy results in the following standardization protocols:
• ISO9001 standard trawl plans to ICES specifications • Quality control on purchasing tolerance levels • Quality control on construction and repairs survey gear checklist • Quality control on trawl deployment, fishing and retrieval-scope ratios, trawl speed
monitoring, and other factors • Survey trawl monitoring • Training of vessel and scientific staff in operations
When procuring new survey gear, components are quality assured according to:
• Trawl net plans and parts list • Tolerances levels • Detailed specifications for institutional purchasing organizations (vendors are given
detailed requirements and held to allowable tolerances) • Inspection of all gear by trained warehouse staff prior to delivery • Rejection of gear exceeding allowable tolerance
While preparing for research cruises, the following checklist is followed.
• Survey trawls are measured prior to each survey and after major gear damage. A fishing officer maintains a logbook of repairs and parts replaced.
• The RV crew conducts trawl mensuration under supervision of the SIC/TIC or his/her designate.
• The survey trawl checklist ensures methodical examination of the trawl and its components.
• Each measurement is compared to specification and recorded. Components exceeding specifications are replaced.
• These steps are also followed after major construction of trawl parts onshore by vessel staff.
The standardization program continues to seek improvements and present modernization plans including:
• Revision and update of trawl plans, parts list, and tolerances • Revamp of the checklist and development of protocols on its use

25
• Protocols for trawl warp standardization and calibration • Protocols for rigging, construction, and repairs of trawls onboard • Protocols for replacing worn trawl parts such as door shoes, footgear components, ground
wires, and main warps • Protocols for attachment of trawl instrumentation and associated floatation • Scanmar protocols for configuring, deploying, and charging sensors • Standardization of all survey trawls used in Atlantic Canada • Training of vessel and scientific staff
Finally, continued training should include the following:
• A means to ensure that research vessel crews better understand science methodology and that science staff better understand gear technology
• A 5- to 8-day training course developed by the Marine Institute that features the flume tank, classroom, and full-scale measuring exercises
• One-day training course in gear monitoring equipment deployment, use, and repairs
Northeast Fisheries Science Center Bottom Trawl Surveys (Mr. Gary Shepherd and Dr. Russell Brown) The National Marine Fisheries Service (NMFS) Northeast Fisheries Science Center (NEFC) has conducted bottom trawl surveys in New England and the mid-Atlantic since 1963. Since inception, the surveys have used a stratified random sampling design, with strata defined by region and depth. The surveys strive for maximum consistency while expanding survey coverage and implementing an expanding set of objectives. The current objectives include:
• Monitor abundance and survival of fishes • Track recruitment trends • Monitor geographic distribution of species • Monitor ecosystem changes • Monitor biological condition of stocks (e.g., growth) • Collect environmental data and support other research
Currently, the surveys are defined by the following logistical parameters:
• Geographic coverage between Nova Scotia and North Carolina • Depth coverage to 200 fathoms (365 meters) • Current use of #36 Yankee otter trawl with 4½-inch mesh and ½-inch cod-end liner • Spring and autumn cruises require approximately 8 weeks to sample and complete about
300 to 350 stations • Operations continue 24 hours per day as long as conditions do not present a danger • The trawl net is set and towed for 30 minutes at each station • Sorted species are weighed to the nearest 0.1 kg and fish length measured to the nearest 0.5
cm (sub-sampling occasionally required on large tows) • Biological samples collected:
- Individual fish weighed (g) - Stomach contents examined

26
- Sex and maturity recorded - Scales or otoliths collected
• Plankton tows made at fixed stations throughout survey area • Special sample requests accommodated (~25 to 35 requests per cruise) • Information noted on net performance (shiny door shoes and more recently Scanmar
records) • Ship records environmental data (e.g., water temperatures, salinity, weather, and sea
conditions) Sources of variability in sampling include those both within and outside of scientific personnel control, including
• Controllable factors: - Gear standardization - Survey design effectiveness - Sample collection protocols - Sample processing protocols - Data auditing/handling procedures
• Uncontrollable factors: - Changes in environmental conditions - Variation in fish behavior - Gross changes in fish distribution - Non-random station changes due to fixed gear or bottom type
Recent and planned survey changes and enhancements contain the following:
• Design: - Depth coverage to increase to 275 fathoms (500 m) - Improved stratification to account for long-term area closures and international
boundaries • Gear:
- Ensure that the survey gear is easily maintained and provides consistent performance;
- Improve net monitoring to produce data for any post-data collection adjustments; - Archive one complete set of gear that is never fished and serves as the “standard”
for the program - Ensure that scientists inspect every piece of gear before every survey
• Tow Execution: - Standardize relative to tide direction when possible - Establish setting and hauling procedures that standardize bottom contact to the
greatest degree possible - Tune target speed to the gear used, while considering overground versus through-
the-water speeds - Establish clearly interpretable protocols relative to bad bottom, fixed gear, and
vessel traffic issues • Catch Processing:
- Use optimal gear and tow protocols to minimize the need for sub-sampling

27
- Clearly define, test, and establish robustness of sub-sampling procedures (NEFSC survey requires five different sub-sampling protocols for different situations)
- Use an automated data acquisition system with error checking (such a system eliminates paper and prevents undetectable human errors made in recording data)
- Freeze and verify specimens for which species identification is in doubt • Post Survey
- Keep in mind that this is generally the most neglected portion of most programs - Establish data quality control and error checking procedures that are extensive and
robust - Derive relational databases to provide easy access to data
Southeast Area Monitoring and Assessment Program (SEAMAP) (Dr. Charles Wenner, South Carolina Marine Research Institute) SEAMAP is a general-purpose, fishery-independent trawl survey operating in shallow coastal waters from Cape Hatteras to Cape Canaveral. The program has operated since 1990 with a relatively stable set of protocols. Target species include commercial shrimp (three species), blue crab, mackerels, butterfish, bluefish, Atlantic menhaden, Atlantic spadefish, sheephead, black seabass, several species of the family Scienidae, along with several flounder species. The survey goal is to provide fishery scientists and managers with a consistent, fishery-independent, historical data set on a variety of species. The general survey methodology includes the following:
• Vessel (R/V Lady Lisa) – 75-ft double-rigged shrimp trawler (two identical nets fished simultaneously for each tow)
• Net – 75-ft footrope with chain loops – Falcon trawl (typical net dimensions during towing are: width = 43 ft ± 2.2 ft; height = 13.5 ft ± 0.45 ft)
• Leglines – 7 ft • Doors – 8 ft long and 40 inches wide (8 foot 40’s) • Bridles (3) – one to port door, one to starboard door, one to center of headrope • Floats (3) • Tickler chain – 4 ft shorter than foot rope and attached to heel of each door • 20-minute tow time • Distribution of samples and the survey stratification changed significantly in 2001,
including a focus on inner strata as well as a change in the number of stations sampled in a stratum shifting from proportional to optimal allocation
Data for each species in the catch include:
• Abundance • Biomass • Length • Age (from otoliths) • Reproductive stage (from gonads)

28
SEAMAP data are used in the following ways: • Fisheries management plans:
- Stock assessment - VPA (virtual population analysis)
• Genetics: - Species identification - Stock identification
• Essential Fish Habitat: - Bottom mapping - Nursery areas
• Life History • Graduate student research • Systematics • Disease studies • Toxicology • Marine turtle monitoring
South Carolina Estuarine Sampling (Historical and Current) (Dr. Charles Wenner) Several past and current sampling efforts in the state waters of South Carolina are described, including:
• Otter trawls in deeper waters • Stop nets in intertidal areas • Gill nets (floating and stationary) • Rotenone and seines in shallow tidal creeks • Habitat traps • Trammel nets • Electroshock in transitional areas
Each of these surveys responded to specialized needs dictated either by local physical conditions (e.g., tidal creeks with strong flow, structure interference with certain types of sampling gear) or by the habits of the species of interest (e.g., tidal movements of red drum, susceptibility of certain species to certain gear types). Each survey gear offered specific advantages and disadvantages; individual types were kept or abandoned as cost/benefit ratios or other priorities demanded. Overall, a trammel net survey in shallow tidal creeks and grassbeds has shown great success. The critical point emanating from the survey descriptions is the importance of designing specific surveys to meet specific needs.
Florida Marine Fisheries-Independent Monitoring Program (Mr. Robert McMichael, Florida Fish and Wildlife Research Institute)

29
The state of Florida has implemented a broad-scale, comprehensive, fishery-independent monitoring program. This program operates statewide; due to the state’s extensive coastline, however, geographic divisions proved necessary. Within each division, a series of gear-oriented surveys target a variety of species and life stages. The program developed over a period of years, but rests upon a consistent philosophy and set of tools. The program’s budget is roughly $5.5 million annually, coming from both state and extramural sources. The program’s mission statement is, “To provide timely, accurate, and consistent fisheries-independent data and analysis to fisheries managers for the conservation and protection of Florida’s fisheries.” The program’s objectives are to:
• Detect changes in the relative abundance of fishes and select macroinvertebrates over time:
- Develop young-of-the-year and fishery recruitment indices - Detect changes in the size/age structure of fish populations
• Define habitat utilization (EFH) • Describe biodiversity, biotic communities, and change in Florida’s estuarine systems
The program’s philosophy follows:
• Holistic approach: - Stratified-random design - Multi-species - Multi-habitat - Multi-gear
• Targeted species: - Trammel nets - Hook and line - Electro-fishing
• Broad size range sampled: - Juveniles - Subadults - Adults
• Standardized procedures • Extensive QA/QC • Fish released alive except for representative, unidentified, and research samples • Timely • Team approach (cross-training) • Publishing • Extensive networking with other programs:
- Cooperative work with projects both internal and external to FWC - Funding opportunities - More bang for the buck
Florida’s program provides several “associated products.” These include:
• Age and growth: - Data provide fishery managers with fishery-independent estimates of the age
structure of resource species in Florida’s estuaries

30
- Statewide since program’s inception • Reproductive studies:
- Data provide fishery managers with fishery-independent assessment of age at maturity, reproductive strategies, and fecundity of resource species in Florida’s estuaries
- Statewide since program’s inception • Fish health:
- Data provide fishery managers with baseline information on fish health and near-instantaneous data during fish health events
- Statewide since 1997 • Mercury concentrations:
- Data provide Department of Health with species and area-specific trends in mercury concentrations in fish flesh
- Statewide since 1995 • Diet studies:
- Basic input for biomass models - Preliminary work in 1992/1993; re-initiated in 2005
• Length/weight: - Field records of numbers and lengths require conversion to biomass for modeling
In addition, the program resources are available for event sampling in circumstances such as:
• Harmful algal blooms (HAB): • Hypoxia/anoxia events • Oil spills • Acidic water spills • Cold kills • Fish health events • Pre- and post-muck dredging • Post hurricane
Finally, several supplemental projects take advantage of in-place infrastructure. These include:
• Baitfish survey: - Provide fishery managers with annual updates on the distribution and abundance of
baitfish stocks in waters along the central-west coast of Florida - Conducted since 1994 - Based on trawl and hydroacoustic surveys
• Hatchery monitoring and assessment: - Determine optimal size-at-release, location, and season for stocking red drum in
Tampa Bay - Use multi-gear, stratified random sampling (SRS) and directed sampling designs to
monitor hatchery and wild red drum in the Alafia and Little Manatee rivers and adjacent Tampa Bay waters
- Recapture over 2,278 hatchery-reared red drum, most within 10 weeks of release (Approximately 359 of these recaptures have contained CWT tags; others identified using genetics.)

31
• Tagging: - Monitor movements and habitat use - Use allprint dart tags in Tampa Bay - Use acoustic tags with receiver network in Charlotte Harbor
• Catch-and-release mortality: - Provide fisheries managers with an accurate estimate of the short-term mortality
rate due to the release of recreationally captured species • Marine Protected Areas (MPAs):
- Compare abundance and size structure between defacto MPAs (military or aerospace limits on access) and similar, unprotected areas
• Dredge hole assessment: - Assess faunal composition and angler use of dredge holes to assess benefits/
detriments of re-filling • Exotic species:
- Monitor abundance, distribution, and expansion of range • Minimum flows and levels and water withdrawal permits:
- Assess impact of freshwater inflow on the abundance and distribution of species and communities within major tidal tributaries
- Assess the impacts of permitted freshwater withdrawals. • Tidal tributaries:
- Smaller tidal tributaries are undersampled or missed entirely by current FIM sampling design
- Smaller tidal tributaries are easily overlooked and are often subject to intense development
- The importance of these habitats and their relative contributions to fish stocks needs to be established
• Electro-fishing: - Document use of freshwater habitats by estuarine species - Elucidate seasonal patterns in habitat use
• Sawfish: - FIM gears and techniques are adapted to assess distribution and abundance of
endangered small tooth sawfish in Charlotte Harbor - Sawfish are acoustically tagged and tracked using a passive network of receiver
stations - Twenty-two fish were captured, tagged, and released in 209 samples
• Ecosystem management: - Ecosystem management does not manage or manipulate ecosystem processes - Ecosystem-based management ensures that fishery management decisions do not
adversely affect ecosystem function and productivity, so that harvesting of target stocks (and resultant economic benefits) is sustainable in the long term
- Systems of management, which have tended to focus on individual stocks or species, have not achieved this objective; consequently, the economic activity that the ecosystem supports has been compromised
• Ecopath with Ecosim:

32
- Researchers can use Ecopath software, which includes both time-dynamic (EcoSim) and spatial simulation (EcoSpace) sub-models, to study fisheries resources in an ecosystem context, analyze the overall ecosystem, and explore management policy options
Fisheries-Independent Assessment of Coral Reef Fishery Resources in the Florida Keys (Dr. Jerald S. Ault, University of Miami Rosenstiel School of Marine and Atmospheric Science (RSMAS)) The presentation described an intensive multi-disciplinary system for monitoring the fish resources of difficult-to-sample coral reefs. The survey thoroughly documents many aspects of Florida Keys reef ecology using direct observation by divers. Data from the program are used in a multi-layered modeling context, including habitat, hydrodynamics, traditional fishery demographics, predator and prey interactions, and human impacts.

33

34
Appendix 4
Current Fish Monitoring Programs in the Chesapeake Bay Region
Prepared by:
Chris Bonzek Virginia Institute of Marine Science
In collaboration with
the numerous scientists who conduct these surveys
For presentation at:
The Chesapeake Bay Fishery Independent Monitoring Workshop
7 – 9 March 2006
35
Introduction This document presents summaries of current major fishery-independent monitoring programs in the Chesapeake Bay region. It describes only those programs that provide substantial data supporting finfish management and those with a relatively wide geographic and/or temporal coverage. Some of the programs described obtain samples from commercial fishing sources; as such, they are not strictly fishery-independent surveys. However, the agencies collecting these data use the results to assess fish populations, so the surveys are included here. Management Context Three different bodies are charged with management of the Bay’s fishery resources. In Maryland, that authority rests in the Department of Natural Resources’ (MDNR) Fisheries Service. In Virginia, the Marine Resources Commission (VMRC) manages the fisheries. Although the Potomac River lies within the state of Maryland, the bi-state Potomac River Fisheries Commission (PRFC) manages this river. All three bodies, as well as the city of Washington D.C. and the Commonwealth of Pennsylvania, are signatories to regional fishery management plans. In addition, the Atlantic States Marine Fisheries Commission (ASMFC) and the Mid-Atlantic Fishery Management Council (MAFMC) impose numerous management and monitoring mandates on the states. Maryland and Virginia use different organizational models to monitor and manage their fishery resources. In Maryland, authority rests within MDNR both to assess fish stocks and to regulate their harvest. In addition, the MDNR collaborates on additional fishery science monitoring and analytical projects with the various University of Maryland Center for Environmental Science (UMCES) campuses. In Virginia, regulatory authority is vested in the VMRC, which collects fishery-dependent monitoring data (catch, effort, biological characterization of catch), while the Virginia Institute of Marine Science (VIMS) holds responsibility for fishery-independent research and monitoring. The PRFC collects its own catch-and-effort data. Both the MDNR and VIMS assist the PRFC with fishery-independent monitoring. Each model has distinct advantages and disadvantages; these models are unlikely to change in the near future. Development of a monitoring plan must account for the differences and remain within the organizational capabilities of each responsible agency. Data from several of the surveys in this document — primarily those monitoring striped bass and the Alosa species — are mandated by interstate fishery management organizations. Collection of these data is considered a fishery management plan “compliance” issue. That is, if such data were not collected, the interstate management agencies could request the secretary of commerce to close a state’s fishery. These programs tend to be well defined, well organized, and adequately funded from stable sources, such as through state funds and Wallop-Breaux grants. Physical and Biological Complexity Extending almost 200 miles in length and ranging between 4 and 30 miles wide, with a watershed draining 64,000 square miles, the Chesapeake Bay is the nation’s largest estuary. This long, narrow, shallow (average depth 21 feet, maximum depth about 175 feet) water body exhibits a wide range of physical and biological conditions with important seasonal and inter-annual variability. Freshwater flow from the Susquehanna River dominates the northern portions, while saltwater tidal flux from the Atlantic Ocean dominates processes in the southern region.

36
In addition to the diverse physical conditions, the Bay’s ecological position at the southern edge of the ranges of many northern species and the northern limit of the ranges of many sub-tropical species results in a complex and dynamic suite of species using Bay’s waters. Seasonal migrants and species join resident species in using the productive Bay waters as spawning and nursery grounds. Well over 50 finfish species are harvested commercially and recreationally. Multi-species With development of a regional Fisheries Ecosystem Plan (FEP) under the guidance of the National Oceanic and Atmospheric Administration’s Chesapeake Bay Office (NCBO), the Chesapeake region has become a leader in the national and regional movement toward multi-species and ecosystem fisheries management. In addition to sponsoring the FEP, the NCBO has also funded development of two multi-species-oriented monitoring programs (see CHESFIMS and ChesMMAP in the following pages). Appendix Organization This appendix presents brief summaries of each significant fishery-independent monitoring program currently operating in the region. To the extent possible, the information for each survey remains the same. Due primarily to organizational differences, however, some information (usually budgeting and staffing data) are not separable on a survey-specific basis. The survey descriptions also vary in the text outlining survey goals and procedures. These differences reflect the quantity of information accessible to the author (mainly through web pages, project reports, and proposals) and do not reflect a given survey’s value. Brief summaries, such as those presented here, cannot fully describe a complex sampling program. However, sufficient information is presented to give workshop participants an overview of each program. The slight difference in the order and organization of the Maryland and Virginia survey descriptions reflects both the administration and funding of the programs and the author’s attempt to present the programs in a logical and understandable context. Any errors of omission or of fact, as well as any presentation of data in a misleading context, are the sole responsibility of the author.

37
Maryland Programs Note: The following nine surveys conducted by the Maryland Department of Natural Resources (not the Shoal Water Trawl Survey or the CHESFIMS Survey) are organized under a blanket program entitled “Chesapeake Finfish Program.” Personnel and budgets are not separated among the various projects. Combined Current Budget:
• Personnel Number: PI(s) – 6; Permanent Staff – ~17; Seasonal Employees – 2 to 4 Budget: No information available
• Supplies, Equipment, Operations: No information available • Total Program Budget: $1.9 million
Shad and Herring Surveys
Shad and Herring – Adult – Pound/Fyke Net Conducting Institution: Maryland Department of Natural Resources Current PI(s): Robert Sadzinski Primary Function/Management Data Products: To biologically characterize, monitor, and assess adult Alosa species in Maryland’s Chesapeake Bay by measuring CPUE, length-at-age, age-at-maturity, age frequency, spawning history, and natural mortality for state, regional, and coastal species management and ASMFC stock assessment. Target Species: American shad, hickory shad, alewife, blueback herring Current Funding Source: Wallop-Breaux/state Current Budget:
• Personnel Number: 2 Budget: Survey effort is part of Interjurisdictional Species Stock Assessment Project. This project is contained within the Chesapeake Bay Finfish & Habitat Investigations, F61-R-2. Specific amounts for above task are not available.
• Supplies, Equipment, Operations: No information available Years in Operation: 19

38
Survey Timing:
• Time of year: February through early May
• Frequency: One to two days per week
Survey Location(s): Nanticoke River Survey Gear(s): Commercial pound and fyke nets Survey Procedures: Specimens are sampled at 1 to 2 commercial pound net and 6 to 18 commercial fyke net sites once or twice a week. Fish are measured (TL), and sex and spawning condition recorded. Scales are taken for later analysis. Attributes and Limitations:
• Attributes: Long-term data set (19 years). May be used to collect information on other resident species.
• Limitations: Limited geographic distribution; currently conducted only in Nanticoke
River. Recent Collaborations: Data and results shared with ASMFC, NMFS, USFWS (U.S. Fish and Wildlife Service), and various academic institutions for coastal management activities. Website: None
Shad and Herring – Adult – Hook & Line Conducting Institution: Maryland Department of Natural Resources Current PI(s): Robert Sadzinski Primary Function/Management Data Products: To biologically characterize, monitor, and assess adult American shad in Maryland’s Chesapeake Bay by measuring relative abundance, CPUE, length-at-age, age-at-maturity, age frequency, spawning history, and natural mortality in the lower Susquehanna River for ASMFC stock assessment Target Species: American shad Current Funding Source: Wallop-Breaux/state

39
Current Budget:
• Personnel Number: 2 Budget: Survey is part of the Interjurisdictional Species Stock Assessment Project. This project is contained within the Chesapeake Bay Finfish & Habitat Investigations, F61-R-2. Specific amounts for above task are not available
• Supplies, Equipment, Operations: No information available Years in Operation: 24 Survey Timing:
• Time of year: Mid April to early June • Frequency: Three to four days per week
Survey Location(s): Conowingo Dam Tailrace (Susquehanna River) Survey Gear(s): Hook and Line Survey Description and Procedures: All shad are sexed and measured (FL) with scales removed for later analysis. Fish in good physical condition are tagged with T-bar anchor tags. Attributes and Limitations:
• Attributes: Long-term data set (24 years). Information used in collaborative efforts through the Susquehanna River Anadromous Fish Restoration Committee (SRAFRC) for Susquehanna River shad restoration.
• Limitations: Limited geographic distri-
bution; currently conducted in only one area — Conowingo Dam Tailrace (Sus-quehanna River)
Recent Collaborations: Data and results shared with ASMFC, SRAFRC, NMFS, USFWS, and various academic institutions for coastal management activities. Website: None
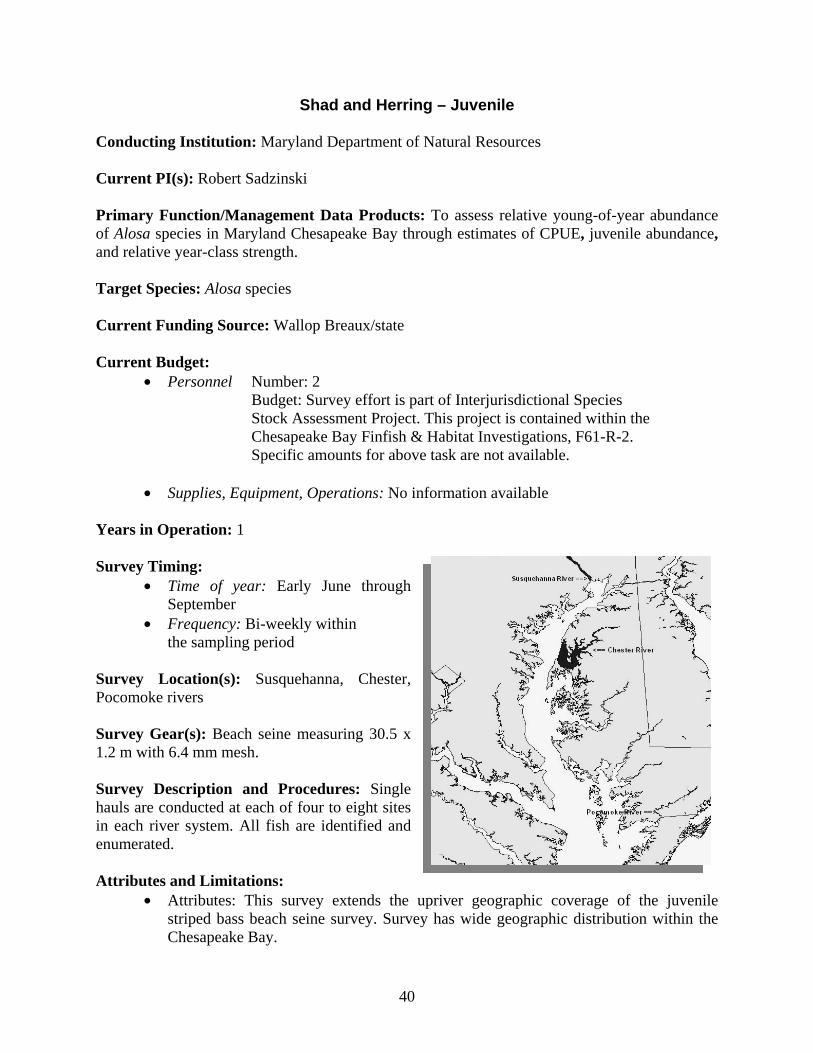
40
Shad and Herring – Juvenile Conducting Institution: Maryland Department of Natural Resources Current PI(s): Robert Sadzinski Primary Function/Management Data Products: To assess relative young-of-year abundance of Alosa species in Maryland Chesapeake Bay through estimates of CPUE, juvenile abundance, and relative year-class strength. Target Species: Alosa species Current Funding Source: Wallop Breaux/state Current Budget:
• Personnel Number: 2 Budget: Survey effort is part of Interjurisdictional Species Stock Assessment Project. This project is contained within the Chesapeake Bay Finfish & Habitat Investigations, F61-R-2. Specific amounts for above task are not available.
• Supplies, Equipment, Operations: No information available Years in Operation: 1 Survey Timing:
• Time of year: Early June through September
• Frequency: Bi-weekly within the sampling period
Survey Location(s): Susquehanna, Chester, Pocomoke rivers Survey Gear(s): Beach seine measuring 30.5 x 1.2 m with 6.4 mm mesh. Survey Description and Procedures: Single hauls are conducted at each of four to eight sites in each river system. All fish are identified and enumerated. Attributes and Limitations:
• Attributes: This survey extends the upriver geographic coverage of the juvenile striped bass beach seine survey. Survey has wide geographic distribution within the Chesapeake Bay.

41
• Limitations: Conducted only in Susquehanna, Chester, and Pocomoke rivers. Recent Collaborations: Data and results shared with ASMFC, NMFS, USFWS, and various academic institutions for coastal management activities. Website: No information available
Resident Species Surveys
Upper Bay Trawl Survey Conducting Institution: Maryland Department of Natural Resources Current PI(s): Paul Piavis Primary Function/Management Data Products: To biologically characterize and monitor spawning stocks of resident species in the Middle Bay, Upper Bay, Sassafras River, and Elk River in terms of age, size, sex ratio, and relative abundance. Growth and mortality rates, recruitment indices, length, and age characterization of spawning populations of the four target species are generated. Target Species: White perch, yellow perch, channel catfish, white catfish Current Funding Source: Wallop-Breaux/state Current Budget:
• Personnel Number: 2 Budget: Survey effort is part of Resident Species Stock Assessment Project. This project is contained within the Chesapeake Bay Finfish & Habitat Investigations, F61-R-2. Specific amounts for above task are not available.
• Supplies, Equipment, Operations: No information available Years in Operation: 5 Survey Timing:
• Time of year: December through February • Frequency: Six biweekly rounds in the survey period. During each round, each of 18
stations situated in four Upper Bay areas are sampled. Survey Location(s): Middle Bay (4 stations), Upper Bay (6 stations), Sassafras (4 stations), and Elk (4 stations) rivers

42
Survey Gear(s): Trawl with 7.6 m headrope length, with 7.7 cm stretch mesh body and 1.9 cm cod end, with 1.3 cm liner. Tow time is 10 minutes. Survey Description and Procedures: Single 10-minute tows are conducted at 18 sites in each river system. Sampling locations are randomized by depth strata (<6 m and >6 m). All fish specimens are identified and enumerated, with at least 30 specimens of each species measured. Otoliths from a non-random sub-sample of the target species are taken for development of age-length keys. Attributes and Limitations:
• Attributes: Samples numerous species • Limitations: Limited geographic
distribution; currently conducted only in Middle Bay and Upper Bay as well as the Sassafras and Elk rivers.
Recent Collaborations: Data and results used for stock assessments and Maryland FMPs (fishery management plans) and shared with USFWS and various academic institutions for Chesapeake Bay fisheries management activities. This information is used to develop regulatory and statutory changes as well as for the preparation of FMPs. Website: No information available
Fisheries Independent/Dependent Fyke Net Sampling Conducting Institution: Maryland Department of Natural Resources Current PI(s): Paul Piavis Primary Function/Management Data Products: To biologically characterize and monitor the legal catch of tidal-freshwater stocks of resident species in the Choptank River, Nanticoke River, and Upper Bay in terms of age, size, sex ratio, and relative abundance. The length distribution and age characterization of the commercial catch, growth, and mortality rate estimates are derived. Age-length keys for the target species are also produced. Target Species: White perch, yellow perch, channel catfish, white catfish Current Funding Source: Wallop-Breaux/state Current Budget:

43
• Personnel Number: 2 Budget: Survey effort is part of Resident Species Stock Assessment Project. This project is contained within the Chesapeake Bay Finfish & Habitat Investigations, F61-R-2. Specific amounts for above task are not available.
• Supplies, Equipment, Operations: No information available Years in Operation: Choptank River – 17 years; Nanticoke River – 6 years; Upper Bay – 5 years. Survey Timing:
• Time of year: Mid February through mid April
• Frequency: Choptank and Nanticoke rivers (3 days per week) Upper Bay from March 1 to 10 (2 to 4 times — weather permitting)
Survey Location(s): Choptank River, Nanticoke River, Upper Bay (Northeast, Bush, Gunpowder rivers) Survey Gear(s): Commercial and Fisheries Service fyke nets Survey Description and Procedures: All target species, and various other tidal freshwater species (e.g., largemouth bass, chain pickerel, bluegill), and up to 30 white perch are measured. Otoliths from a non-random sub-sample of white perch and yellow perch are taken for development of age-length keys. Attributes and Limitations:
• Attributes: Samples numerous species, long-term data set for the Choptank River. • Limitations: Non-random survey, limited geographic distribution, currently only
conducted in Upper Bay and the Choptank and Nanticoke rivers.
Recent Collaborations: Data and results used for stock assessments and yellow perch FMP revisions and shared with USFWS and various academic institutions for Chesapeake Bay fisheries management. White perch and catfish FMPs are also being developed. Website: No information available

44
Striped Bass Surveys
Striped Bass – Spawning Population Characterization – Gill Net Survey Conducting Institution: Maryland Department of Natural Resources Current PI(s): Beth A. Versak Primary Function/Management Data Products: Biologically characterizes the striped bass spawning stock in the Potomac River and Upper Chesapeake Bay in terms of age, size, sex ratio, and relative abundance. Data provided or generated include CPUE, catch-at-age, length-at-age, year-class strength, spawning stock biomass, as well as tuning indices for the ASMFC coastal VPA model. Target Species: Striped bass Current Funding Source: Wallop-Breaux/state Current Budget:
• Personnel Number: 6 Budget: Survey effort is part of Interjurisdictional Species Stock Assessment Project. This project is contained within the Chesapeake Bay Finfish & Habitat Investigations, F61-R-2. Specific amounts for above task are not available.
• Supplies, Equipment, Operations: No information available Years in Operation: 21 Survey Timing:
• Time of year: April through May • Frequency: 5 to 7 days per week during
the sampling period
Survey Location(s): Upper Chesapeake Bay and Potomac River Survey Gear(s): Experimental multi-panel drift gill nets (3.0" – 10" stretch mesh), one in each sampling area. Order of meshes is randomized in each net. Sample locations are assigned using a stratified random survey design. Survey Description and Procedures: Nets are fished five to seven days per week, once or twice

45
per day, for up to eight weeks during the spring spawning season. All striped bass specimens are enumerated, measured (TL), sexed, and most are tagged (in cooperation with the coastwide tagging program). Specimens of other species captured (e.g., American shad, hickory shad, blueback herring, alewife, white perch, channel catfish, blue catfish, Atlantic menhaden) are also enumerated and measured (TL). Attributes and Limitations:
• Attributes: Long-term data set (21 years); samples numerous species. • Limitations: Currently conducted only in Upper Bay and Potomac River.
Recent Collaborations: Data and results shared with ASMFC, NMFS, USFWS and various academic institutions for coastal management activities. Website: No information available
Striped Bass YOY Beach Seine Survey Conducting Institution: Maryland Department of Natural Resources Current PI(s): Eric Q. Durell Primary Function/Management Data Products: Determine relative abundance of juvenile finfish in Maryland Chesapeake Bay. Provides estimates of CPUE and relative year-class strength. Provides tuning indices to the ASMFC coastal VPA model. Target Species: Primary species: striped bass
Secondary species: American shad, hickory shad, blueback herring, alewife, white perch, yellow perch, channel catfish, white catfish weakfish, bluefish, summer flounder, spot, Atlantic croaker
Current Funding Source: Wallop-Breaux/state Current Budget:
• Personnel Number: 4 Budget: Survey effort is part of Interjurisdictional Species Stock Assessment Project. This project is contained within the Chesapeake Bay Finfish & Habitat Investigations, F61-R-2. Specific amounts for above task are not available.
• Supplies, Equipment, Operations: No information available Years in Operation: 53 Survey Timing:
• Time of year: July through September

46
• Frequency: Monthly during the sampling period; 8 days per month
Survey Location(s): Upper Chesapeake Bay, Potomac River, Choptank River, Nanticoke River, Patuxent River Survey Gear(s): 100 ft (30.5 m) x 4 ft (1.24 m) bagless beach seine with ¼" (6.4 mm) bar mesh. Survey Description and Procedures: Juvenile indices are derived annually from sampling at 22 fixed stations in Maryland's portion of the Chesapeake Bay. Stations are divided among four of the major spawning and nursery areas: Potomac River (7 stations), head-of-Bay areas (7 stations), Nanticoke River (4 stations), and Choptank River (4 stations). Replicate seine hauls — a minimum of 30 minutes apart — are taken at each site on each sample round, producing a total of 132 samples for calculating baywide means. Age 0 fish are measured from a random sample of up to 30 individuals per site and round. All other finfish are identified to the species level and counted. Additional data collected at each site include: time of first haul, maximum distance from shore, weather, maximum depth, surface water temperature (°C), tide stage, surface salinity (ppt), primary and secondary bottom substrates, and percent of submerged aquatic vegetation within the sample area, along with dissolved oxygen (DO), pH, and turbidity (Secchi disk). Attributes and Limitations:
• Attributes: Long-term, consistent time series; numerous species sampled; fairly wide geographic distribution.
• Limitations: Sampling conducted only in Choptank River, Nanticoke River, Potomac River, head of Bay, and Susquehanna Flats.
Recent Collaborations: Data and results are used for stock assessments and FMPs and are also shared with ASMFC, NMFS, USFWS, and various academic institutions for coastal management activities. Website: www.dnr.state.md.us/fisheries/juvindex/
Striped Bass – Adult Access-Intercept Survey of Hook & Line Fishers (Fishery-dependent)
Conducting Institution: Maryland Department of Natural Resources Current PI(s): Erik Zlokovitz

47
Primary Function/Management Data Products: Biologically characterizes the legal harvest of the Maryland striped bass trophy fishery in terms of age, size and sex composition, CPUE, catch-at-age, length-at-age, and distribution of trophy harvest Target Species: Striped bass greater than 28" Current Funding Source: Wallop-Breaux/state Current Budget:
• Personnel Number: 3 Budget: Survey effort is part of Interjurisdictional Species Stock Assessment Project. This project is contained within the Chesapeake Bay Finfish & Habitat Investigations, F61-R-2. Specific amounts for above task are not available.
• Supplies, Equipment, Operations: No information available
Years in Operation: 4 Survey Timing:
• Time of year: April through May • Frequency: 4 to 5 days per week within the sampling period
Survey Location(s): Upper and Middle Chesapeake Bay Survey Gear(s): Recreational hook and line used by private boats and charterboat fishermen. Survey Descriptions and Procedures: This survey monitors the post-spawning population as subject to a “trophy” fishery. High-use charter boat marinas and boat ramps are visited 6 to 7 days per week (weighted toward weekends). Hook-and-line fishers’ catch are characterized by number, length, weight, sex, and spawning condition. Scales and otoliths are removed for later analysis. Up to 20 fish per day per site are sampled. Attributes and Limitations:
• Attributes: Targets successful striped bass trophy fishermen and collects information not previously collected by the department
• Limitations: Non-random sample, limited in geographic distribution Recent Collaborations: Data and results used for stock assessments and FMPs and are shared with ASMFC, NMFS, USFWS, and various academic institutions for coastal management activities. Website: No information available

48
Migratory Species Monitoring
Interjurisdictional Species Stock Assessments for Selected Recreationally Important Adult Migratory Finfish
Conducting Institution: Maryland Department of Natural Resources Current PI(s): Harry Rickabaugh Primary Function/Management Data Products: Biologically characterizes adult migratory finfish in Maryland waters in terms of age, size composition, pound net composition, CPUE, catch-at-age, length-at-age, age-at-maturity, year-class strength, age and spawning history, mortality, and stock recruitment. Target Species: Weakfish, bluefish, Atlantic croaker, summer flounder, spot, red drum, black drum, Atlantic menhaden, Spanish mackerel Current Funding Source: Wallop Breaux/state Current Budget:
• Personnel: Number: 1 Budget: $197,000
• Supplies, Equipment, Operations: No information available Years in Operation: 3 Survey Timing:
• Time of year: June through September • Frequency: Bi-weekly within the
sampling period, 1 to 2 days per week Survey Location(s): Mid/lower Maryland Chesapeake Bay, Honga River, Lower Potomac River Survey Gear(s): Commercial pound nets Survey Description and Procedures: Between two and six pound nets are sampled bi-weekly, with sampling effort proportional to recent harvest. Target species specimens are measured and otoliths removed from weakfish and Atlantic croaker. Scales are removed from a sub-sample of Atlantic menhaden.

49
Attributes and Limitations: • Attributes: Samples numerous species; samples in southern Maryland. • Limitations: Non-random sample; limited in geographic distribution
Recent Collaborations: Data and results shared with ASMFC, NMFS, USFWS, Mid-Atlantic Fisheries Management Council, and various academic institutions for coastal management activities. Website: No information available
Maryland Shoal Water Trawl Survey Conducting Institution: Maryland Department of Natural Resources Current PI(s): Lynn Fegley Primary Function/Management Data Products: Monthly index of blue crab size group/gender abundance. Annual report is posted on www.dnr.state.md.us. Target Species: Blue crabs, ancillary species include striped bass, white perch, croaker, weakfish, spot, Bay anchovy, summer flounder Current Funding Source: State of Maryland Current Budget:
• Personnel: Number: PI(s) – 1; Permanent Staff – 1; Seasonal employees – 2 Budget: No information available
• Supplies, Equipment, Operations: Approximately $50,000 including salaries Years in Operation: 29 Survey Timing:
• Time of year: May – October • Frequency: Once per month
Survey Location(s): Chester River, Eastern Bay, Choptank River, Little Choptank River, Patuxent River, Fishing Bay, Nanticoke River, Tangier Sound, Pocomoke Sound Survey Gear(s): 16-ft otter trawl Survey Description and Procedures: Sampling takes place once per month from May through October. Each monthly sampling round

50
consists of 37 fixed sites located in nine river systems: Chester River, Eastern Bay, Choptank River, Patuxent River, Tangier Sound, Pocomoke Sound, Nanticoke River, Fishing Bay, and Little Choptank River. The sampling gear is a 16' semi-balloon otter trawl made with 1¼" stretch mesh body, 1.5" stretch mesh cod-end with a 0.5" stretch mesh liner, 3/16" footrope, and a 3/16" tickler chain. The net is towed at each site once for 6 minutes at a speed of 3 knots. When each tow is brought aboard, the sample is sorted and each crab’s carapace width (cw) is measured to the nearest millimeter with weight measured to the nearest gram. Missing chelipeds are noted. Sex and maturity of females are recorded and molt stage is also noted. All finfish are counted. For striped bass, white perch, menhaden, shad, blueback herring, alewife, black drum, kingfish, croaker, summer flounder, winter flounder, blue fish, Spanish mackeral, speckled seatrout, and weakfish, a sub-sample of 20 individuals is measured for total length (TL) to the nearest millimeter. Temperature and salinity are also recorded at each site. The depth at the beginning and end of trawl set is noted and trawl duration recorded. Attributes and Limitations:
• Attributes: Sampling covers a wide range of habitats centered on major commercial fishing areas. Highly repeatable. Data generated are timely.
• Limitations: Sampling is non-random. Small boat constrains range of working conditions.
Recent Collaborations: No information available Website: www.dnr.state.md.us
Multi-species Monitoring
CHESFIMS (Chesapeake Bay Fisheries Independent Monitoring Survey)
Conducting Institution: University of Maryland – Chesapeake Biological Laboratory Current PI(s): Dr. Thomas J. Miller and Dr. Edward D. Houde Primary Function/Management Data Products: Abundance and distribution of juvenile bentho-pelagic fish along with diet data of these fish Target Species: Multiple Current Funding Source: Not funded after 2005. Previous funding from NSF (National Science Foundation) and NCBO. Current Budget:
• Personnel: Number: PI(s) – 1; Permanent Staff – No information available;

51
Graduate Students – No information available Budget: No information available
• Supplies, Equipment, Operations: No information available • Approximate Operational Cost: $400,000
Years in Operation: 1995 – 2005 Survey Timing:
• Time of year: May through September • Frequency: Three cruises — May, July,
September Survey Location(s): Chesapeake Bay mainstem. Survey Gear(s): 18 m2 mid-water trawl, with 6 mm cod-end mesh. Survey Description and Procedures: During each cruise, approximately 50 stations were sampled. The net was fished for 2 minutes in each of ten depth zones throughout the water column from the surface to the bottom. Deployment times and locations were recorded. The section of the tow in the deepest zone sampled epibenthic fishes close to or on the bottom. The remaining portion of the tow sampled pelagic and neustonic fishes. All survey deployments took place between 19:00 and 07:00 to reduce problems with gear avoidance and to take advantage of the diurnal distribution patterns of pelagic fish species. Attributes and Limitations:
• Attributes: Good spatial coverage, baywide estimates of bay anchovy distribution and abundance, estimates of abundance of forage species, recruitment indices for key species. Data available in SQL database.
• Limitations: Limited within-year temporal coverage. Fish greater than 250 mm not well indexed.
Recent Collaborations: No information available Website: hjort.cbl.umces.edu/chesfims.html

52
Virginia Programs
Shad and Herring Conducting Institution: Virginia Institute of Marine Science Current PI(s): Dr. John E. Olney Primary Function/Management Data Products: Adult abundance indices in the major Virginia tributaries. Target Species: American shad, hickory shad Current Funding Source: Wallop-Breaux (FWS) and VMRC Current Budget:
• Personnel: Number: PI(s) – 1; Permanent Staff – 3; Graduate Students – 1 to 4 Budget: No information available
• Supplies, Equipment, Operations: No information available • Total Budget: $355,000
Years in Operation: Since 1998 in present form Survey Timing:
• Time of year: February – April • Frequency: Each river is fished twice per week during the survey period.
Survey Location(s): James, York, Rappahannock rivers Survey Gear(s): Staked gill net Survey Description and Procedures: Gill nets are fished on 24-hour sets. Adult fish captured are measured, sexed, and staged (for reproductive condition) as well as aged and OTC-scanned. Attributes and Limitations:
• Attributes: No information available • Limitations: Only CPUE estimates; no
absolute estimates of population size Recent Collaborations: S. Thorrold, WHOI, Determination of natal stream fidelity. Website: None
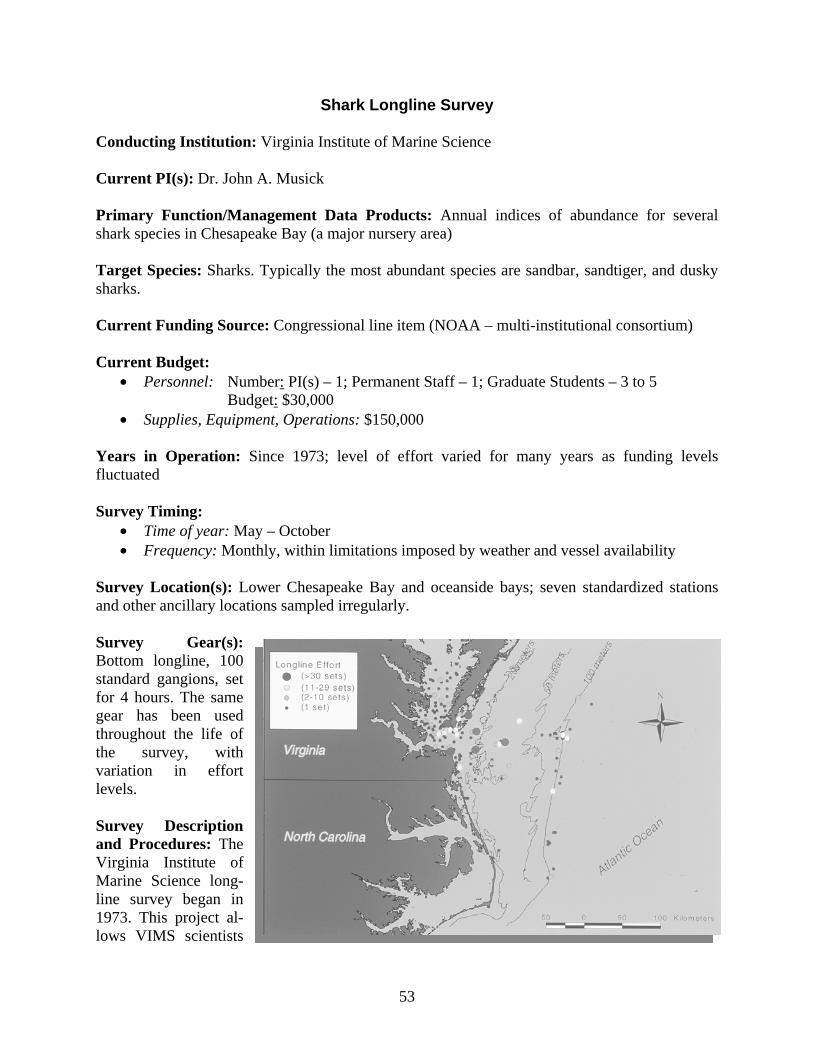
53
Shark Longline Survey Conducting Institution: Virginia Institute of Marine Science Current PI(s): Dr. John A. Musick Primary Function/Management Data Products: Annual indices of abundance for several shark species in Chesapeake Bay (a major nursery area) Target Species: Sharks. Typically the most abundant species are sandbar, sandtiger, and dusky sharks. Current Funding Source: Congressional line item (NOAA – multi-institutional consortium) Current Budget:
• Personnel: Number: PI(s) – 1; Permanent Staff – 1; Graduate Students – 3 to 5 Budget: $30,000
• Supplies, Equipment, Operations: $150,000 Years in Operation: Since 1973; level of effort varied for many years as funding levels fluctuated Survey Timing:
• Time of year: May – October • Frequency: Monthly, within limitations imposed by weather and vessel availability
Survey Location(s): Lower Chesapeake Bay and oceanside bays; seven standardized stations and other ancillary locations sampled irregularly. Survey Gear(s): Bottom longline, 100 standard gangions, set for 4 hours. The same gear has been used throughout the life of the survey, with variation in effort levels. Survey Description and Procedures: The Virginia Institute of Marine Science long-line survey began in 1973. This project al-lows VIMS scientists

54
to assess the abundance of local shark stocks and to monitor changes in abundance over time. The survey is a depth-stratified field survey of the Chesapeake Bay and Virginia coastal waters. Eight standard stations plus ancillary locations are fished each month from May or June through September or October. Five of these stations occur in coastal waters and represent three depth strata (<10 m, 10 – 20 m, and 20 – 100 m). Two stations occur in the Chesapeake Bay and the last station sits in the Eastern Shore seaside lagoons of Virginia. At each station, a 100-hook longline covering approximately 1.25 nautical miles is fished for 3 to 4 hours. Each hook is baited with a third or a half of an Atlantic menhaden (Brevoortia tyrannus). Each fish captured is measured and sexed; biological samples are taken as needed for genetic, age/growth, trophic, and reproduction analyses. Healthy specimens not needed for these analyses are tagged and released for long-term studies on migration, habitat utilization, age, and growth. Sandbar sharks (Carcharhinus plumbeus) up to 150 cm total length are tagged with Hallprint nylon dart tags, specifically designed for juvenile sharks. All other sharks are tagged with “M”-type steel dart tags, supplied by the NMFS Apex Predator Program. Over the course of this survey, more than 1,000 sets have been made and over 99,000 hooks have been set, catching a total of 7,434 sharks of 21 different species. Attributes and Limitations:
• Attributes: Long time series; fishery-independent • Limitations: Discontinuous sampling due to funding problems
Recent Collaborations: Many Website: None
Juvenile Fish Recruitment Surveys
Note: The following three surveys share a common set of goals, personnel, and budget. The combined actual personnel and budget requirements are listed below. Under the separate categories for each survey are estimates of personnel and budget requirements if each survey existed as a stand-alone entity. Current budget:
• Personnel: Number: PI(s) – 2; Permanent Staff – 6; Graduate Students – ~1 Budget: $375,000
• Supplies, Equipment, Operations: $125,000
Juvenile Fish and Blue Crab Trawl Survey Conducting Institution: Virginia Institute of Marine Science Current PI(s): Dr. Mary C. Fabrizio, Marcel M. Montane Primary Function/Management Data Products: Annual indices of abundance

55
Target Species: Approximately 20
• Sciaenids: Spot, Atlantic croaker, weakfish, silver perch • Pleuronectiformes: Summer flounder, blackcheek tonguefish, hogchoker • Ictalurids: Channel catfish, white catfish, blue catfish • Anadromous species: Striped bass, white perch • Coastal species: Scup, butterfish, harvestfish, spotted hake • Miscellaneous species: American eel, bay anchovy, black seabass, northern puffer
Current Funding Source: Since approximately 1990, funding for this survey has changed several times. In the 1980s, the survey was a state-budgeted line item, but this allotment was lost to state budget cuts. Subsequently, the survey was funded for several years by Wallop-Breaux funds and then, for a short time, by recreational saltwater fishing license funds. In 2004, the survey was included as a line item in the federal NOAA budget. In 2005, however, specific funds were not included in the NOAA budget (though language supporting the survey was included). The survey currently depends primarily on Virginia recreational saltwater fishing license dollars, along with a small supplement from the NOAA Chesapeake Bay Office. Current Budget:
• Personnel: Number: PI(s) – 2; Permanent Staff – 4; Graduate Students – ~1 Budget: $210,000
• Supplies, Equipment, Operations: $100,000 Years in Operation: 52 years (1955) — with a series of survey expansions, survey gear and vessel changes, and surveying system changes. The survey gear has remained stable since 1989. No significant changes in survey methodology have taken place since 1996. Survey Timing:
• Time of year: January – December • Frequency: Monthly
Survey Location(s): Three major river systems in Virginia (Rappahannock, York, James) and the Chesapeake Bay mainstem from approximately the Rappahannock River mouth to the Virginia capes. Survey Gear(s): The current gear configuration is: a 30 ft semi-balloon otter trawl with a 1½" (38.1 mm) stretch mesh body and a ¼" (6.35 mm) mesh-cod liner, two steel-v doors (28" x 19", 71 x 48 cm), and an attached tickler chain, all towed using a 60 ft (18.29 m) bridle. Survey Description and Procedures: The stratification system is based on depth and latitudinal regions in the Bay, or depth and

56
longitudinal regions in the rivers. Each Bay region is 15 latitudinal miles and consists of six strata; western and eastern shore shallow (4 – 12 ft), western and eastern shoal (12 – 30 ft), central plain (30 – 42 ft), and deep channel (>42 ft)(Table 2). Each tributary is divided into four regions of approximately 10 longitudinal miles, with four depth strata in each (4 – 12 ft, 12 – 30 ft, 30 – 42 ft, and >42 ft). Strata are collapsed in areas where certain depths are limited. Between one and four stations per stratum are sampled each month, resulting in a total monthly sampling rate of approximately 110 stations. At each station, the gear is towed for 5 minutes at a speed of approximately 2 knots. Attributes and Limitations:
• Attributes: Long time series; wide geographic and temporal coverage • Limitations: Virginia only; small vessel limits capabilities.
Recent collaborations: No information available Website: www.fisheries.vims.edu/trawlseine/mainpage.htm
Striped Bass YOY Beach Seine Survey Conducting Institution: Virginia Institute of Marine Science Current PI(s): Dr. Mary C. Fabrizio, Julia K. Ellis, Amanda H. Hewitt Primary Function/Management Data Products: Annual indices of abundance for striped bass (Morone saxatilis) and approximately 40 other species (ranging from marine spawners to tidal freshwater residents) in the major Virginia tributaries of the Chesapeake Bay. Target Species: The primary target species are striped bass (Morone saxatilis) and bluefish (Pomotomus saltatrix). Other species for which abundance indices are provided include:
• Anadromous species: Alewife, American shad, blueback herring, gizzard shad, threadfin shad, white perch
• Forage species: Atlantic menhaden, Atlantic silverside, bay anchovy eastern silvery minnow, golden shiner, inland silverside, rough silverside, satinfin shiner, spottail shiner, striped anchovy, tessellated darter
• Killifishes: Banded killifish, mummichog, striped killifish • Tidal freshwater species: Blue catfish, bluegill, channel catfish, largemouth bass,
pumpkinseed, redbreast sunfish, white catfish, yellow perch • Sciaenids: Atlantic croaker, spot • Miscellaneous species: American eel, Atlantic needlefish, hogchoker, striped mullet,
white mullet Current Funding Source: USFWS Wallop-Breaux and VMRC
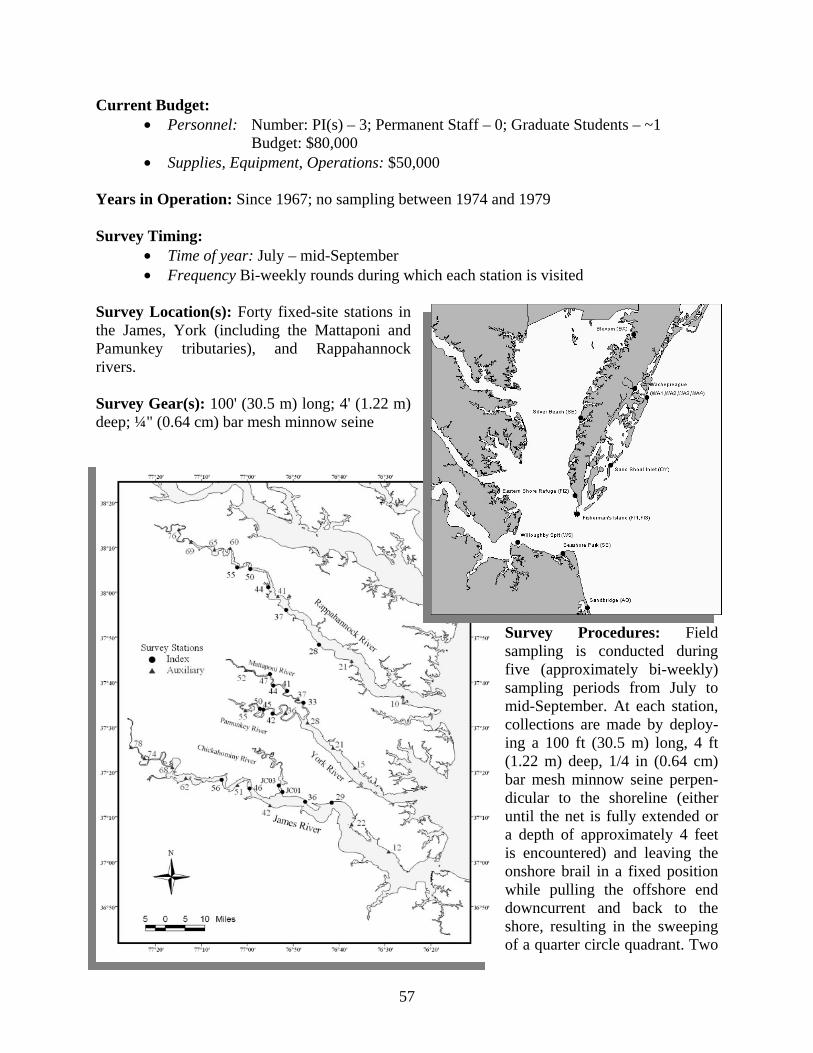
57
Current Budget: • Personnel: Number: PI(s) – 3; Permanent Staff – 0; Graduate Students – ~1
Budget: $80,000 • Supplies, Equipment, Operations: $50,000
Years in Operation: Since 1967; no sampling between 1974 and 1979 Survey Timing:
• Time of year: July – mid-September • Frequency Bi-weekly rounds during which each station is visited
Survey Location(s): Forty fixed-site stations in the James, York (including the Mattaponi and Pamunkey tributaries), and Rappahannock rivers. Survey Gear(s): 100' (30.5 m) long; 4' (1.22 m) deep; ¼" (0.64 cm) bar mesh minnow seine
Survey Procedures: Field sampling is conducted during five (approximately bi-weekly) sampling periods from July to mid-September. At each station, collections are made by deploy-ing a 100 ft (30.5 m) long, 4 ft (1.22 m) deep, 1/4 in (0.64 cm) bar mesh minnow seine perpen-dicular to the shoreline (either until the net is fully extended or a depth of approximately 4 feet is encountered) and leaving the onshore brail in a fixed position while pulling the offshore end downcurrent and back to the shore, resulting in the sweeping of a quarter circle quadrant. Two

58
tows are conducted for index stations (those stations contributing to striped bass abundance estimates). All fish from the first tow are removed from the net and held in water-filled buckets until after the second tow. Only one tow is performed at non-striped bass index stations. All striped bass, and a sub-sample of at least 25 individuals of other species, are measured to the nearest millimeter fork length (or total length if appropriate). All fishes captured, except those preserved for life history studies, are returned to the water when sampling concludes. Counts are taken of other species after measuring 25 individuals. Atmospheric and station data are recorded: salinity, water temperature, pH, dissolved oxygen, sampling time, tidal stage, and weather conditions. Attributes and Limitations:
• Attributes: Long time series with consistent sampling across three drainages with varying physical and biological attributes; validated as an indicator of future adult populations; part of a baywide monitoring survey for juvenile striped bass; in 1994, several Eastern Shore stations added to improve the juvenile index for bluefish.
• Limitations: Some non-target species not sampled in their zones of highest abundance. Recent Collaborations: No information available Website: www.fisheries.vims.edu/trawlseine/sbmain.htm www.fisheries.vims.edu/trawlseine/blumain.htm
Eel YOY Survey Conducting Institution: Virginia Institute of Marine Science Current PI(s): Dr. Mary C. Fabrizio Primary Function/Management Data Products: Annual indices of abundance Target Species: American eel (Anguilla rostrata). Current Funding Source: No information available Current Budget:
• Personnel: Number: PI(s) – 1; Permanent Staff – 2; Graduate Students – ~1 Budget: $100,000
• Supplies, Equipment, Operations: $10,000 Years in Operation: 7 (since 2000) Survey Timing:
• Time of year: Spring • Frequency: Daily, or semi-daily, depending upon site location.

59
Survey Location(s): Four fixed-site stations — two on tributaries of the York River and one each on tributaries to the James and Rappahan-nock rivers Survey Gear(s): Irish eel ramp Survey Description and Procedures: Irish eel ramps are used to collect eels at all sites. The ramp configuration successfully attracts and captures small eels in tidal waters of the Chesapeake Bay. Ramp operation requires the continuous flow of water over the climbing substrate and through the collection device. A passive supply of water to the traps occurs through gravity feed. Hoses are attached to the ramp and collection buckets outfitted with adapters to allow quick removal for sampling. EnkamatTM erosion control material on the ramp floor offers a textured climbing surface and extends into the water below the trap. The ramps are placed on an incline (15o – 45o) , often on land, with the ramp entrance and textured mat extending into the water. Submersion of the ramp entrance is considered undesirable, and as such is placed in shallow water (<25 cm). These inclines, in combination with the 4° incline of the substrate inside the ramp, provide sufficient slope to create attractant flow. A hinged lid allows access for cleaning and flow adjustments. Once eel recruitment has begun, traps are checked daily on the York River (Wormley and Brackens ponds) and four days per week (Monday/Wednesday/Friday and alternating weekend days) on the Rappahannock River (Kamp’s Mill Pond) and James River (Wareham’s Pond). Only eels in the ramp's collection bucket (not on the climbing surface) are recorded. Trap performance is rated on a scale of 0 to 3 (0 = new set; 1 = gear working; 2 = gear working, but not efficiently; 3 = gear not working). Water temperature, pH, air temperature, wind direction and speed, and precipitation were recorded during most site visits. All eels are enumerated and placed above the impediment, with any applicable subsample information recorded. Specimens less than or equal to ~85 mm total length (TL) are classified as “young-of-year” or YOY, while those greater than 85 mm TL are considered “elvers.” These lengths correspond to the two distinct length frequency modes observed in the 2000 survey, which likely reflects differing year classes. Lengths, weights, and pigmentation stage data (see Haro and Krueger, 1988) are collected on 60 eels from each system weekly. Attributes and Limitations:
• Attributes: The method has proved a consistent way to capture juveniles of this species. • Limitations: Survey results have not been validated.

60
Recent Collaborations: No information available Website: www.vims.edu/fish/eels/eels.html Haro, A.J. and W.H. Krueger. 1988. Pigmentation, size, and migration of elvers (Anguilla rostrata (Lesueur)) in a coastal Rhode Island stream. Can. J. Zool. 66(11): 2528–2533.
Striped Bass Monitoring and Tagging Conducting Institution: Virginia Institute of Marine Science Current PI(s): Dr. John M. Hoenig Primary Function/Management Data Products: Monitor the adult spring season striped bass population in Virginia in compliance with ASMFC mandates. Abundance indices, spawning stock biomass indices, egg production potential indices, annual survival, growth rate, and mortality estimates are produced. Target Species: Striped bass (Morone saxatilis) Current Funding Source: Wallop-Breaux Current Budget:
• Personnel: Number: PI(s) – 1; Permanent Staff – 3; Graduate Students – 1 Budget: $350,000
• Supplies, Equipment, Operations: $100,000 Years in Operation: 20 years (since 1987) Survey Timing:
• Time of year: Spring (late March through early May)
• Frequency: Several times per week during the sampling period
Survey Location(s): James/Rappahannock rivers Survey Gear(s): Multi-panel experimental anchored gill nets and pound nets Survey Procedures: Gill nets are fished twice per week during sampling period. All fish are returned to VIMS and length, weight, age, sex, spawning condition, and other characteristics determined.

61
One pound net is sampled twice per week and fish are processed in an identical manner. Two other pound nets in the Rappahannock River are sampled twice per week and all striped bass > 457mm are tagged, as part of the coast-wide tagging program. Attributes and Limitations:
• Attributes: Survey results are of direct utility to management. • Limitations: Geographic expansion of sampling is desirable.
Recent Collaborations: Wolfgang Vogelbein and David Gauthier, VIMS. Mycobacteriosis infections of striped bass noted. Website: www.fisheries.vims.edu/stripedbass/index.htm
ChesMMAP/Multispecies Conducting Institution: Virginia Institute of Marine Science Current PI(s): Dr. Robert J. Latour, Chris Bonzek Primary Function/Management Data Products: Estimate abundance, vital rates, and food habits for late juvenile-to-adult stages of all species captured in adequate numbers. The species list may vary somewhat from year to year as populations fluctuate, but it generally includes the following: Atlantic croaker, spot, white perch, striped bass, weakfish, blue crab, scup summer flounder, butterfish, harvestfish, bluefish, clearnose skate, and northern kingfish. Abundance estimates, sex ratios, growth rates, age structure, mortality rates, food habits are logged for approximately a dozen species. Target Species: Multiple Current Funding Source: NCBO, Wallop-Breaux Current Budget:
• Personnel: Number: PI(s) – 2; Permanent Staff – 5; Graduate Students – 3 to 4 Budget: $240,000
• Supplies, Equipment, Operations: $150,000 Years in Operation: Since 2002 Survey Timing:
• Time of year: Spring, summer, fall • Frequency: March, May, July, September, November
Survey Location(s): Chesapeake Bay mainstem from Pooles Island, Maryland to the Bay mouth in Virginia

62
Survey Gear(s): 45' (headrope length), 4-seam, bottom trawl with 6" mesh in the body and 3" mesh in the cod end Survey Procedures: Approximately 80 stations per cruise are sampled in a random-stratified design based on latitudinal regions and depth within region. The net is towed for 20 minutes at a speed of approximately 3.5 knots, using net monitoring hardware/ software to assure proper net fishing characteristics. All fish and selected invertebrates are enumerated, and all or a significant sub-sample are measured. A smaller sub-sample is selected for otolith and stomach removal and for sex and maturity stage identification. Attributes and Limitations:
• Attributes: Provides abundance and vital rates data on adult portions of fish stocks not otherwise sampled. Provides fish diet data on geographic and temporal scales not previously possible in the region. The VIMS multi-species group includes the Chesapeake Bay Trophic Interactions Laboratory Services (CTILS) program, which performs stomach analyses for several other surveys.
• Limitations: Short time series; survey samples only the mainstem Bay
Recent Collaborations: Blue crab tagging study; striped bass mycobacteriosis prevalence, distribution, and intensity study; Maryland EPA Coastal 2000 samples Website: www.fisheries.vims.edu/chesmmap
Region 1
Region 2
Region 3
Region 4
Region 5

63
Appendix 5
Assorted Chesapeake Bay Maps

64
Major rivers, cities, and areas of significance in the Chesapeake Bay region

65

66
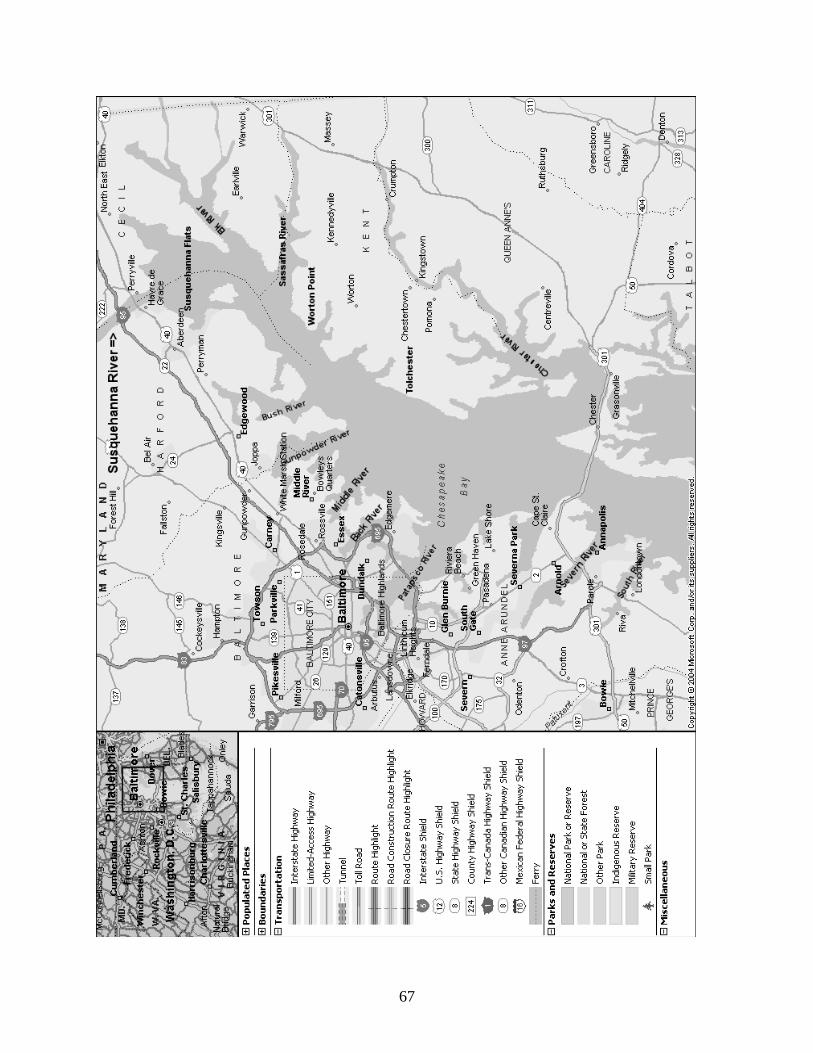
67

68

69

70