Embed Size (px)
Citation preview
1
Bayona-Saez, C., Cruz-Cázares, C., García-Marco, T. and Sánchez García, M. (2017), "Open innovation in the food and beverage industry", Management Decision, Vol. 55 No. 3, pp. 526-546. https://doi.org/10.1108/MD-04-2016-0213
Abstract
Purpose: The aim of this paper is to extend our knowledge into the relationship between open innovation and firm innovative performance. Specifically, we aim to determine whether the benefits of OI practices are different for Food and Beverage (FnB) firms as compared to those of other sectors. The FnB industry is relevant in terms of employment GDP generation in the UE, characterised by high integration and low-tech intensity. Methodology: In order to achieve our goal and obtain robust results, we consider four open innovation dimensions and four innovation performance measures using panel data (2004-2011) from 10,771 FnB and non-FnB firms using Tobit and Logit models by random effects. Findings: We test and confirm the presence of the classical inverted U-shape relationship between OI and firm innovative performance for FnB and non-FnB companies. However, the optimal number of external sources of knowledge used is lesser for FnB than the rest of the companies. Originality: The article compares the OI effects in a tradicional and low-tech industry vs other industries considering four innovation outputs (product innovations, process innovations, incremental and radical innovation).
Keywords: Open Innovation, Innovation Performance,.
JEL code: M21, O32, Q16
2
1. Introduction
Traditionally, firms have innovated by looking in-house for new ideas, technologies,
products and processes that could give them sustainable competitive advantages. The limitation of
these exclusively internal activities is that firms miss out on ideas, knowledge and technology
storage beyond their limitations. However, some firms are aware of these boundaries and have
shifted from a closed innovation strategy to an open innovation strategy (hereafter “OI”), a term
coined by Henry Chesbrough in 2003. The basic idea behind OI is that firms should combine
internal and external ideas and technologies when innovating.
Previous research suggests that OI practices can increase a firm’s return on innovation. It has been
shown, for instance, that OI can contribute to gaining knowledge, reducing costs, shortening time to
market, enhancing innovation performance and increasing sales (Huizingh, 2011; Laursen and
Salter, 2006; Tomlinson, 2010). The question to be addressed is how OI could affect innovation
performance depending on each particular external environment.
In line with the aforementioned question, this paper focuses on the effects of OI practices on
innovation performance by analysing behaviour differences in the traditional food and beverage
(FnB) industry versus other industries. Although usually regarded as a low-intensity innovation
businesses (García-Martinez and Burns, 1999; Grunert et al., 2008; Capitanio et al., 2009 and
2010;), FnB firms show particular features which make them more vulnerable in the context of a
global, changing and unstable environment characterized, among others factors, by a dependence of
the production process on uncontrollable factors such as perishability of products and raw materials.
This sector has further characteristics such as vertical integration along the industry value chain,
many actors in different areas who establish a variety of links and networks, and fast-paced
technological changes which favour cooperation and the development of OI practices (Sarkar and
Costa, 2008, Arranz and Fernández de Arroyabe, 2008, Fortuin and Omta, 2009 and Noordman and
Meijer, 2013).

3
In order to ensure a wider panorama we use two different types of innovation performance
measures. The first is related to the nature of the innovation output, that is, whether it involves a
new process or a new product. The second involves the innovation novelty level, i.e., the percentage
of sales due to products that are new to the market and the percentage of sales due to products that
are only new to the firm. Neither of these innovation-output measurement options is new to the FnB
sector, which previous research has found to produce proportionally more process innovations than
product innovation (Beckeman and Skjöldebrand, 2007; Capitanio et al., 2010). However, product
innovations have recently increased in importance and tend to lean more towards incremental
innovation rather than radical innovation (Galizzi and Venturini, 1996; Grunert et al., 1997; Alarcón
and Sánchez, 2013).
This study uses panel data on Spanish firms covering the 2004-2011 period. The data is drawn from
the Spanish Community Innovation Survey (CIS), which follows the guidelines of the Oslo Manual
(OECD, 1997). The estimation of Tobit and Logit models with random effects enables both
adjustment for endogeneity and inference of causal effects.
The remainder of the paper is structured as follows. Following the Introduction, Section 2 presents a
description of innovative behaviour in Spanish food firms. The theoretical background and the
effects of OI on innovation performance are presented in Section 3. The data and variables are
described in Section 4, and Section 5 provides the openness results on firm innovative performance.
The last section presents the conclusions, contributions and implications, noting the limitations of
the study.
2. The food sector and innovation
The FnB industry is the largest manufacturing sector in the EU in terms of turnover (14.9%) and
value added (12.9%) (Food Drink Europe, 2013-2014 report). Furthermore, this sector accounts for

4
the top manufacturing activity in terms of turnover in several Member States such as France, Spain
and the UK (Food Drink Europe, 2012). In the Spanish case, it accounts for 9.6% of total
manufacturing turnover. In terms of structure, it is heavily weighted towards micro-firms (78%).
Small companies represent 18% and the remaining 4% are medium and large (Eurostat, 2015). 1 The
importance of this sector becomes even greater when we consider its contribution to the
development of rural areas in Spain (Arnalte and Ortiz, 2011) as well as its high level of strength in
times of crisis when compared to other productive sectors (OECD, 2009).
It is a fragmented industry with more than 280,000 firms with an R&D investment of 0.53% in
terms of turnover. In this sense, according to Acosta et al. (2013), the FnB industry is a mature and
relatively low-technology sector dominated by smaller firms as opposed to multinational
companies. Against this background, innovation is one of the most important factors enabling firms
to challenge major competitors in both national and international markets (Rama, 1996, 2008;
Grunert et al., 1997; Capitanio et al., 2009). In more specific terms, innovation trends in the food
sector are geared toward sustainability, a bio-based economy, health, biotechnology and the effects
of climate change (Boehlje et al., 2011, Lybbert and Sumner, 2012). These trends have been
highlighted by a number of authors who insist on the possibility of structural change in this sector
(Sarkar and Costa, 2008 and Seifoldin et al., 2008, among others). An important change in trend
has been identified by Fortuin and Omta (2009) as ‘chain-reversal’, since the sector is moving from
a supply-driven approach to a demand-based approach. Various authors are working on the
importance of consumer drive for innovation (Grunert et al, 2008, Sarkar and Costa, 2008, Fortuin
and Omta, 2009, OECD, 2014, among others).
In terms of type of innovations developed, a further impact on the behaviour of FnB firms is the fact
that this sector’s innovations are predominantly incremental rather than radical (Galizzi and 1 Based on the European Commission’s classification (2005) which defines SMEs as firms with less than 250 employees and total assets of less than EUR 43 million.
5
Venturini, 1996, Grunert et al, 2008). They mostly comprise improvements or variations of existing
products, and patented food technology is highly concentrated. The reason for the predominantly
incremental nature of innovation is related to demand constraints and conservative consumer
behaviour. However, here we note that this traditional stability in the sector is likely to undergo an
important trend change in terms of both complexity and ways of innovation which could result in an
increase in the number or radical innovations, for instance, an area where collaborative options
show good results (Bigliardi and Galati, 2012; García et al., 2014).
In short, various factors favour the use of OI options and may lead this sector to show more interest
in these innovative development paths. These factors include intense collaboration along the
industry value chain (agriculture, food processing and distribution), the pace of technological
change, a mature market, intensive competitiveness and the small company size of a large part of its
productive fabric (García et al., 2014). This is highlighted by various authors who have studied the
effect of OI practices in firms either through case studies (Vanhaverbeke et al., 2007; Sarkar and
Costa, 2008; Fortuin and Omta, 2009; Bigliardi and Galati 2012, and others) or using larger
samples (Alarcón and Sánchez, 2013; Acosta et al., 2013; Bayona et al., 2013; García et al., 2014,
and others). These studies show that OI is the appropriate paradigm for addressing the new
challenges faced by the FnB industry.
3. Theoretical background and hypotheses
Innovation processes are systemic and interactive in nature. Companies therefore hardly ever
innovate on their own but rather in cooperation with various agents. Research on this interactive
process has increased after Chesbrough’s (2003) publication.2 There are various definitions of OI.3
Here we will use the one by the pioneer of the concept: “Open Innovation is the use of purposive
2 According to the ISI Web of Knowledge, the number of articles in the OI field was 26 in 2006, 75 in 2008, 191 in 2009 and 137 in 2012.
3 For an extensive literature review see Gianiodis et al., (2010).
6
inflows and outflows of knowledge to accelerate internal innovation, and expand the markets for
external use of innovation, respectively” (Chesbrough et al., 2006).
Researchers who have reviewed the emerging findings in OI (e.g., Dahlander and Gann, 2010;
Gianiodis et al., 2010; Huizingh, 2011; Lichtenthaler, 2011) have pointed out that it is a broad
concept and that most studies distinguish between inbound and outbound open innovation activities.
While outbound activities are defined as the flow of knowledge which goes from inside to outside
the firm (e.g., patents, licenses and start-up companies), the inbound activities stress that firms can
actively search for new technologies and ideas beyond their boundaries and combine them with
internal knowledge and technologies to achieve new products, processes and technologies and
reduce time to market (Spithoven et al., 2010). These activities comprise exploring knowledge
through integration of ideas, acquisition of patents and other technologies and joint development of
innovation processes through alliances and partnerships. Gassman and Enkel (2004) point out that
while companies which choose the outbound process as their key process are mainly basic research-
driven companies with wide-ranging applications, companies that choose the inbound process are
mainly in low-tech industries. The FnB industry is classified as low tech by the OECD, which
substantiates a focus on inbound activities for these companies.
Research suggests that inbound OI practices can increase a firm’s return on innovation
(Huizingh, 2011; Laursen and Salter, 2006; Tomlinson, 2010). However, following Gassman and
Enkel (2004), in order to make the most of the inbound activities, firms need to be able to
understand and integrate the external knowledge into the firm’s routines (i.e., absorptive capacity).
This is particularly relevant, and challenging, in low-tech sectors such as FnB, given that absorptive
capacity is achieved mainly through internal R&D activities (Cohen and Levinthal, 1990).
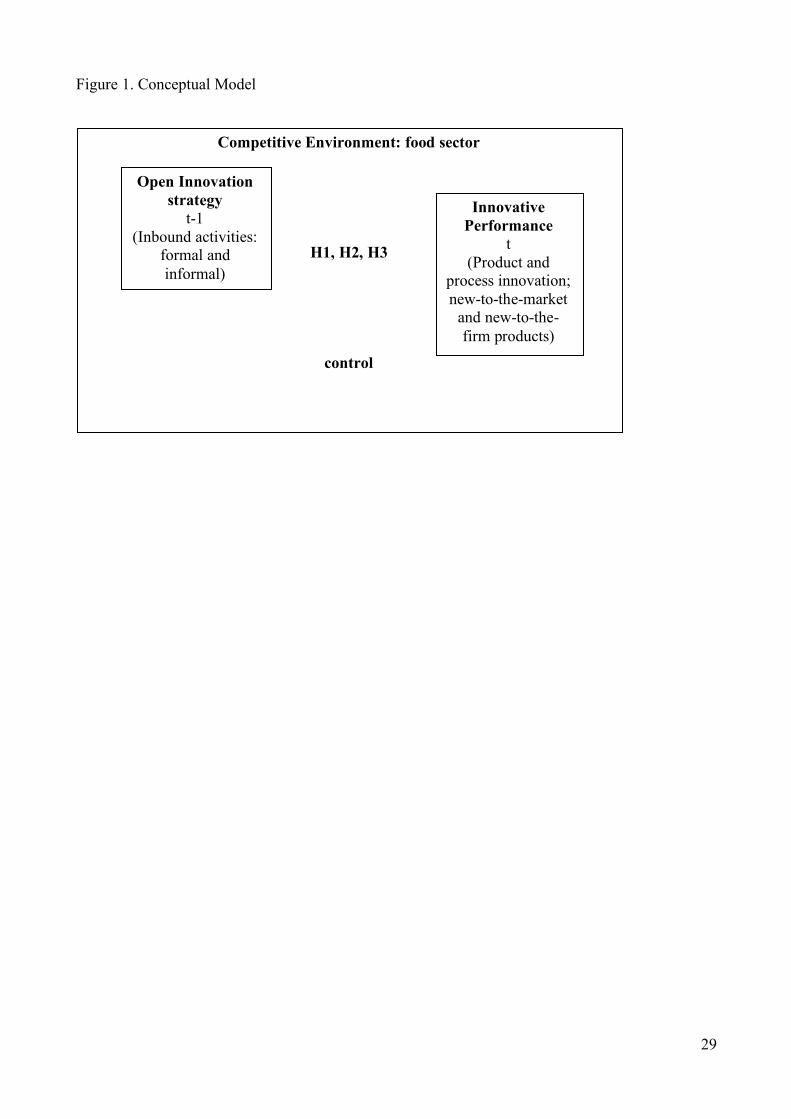
Figure 1 illustrates the model proposed in this article based on the conceptual models put forward
by Vanhaverbeke et al. (2007) and Fortuin and Omta (2009) for the FnB sector. We believe that the
adoption of inbound OI combined with firms’ internal R&D resources will increase the innovation
7
performance of FnB companies. In line with other studies (Bayona and García-Marco, 2010;
Alarcón and Sánchez, 2013), we think that inbound OI activities will not have an immediate effect
on firms’ innovative performance but that this will be observed later in time. The active search for
innovation ideas and the joint implementation of innovation projects with other partners will require
time to mature before their effect materializes in product or process innovations or in sales of
innovative products. Inbound OI activities, both idea searching and alliances, are dynamic
capacities which strengthen a firm’s internal competencies and help sustain competitive advantages
(Eisenhardt and Martin, 2000; Sarkar and Costa, 2008; Ebersberger et al., 2012).
INSERT FIGURE 1 HERE
We used various innovation performance measures and various inbound OI practices to contrast this
model and obtain a wider perspective of the OI phenomenon. The first innovation performance
measure is product innovation, which is the most common one used in studies evaluating the effect
of OI (i.e., Veugelers and Cassiman 2009; Tsai and Wang. 2009). The second one, less used in OI
literature, is process innovation. We also selected this measure because, as stressed before, previous
studies have shown that FnB firms tend to innovate more in processes than in products (Capitanio et
al., 2010). The third one relates to product novelty level, which we define as the percentage of new-
to-market products (radical), versus the percentage of products that are only new to the firm
(incremental). These measures are important because they measure the success (market acceptance)
of innovation outputs.
Inbound Open Innovation is not a single best practice but rather a set of differentiable practices. In
line with other research (Ebersberger et al., 2012, Laursen and Salter, 2006), this paper identifies
different dimensions of OI: the relative importance of the various external information sources used
to innovate; the cooperation agreements the firm has entered into for innovation purposes and the
externalisation of R&D activities.
3.1 External sources of knowledge
8
Our first OI dimension involves mechanisms which expose firms to new information and novel
ideas from outside sources. A firm interested in innovations is more likely to be involved in the
active use of information, but the role of external channels might differ according to the type of
innovation involved (Lee et al., 2010).
We use OI breadth and OI depth, terms coined by Laursen and Salter (2006), to define the diversity
and intensity, respectively, of information-finding activities. External sources of innovation such as
customers, suppliers, competitors and universities can be considered the main elements of a firm’s
search strategy. Previous studies have recognised the strategic importance of a wide range of
knowledge sources for driving innovation (Laursen and Salter, 2006; Sofka and Grimpe, 2010), and
for achieving not only product but also process innovations (Huang and Rice, 2012). In their paper
focused on SMEs, Lee et al. (2010) find that breadth is more closely linked to product innovation
than depth, and while breadth correlates positively with process innovation, depth does not.
Other studies analyse the effect of external sources of knowledge on novelty of innovation. Chiang
and Hung (2010) hypothesise that intensive exploitation of knowledge from a limited number of
external sources (high level of depth) will have a positive impact on incremental innovation.
Exploitative learning involves refining and deepening existing knowledge to enrich current
innovations. Accessing knowledge from a broad range of external channels (high level of breadth),
on the other hand, will relate positively to radical innovation (Chiang and Hung, 2010). Exploratory
learning refers to the pursuit of knowledge leading to further variations, potentially increasing
customer value, and driving radical innovation. Finally, Sofka and Grimpe (2010) find that the use
of several sources of external knowledge impacts positively on radical innovation.
Although Laursen and Salter (2006) generally observe a positive effect of external knowledge
sources on firm innovative performance, they also find that when used in excess OI has a negative
impact i.e., a curvilinear relationship (inverted U-shape). This shape is explained by several factors.
First, absorption of external knowledge is subject to uncertainty since managers can at times find it

9
difficult to ascertain which external source will be the most useful for any given innovative project.
When many sources are used, unrewarding experiences increase. Second, firms sometimes fall into
the trap of over-searching for external knowledge, which can result in an excess of ideas eventually
leading to time and management problems affecting innovative performance. However, sectors
with low-tech opportunities, such as the FnB industry, are likely to present fewer incentives to
search for external sources of knowledge (Laursen and Salter, 2006) and a greater increase of cost
linked to the information excess. Since FnB firms would lack absorptive capacity due to the low
amount or internal R&D, the inverted U-shape effect caused by excess information sources will
present the threshold with a lesser number of external sources compared to the rest of companies.
This leads us to pose the following hypotheses:
H1a: The use of external knowledge sources will result in an inverted U-shape on firm’s innovative
performance.
H1b: The use of external knowledge sources in the FnB industry will result in an inverted U-shape
on firm’s innovative performance, but the optimal number of external knowledge sources will be
lesser.
3.2 Cooperation agreements
The second dimension for measuring openness is innovation-focused cooperation agreements.
Unlike previous measures, this one refers to active cooperation with other agents engaged in
innovative activities, which will also bring a flow of new knowledge into the firm. The complex
nature of the innovation process makes it increasingly necessary for firms to cooperate with other
organisations in order to carry through their research and development initiatives. Therefore, the
more intensely the company interacts with these external agents through cooperation agreements,
the more likely it is to learn about new opportunities.

10
Previous research suggests that a firm can improve its innovation performance by interacting with
different partners. Tomlinson (2010) finds that inter-firm collaboration with suppliers, buyers and
competitors drives product and process innovation. Belderbos et al. (2004) find that R&D
cooperation has a positive effect on innovative performance, although the impact varies according
to the type of partner. Regarding innovation novelty level, Nieto and Santamaría (2007) indicate
that firms receiving information through collaboration with various partners are better positioned to
produce more radical and novel innovations. Their results show that diversity in collaboration is
always positive — both for radical and incremental innovation — but that its impact on radical
innovations is higher.
Nevertheless, a number of alliance scholars (Hoffmann, 2005) note that when the number of
partners is high and the complexity of an alliance portfolio increases, the firm will have to use more
resources to manage this alliance, which could have a negative impact on performance. The
arguments put forward to construct hypothesis 1a in relation to agents’ bounded rationality are valid
in the case of formal cooperation agreements. In addition to these reasons, as noted by Faems et al.,
(2010), the adoption of a diverse technology alliance portfolio requires a wide variety of alliance
management skills that companies often do not have, such as dedicated alliance managers on
payroll. This can lead to an excess of resources allocated to alliances management, which in turn
can weaken the results of the innovation action. In other words, the excessive use of cooperation
agreements has a negative impact on a firm’s innovation performance.
Cooperation activities do take place within traditional and mature sectors, such as the food industry.
Sarkar and Costa (2008) suggest that innovation activities have to be carefully coordinated due to
the number of actors from different sectors involved in food production, coupled with the
heterogeneous requirements of intermediate customers, end users and legislators. Furthermore,
many of the emerging technologies related to new food applications (e.g., nanotechnology) are
being developed outside the processing industry. In order to leverage these ongoing innovation

11
processes, food industry actors must therefore enter into formal arrangements with other entities in
the innovation system. Finally, the establishment of close relationships with other agents
(regulatory bodies, intermediaries and end users) throughout the innovation process is essential to
improve the public acceptance of emerging food technologies and the commercial success of
resulting products (Costa and Jongen, 2006; Vanhaverbeke and Cloodt, 2006). Thus, as in other
industries, we could expect a positive effect on innovation performance of cooperation agreements
in FnB firms. However, since it is a low technology intensity industry, the need for cooperation is
lower than in other, more technology-intense industries where the use of outside sources is more
frequent to boost product development in environments where fast-paced technology changes is the
norm (Manzini et al., 2016). We therefore believe that this collaboration need faced by FnB firms,
although positive, will be lower than with other companies. And given the increased cooperation-
related management costs, the optimal number of partners will be lower than for more high
technology intensity firms.
On the basis of the above evidence, we propose the following hypotheses:
H2a: The establishment of formal cooperation agreements with different partners will result in an
inverted U-shape for firms’ innovation performance.
H2b: The establishment of formal cooperation agreements in FnB firms with different partners will
result in an inverted U-shape on firms’ innovation performance but the optimal number of formal
cooperation agreements sources will be lesser.
3.3 Expenditure on External R&D
The third dimension of OI is the percentage of innovation expenditure allocated to external R&D
activities to represent the degree of openness in R&D activities, one of the most important aspects
of innovation. Since external R&D is generally used in a more selective and partial fashion, Huang
and Rice (2012) hold that it has a weaker impact on innovation performance than the other two OI
dimensions.

12
Some studies (Chen and Yuan 2007; Santamaría et al., 2009, among others) argue that the
acquisition of R&D and technology is less effective than the in-house or combined (in-house and
external) strategies when achieving product and process innovations and sometimes has a negative
impact (Jones et al., 2001; Fey and Birkinshaw, 2005, among others). Cruz-Cázares et al. (2010)
find that in low technology intensity sectors, such as the FnB industry, total reliance on external
R&D has a positive effect on process innovations but not on product innovations. However, they
show that when combined with in-house R&D it has a positive effect on both types of innovation.
With respect to innovation novelty level, Beneito (2006) finds the externalisation of R&D activities
has a positive effect on incremental innovations.
According to Berchicci (2013), externalisation of R&D has an inverted U-shape relationship on
innovative performance. Firms are able to improve their innovation performance by externalising
R&D activities to a moderate degree, whereas firms relying more heavily on external than on
internal R&D witness a decline in their innovative performance, measured by the share of turnover
from new or significantly improved products. Relying heavily on external technology sourcing
increases searching, coordinating and monitoring costs and could hamper the building of path-
dependent knowledge stocks within the firm.
The Alarcón and Sánchez (2013) study, focusing on the food sector, concludes that external R&D
has a positive effect on business performance in the medium term and, as with other companies,
excessive investment on external technology sources would increase coordination problems and
control costs, triggering a drop in innovative performance.
Based on the foregoing evidence, we propose the following hypotheses:
H3a: The externalisation of R&D activities will result in an inverted U-shape for firms’ innovation
performance
H3b: The externalisation of R&D activities in FnB firms will result in an inverted U-shape for
firms’ innovation performance, but the optimal degree of R&D externalisation will be lesser.
13
Absorptive capacity
It is important to highlight the fact that the OI approach does not lead firms to rely exclusively on
external knowledge but rather to combine it with their own knowledge. Several authors
(Chesbrough, 2003; Berchicci, 2013) describe OI as engagement with external knowledge sources
rather than total reliance on them. Firms that do not develop internal R&D and depend entirely on
external sources and partners could have a low ability to fully capture and assimilate external
knowledge.
Absorptive capacity highlights the complementarity between open and closed strategies. Abecassis-
Moedas and Mahmoud-Jouini (2008) define absorptive capacity as a firm’s ability to recognise the
value of external knowledge and to assimilate and apply it to commercial ends. It is through in-
house R&D activities that firms enhance their opportunities to scan and integrate external
knowledge. Investment in R&D increases absorptive capacity and enables firms to benefit from a
larger set of diverse sources of knowledge.
Therefore, in line with other studies (Laursen and Salter, 2006; Sofka and Grimpe, 2010; Huang and
Rice, 2012; Berchicci, 2013) we argue that firms need to have the correct amount of absorptive
capacity in order to reap returns for their OI strategy.
4. Methodological strategy
The database used for this paper is the Spanish Technological Innovation Panel (PITEC) survey, a
data panel covering the 2004 to 2011 period. It was compiled by the Spanish National Statistics
Institute (INE) in collaboration with the Spanish Science and Technology Foundation (FECYT) and
the Foundation for Technological Innovation (COTEC).4 PITEC is designed as a panel survey and
4 Available to researchers at the FECYT site: http://icono.fecyt.es/contenido.asp?dir=05%29Publi/AA%29panel. PITEC started with two samples with data from 2003: a sample of firms with 200 or more employees and a sample of firms with internal R&D expenditures. In 2004, the database included a sample of firms with fewer than 200 employees,
14
compiles the information provided by the Spanish Community Innovation Survey (CIS), which
follows the Oslo Manual guidelines (OECD, 1997).
The total sample includes 75,594 observations from 13,553 Spanish firms. After filtering for
outliers and missing values, our final sample covers 63,337 observations which correspond to
10,771 firms.
The PITEC dataset includes extractive, agri-food, manufacturing and service firms. The food
industry comprises CNAE-2009 codes 10, 11 and 12 (food, beverages, and tobacco) and accounts
for 7.17% (4,539 observations) of the total sample.
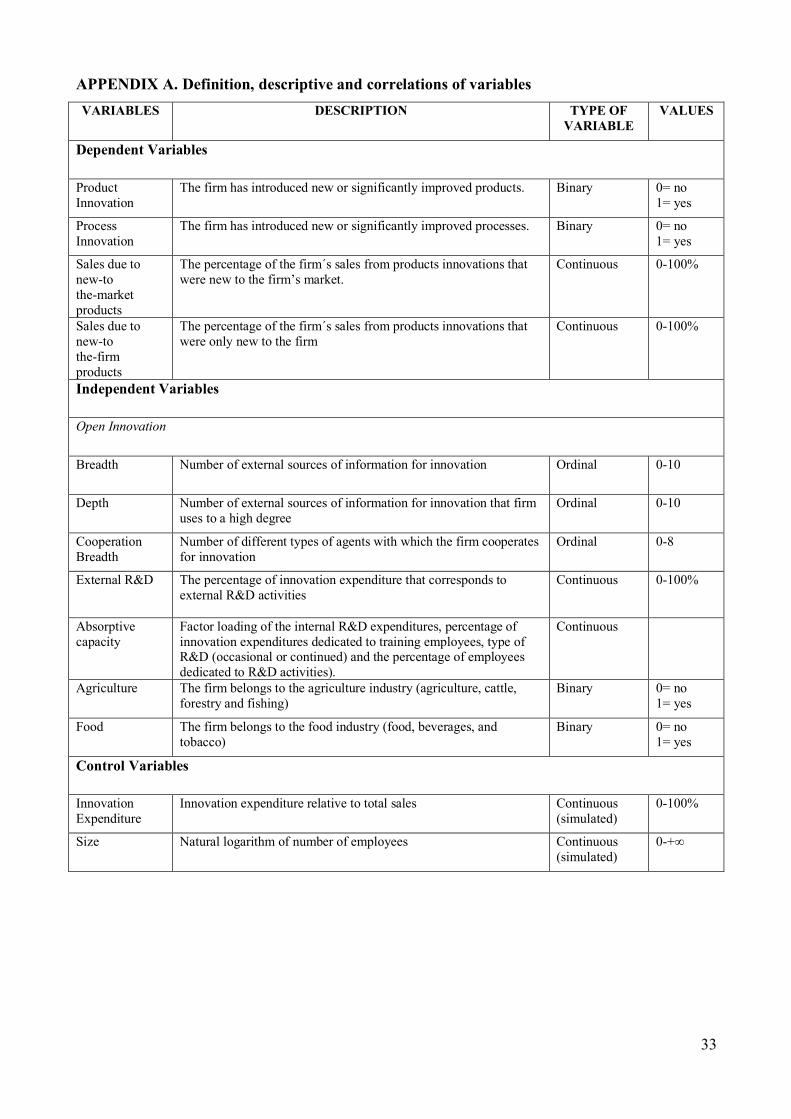
4.1. Dependent variables
Based on our sample data we constructed our first measure of innovative performance using two
dummy variables which take a value of 1 if the firm has achieved product (or process) innovation,
and zero otherwise. According to the Spanish centre for sociological research (CIS), product
innovation is understood as the introduction into the market of a new product or service or a
significantly improved product or service in terms of capabilities, user-friendliness, components or
sub-systems. A process innovation is the implementation of a new or significantly improved
production process, distribution method or support activity for a firm’s products or services. Due to
the dummy characteristics of the variables, we will estimate the effect of OI on these variables
using random-effect Logit models in order to control for heterogeneity across units in the panel.
For the third proxy of innovation performance, we use the share of sales due to new-to-the-market
products (i.e., radical innovations). Finally, PITEC also has information on the share of sales gained
through new-to-the-firm product innovations (i.e. incremental innovations). These indicators of
innovative performance do not merely measure the innovations achieved but also the successful
external R&D expenditure and no internal R&D expenditure and a representative sample of firms with fewer than 200 employees and no innovation expenditure. For further information about the design, indications and collection of data visit: http://icono.fecyt.es/PITEC/Documents/2014/PITECdatabase%20%28May%202014%29.pdf.

15
innovations that reached the market and have been used extensively in the literature (e.g., Veugelers
and Cassiman, 2006; Tsai and Wang, 2009). Since these two performance variables are percentage
measures that by definition are conditioned on values between 0% and 100%, they are both left and
right censored. Therefore, random-effect Tobit regression models are used to test our hypotheses
about how they are affected by OI practices.
4.2. Independent variables
4.2 1. Measuring open innovation
It is worth mentioning that all independent and control variables are lagged by one period to be
consistent with the survey implementation rhythm and avoid simultaneity and reverse causality
problems which are quite common when using CIS data (Mairesse and Mohnen, 2010). By doing
so, we will be capable of observing the real causal inferences (Baum, 2006). Lagged-variable
models have been shown to possess superior predictive validity, particularly when measuring
innovative outcomes (Bradley et al., 2010).
4.2.1.1. External knowledge sources
We here use the concepts which Laursen and Salter (2006) defined as breadth and depth and which
had been extensively used in the OI literature. Breadth refers to the scope of external search, which
is defined as the number of external information sources used by firms in their innovation activities.
The second concept, depth, is defined in terms of how deeply firms draw on their various external
information sources.
Our database features items that capture information sources used throughout firms’ innovation
activities. Respondents are requested to estimate the importance of ten different sources for their
firms using a four-point Likert scale ranging from 0 (“not used”) to 5 (“very important”). These
sources are clients, suppliers, competitors, private laboratories and consultants, universities, public
research centres, technological centres, conferences and trade fairs, journals and scientific papers
and industry associations. The breadth variable is constructed from a combination of the ten
16
aforementioned sources of innovation information. Each source is coded as a binary variable where
0 means “not used” and 1 means “used”. The source codes are then added up to obtain the value of
the breadth variable, which ranges from 0 to 10, where 0 represents non-usage, and 10 stands for
usage of all the external information sources mentioned.
Depth takes into account the same knowledge sources. In this case, a source is coded 1 if rated
“very important”, and 0 otherwise. The ten source codes are then added up to obtain the depth
variable value, which, again, ranges from 0 to 10, where 0 indicates no intense use of any external
knowledge source, and 10 indicates intense usage of all 10 external knowledge sources. Firms
reporting intense usage of a greater number of information sources are assumed to be more open
than the rest in terms of search depth.
4.2.1.2 Cooperation agreements
The second dimension, cooperation, is captured by means of the corresponding survey question,
which asks whether the firm has carried out innovation projects in cooperation with other agents,
and, if so, what type of partner was involved. In order to highlight the mutually interactive nature of
cooperative innovation, the questionnaire explicitly describes it as “active participation with other
firms or non-commercial institutions in innovation activities”. This excludes mere contracting-out
of work with no active co-operation. Potential partners include other companies within the firm’s
business group, suppliers, clients or customers, competitors, consultants, commercial labs and
private R&D institutions, universities and other centres of higher education, public research
organisations and technology centres.
The cooperation breadth variable was constructed by following the same strategy used for external
information sources. In other words, we added up the scores of binary variables used to capture
cooperative innovation activities with each type of partner. A firm cooperating with eight different
partners is assigned a score of eight on the cooperation breadth variable. The score for a firm with
no cooperation agreements for innovation would be zero.
17
This second dimension of the degree of firms’ openness seems to capture an entirely different
element when compared to the breadth of external information sources.
4.2.1.3. External Innovation Expenditure
The third dimension of Open Innovation is expenditure on external innovation. We include a
measure for the percentage of innovation expenditure allocated to external R&D, which includes
R&D services, but not machinery, equipment and training costs.
4.2.2. Absorptive Capacity
As mentioned before, firms that achieve OI practices should have dynamic capabilities for
researching, identifying and assimilating external knowledge. In line with Escribano et al. (2009),
we measured absorptive capacity as the factor loading of internal R&D expenditures, percentage of
innovation expenditures dedicated to training employees,5 type of R&D (occasional or continuing)
and the percentage of employees dedicated to R&D activities). The KMO test (0.766) indicates that
the factor generated is adequate.
4.3 Control variables
We also control for the ratio of innovation expenditure to total sales (Innovation expenditure).
According to CIS, innovation expenditure items include in-house and external R&D, the acquisition
of machinery, equipment and software, the acquisition of external knowledge, innovation-oriented
training, and costs incurred through the market introduction of innovation outputs. Finally, we
control for firm size, measured as the natural logarithm of number of employees.
The model also includes the dummy variable food, which takes the value of 1 when the firm is in
the food sector and zero for the rest of sample. Finally, year dummies are applied to control for
5 In 2004 this variable was not collected. In order to address this gap, the missing 2004 values were replaced by the mean of the 2003 and 2005 values.
18
temporal effects. Appendix A features a table with the means, correlations, standard deviations and
Variance Inflation Factor (VIF) values of each variable.
The highest correlation is 0.43 and the maximum VIF value is 1.43. Both values are far below the
problematic level of 0.75 (Tsui et al., 1995) and 10 (Neter et al., 1996), respectively. Therefore,
there are no serious multicollinearity problems in the models.
5. Results and Discussion
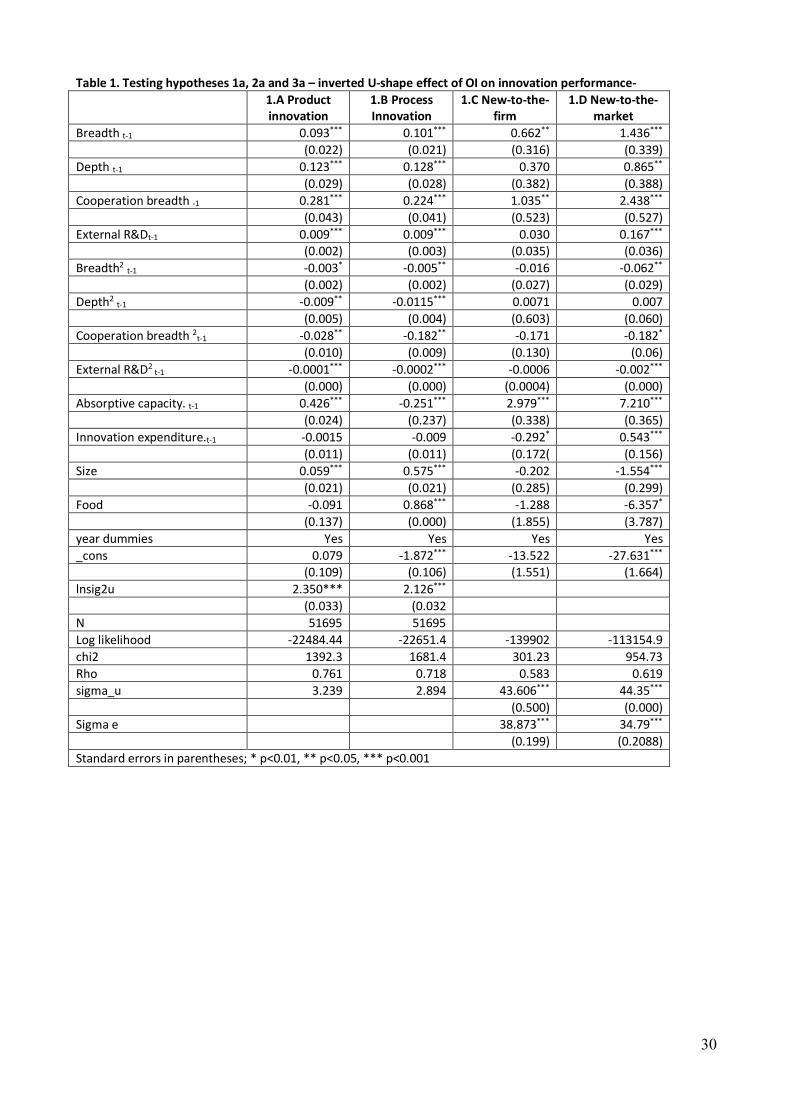
As noted, this article aims to observe if the OI practices have an inverted U-shape effect on
innovation performance and assess if FnB companies will have the same effect but with a lesser
degree of openness. In order to meet with the first goal, in Table 1 we present the estimates of the
random effects Logit and Tobit models for the four dimensions of innovation performance.
In models 1.A and 1.B we can observe that the breadth and depth of external information source
use has a positive and significant effect while the squared term has a negative and significant effect,
confirming the hypothesised inverted U-shape. However, when we look into the new-to-the-firm
and new-to-the-market dimensions, the inverted U-shape is only present for the latter with breadth.
That is, due to the complexity of managing OI activities, too much informal openness could have a
negative impact on the probability of obtaining product or process innovation and a linear impact on
incremental innovations. These results are in line with those of Chiang and Hung (2010). As for
radical innovation, an extensive usage of information sources (breadth) will produce negative
effects on innovation performance, while the use of important information sources (depth) will have
a linear effect. Thus, relying strongly on external information sources could reduce the probability
to innovate but the innovations achieved will be more radical. As a consequence, we can partially
confirm hypothesis 1a for product and process innovation.
INSERT TABLE 1 HERE
In hypothesis 2a we stressed the inverted U-shape effect for cooperation agreements. This
hypothesis can be confirmed for both product and process innovations and for the new-to-the-
19
market innovations (see models 1.A, 1.B and 1.D). Contrary to Nieto and Santamaría (2007), for
new-to-the-firm (model 1.C) innovations cooperation breath seems to have a linear effect on the
share of incremental innovations. For the third OI dimension, external R&D expenditure, we
observe the same pattern as for cooperation agreements. The argued inverted U-shape effect is
present for product, process and new-to-the-market innovations but external R&D seems not to
affect the share of sales due to new-to-the-firm innovations. Therefore, hypotheses 3a can be
partially supported. As model 1.D indicates, FnB firms have a lower likelihood of high turnover due
to new-to-the-market products. That is, food firms are less innovative than other Spanish firms in
terms of innovation novelty. Previous studies have also reported lower innovation output in the FnB
sector (Garcia and Burns, 1999).
As for the control variables used, we can conclude that absorptive capacity has a positive and
significant influence on the achievement of product, new-to-the-firm and new-to-the-market
innovations but, unexpectedly, a negative influence in the development of process innovation. This
might be due to the fact that process innovations are less dependent on firms’ R&D internal
capacity given that they are based on activities such as the acquisition of new machinery or the
implementation of a new distribution method, for instance.
As noted, increased spending on innovation activities does not make firms any more innovative in
terms of product and process. Further, innovation expenditure has a negative and significant effect
on the new-to-the-firm variable but a positive effect on new-to-the-market innovations. This might
indicate that less novelty innovations might not be as dependent on generic innovation activities
such as R&D activities, R&D staff or new machinery, as they are on the daily routines that are
achieved in other departments of the firm.
On the other hand, the Schumpeterian Hypothesis — which posits that large firms are more
innovative thanks to the economies of scale in R&D and the larger store of technological
knowledge and capabilities — is confirmed when we look into the product and process innovations.
20
The larger the firm, the higher its probabilities to innovate. Nevertheless, the negative and
significant size coefficient in model 2.D indicates that SMEs are more innovative that large firms.
This is aligns with previous researchers who argued that SMEs are more innovative thanks to their
entrepreneurial attitude, flexibility and dynamism and lack of bureaucracy (e.g., Gregory et al.,
2002). We consider that this divergence in our results is, in a way, complementary. Large firms
have more probabilities to innovate (product and process) but the ratio of radicalness of those
innovations with the total amount of products offered is smaller than in SMEs. In other words,
SMEs innovate less but the innovations are more radical than innovations achieved by large firms.
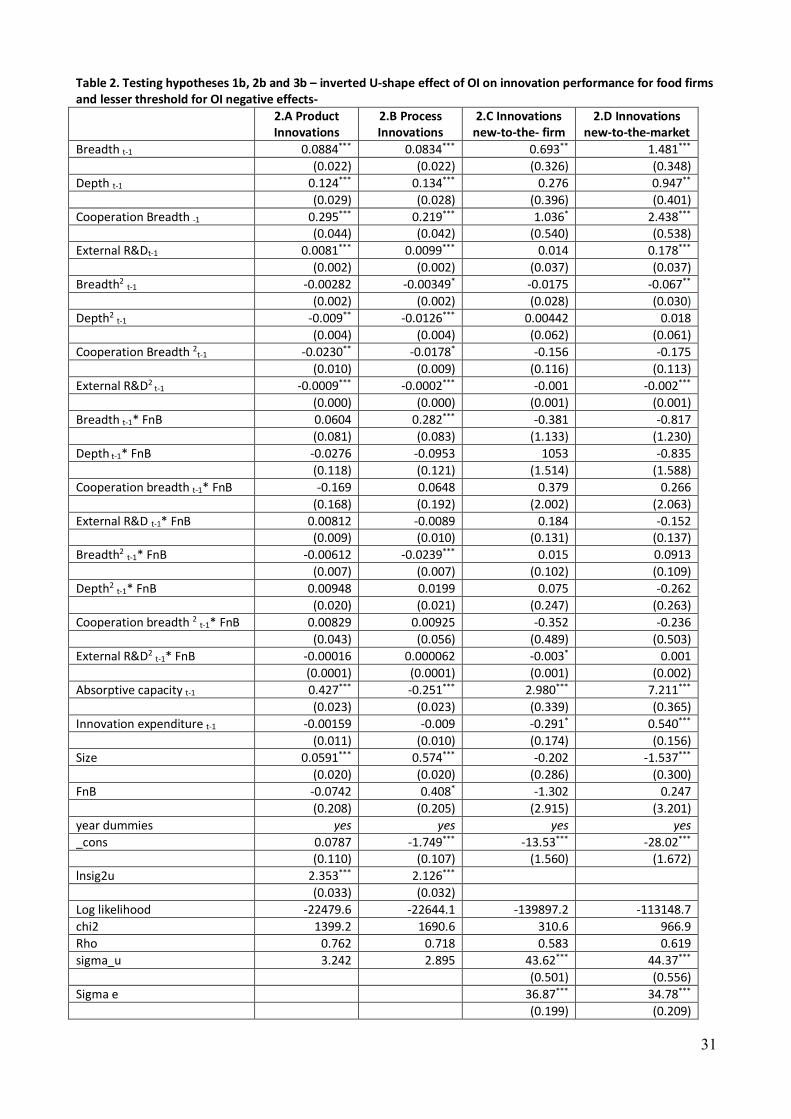
In order to test hypotheses 1b, 2b and 3b we projected the OI practices interaction effect models
and FnB firms as presented in Table 2. In these hypotheses we argued that FnB firms would have
the inverted U-shape as the rest of firms but that the threshold would be achieved with a lesser
openness due to lack of absorptive capacity and their low-tech, SME-predominant, fragmented
industry and value-chain integration industry profile.
-INSERT TABLE 2 HERE-
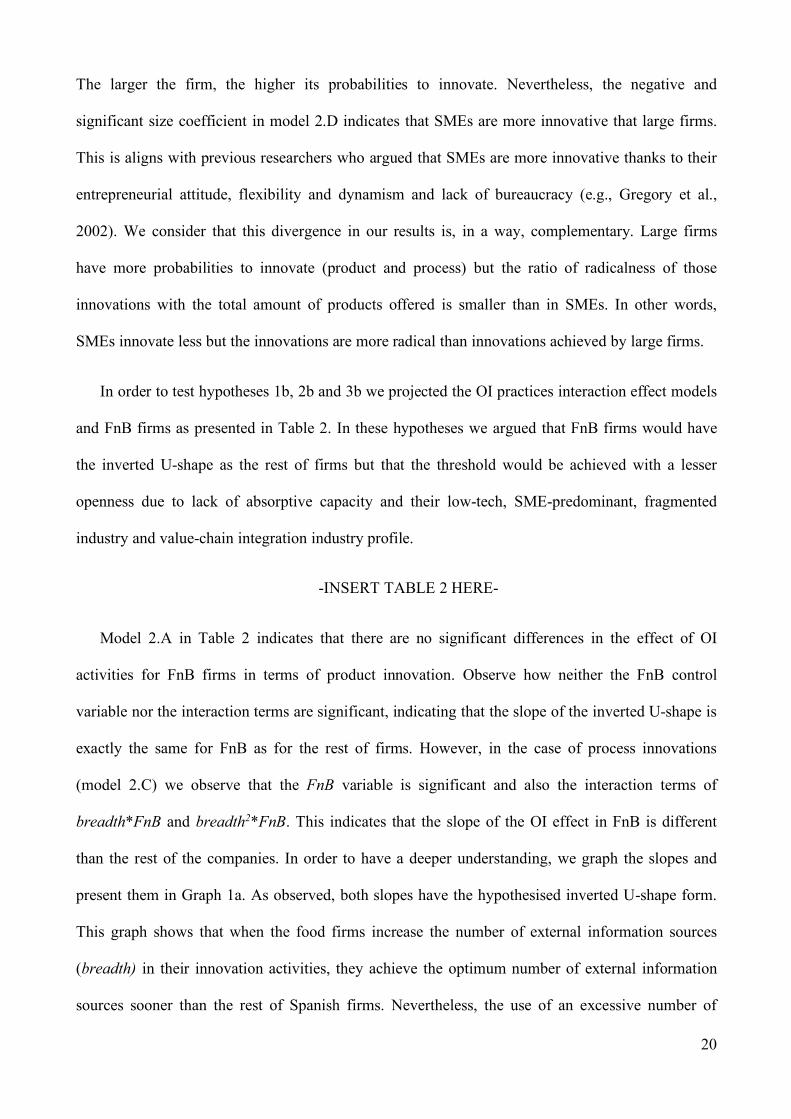
Model 2.A in Table 2 indicates that there are no significant differences in the effect of OI
activities for FnB firms in terms of product innovation. Observe how neither the FnB control
variable nor the interaction terms are significant, indicating that the slope of the inverted U-shape is
exactly the same for FnB as for the rest of firms. However, in the case of process innovations
(model 2.C) we observe that the FnB variable is significant and also the interaction terms of
breadth*FnB and breadth2*FnB. This indicates that the slope of the OI effect in FnB is different
than the rest of the companies. In order to have a deeper understanding, we graph the slopes and
present them in Graph 1a. As observed, both slopes have the hypothesised inverted U-shape form.
This graph shows that when the food firms increase the number of external information sources
(breadth) in their innovation activities, they achieve the optimum number of external information
sources sooner than the rest of Spanish firms. Nevertheless, the use of an excessive number of
21
information sources will cause negative consequences for process innovation sooner than in the rest
of Spanish firms. While FnB firms achieve the maximum likelihood of obtaining process
innovation with 7 external information sources (breadth) the rest of the Spanish firms achieve it
with 12. This might be related to the fact that food firms incur greater monitoring and management
costs than the rest of Spanish firms due to an excessive use of knowledge research because their
interest is on less complex innovation output.
- INSERT GRAPHIC 1 HERE-
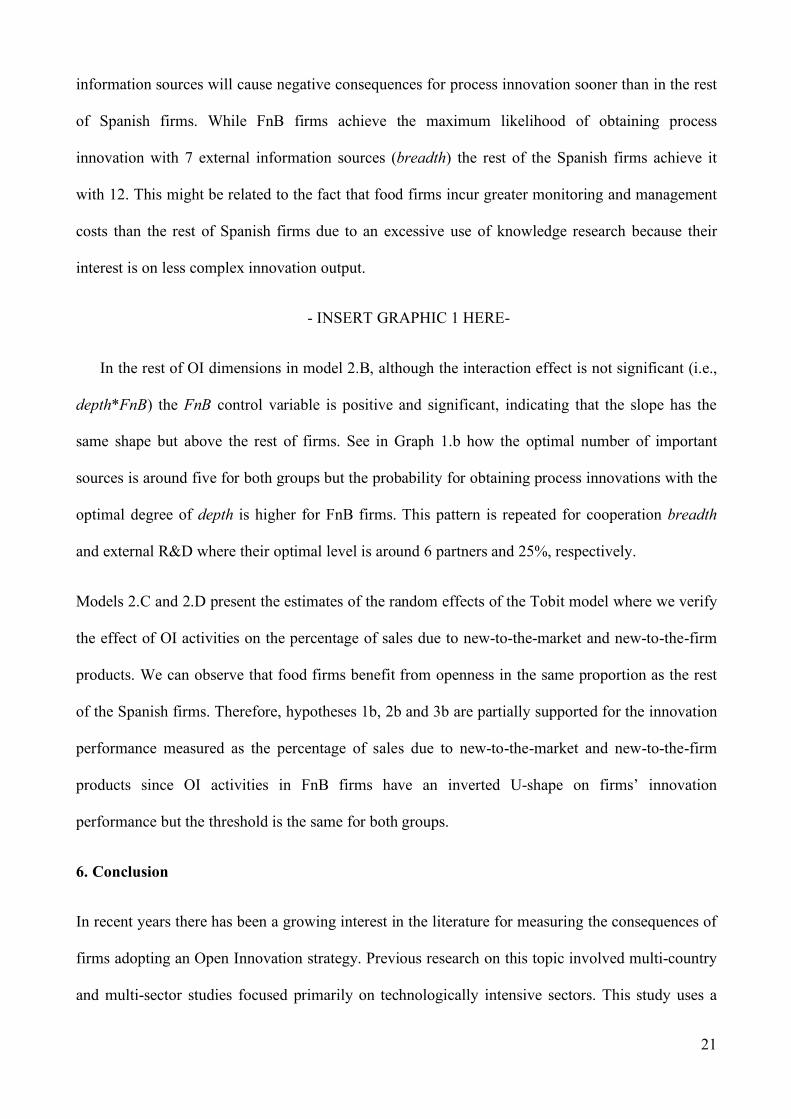
In the rest of OI dimensions in model 2.B, although the interaction effect is not significant (i.e.,
depth*FnB) the FnB control variable is positive and significant, indicating that the slope has the
same shape but above the rest of firms. See in Graph 1.b how the optimal number of important
sources is around five for both groups but the probability for obtaining process innovations with the
optimal degree of depth is higher for FnB firms. This pattern is repeated for cooperation breadth
and external R&D where their optimal level is around 6 partners and 25%, respectively.
Models 2.C and 2.D present the estimates of the random effects of the Tobit model where we verify
the effect of OI activities on the percentage of sales due to new-to-the-market and new-to-the-firm
products. We can observe that food firms benefit from openness in the same proportion as the rest
of the Spanish firms. Therefore, hypotheses 1b, 2b and 3b are partially supported for the innovation
performance measured as the percentage of sales due to new-to-the-market and new-to-the-firm
products since OI activities in FnB firms have an inverted U-shape on firms’ innovation
performance but the threshold is the same for both groups.
6. Conclusion
In recent years there has been a growing interest in the literature for measuring the consequences of
firms adopting an Open Innovation strategy. Previous research on this topic involved multi-country
and multi-sector studies focused primarily on technologically intensive sectors. This study uses a
22
sample of Spanish firms with a focus on the FnB industry, which, despite a poor innovation record,
is currently transitioning towards a situation in which innovation can eventually play a key role. The
options this sector faces include OI activities that fit very well into an industry characterised by a
chain structure (food chain) and a predominance of SMEs.
This study supports and extends the findings of Laursen and Salter (2006) and Berchicci (2013)
about the inverted U-shape relationship between OI practices and innovative performance. For the
new-to-the-market measures we confirm this relationship for the breadth, cooperation breadth and
external R&D parameters. We also conclude that this relationship still applies for product and
process innovation achievement. Therefore, high degrees of formal and informal openness are
detrimental for developing innovation and for appropriating their returns. This might be the case
because an excessive OI can lead firms to fall into a disproportionate use of external knowledge
research, an undue management burden caused by a high number of partners and external costs
which will in turn cause time and management problems negatively affecting innovative
performance. The main finding of this research is that FnB firms show an inverted U-shape
relationship between open innovation practices and performance but the optimal number of external
sources is smaller than the rest of the firms in terms of process innovation. In other words, the FnB
industry does benefit from OI activities but — due to the specific industry features such as low-
tech, mostly SMEs and high integration — too much openness would be more detrimental than for
non-FnB industries.
In conclusion, this study has revealed that, contrary to the traditional view of the FnB sector as a
low-innovation industry, this sector actually has a strong commitment to OI practices. These results
may suggest that OI practices can potentially benefit the industry and other sectors alike, but a
culture of innovation is required if they are to have a positive impact on innovation performance. In
this sense, our estimates highlighted the crucial role of absorptive capacity in order to increase
innovation performance in terms of new product development and rate of sales driven from
23
innovative products. Therefore, firms must combine both internal and external knowledge in order
to gain competitive advantage through innovation.
This study also contributes to the literature since the results presented are based on a large sample
and were estimated using panel data. In contrast to previous related studies (i.e., Laursen and Salter,
2006; Berchicci, 2013) our data structure allows obtaining more robust results and validating the
causal inference of OI practices on innovation performance since models are estimated using panel
data and OI variables in the model are lagged. The paper is also helpful to remind managers that
openness is not the only solution. Too much openness could lead firms to an over-dependency on
their suppliers, thus losing technological expertise and absorptive capacity in the long run
(Bertrand, 2009; Xu et al., 2012) thus harming innovation performance. This paper shows FnB firm
managers that their firms should concentrate on few external information sources if their goal is to
achieve process innovations. Managers should be very precise when selecting their sources as too
many sources will damage their ability to achieve process innovations.
This study is not free of limitations and some of them could be addressed by future research. First,
the focus of this paper was to observe the effects of OI on firms’ innovation performance and no
consideration was given to the drivers that foster food firms to engage, or not, in OI activities. A
possible solution to this would be to perform a two-step Heckman selection model, in which the
first step is to observe whether food firms are more or less prone to openness, due to the
aforementioned specificities, and in the second step make analyse the effect of OI on firm
performance.
Second, the PITEC sample does not allow controlling if the information used (or cooperation with
suppliers, for example) was achieved with only one or more agents and whether it was used more
than once during the year. Developing an in-depth case study analysis might be helpful to clarify
this issue and shed more light into OI literature.

24
Finally, in order to gain deeper knowledge of the effects of OI activities, research is needed to focus
on the role of outbound OI activities, on the drivers that lead firms to follow this strategy and its
consequences.
25
REFERENCES
Abecassis-Moedas, C., and Mahmoud-Jouini, S.B. (2008), “Absorptive capacity and source-recipient complementarity in designing new products: An empirically derived framework”, The Journal of Product Innovation Management, Vol.25, pp.473-490.
Acosta, M., Coronado, D. and Ferrándiz, E. (2013), “Trends in the acquisition of external knowledge for innovation in the food industry”, Open Innovation in the food and beverage industry. Woodhead Publishing Limited. Cambridge. UK. Alarcón, S. and Sánchez, M. (2013), “External and Internal R&D, Capital Investment and Business Performance in the Spanish Agri-Food Industry”, Journal of Agricultural Economics, Vol.64 No.3, pp. 654-675.
Arnalte, E. and Ortiz, D. (2011), “Breaking down the growth of family farms: A case study of an intensive Mediterranean agriculture”, Agricultural Systems, Vol.114, pp. 500-511.
Arranz, N., and Fdez de Arroyabe, J. C. (2008), “The choice of partners in R&D cooperation: An empirical analysis of Spanish firms”, Technovation, Vol.28 No.1, 88-100
Baum, C. (2006), “An introduction to modern econometrics using Stata”. Stata Press, College Station, Texas.
Bayona-Sáez, C. and García-Marco, T. (2010), “Assessing the effectiveness of the Eureka program”. Research Policy, Vol.39, pp. 1375-1386
Bayona-Sáez, C., García-Marco, T., Sánchez-García, M., and Cruz-Cázares, C. (2013), “The effects of open innovation practices of Spanish agri-food firms’ on their innovation performance”, Open innovation in the food and beverage industry. Woodhead Publishing, Chapter. 5 pp. 74-93 Beckeman, M. and Skjöldebrand, C. (2007), “Clusters/networks promote food innovations”. Journal of Food Engineering, Vol.79, pp.1418-1425. Belderbos R., Carree, M. and Lokshin, B. (2004), “Cooperative R&D and firm Performance”, Research Policy, Vol.33 No.10, pp. 1477-1492. Beneito, P. (2006), “The innovative performance of in-house and contracted R&D in terms of patents and utility models”, Research Policy, Vol. 35 No.4, pp. 502-537. Berchicci, L. (2013), “Towards an open R&D system: internal R&D investment, external knowledge acquisition and innovative performance”, Research Policy, Vol. 42, pp. 117-127. Bigliardi, B. and Galati, F. (2012), “Models of adoption of open innovation within the food industry”, Trends in Food Science & Technology. Vol. 30 No.1, 16-26. Boehlje, M., Roucan-Kane, M. and Bröring, S. (2011), “Future agribusiness challenges: Strategic uncertainty, innovation and structural change”, International Food and Agribusiness Management Review, Vol.14 No.5, 53-82.
Bradley, S. W., Wiklund, J. and Shepherd, D.A. (2010), “Swinging a double-edged sword: the effect of slack on entrepreneurial management and growth”, Journal of Business Venturing, Vol. 26 No.5, pp. 537-554. Capitanio, F., Coppola, A. and Pascucci, S. (2009) “Indications for drivers of innovation in the food sector”, British Food Journal, Vol.111 No.8, pp. 820-838. Capitanio, F., Coppola, A. and Pascucci, S. (2010), “Product and process innovation in the Italian food industry”, Agribusiness, Vol.26 No.4, pp. 503-518. Costa, A.I.A. and Jongen, W.M.F. (2006), “New insights into consumer-led food product development”, Trends in Food Science and Technology, Vol.17 No.8, p. 457.

26
Chen, Y. and Yuan, Y. (2007), “The innovation strategy of firms: empirical evidence from the Chinese high-tech industry”, Journal of Technology Management in China, Vol.2 No.2, 145-153. Chesbrough, H. (2003), “Open innovation: the new imperative for creating and profiting from technology”, Harvard Business School Press, Boston, MA. Chesbrough, H., Vanhaverbeke, W. and West, J. (2006), “Open innovation: Researching a new paradigm”, Oxford University Press, New York. Chiang, Y-H. and Hung, K.P. (2010), “Exploring open search strategies and perceived innovation performance from the perspective of inter-organizational knowledge flows”, R&D Management, Vol.40 No.3, pp. 292-299. Cohen, W.M., Levinthal, D. (1990), “Absorptive capacity: A new perspective on learning and innovation”, Administrative Science Quarterly 35, no. 1: 128–42.
Cotec, (2010), “Panel de innovación tecnológica PITEC. Revisión de 2010”, Ed: Fundación Cotec para la Innovación tecnológica. Cruz-Cázares, C., Bayona-Sáez, C. and García-Marco, T. (2010), “R&D Strategies And Firm Innovative Performance: A Panel Data Analysis”, International Journal of Innovation Management, Vol.14 No.6, 1013-1045.
Cruz-Cázares, C., Berends, J.J., Smits, A., Reymen, I., Bayona-Sáez, C., and García-Marco, T. (2012), “BMOI Report: A regional comparison of open innovation practices”. TU/e Printservice, 2012. Dahlander, L. and Gann, D.M. (2010), “How open is innovation?” Research Policy, Vol.39 No.6, 699-709. Ebersberger, B., Bloch, C., Herstad, S. and Van de Velde, E. (2012), “Open Innovation practices and their effect on innovation performance”, International Journal of Innovation and Technology Management, Vol.9, No.6, pp.1-23
Eisenhardt, K.M. and Martin, J. (2000), “Dynamic Capabilities: What are they?”, Strategic Management Journal, Vol. 21, pp. 1105-1121
Escribano, A., Fosfuri, A. and Tribó, J.A. (2009), “Managing external knowledge flows: The moderating role of absorptive capacity”, Research Policy, Vol.38 No.1, 96-105. Eurostat (2015) Structural business statistics.
Eurostat (2015). Agricultural census in Spain. Available at: http://ec.europa.eu/eurostat/statistics-explained/index.php/Agricultural_census_in_Spain#Key_indicators.
Faems, D., De Visser, M., Andries, P., and Van Looy, B. (2010), “Technology Alliance Portfolios and Financial Performance: Value-Enhancing and Cost-Increasing Effects of Open Innovation”, Journal of Product Innovation Management, Vol.27 No.6, 785-796. Fey, C.F. and Birkinshaw, J. (2005), “External sources of knowledge, governance mode, and R&D Performance”, Journal of Management, Vol.31 No.4, 597-621. FoodDrinkEurope (2012-13-14), Data & Trends of the European Food and Drink Industry. Brussels Belgium. Fortuin, F. T. and Omta, S.O. (2009), “Innovation drivers and barriers in food processing”, British Food Journal, 111(8), 839-851.
27
Galizzi, G. and Venturini, L. (1996), “Product innovation in the food industry: Nature, characteristics and determinants”. In G. Galizzi, & L. Venturini (Eds.), Economics of innovation: The case of food industry (pp. 133–156). Heiderlberg: Physica-Verlag.
García-Martínez, M. and Burns, J. (1999), “Sources of technological development in the Spanish food and drink industry. A “supplier dominated” industry?”, Agribusiness, Vol.15 No.4, 431-448.
Gassmann, O. and Enkel, E. (2004), “Towards a theory of open innovation: three core process archetypes”, In R&D Management Conference (Vol. 6), July.
Gianiodis, P. T., Ellis, S.C. and Secchi, E. (2010), “Advancing a typology of open innovation”, International Journal of Innovation Management, Vol.14 No.4, 531-572.
Gregory N.S, Greis, N.P. and Fischer W.F. (2002), “Firm size and dynamic technological innovation”, Technovation, Vol.22 No. 9, pp. 537-549.
Grunert, K.G., Jensen, B.B., Sonne, A.M., Brunso, K., Byrne, D.V., Clausen, C., Friis, A., Holm, L., Hyldig, G., Kristensen, N.H., Lettl, C. and Scholderer, J. (2008), “User oriented innovation in the food sector: relevant streams of research and agenda for future work”, Trends in Food Science and Technology, Vol.19, pp. 590-602.
Hoffmann, W.H. (2005), “How to Manage a Portfolio of Alliances”, Long Range Planning, Vol.38 No.2, pp. 121–143.
Huang, F. and Rice, J. (2012), “Openness in product and process innovation”, International Journal of Innovation Management, Vol.16 No.4, pp.1-24 pages.
Huizingh, E. (2011), “Open innovation: State of the art and future perspectives”, Technovation, Vol.31 No.1, pp.2-9.
Jones, G.K., Lanctot, A. and Teegen, H.J (2001), “Determinants and performance impacts of external technology acquisition”. Journal of Business Venturing, Vol.16 No.3, pp. 255-283.
Laursen, K. and Salter, A. (2006), “Open for innovation: the role of openness in explaining innovation performance among U.K. manufacturing firms”, Strategic Management Journal, Vol. 27, 131-150. Lee, S., Park, G., Yoon, B. and Park, J. (2010), “Open innovation in SMEs-An intermediated network model”, Research Policy, Vol.39 No.2, pp. 290-300. Lichtenthaler, U. (2011), “Open innovation: past research, current debates, and future directions”, Academy of Management Perspectives, Vol. 25, pp. 75-93. Lybbert, T.J. and Sumner, D.A. (2012), “Agricultural technologies for climate change in developing countries: policy options for innovation and technology diffusion”, Food Policy, Vol.37, pp.114-123.
Mairesse, J. and Mohnen, P. (2010), “Using innovations surveys for econometric analysis”, In: Hall, B. H. & Rosenberg, N. (eds), Handbook of the Economics of Innovation. Amsterdam: Elsevier B.V., pp.1129-1155 Neter, J., Kutner, M.H., Nachtsheim, C.J. and Wasserman, W. (1996), “Applied linear regression models. Third Edition”, Times Mirror Higher Education Group, Chicago, Illinois, USA. Nieto, M.J. and Santamaria, L. (2007), “The importance of diverse collaborative networks for the novelty of product innovation”, Technovation, Vol.27, pp.367-377 Noordman, W.H. and Meijer, E.M. (2013), “Open Innovation in the food and beverage industry”. Woodhead Publishing Limited. Cambridge. UK. OECD (2009), “OECD Rural Policy Reviews: Spain”, OECD Publishing. Paris.
OECD (2014) “Innovation and modernizing the Rural Economy”, Rural Policy Reviews.

28
OECD (1997) “Proposed guidelines for collecting and interpreting technological innovation data: Oslo manual”, OECD, Publishing. 2nd (revised) Edition. Rama, R. (1996), “Empirical study on sources of innovation in international food and beverages industry”, Agribusiness, Vol.12 No.2, pp.123-134. Rama, R. (2008), “Handbook of innovation in the food and drink industry”, New York. Haworth Press. Santamaría, L., Nieto, M.J. and Barge-Gil, A. (2009). Beyond formal R&D: taking advantage of other sources of innovation in low- and medium technology industries. Research Policy, Vol.38 No.3, pp.507-517.
Sarkar, S. and Costa, A.I. (2008). Dynamics of open innovation in the food industry. Trends in Food Science & Technology, Vol.19 No.11, pp.574-580.
Sofka, W. and Grimpe, C. (2010). Specialized search and innovation performance – evidence across Europe. R&D Management, Vol.40 No.3, pp.310-323.
Spithoven, A., Clarysse, B. and Knockaert, M. (2010). Building absorptive capacity to organise inbound open innovation in traditional industries. Technovation, Vol.30, pp.130-141.
Tomlinson, P.R. (2010). Co-operative ties and innovation: some new evidence for UK manufacturing. Research Policy 39, 762–775.
Tsai, K. and Wang, J. (2009). External technology sourcing and innovation performance in LMT sectors: An analysis based on the Taiwanese Technological Innovation Survey. Research Policy, Vol.38, No.3, pp. 518–526. Tsui, A., Ashford, S., Clair, L. and Xin, K. (1995), Dealing with discrepant expectations: response strategies and managerial effectiveness. Academy of Management Journal, Vol.38, pp.1515-43 Vanhaverbeke, W. and Cloodt, M. (2006), “Open innovation in value networks”, in Chesbrough, H.,Vanhaverbeke, W. and West, J. (Eds), Open Innovation Researching a New Paradigm, Oxford University Press, Oxford
Vanhaverbeke, W.P.M., De Rochemont, M.H., Meijer, E. and Roijakkers, A.H.W.M. (2007), “Open innovation in the agri-food sector”, Research paper commissioned by TransForum.
Veugelers, R. and Cassiman, B. (2006), “In search of complementarity in innovation strategy: Internal R&D and external knowledge acquisition”, Management Science, Vol.52, No.1, 68–82. doi:10.1287/mnsc.1050.0470.
29
Figure 1. Conceptual Model
Competitive Environment: food sector
H1, H2, H3
control
Open Innovation strategy
t-1 (Inbound activities:
formal and informal)
Innovative Performance
t (Product and
process innovation; new-to-the-market
and new-to-the-firm products)
30
Table 1. Testing hypotheses 1a, 2a and 3a – inverted U-shape effect of OI on innovation performance- 1.A Product
innovation 1.B Process Innovation
1.C New-to-the-firm
1.D New-to-the-market
Breadth t-1 0.093*** 0.101*** 0.662** 1.436*** (0.022) (0.021) (0.316) (0.339) Depth t-1 0.123*** 0.128*** 0.370 0.865** (0.029) (0.028) (0.382) (0.388) Cooperation breadth -1 0.281*** 0.224*** 1.035** 2.438*** (0.043) (0.041) (0.523) (0.527) External R&Dt-1 0.009*** 0.009*** 0.030 0.167*** (0.002) (0.003) (0.035) (0.036) Breadth2 t-1 -0.003* -0.005** -0.016 -0.062** (0.002) (0.002) (0.027) (0.029) Depth2 t-1 -0.009** -0.0115*** 0.0071 0.007 (0.005) (0.004) (0.603) (0.060) Cooperation breadth 2t-1 -0.028** -0.182** -0.171 -0.182* (0.010) (0.009) (0.130) (0.06) External R&D2
t-1 -0.0001*** -0.0002*** -0.0006 -0.002*** (0.000) (0.000) (0.0004) (0.000) Absorptive capacity. t-1 0.426*** -0.251*** 2.979*** 7.210*** (0.024) (0.237) (0.338) (0.365) Innovation expenditure.t-1 -0.0015 -0.009 -0.292* 0.543*** (0.011) (0.011) (0.172( (0.156) Size 0.059*** 0.575*** -0.202 -1.554*** (0.021) (0.021) (0.285) (0.299) Food -0.091 0.868*** -1.288 -6.357* (0.137) (0.000) (1.855) (3.787) year dummies Yes Yes Yes Yes _cons 0.079 -1.872*** -13.522 -27.631*** (0.109) (0.106) (1.551) (1.664) lnsig2u 2.350*** 2.126*** (0.033) (0.032 N 51695 51695 Log likelihood -22484.44 -22651.4 -139902 -113154.9 chi2 1392.3 1681.4 301.23 954.73 Rho 0.761 0.718 0.583 0.619 sigma_u 3.239 2.894 43.606*** 44.35*** (0.500) (0.000) Sigma e 38.873*** 34.79*** (0.199) (0.2088) Standard errors in parentheses; * p<0.01, ** p<0.05, *** p<0.001
31
Table 2. Testing hypotheses 1b, 2b and 3b – inverted U-shape effect of OI on innovation performance for food firms and lesser threshold for OI negative effects-
2.A Product Innovations
2.B Process Innovations
2.C Innovations new-to-the- firm
2.D Innovations new-to-the-market
Breadth t-1 0.0884*** 0.0834*** 0.693** 1.481*** (0.022) (0.022) (0.326) (0.348) Depth t-1 0.124*** 0.134*** 0.276 0.947** (0.029) (0.028) (0.396) (0.401) Cooperation Breadth -1 0.295*** 0.219*** 1.036* 2.438*** (0.044) (0.042) (0.540) (0.538) External R&Dt-1 0.0081*** 0.0099*** 0.014 0.178*** (0.002) (0.002) (0.037) (0.037) Breadth2 t-1 -0.00282 -0.00349* -0.0175 -0.067** (0.002) (0.002) (0.028) (0.030) Depth2 t-1 -0.009** -0.0126*** 0.00442 0.018 (0.004) (0.004) (0.062) (0.061) Cooperation Breadth 2t-1 -0.0230** -0.0178* -0.156 -0.175 (0.010) (0.009) (0.116) (0.113) External R&D2
t-1 -0.0009*** -0.0002*** -0.001 -0.002*** (0.000) (0.000) (0.001) (0.001) Breadth t-1* FnB 0.0604 0.282*** -0.381 -0.817 (0.081) (0.083) (1.133) (1.230) Depth t-1* FnB -0.0276 -0.0953 1053 -0.835 (0.118) (0.121) (1.514) (1.588) Cooperation breadth t-1* FnB -0.169 0.0648 0.379 0.266 (0.168) (0.192) (2.002) (2.063) External R&D t-1* FnB 0.00812 -0.0089 0.184 -0.152 (0.009) (0.010) (0.131) (0.137) Breadth2 t-1* FnB -0.00612 -0.0239*** 0.015 0.0913 (0.007) (0.007) (0.102) (0.109) Depth2 t-1* FnB 0.00948 0.0199 0.075 -0.262 (0.020) (0.021) (0.247) (0.263) Cooperation breadth 2 t-1* FnB 0.00829 0.00925 -0.352 -0.236 (0.043) (0.056) (0.489) (0.503) External R&D2 t-1* FnB -0.00016 0.000062 -0.003* 0.001 (0.0001) (0.0001) (0.001) (0.002) Absorptive capacity t-1 0.427*** -0.251*** 2.980*** 7.211*** (0.023) (0.023) (0.339) (0.365) Innovation expenditure t-1 -0.00159 -0.009 -0.291* 0.540*** (0.011) (0.010) (0.174) (0.156) Size 0.0591*** 0.574*** -0.202 -1.537*** (0.020) (0.020) (0.286) (0.300) FnB -0.0742 0.408* -1.302 0.247 (0.208) (0.205) (2.915) (3.201) year dummies yes yes yes yes _cons 0.0787 -1.749*** -13.53*** -28.02*** (0.110) (0.107) (1.560) (1.672) lnsig2u 2.353*** 2.126*** (0.033) (0.032) Log likelihood -22479.6 -22644.1 -139897.2 -113148.7 chi2 1399.2 1690.6 310.6 966.9 Rho 0.762 0.718 0.583 0.619 sigma_u 3.242 2.895 43.62*** 44.37*** (0.501) (0.556) Sigma e 36.87*** 34.78*** (0.199) (0.209)

32
0
0,05
0,1
0,15
0,2
0,25
0,3
1 2 3 4 5 6 7 8 9 10 11 12 13 14 15
Rest of the firms FnB
Standard errors in parentheses; * p<0.01, ** p<0.05, *** p<0.001 Graphic 1: Slopes for innovation performance and open innovation practices
1.a Breadth and process innovation
1.b Depth and process innovations
0
0,1
0,2
0,3
0,4
0,5
1 2 3 4 5 6 7 8 9 10 11 12 13 14 15
Rest of the firms FnB
33
APPENDIX A. Definition, descriptive and correlations of variables VARIABLES DESCRIPTION TYPE OF
VARIABLE VALUES
Dependent Variables
Product Innovation
The firm has introduced new or significantly improved products. Binary 0= no 1= yes
Process Innovation
The firm has introduced new or significantly improved processes. Binary 0= no 1= yes
Sales due to new-to the-market products
The percentage of the firm´s sales from products innovations that were new to the firm’s market.
Continuous 0-100%
Sales due to new-to the-firm products
The percentage of the firm´s sales from products innovations that were only new to the firm
Continuous 0-100%
Independent Variables
Open Innovation
Breadth Number of external sources of information for innovation Ordinal 0-10
Depth Number of external sources of information for innovation that firm uses to a high degree
Ordinal 0-10
Cooperation Breadth
Number of different types of agents with which the firm cooperates for innovation
Ordinal 0-8
External R&D The percentage of innovation expenditure that corresponds to external R&D activities
Continuous 0-100%
Absorptive capacity
Factor loading of the internal R&D expenditures, percentage of innovation expenditures dedicated to training employees, type of R&D (occasional or continued) and the percentage of employees dedicated to R&D activities).
Continuous
Agriculture The firm belongs to the agriculture industry (agriculture, cattle, forestry and fishing)
Binary 0= no 1= yes
Food The firm belongs to the food industry (food, beverages, and tobacco)
Binary 0= no 1= yes
Control Variables
Innovation Expenditure
Innovation expenditure relative to total sales Continuous (simulated)
0-100%
Size Natural logarithm of number of employees Continuous (simulated)
0-+∞

34
Mean, Standard Deviation, Correlations between variables
Variables Mean Std. Dev. 1 2 3 4 5
1. Radical innov. 11.63 24.37 1
2. Incremental innov.
15.80 28.54 -0.0535* 1
3. Product innov. 0.67 0.47 0.3345* 0.3882* 1
4. Process innov.
0.69 0.46 -0.0006 -0.0004 0.0197* 1
5. Breadth
5.84 3.44 0.1160* 0.0417* 0.2203* 0.1042* 1
6. Depth
1.18 1.54 0.0957* 0.0333* 0.1335* 0.0682* 0.4310*
7. Breadth_coop
0.56 1.12 0.0866*
0.0103 0.1396* 0.1019* 0.2759*
8. External R&D
9.57 21.36 0.0052 -0.0038 -0.0036 -0.0066 0.0973*
9. AbsCap
-0.05 1.02 0.1626* 0.0537* 0.2599* -0.0271* 0.3828*
10. Innov. Exp.
0.21 1.82 0.0566* 0.0167* 0.0019 -0.0395* 0.0458*
11. Size
4.09 1.63 -0.0884* -0.0426* -0.000 0.1952* 0.0851*
12. Agriculture
0.01 0.12 -0.004 -0.0255* -0.0334* -0.0021 0.0082
13. Food
0.07 0.26 -0.0456* -0.0061 -0.0056 0.0616* 0.0258*
VIF ---- ---- ---- ---- 1.43
Variables 6 7
8 9 10 11 12 13
6. Depth 1
7. Breadth_coop 0.2470*
1
8. Internal Info. 0.0684*
0.1025*
1
9. Internal R&D 0.2248*
0.2171*
-0.0786* 1
10. External R&D 0.0603*
0.0517*
0.0105 0.0843* 1
11. Innov. Exp. 0.0078 0.1256*
0.0559* -0.0024 -0.0907* 1
12. Size 0.0140*
0.0211*
0.0168* 0.0149* -0.0025 -0.0414* 1
13. Agrifood 0.0051 -0.008 -0.0014 -0.0324* -0.0240* 0.0408* -0.0337* 1
VIF 1.26 1.23 1.15 1.04 1.04 1.02 1.01 1.00