Embed Size (px)
Citation preview

09.09.2010
1
[National Telford Institute and Scottish Informatics and Computer Science Alliance, Glasgow University, Sept 8, 2010 ]
Bayesian Networks for Modeling and Managing Risks of Natural Hazards
Daniel StraubEngineering Risk Analysis GroupTU München
Decisions in complex systems under conditions of uncertainty
Aging of the infrastructuresystem:‐Monitoring & Inspection‐MaintenanceR l t / d i
Natural hazards in the system„built environment“‐ Prevention‐ Emergency responseR h bilit ti
Safety in the system „society“‐ Target reliability‐ Prescriptive limits‐ Service life duration
‐ Replacement / redesign ‐ Rehabilitation
2

09.09.2010
2
Vision
• Decision support systems which:– Provide accurate assessments of system state at all timesProvide accurate assessments of system state at all times– Include state-of-the-art models– Account for past observations– Use near-real-time observation– Suggest optimal decisions
3Bensi M.T. (2010). PhD thesis, UC Berkeley.
What to expect
• Part A: Bayesian network in a nutshell– Exemplified with EQ risk management examplesExemplified with EQ risk management examples
• Part B: Applications of Bayesian networks (ongoing)– Avalanche risk assessment– Wildfire risk– Flood detection– Deterioration
4
Deterioration– Earthquake
• Part C: Discussion
09.09.2010
3
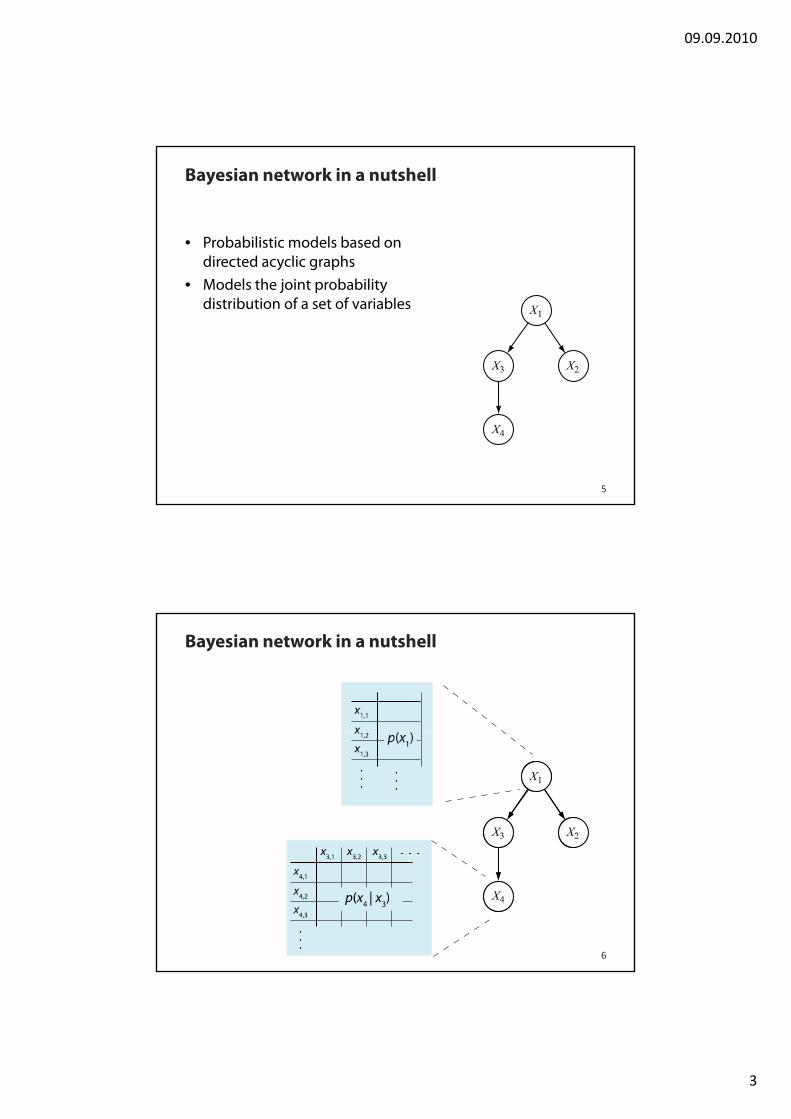
Bayesian network in a nutshell
• Probabilistic models based on directed acyclic graphsdirected acyclic graphs
• Models the joint probability distribution of a set of variables
5
Bayesian network in a nutshell
6

09.09.2010
4
Bayesian network in a nutshell
• Efficient factoring of the joint probability distribution intoprobability distribution into conditional (local) distributions given the parents
)|()|()|()(
),,,(
3413121
4321
xxpxxpxxpxp
xxxxp
Here:
7
3413121
])(|[)(1
n
iii xpaxpp x
General:
Bayesian network in a nutshell
• Facilitates Bayesian updating when additional information (evidence)additional information (evidence) is available
)(
),()|(
2
3223 ep
xepexp
E.g.:
8
2
1
)|()(
)|()|()(
121
13121
X
X
xepxp
xxpxepxp e

09.09.2010
5
• Tsunami warning example:
Bayesian network is a powerful modeling tool
9
Computational benefits through conditional independence assumptions
Straub D., (2010). Lecture notes. TU München
Modelling with BN: System dependence through common factors
• Performance of an electrical substation during an EQ
0.5
0.6
0.7
0.8
0.9
1
agili
ty
10
0 0.1 0.2 0.3 0.4 0.5 0.6 0.7 0.8 0.90
0.1
0.2
0.3
0.4
0.5
PGA [g]
Fra
gi

09.09.2010
6
System fragility
• Redundant system:(parallel system with 100 Parallel system TR 1
5 components)
10− 4
10− 3
10− 2
10− 1
Syst
em fr
agili
ty
13
0 0.1 0.2 0.3 0.4 0.5 0.6 0.7 0.8 0.910− 6
10− 5
10
PGA [g]
Including dependenceNeglecting dependence
Straub D., Der Kiureghian A. (2008). Structural Safety, 30(4), pp. 320‐366.
Modelling complex systems using BN:Object-oriented BN
• Principles of object-oriented programming can be applied.
14Straub D., Der Kiureghian A., (2010). Journal of Engineering Mechanics, in print

09.09.2010
7
Bayesian networks can be extended to decision graphs as a tool for optimizing decisions
• Example: EQ emergency response:Seismic demand
Bridge condition
Observable condition
15Bensi M.T. (2010). PhD thesis, UC Berkeley.
• Two types of information:– Data obtained from previous projects and investigations
How do we use information updating?
Data obtained from previous projects and investigations– Observations made during the actual application
• Model Y = g(X,A)– A: Model parameters– X: Observables
16

09.09.2010
8
• Two types of information:– Data obtained from previous projects and investigations
How do we use information updating?
Data
Data obtained from previous projects and investigations– Observations made during the actual application
• Model Y = g(X,A)– A: Model parameters– X: Observables
17
• Two types of information:– Data obtained from previous projects and investigations
How do we use information updating?
Data obtained from previous projects and investigations– Observations made during the actual application
• Model Y = g(X,A)– A: Model parameters– X: Observables
18
PastPresent/future

09.09.2010
9
• Two types of information:– Data obtained from previous projects and investigations
How do we use information updating?
Data obtained from previous projects and investigations– Observations made during the actual application
• Model Y = g(X,A)– A: Model parameters– X: Observables
19
• Optimizedecisions:
Decision
Consequences
What to expect
• Part A: Bayesian network in a nutshell– Exemplified with EQ risk management examplesExemplified with EQ risk management examples
• Part B: Applications of Bayesian networks (ongoing)– Avalanche risk assessment– Wildfire risk– Flood detection– Deterioration
21
Deterioration– Earthquake
• Part C: Discussion

09.09.2010
10
Avalanche riskassessment
• Where is it safe to build?• Where should protection• Where should protection
measures beimplemented?
• When should roads beclosed / buildings beevacuated?
22
Source: Kt. St. Gallen, Switzerland
Bayesian networks for avalanche risk assessment
23Grêt‐Regamey A., Straub D. (2006). Natural Hazards and Earth System Sciences, 6(6), pp. 911‐926.
09.09.2010
11
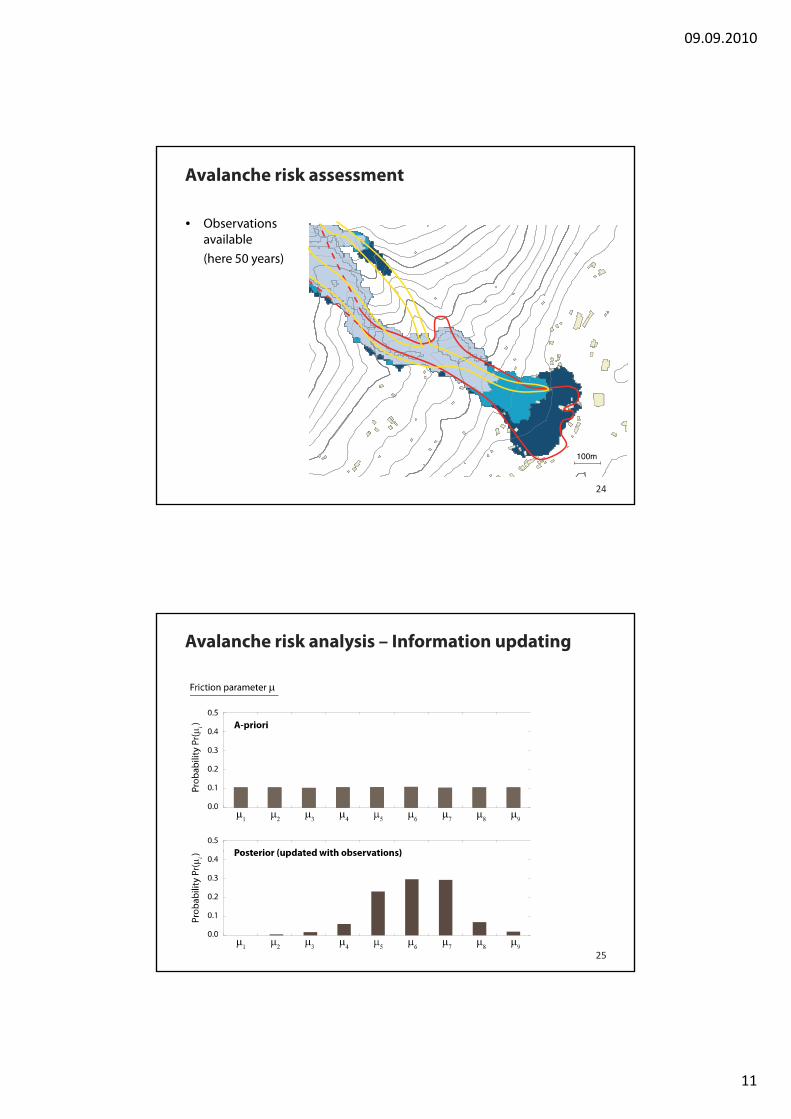
Avalanche risk assessment
• Observationsavailable(here 50 years)
24
Avalanche risk analysis – Information updating
25

09.09.2010
12
Avalanche risk analysis
26Straub D., Grêt‐Regamey A. (2006). Cold Regions Science and Technology, 46(3) , pp. 192‐203.
Bayesian networks for avalanche risk assessment
27Grêt‐Regamey A., Straub D. (2006). Natural Hazards and Earth System Sciences, 6(6), pp. 911‐926.

09.09.2010
13
Implementation of the BN modelsin software is straightforward
• Implementation in a GIS environmentGIS environment
• Regional risk analysis
28Grêt‐Regamey A., Straub D. (2006). Natural Hazards and Earth System Sciences, 6(6), pp. 911‐926.
BN for wildfire risk management
29

09.09.2010
14
Weather Stationx
Case study: Rhodes
Municipality
30
BN model
Geography
31

09.09.2010
15
HumanPopulationdensity
Land Cover
32
BN input is obtained from GIS
• E.g. elevation
33

09.09.2010
16
Automatic flood detection from satelite images
Flooded
34
Flooded
PossiblyTrafficable
Trafficable
FloodedTrafficable
with Daniel Frey, Chair of Remote Sensing, TUM
Automatic flood detection from satelite images
• BN: Combining the flood model (elevation) with satelite data
Elelvationwith satelite data
Visibleobject
Clouds Flooded
e
35with Daniel Frey, Chair of Remote Sensing, TUM
Grey channels
e

09.09.2010
17
Detection of flooded objects using GIS andremote sensing data
θ2θ1θ θT…
d2d1 dT…d0
U1 V2 XT
θ3
d3
W3
36with Daniel Frey, Chair of Remote Sensing, TUM
U,V,W,X: observations from different sensorsθ: Altitude from DEMd: damage index (flooded or not flooded)
Detection of flooded objects using GIS andremote sensing data – including damage models
θk : altitude of object
States:
[θ1, … θk]θ
n: number of bands
[flooded,not flooded]
[c1, c1, …cm]
[c c c ]
object
c
d
i: number of pixels in object
c: classes(i.e. water, forest, road …)
m: number of classes
g: grayvalues
37with Daniel Frey, Chair of Remote Sensing, TUM
…g2 gn …g1 g2 gn …g1 g2 gn
pixel 1 pixel 2 pixel i
c [c1, c1, …cm]
[0 … 255]
pixel
c c
…g1

09.09.2010
18
Automatic flood detection from satelite images
Flooded
38
Flooded
PossiblyTrafficable
Trafficable
FloodedTrafficable
with Daniel Frey, Chair of Remote Sensing, TUM
Managing deterioration through inspection and monitoring
39

09.09.2010
19
DBN model for deterioration modeling
m m1 m2 m3 mTC
q1 q2
a0 a1 a2
q3
a3
qT
aT
qS
40
Inspection
Failure/survival E1
Z1
E2
Z2
E3
Z3
ET
ZT
Straub D. (2009). Journal of Engineering Mechanics, 135(10), pp. 1089‐1099
Calculations are robust AND efficient
41Straub D. (2009). Journal of Engineering Mechanics, 135(10), pp. 1089‐1099

09.09.2010
20
Performance of buildings subject to hazards:Combining continuous and discrete random variables
Measurements
Structural model:
R1
R2 R3 R4
R5
H
V
5m
42
1 5
5m 5m
Straub D., Der Kiureghian A., (2010). Journal of Engineering Mechanics, in print
Performance
Combining exact BN inference algorithms with structural reliability methods
• Eliminate continuous RV (nodes):
Y2
Y1
Y3
X1
Y5
Y4
Y6
Y2
Y1
Y3
X1
Y5
Y4
Y6
reverse (X1,Y5)
Y2
Y1
Y3
X1
Y5
Y4
Y6
reverse (X1,Y6)
Y2
Y1
Y3
Y5
Y4
Y6
remove X1
43
• Compute new conditional PMF using FORM
Y7
Y5 Y6
Y7
Y5 Y6
Y7
Y5 Y6
Y7
Y5 Y6
Straub D., Der Kiureghian A., (2010). Journal of Engineering Mechanics, in print

09.09.2010
21
Enhanced BN:
• Eliminate continuous RV (nodes):
Structural model:
R1
R2 R3 R4
R5
H
V
5m
44
• Compute new conditional PMF using FORM
Straub D., Der Kiureghian A., (2010). Journal of Engineering Mechanics, in print
Reliability of an infrastructure system
45
• Determine the reliability (connectivity) under evolvinginformation on hazards, system performances, measurement
Straub D., Der Kiureghian A., (2010). Journal of Engineering Mechanics, in print
09.09.2010
22
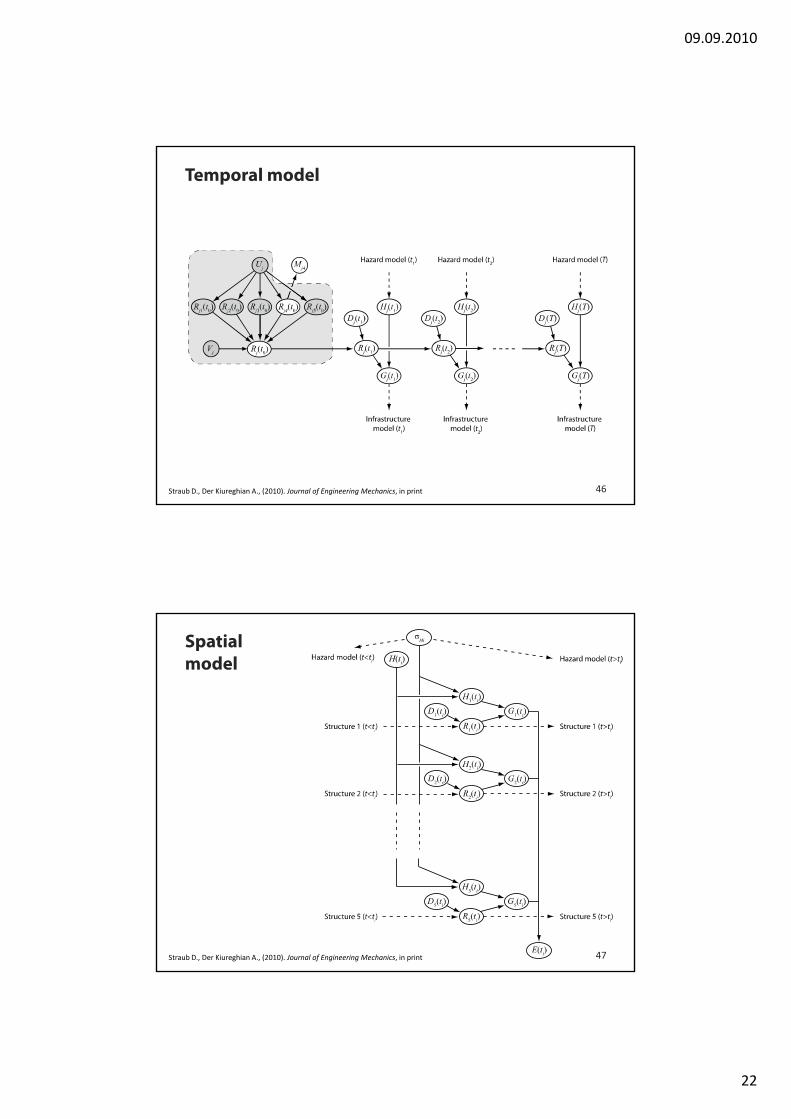
Temporal model
46Straub D., Der Kiureghian A., (2010). Journal of Engineering Mechanics, in print
Spatialmodel
47Straub D., Der Kiureghian A., (2010). Journal of Engineering Mechanics, in print

09.09.2010
23
EQ: Modeling systems and portfolio of structures
M4
M5
Q1
R5
R1
UR
R3
R2
R4
V
R4a‘
R4b‘
R5a‘
R5b‘
Q
Q2
Q20
E(1) E(2) E(20)
48
H1(1) H
1(2) H
1(20)
UH1
UH2
UH20
UH
H(1) H(2) H(20)
Straub D., Der Kiureghian A., (2010). Journal of Engineering Mechanics, in print
Reliability of the infrastructure system is updatedin near-real-time as information becomes available
Small earthquake event (proof loading effect)
One year later
Prior model
Detailed inspectionof structures
First observations after EQ
One year later
49
Immediately afterEQ event
after Q
Straub D., Der Kiureghian A., (2010). Journal of Engineering Mechanics, in print

09.09.2010
24
Do we now have the Deus Ex Machina?
• Limitations of the analysis:– Complexity of the BNComplexity of the BN– Number of SRM computations required
• In particular, spatial correlation can be handled onlyapproximately
• Certain dependence must be simplified (Markovassumption)
50
Spatial modelling of the EQ hazard
51Straub D., Bensi M., Der Kiureghian A. (2008). Proc. EM’08
09.09.2010
25
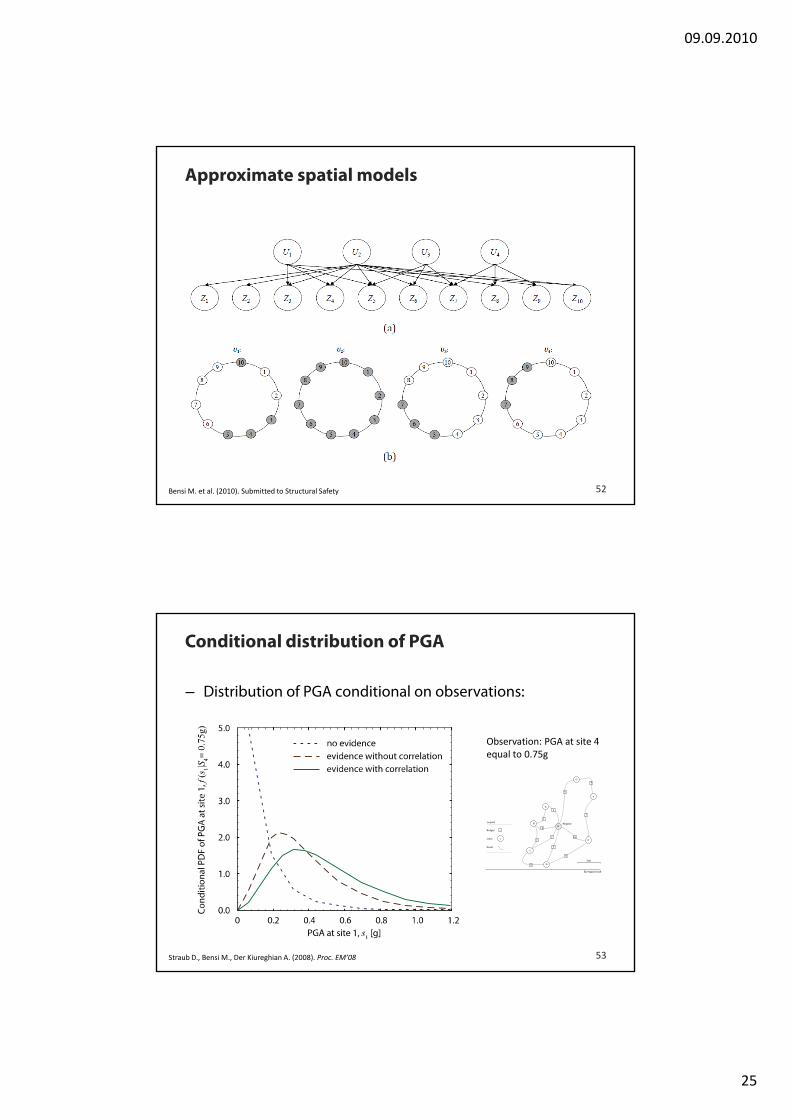
Approximate spatial models
52Bensi M. et al. (2010). Submitted to Structural Safety
– Distribution of PGA conditional on observations:
Conditional distribution of PGA
Observation: PGA at site 4 equal to 0.75g
53Straub D., Bensi M., Der Kiureghian A. (2008). Proc. EM’08

09.09.2010
26
System performance models are also not straightforward
• But a formalism forestablishing them hasestablishing them hasbeen developed:
54Bensi M., (2010). PhD thesis, UC Berkeley
Discussion
• Bayesian network models enable the probabilistic modelingof complex systemsof complex systems
• Particularily efficient when he problem can becompartialized (conditional statistical independences)
• They are ideal for problems with evolving information (asthey allow model updating ad learning)
• Computational limitations exist, which make a carefulmodeling necessary
55
modeling necessary• BNs are a modelling tool: The models must still be
developed and data must be collected

09.09.2010
27
Outlook
56
57


![arXiv:2007.02829v1 [stat.ML] 6 Jul 2020 · Chapter 1 Introduction Bayesian network is a probabilistic graphical model using directed acyclic graphs to express joint probability distributions](https://img.dokumen.tips/doc/110x75/5f4480d25b838c487e6e44ba/arxiv200702829v1-statml-6-jul-2020-chapter-1-introduction-bayesian-network.jpg)