Embed Size (px)
Citation preview

CENTER FOR CONTINUING STUDY OF THE CALIFORNIA ECONOMY
132 HAMILTON AVENUE • PALO ALTO • CALIFORNIA • 94301
TELEPHONE: (650) 321-8550 FAX: (650) 321-5451
www.ccsce.com February 2012 Bay Area Job Growth to 2040 Projections and Analysis Prepared for: Association of Bay Area Governments Prepared by: Stephen Levy

Introduction In September 2011, the Association of Bay Area Governments (ABAG) asked the Center for Continuing Study of the California Economy (CCSCE) to prepare regional job projections to 2040 and to assist ABAG staff in preparing population and household projections. This report is focused on the job projections prepared by CCSCE and includes a summary of the methodology, a description of the projections and an explanation of past, current and projected job growth in the region. The projections and this report were prepared by Stephen Levy, CCSCE’s Director. CCSCE acknowledges the assistance and support of Miriam Chion, Justin Fried, Ken Kirkey and Ezra Rapport from the ABAG staff who provided guidance and encouragement through the time we worked together. CCSCE also acknowledges Jon Haveman and Sean Randolph of the Bay Area Council Economic Institute. Jon provided assistance in interpreting the Council’s December 2011 economic forecast and Sean allowed CCSCE to use quotes and slides from the Institute’s upcoming Bay Area Economic Profile prepared with the assistance of McKinsey & Company.
1

Summary The Bay Area is projected to add more than 1.2 million jobs between 2010 and 2040 and to grow slightly faster than the state and nation.
Total Jobs (Thousands)
2010 2040 % Growth
Bay Area 3,385.3 4,617.5 36.4% United States 141,821.3 183,310.7 29.3%
Bay Area % of U.S. 2.39% 2.52%
Source: 2010‐U.S. Bureau of Labor Statistics BLS), the California Employment Development Department (EDD) and CCSCE; 2040‐CCSCE
The region is expected to slowly recover the jobs lost during the recent recession and then experience moderate job growth to 2040. The Bay Area is projected to slightly outpace the state and nation in future job growth driven by the region’s large concentration and continuing competitive advantage in many areas of technology and the region’s position as a Pacific Rim trade and finance center. Still, in 2040 the region is expected to have a smaller share of U.S. jobs than in 1990 before the defense cutbacks or in 2000 before the dot.com bubble burst.
2.25%
2.30%
2.35%
2.40%
2.45%
2.50%
2.55%
2.60%
2.65%
2.70%
1990
1991
1992
1993
1994
1995
1996
1997
1998
1999
2000
2001
2002
2003
2004
2005
2006
2007
2008
2009
2010
2020
2040
Bay Area Share of U.S. Jobs
The remainder of this report explains these findings and why the Bay Area is expected to reverse the lagging job growth of the past decade.
2

Bay Area Job Trends 1990-2010 Bay Area job levels experienced ups and downs during the two decades after 1990. Between 1990 and 1994 the Bay Area experienced a jobs recession that lasted longer than the nation’s although job losses were relatively modest. During this period the region was hit with defense related cutbacks lost more than 40,000 jobs associated with lower defense spending on aerospace and the closure of military bases. These losses deepened in the following years and were a permanent loss of part of the region’s economic base. During these years the region’s share of national jobs fell from 2.64% in 1990 to 2.50% in 1995 as the nation recovered more quickly from the 1990-91 recession and experienced a smaller impact from defense related job losses.
2.25%2.30%2.35%2.40%2.45%2.50%2.55%2.60%2.65%2.70%
3,000.0
3,200.0
3,400.0
3,600.0
3,800.0
4,000.0
1990
1991
1992
1993
1994
1995
1996
1997
1998
1999
2000
2001
2002
2003
2004
2005
2006
2007
2008
2009
2010
Bay Area Job Trends 1990‐2010
Bay Area Jobs Bay Area Share of U.S.
During the late 1990s the regional economy roared back as technology and the dot.com boom took over. The Bay Area added more than 600,000 jobs between 1994 and 2000 while matching the previous record share of the nation’s total jobs. Regional job gains were led by computer services, information services related to the Internet and computer and electronics manufacturing. However, many of the jobs created during the dot.com boom quickly disappeared in the years after 2000 as the boom turned into the dot.com bubble bust. The region lost more than 300,000 jobs between 2000 and 2004 and the region’s share of U.S. jobs fell from 2.67% to 2.46%. The region lost 1/3 of the computer and electronics manufacturing jobs after 2000 and a larger share of the Internet related jobs while experiencing some job losses in professional, technical and
3

scientific services and temporary help agencies, all sectors serving the region’s technology firms. Between 2004 and 2007 the Bay Area once again outpaced the nation in job growth and was slowly recovering the job and share losses after 2000 when the recession created by the housing and financial crises hit the nation, state and region toward the end of 2007. Once again the region lost nearly 300,000 jobs and by early 2010 saw the region’s share of national jobs fall to the lowest since before 1990. However, this time the job losses had a different structure and told a different story. The largest job losses since 2007 were related to construction and finance with nearly 100,000 jobs lost as a result of the housing and financial sector crises. More than 50,000 jobs were lost in the retail trade and government sectors. While technology and trade sectors experienced job losses after 2007, these were modest and temporary with recovery starting in late 2010 and extending into 2011. While the recessions after 1990 and 2000 caused permanent job losses in the region’s economic base, the recent recession did not. While many indicators of this fact will be described below, venture capital trends show the region’s continuing strength in a single picture. Bay Area VC funding rebounded in 2010 and 2011 approaching pre-recession levels. At the same time the region’s share of national VC funding has been on a fairly steady uptrend since 2000 reaching record levels during recent years. These gains plus a surge in technology hiring from existing firms has pushed Bay Area job growth above the national average in 2011 with further gains expected in 2012 and 2013.
0%5%10%15%20%25%30%35%40%45%
$0
$5
$10
$15
$20
$25
$30
$35
1995 1999 2003 2007 2011
$Billions
Bay Area VC Funding
VC Funding Share of U.S.
4

The Short-Term Outlook: 2011-2013 In December 2011 the San Jose metro area tied with Houston for the highest rate of job growth for all large metropolitan areas in the nation during the preceding 12 months. During that period the metro area saw a gain of 25,700 jobs for a 3.0% increase compared to the nation’s 1.3% gain. The San Francisco metro area also strongly outpaced the nation. Job growth in both metro areas was driven by gains in technology sectors. Job gains were recorded in Internet-related activities, computer and electronics manufacturing and especially in professional, scientific and technical services. Bay Area companies reported hiring gains driven by customer demand for their goods and services. Bay Area companies including Google, Apple, Facebook, LinkedIn and Zynga made business news headlines regularly reporting good news. Rents and building prices surged in tech centers including San Francisco, Palo Alto and San Jose as reported in the San Francisco and Silicon Valley Business Journals. In December 2011 the Bay Area Council Economic Institute released their regional economic forecast prepared in partnership with the Anderson Forecast Project at UCLA. The UCLA forecast highlights include:
• Between the first quarter of 2011 and the fourth quarter of 2013, the region is expected to add more than 200,000 jobs for a gain of 7.5%. This gain is compared with a 4.5% increase expected in California
• During that period the unemployment rate is forecast to drop from 10.5%% to 8.1%. By December 2011, the regional unemployment rate had declined to 8.6%.
• Gains in personal income and taxable sales are forecast to outpace inflation.
• New housing construction is forecast to start a recovery in 2013. In February 2012 Facebook announced their upcoming IPO, which together with the successful IPOs at LinkedIn, Zynga and other Bay Area companies confirmed that it was, once again, possible for entrepreneurs and workers to see a financial payoff from innovation and risk taking.
5

Job Growth and Trends to 2040 The Bay Area job projections were developed using three guiding principles:
1) The Bay Area projections were based on projections of job growth in the nation and state. The national and state projections provide the pool of job opportunities and the Bay Area projections reflect judgments about the share of national and state job growth that will locate in the Bay Area.
2) The Bay Area share of national and state job growth is determined by the industry composition of job growth and the projected share of job growth locating in the Bay Area. If national and state job growth is concentrated in sectors where the Bay Area has a competitive advantage, the region’s projected job growth will be higher than if national and state job growth is concentrated in sectors where the region has a below average share of jobs and a relatively poor competitive position.
3) The analysis of competitive advantage is focused on sectors in the Bay Area economic base. The region’s economic base consists of those sectors that sell a high proportion of goods and services to customers outside the region. They export goods and services to customers in world and national markets and markets throughout California. Key examples of economic base sectors in the Bay Area are manufacturing, information services related to the Internet, professional, scientific and technical services such as computer services and scientific R&D services, and foreign trade and tourism sectors.
U.S. Job Growth to 2040 The U.S. job growth projections have three principal components:
1) A new, post-2010 Census set of population projections to 2040
2) Labor force participation rate projections that reflect longer working lives for older workers
3) Industry sector projections developed by CCSCE based on a review of existing national projections
The population and labor force projections determine the amount of job growth projected between 2010 and 2040 and the industry projections identify the structure of job growth as an input to state and Bay Area job projections.
6

The resulting national projections of job growth are shown below.
United States Total Jobs (Millions)
2010 2020 2040 141.8 163.2 183.3
2010‐2020 2020‐2040 2010‐2040 Change 21.3 20.1 41.5
% Change 15.1% 12.3% 29.3%
Source: 2010‐U.S. Bureau of Labor Statistics (BLS) ; 2020 and 2040‐CCSCE
The nation is expected to add 41.5 million jobs between 2010 and 2040 for an increase of 29.3%. Slightly more than half of the projected increase is expected to occur in the next ten years. The percentage increase in jobs (15.1%) between 2010 and 2020 is actually larger than the projected increase (12.3%) for the following 20 years. The concentration of job growth in the first ten years has two explanations, both of which apply to the state and Bay Area job projections:
1) A significant part of the job growth projected to 2020 includes the recovery of job losses incurred during the recession. The nation lost more than 8 million jobs during the recession. The national forecasts reviewed by CCSCE all have the nation regaining full employment by 2015 or 2016. As a result the 2020 projections include erasing the recession job losses plus added gains in the latter half of this decade. The job growth numbers look different when measured from the peak before the recession. Job growth between 2007 and 2020 is projected to be 13.1 million and the projected growth rate is 8.8% compared to the 21.3 million jobs and 15.1% growth rate measured from 2010.
2) After 2020 labor force and job growth slows as the tidal wave of baby boomer retirements takes effect. U.S population is projected to increase by 16.3% between 2020 and 2040, which is faster than the projected job growth (12.3%) and the reason is the retirement of the baby boom generation.
7

The Pattern of U.S. Industry Job Growth to 2040 Projecting industry growth 30 years into the future is a difficult task and although the projections shown below reflect the industry patterns expected by major national forecasting organizations, they come with a high degree of uncertainty in the years after 2020. The projected growth rates shown on the table are for the period from 2007 to 2040 and eliminate the fall and rise of job levels related to the recession and recovery—thus they illustrate the long-term trends.
United States Jobs by Major Industry (Millions)
2007 2010 2020 2040 2007‐2040
Construction 7.6 5.5 7.4 8.4 10.6%Manufacturing 13.9 11.5 11.7 10.7 ‐23.2%Wholesale Trade 6.0 5.5 6.1 6.1 1.6%Retail Trade 15.5 14.4 15.4 15.9 2.7%Transp., Warehousing and Utilities 5.1 4.7 5.4 5.8 14.2%Information 3.0 2.8 3.0 3.2 5.2%Financial Activities 8.3 7.7 8.5 8.9 6.6%Professional and Business Services 17.9 16.7 21.4 27.0 50.3%Educational and Health Services 18.3 19.6 24.2 30.6 66.8%Leisure and Hospitality 13.4 13.0 15.7 18.3 36.6%Other Services 5.5 5.4 6.2 6.9 25.9%Government 22.2 22.5 23.7 25.9 16.6%Self Employed 11.3 10.6 12.5 14.0 23.6%
Total Jobs 150.0 141.8 163.2 183.3 22.2%
Source: 2007,2010‐U.S. Bureau of Labor Statistics (BLS) 2020 and 2040‐CCSCE
However, the projections do show substantial differences in the expected growth rate among industries and these differences tell a story about where job growth is expected and where job levels will remain flat or decline. These differences directly influenced the Bay Area job projections described in a later section of this report. Agriculture and mining were excluded from the table as they are less important to the Bay Area economy, but jobs in these categories are in the totals. These projections also help identify which job growth is primarily a reflection of regaining jobs lost during the recession and which industries have long-term job growth potential. Some of the major trends include:
8

• Construction job growth between 2010 and 2020 recovers jobs lost during the recession after which the industry will have modest growth.
• Manufacturing job levels are expected to end the decade close to 2010 levels and decline thereafter, never reaching the pre-recession totals. Manufacturing production is projected to increase substantially between 2010 and 2040 as in recent decades although job growth will lag. The explanation is strong and continuing productivity growth in the sector. Put simply, over time manufacturing firms can produce more with fewer workers. The size of the U.S. market measured by population growth is below 1% per year while manufacturing productivity has been is close to 5% per year over the long term. Even with expanding manufacturing export markets and new advanced manufacturing opportunities, the sector will see a decline in overall job levels between 2010 and 2040.
• By far the largest percentage job growth is expected in Professional and
Business Services and Educational and Health Services. The Professional and Business Service sector includes the fast-growing, high wage professional, scientific and technical services industries and those sectors are critical for projecting Bay Area job growth. The largest percentage growth within these industries is in computer services, scientific research and development services and architectural and engineering services, all key components of the Bay Area economic base.
• The largest and fastest-growing industries are within health and social services and are driven by the aging of the population.
• Retail trade and financial services are sectors undergoing restructuring driven in different ways by technology. Retail trade growth is slowing as more customers take advantage of online shopping and that trend is expected to continue leading to below average job growth for retail trade. In finance, technology such as online banking and mobile phone technology for paying bills is reducing the demand for personnel in banks and technology also makes it easier to process financial transactions so job growth in this sector is also expected to be relatively small.
• Leisure and Hospitality is the other fast-growing sector and includes amusements and hotels as well as the large restaurant sector.
• The information sector is important for the Bay Area and the relatively slow job growth shown above is misleading because it consists of continuing job losses in telecommunications offset by the smaller but fast-growing software and Internet services sectors.
9

California Job Growth to 2040 The state is projected to experience job growth that is slightly faster than the nation’s job growth to 2040. California is expected to recover the recession job losses by 2015 or a year later and the unemployment rate will return to full employment levels between 2015 and 2017 according to the forecasts reviewed by CCSCE. In addition the state has a favorable industry composition given the expected U.S. job growth in technology, trade and tourism. California is outpacing the nation in job growth in 2011 and is forecast to continue the above average growth to 2020 in the latest UCLA Anderson Forecast. These results are confirmed by CCSCE’s industry jobs analysis.
California Total Jobs (Thousands)
2010 2020 204015701.4 18713.9 21155.5
2010‐2020 2020‐2040 2010‐2040 Change 3012.5 2441.6 5454.1
% Change 19.2% 13.0% 34.7%
Source: 2010‐California Employment Development Department (EDD) and CCSCE; 2020 and 2040‐CCSCE
California is projected to add nearly 5.5 million jobs between 2010 and 2040 with the largest absolute and percentage gains in the first decade as the recession job losses are regained and before the heart of the baby boom retirement wave. The state is projected to see a 34.7% increase in total jobs or slightly above the projected national increase of 29.3%. As with the national projections, the picture changes if job growth is measured from the pre-recession peak. The 2007-2020 gain is then 1.6 million jobs instead of 3.0 million and the percentage increase is 9.2% or slightly above the national job growth rate for this period. The chart on the next page shows the long-term trend of the state’s share of national jobs since 1990. While there are periods of share gain and periods of share losses, the overall pattern is that California job growth roughly matches the national growth rate and the state’s projected share of U.S. jobs in 2040 is approximately the same as the share in 1990. The state regains the share losses
10

in the recession by 2020 and then grows slightly faster than the nation between 2020 and 2040.
10.4%
10.6%
10.8%
11.0%
11.2%
11.4%
11.6%
11.8%
1990
1991
1992
1993
1994
1995
1996
1997
1998
1999
2000
2001
2002
2003
2004
2005
2006
2007
2008
2009
2010
2020
2040
California Share of U.S. Jobs
Bay Area Job Growth to 2040 The Bay Area has a concentration and competitive advantage for most sectors in which technology is applied in the development of goods and services sold to customers around the state, nation and world. This strong position in technology, where job and export growth is expected, is the primary reason that the region is projected to experience job growth at a slightly faster pace than the nation. The Bay Area concentration can be seen in venture capital flows as shown on page 4 where the Bay Area is capturing 40% of the nation’s venture capital funding in recent years, above the shares captured during the dot.com boom. The Bay Area concentration can be seen in the technology sector job levels shown on the next page. The region with 2.4% of the nation’s total jobs in 2010 had 12.0% of computer and electronic manufacturing jobs, 5.8% of pharmaceutical jobs, 10.3% of software jobs, and 8.3% of Internet service jobs. The Bay Area advantage stands out in key fast-growing, high wage professional, scientific and technical services. In 2010 the region accounted for 3.3% of the nation’s architectural and engineering jobs, 7.0% of computer service jobs, 4.3% of management and technical consulting jobs and 8.1% of scientific R&D jobs—all above the 2.4% share of U.S. total jobs in the Bay Area.
11

Bay Area Share Advantage in Key Technology Sectors (2010 data) Jobs in Thousands
Bay Area Share Bay Area U.S. of U.S.
Computer & Electronics Manufacturing 132.5 1,100.1 12.0%
Pharmaceuticals 16.0 276.5 5.8%
Medical Equipment 11.1 359.0 3.1%
Software 26.7 259.8 10.3%
Internet-Related 31.8 383.5 8.3%
Architectural & Engr. Services 42.1 1,276.7 3.3%
Computer Services 100.9 1,441.5 7.0%
Management & Tech.Services 41.7 991.4 4.2%
Scientific R&D Services 50.0 620.3 8.1%
Total Jobs 3,401.8 141,821.3 2.4%
Source: BLS, EDD and CCSCE The Bay Area Council Economic Institute (BACEI) 2012 profile of the regional economy highlights the competitive advantage for innovation activities in the Bay Area. BACEI has graciously allowed CCSCE and ABAG to cite some of the material prepared for the profile by McKinsey & Company. Innovation highlights include:
• The Bay Area is the dominant region for new patents. In 2010 regional organizations held 16,364 patents while the next largest center, New York, trailed with 6,383 followed by Los Angeles, Boston and Seattle.
• Innovation sectors in the Bay Area accounted for 18.4% of total employment, highest in the nation, followed closely by Boston, Seattle and the Raleigh Triangle with more than 16%. San Diego was next with 14.0% followed by Austin with 12.2%.
• Seven of the top ten social media companies are headquartered in the Bay Area including Google, Facebook, Yahoo, Twitter, LinkedIn, Zynga and Yelp.
12

• Nearly half of the top 100 clean-tech firms are in the Bay Area.
The Bay Area innovation and technology advantage also comes from having the highest percentage of college graduates in the workforce of all major regional economies. The Bay Area’s 44% is followed by 43% in Boston and 37% in Seattle compared to the 28% national average
Foreign trade and tourism are additional strengths in the region’s economic base, in part because the Bay Area is a major center for trade, investment and tourism with Pacific Rim countries. The top six export destinations—China, Japan, Taiwan, South Korea, Hong Kong, and Singapore—all represent fast-growing Asian markets. Bay Area exports are concentrated in high-value technology exports shipped by air. The Bay Area is the nation’s fourth-largest export center behind New York, Houston and Los Angeles. The BACEI-McKinsey regional profile has some other interesting findings relative to the region’s strengths:
• The Bay Area has the second-largest concentration of Fortune 500 firms (30), trailing only New York (45) and ahead of the next highest concentration in Houston (22) and Dallas and Atlanta (10).
• The Bay Area is home to 10 of the Fortune 500 global firms, the most of any U.S. region except New York—Chevron, H-P, McKesson, Wells Fargo, Apple, Intel, Safeway, Cisco, Google, and Oracle.
• The Bay Area is a major travel and tourism center with 57 million flights annually, and 15.9 million tourists in 2010 who spent $8.3 billion.
Projection Methodology and Key Findings Job projections to 2020 were developed based on detailed industry projections for the nation and state. The focus was on projecting job growth in the region’s economic base sectors and converting these projections to total jobs by projecting the population-serving jobs that would accompany the basic industry job growth and related population increase. The projections from 2020 to 2040 were developed by concentrating on major industry categories and projecting the Bay Area share of national and state growth based on the analysis of trends in the period from 2007 to 2020. The region is projected to experience job growth at a slightly faster rate than the state and nation. The primary reasons for this above average job growth is the
13

region’s above-average concentration in fast-growing sectors that apply technology to the development of goods and services that are sold to customers around the world. Information and professional services are where the largest job gains are projected for the region’s economic base. The Bay Area job growth is also strengthened by the region’s position as a major financial and trade center for Pacific Rim countries and as a region where Pacific Rim investors and workers continue to come to live and work. The Bay Area is projected to add more than 1.2 million jobs between 2010 and 2040 of which approximately 300,000 jobs represent a recovery of jobs lost since the pre-recession peak and just under 1 million jobs represent gains between 2007 and 2040. Between 2010 and 2020 the region is projected to add nearly700, 000 jobs of which approximately 300,000 represent the recovery of jobs lost during the recession. Job growth is expected to slow during the 20 years between 2020 and 2040 as baby boomer retirements slow labor force growth. The Bay Area is projected to increase the region’s share of California jobs with a gain from 21.6% in 2010 to 21.7% in 2020 and 21.8% in 2040. The Bay Area is also expected to outpace the nation in job growth with the region’s share of national jobs going from 2.39% in 2010 to 2.49% in 2020 and 2.52% in 2040.
Bay Area Total Jobs (Thousands)
2007 2010 2020 2040
Bay Area Jobs 3652.0 3385.3 4068.5 4617.5
% of CA Jobs 21.3% 21.6% 21.7% 21.8%
% of U.S. Jobs 2.43% 2.39% 2.49% 2.56%
Source: 2007, 2010‐BLS, EDD and CCSCE 2020 and 2040‐CCSCE
The region’s projected above average job growth is displayed graphically on the following page.
14

11.4%
20.2%
13.5%
9.2%
19.2%
13.0%
8.8%
15.1%
12.3%
0.0%
5.0%
10.0%
15.0%
20.0%
25.0%
2007‐2020 2010‐2020 2020‐2040
Growth in Total Jobs
Bay Area California United States
Major Industry Job Trends The major industry job trends in the Bay Area over the next 30 years mirror the national trends described on page 9. Construction job levels will almost regain pre-recession levels by 2020 and will increase slightly to 2040. Although this is a substantial gain measured from 2010 job levels, it is primarily driven by a slow return to more normal construction levels in the region. Manufacturing job levels are projected to increase slightly between 2010 and 2020 and then continue the long-term decline driven by the disparity between high productivity gains and slow increases in domestic demand as population growth slows and the population continues to age. These projections do not include major manufacturing job gains that might occur in the clean tech sector if regional firms develop products that attract worldwide customers. The largest job gains in absolute numbers and percentage increases are in Professional and Business Services and Education and Health Services. Within these larger categories the leading sectors are professional, scientific and technical services such as computer services and sectors associated with health care and social services for an aging population. The national trends of slow growth in retail trade and finance are also expected in the Bay Area. Above-average job growth is expected in the Information sector led by Internet-related services and in the number of self-employed residents as well as in the
15
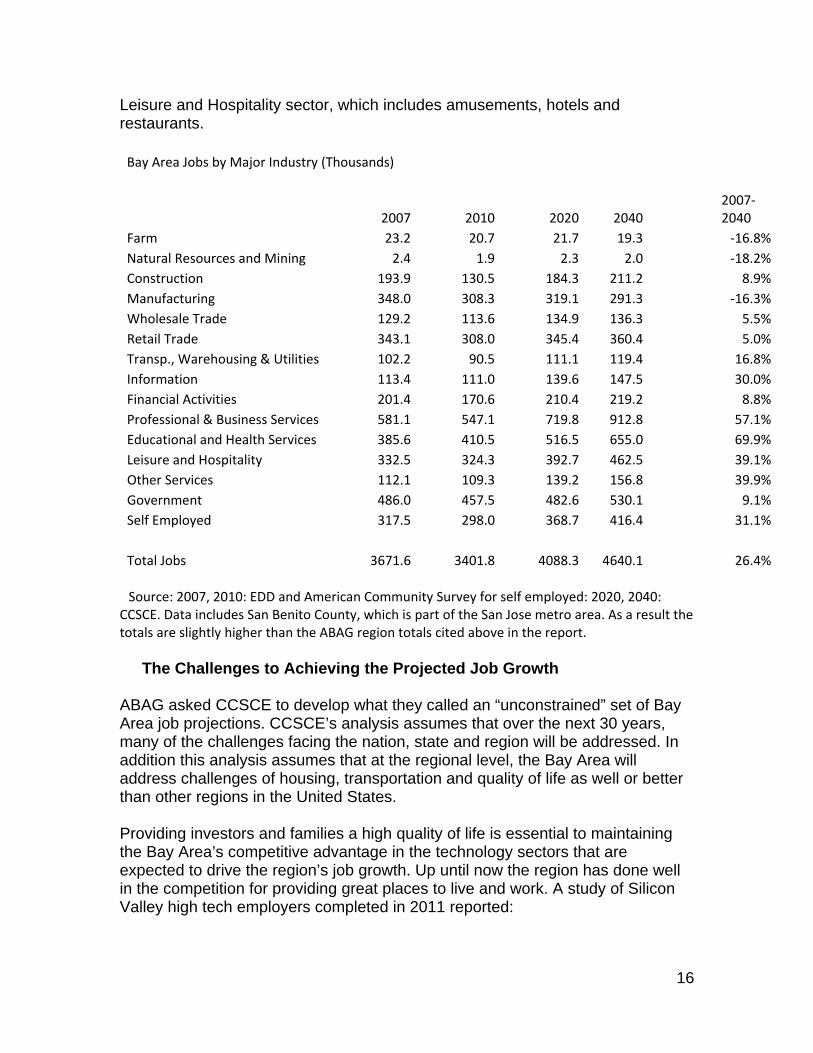
Leisure and Hospitality sector, which includes amusements, hotels and restaurants. Bay Area Jobs by Major Industry (Thousands)
2007 2010 2020 2040 2007‐2040
Farm 23.2 20.7 21.7 19.3 ‐16.8%Natural Resources and Mining 2.4 1.9 2.3 2.0 ‐18.2%Construction 193.9 130.5 184.3 211.2 8.9%Manufacturing 348.0 308.3 319.1 291.3 ‐16.3%Wholesale Trade 129.2 113.6 134.9 136.3 5.5%Retail Trade 343.1 308.0 345.4 360.4 5.0%Transp., Warehousing & Utilities 102.2 90.5 111.1 119.4 16.8%Information 113.4 111.0 139.6 147.5 30.0%Financial Activities 201.4 170.6 210.4 219.2 8.8%Professional & Business Services 581.1 547.1 719.8 912.8 57.1%Educational and Health Services 385.6 410.5 516.5 655.0 69.9%Leisure and Hospitality 332.5 324.3 392.7 462.5 39.1%Other Services 112.1 109.3 139.2 156.8 39.9%Government 486.0 457.5 482.6 530.1 9.1%Self Employed 317.5 298.0 368.7 416.4 31.1%
Total Jobs 3671.6 3401.8 4088.3 4640.1 26.4% Source: 2007, 2010: EDD and American Community Survey for self employed: 2020, 2040: CCSCE. Data includes San Benito County, which is part of the San Jose metro area. As a result the totals are slightly higher than the ABAG region totals cited above in the report. The Challenges to Achieving the Projected Job Growth ABAG asked CCSCE to develop what they called an “unconstrained” set of Bay Area job projections. CCSCE’s analysis assumes that over the next 30 years, many of the challenges facing the nation, state and region will be addressed. In addition this analysis assumes that at the regional level, the Bay Area will address challenges of housing, transportation and quality of life as well or better than other regions in the United States. Providing investors and families a high quality of life is essential to maintaining the Bay Area’s competitive advantage in the technology sectors that are expected to drive the region’s job growth. Up until now the region has done well in the competition for providing great places to live and work. A study of Silicon Valley high tech employers completed in 2011 reported:
16
‘‘Silicon Valley’s top competitive advantage is its highly skilled pool of talent. Executives interviewed for the study say there is nowhere else in the world with such a concentration of highly skilled tech professionals, which is essential for businesses that require a steady stream of talent. The Valley’s high quality of life-----including beautiful weather, excellent schools, and the ability to live and work in the suburbs-----was another major advantage, making CEOs want to locate their companies there and attracting talented workers and their families.’’ On the other hand maintaining a high quality of life is increasingly difficult. A 2011 survey of Silicon Valley CEOs states the quality of life imperative succinctly. The Silicon Valley Leadership Group 2011 CEO Survey reported “a deteriorating state infrastructure in areas ranging from public education to public transportation has added to the difficulties of recruiting the best workforce, finding them housing and educating their children to be tomorrow’s world-class workforce”. The 2012 Bay Area Council Economic Institute Bay Area economic profile identifies a list of well-known Bay Area competitiveness challenges:
• Housing affordability. Although median home prices have fallen and affordability is higher than it has been in several years, Bay Area median home prices and rents are still well above the national average.
• K-12 and higher education. Both are facing continuing budget cuts throughout California as well as rising tuition levels at the state’s public and private colleges. Moreover, average test scores are at or below nationwide levels and high school dropout rates remain high. While immigration can continue to supply a part of the region’s workforce needs, most jobs will be filled by residents who are born, educated and trained in California.
• Transportation infrastructure. Despite the ongoing work by MTC and local transit districts and the $billions planned for improving highway and public transit travel, the region does not yet have sufficient funding for all needed transportation infrastructure investments. Although transportation funding is a nationwide problem, it is an especially important challenge in a region that needs to be able to move people and goods efficiently to compete in the 21st century global economy
• Governance challenges. California does not as yet have a plan to develop state and local budgets that are balanced and able to provide high quality public services.
The unconstrained job growth analysis shows the competitive strength of the Bay Area economy going forward if these challenges can be met.
17

Sources and Methodology Appendix 1990-2010 Job Estimates The job estimates for the United States were published by the U.S. Bureau of Labor Statistics (BLS) at www.bls.gov. The job estimates used in developing the ABAG projections were those available in September 2011. BLS data and methodology are available at http://www.bls.gov/ces/. The wage and salary job estimates for California and the Bay Area were published by the California Employment Development Department. These are available at http://www.labormarketinfo.edd.ca.gov/Content.asp?pageid=166. The job estimates used in developing the ABAG projections were those available in September 2011. The Bay Area jobs data base includes the following metro areas as used by EDD: Oakland (Alameda and Contra Costa Counties); Napa (Napa County); San Francisco (Marin, San Francisco and San Mateo counties); San Jose (Santa Clara and San Benito counties); Santa Rosa (Sonoma County) and Vallejo (Solano County). For the ABAG region total job estimates and projections, San Benito County was excluded by the county is included in the table on page 16. Estimates for self employed workers were developed from the 1990 and 2000 Census and for recent years annual estimates are available from the American Community Survey at http://www.census.gov/acs/www/. The job estimates used in developing the ABAG projections were those available in September 2011. Methodology The job projections to 2040 developed for the ABAG region were based on a best-practice projection framework used by other regional planning agencies in California and by national forecasting firms that do long-term regional projections throughout the United States. A summary of the methodology is included in the Power Point presentation at the February 7, 2012 Regional Advisory Working Group Meeting and available at http://apps.mtc.ca.gov/events/agendaView.akt?p=1820. A more detailed description of the projection framework is available in Review of Best Practice State and Regional Projection Methodologies and Review of Recent Economic and Demographic Trends prepared by CCSCE for ABAG, SACOG and SCAG in April 2011. There are three major components common to regional and state long-term projections and these are the basis for the current ABAG methodology:
18

1) Population projections are developed based primarily on the projected rate of job growth.
2) State and regional job projections are developed based on projected national job growth and the share of national job growth expected to locate in a particular state or region.
3) Household projections are developed from population projections using varying combinations of demographic projections based on household formation rates and analyses of housing market conditions.
The remainder of this section focuses on the job projection methodology. Job Projections for 2020-2040 All of the projections described in this report were developed by CCSCE in the fall of 2011. The first step in developing job projections for the ABAG region is to develop projections for national job growth in total and by major industry group (the industries shown on page 16). United States The U.S. job projections for 2020 were adapted from the 2018 projections published by BLS in November 2009 and described in the November 2009 Monthly Labor Review. The press release can be found at http://www.bls.gov/schedule/archives/all_nr.htm#ECOPRO and the articles can be found at http://www.bls.gov/opub/mlr/2009/11/home.htm. CCSCE modified the BLS projections to reflect the impact of the recession and changes in labor force participation trends that occurred after the 2009 projections were prepared. In February 2012 BLS produced a new set of projections to 2020 that can be found at http://www.bls.gov/emp/. The 2020 U.S. job projection used by CCSCE in developing the ABAG job was within 0.8% of the newly published BLS projection of total jobs for 2020. The projections for 2030 and 2040, as explained on page 6, were developed in three steps:
1) Projecting national population growth
2) Translating the projected population into total labor force and total jobs
3) Projecting job growth by major industry group
19
CCSCE used a set of U.S. population projections developed by John Pitkin and Dowell Myers that are based on 2010 Census estimates as a starting point and immigration assumptions developed by a panel of experts. The projection report and tables can be found at http://www.usc.edu/schools/price/futures/. The existing Census Bureau long-term population projections were developed before the 2010 Census results were released and are available at http://www.census.gov/population/www/projections/. The population projections developed by Pitkin and Myers and used by CCSCE have a lower U.S. population in 2040 than either the Census Bureau baseline or low projections series as a result of assumed lower immigration levels. The labor force projections were developed based on BLS projected labor force participation rates to 2050 that can be found at http://www.bls.gov/opub/mlr/2006/11/contents.htm. CCSCE modified the projections to increase the labor force participation of older workers after 2020. A national unemployment rate of 6% was assumed for 2020 to 2040. The population, labor force and unemployment projections combine to produce a projection of total jobs in the U.S. that was used in developing the ABAG projections. Jobs by industry for 2020 were developed based on the BLS projections adapted for trends emerging after they were published. The major industry projections for 2030 and 2040 were developed by CCCCE based on 1) the trends between 2010 and 2020 and a review by CCSCE of major industry job trends projected by other major national forecasting firms. California The California job projections were developed by CCSCE using a proprietary model that relates California job growth to U.S. job growth. Industries are categorized into economic base industries (those that sell a majority of goods and services outside the region, also known as export industries) and those that serve the local population. Growth in economic base industries, as explained on page 6 is related to the pool of job opportunities reflected in the national projections and the share locating in California based on analysis of historical trends and CCSCE judgment. Job growth in California’s economic base industries depends on how fast they are expected to grow nationwide and the state’s competitive position represented by the share of national jobs expected to locate in California.
20

21
Once the economic base jobs are projected, population serving jobs are added based on 1) the projected profile of these jobs in the nation and the extent to which California’s profile of population serving jobs differs from that in the nation. For the California projections developed as part of this project the principal findings were:
1) California is expected to have job growth that is slightly faster than the nation to 2040 based on the state’s industry structure, which has an above-average share of economic base jobs with high projected national growth.
2) In general the share of jobs in key industries is not expected to increase in California. It is the industry structure that pushes the overall job growth rate slightly above the national average.
3) The profile of population serving jobs in the state and nation are similar. Bay Area The Bay Area job projections were developed using the CCSCE model that is described above for California and as explained on page 6. As explained on pages 13 and 14 and supported elsewhere in text the pri8ncipal finding is that the Bay Area is projected to experience job growth that is slightly above the state average as a result of the region’s favorable economic base industry structure with an above average share of the sectors expected to post above-average job growth in the nation and state. Other Sources The UCLA Bay Area forecast cited on page 5 can be found at http://www.bayareaeconomy.org/economic-forecasts/. The McKinsey report cited on pages 12 and 13 and the Bay Area economic profile cited on page 17 will be published by the Bay Area Council in the spring of 2012. The venture capital funding graph on page 4 comes from data published by Price Waterhouse Coopers Lybrand and can be found at https://www.pwcmoneytree.com/MTPublic/ns/nav.jsp?page=notice&iden=B. The Silicon Valley workforce report cited on page 16 can be found at http://www.novaworks.org/LaborMarketInfo/Reports/InformationTechnologyStudy.aspx.