Embed Size (px)
Citation preview


77571
77573
77546
7750777034
77586
77598
77089
77506
77059
77503
77505
77058
77062
77502
77504
77565
Galveston Bay
San Jacinto River
Clear Lake
Taylor Lake
Clear Creek
Buffalo Bayou
Dickinson Bayou
H a r r i sH a r r i s
G a l v e s t o nG a l v e s t o n
B r a z o r i aB r a z o r i aBacliff
Webster
El Lago
Baytown
Pearland
La Porte
Pasadena
Dickinson
Deer Park
Nassau Bay
League City
Friendswood
Galena Park
South Houston
Clear Lake City
Bayside Terrace
Taylor Lake Village
45
146
3
610
35
Stat
e
Galveston
La Porte225
Gulf
Pasadena
Mai
nTe
leph
one
S Sam Houston
E
Decker
Bat
tlegr
ound
Bayport
Reveille
Bro
adw
ay
Winkler
3
Main
225
146
45
State
La PorteLa Porte 146
Clover Field
Ellington Field
William P. Hobby
UHCL Kemah
Seabrook
Shoreacres
Jacinto City
Morgans Point
Clear Lake Shores
0 6 123 Miles
Legend
Bay Area Houston - Blk. Grp.
Airports
UHCL
Parks in Bay Area
Zip code Area
Water bodies (Lakes, Bays, ...)
County Line
P. Johnson / December 2005
Land Area = approximately 216 square miles.
Austin
Dallas
Houston
El PasoFort Worth
San Antonio
Oklahoma City
TX
OKNM AR
LA
KSCO MO
Includes: Harris County: Houston, La Porte, Nassau Bay, Pasadena, Seabrook, and Webster areas. Galveston County: Friendswood, Kemah, and League City areas. Service area of Bay Area Houston Economic Partnership
Map 1: Bay Area Houston, TX - Area of Study Defined

77571
77573
77546
7750777034
77586
77598
77089
77506
77059
77503
77505
77058
77062
77502
77504
77565
Galveston Bay
San Jacinto River
Clear Lake
Taylor Lake
Clear Creek
Buffalo Bayou
Dickinson Bayou
H a r r i sH a r r i s
G a l v e s t o nG a l v e s t o n
B r a z o r i aB r a z o r i aBacliff
Webster
El Lago
Baytown
Pearland
La Porte
Pasadena
Dickinson
Deer Park
Nassau Bay
League City
Friendswood
Galena Park
South Houston
Clear Lake City
Bayside Terrace
Taylor Lake Village
45
146
3
610
35
Stat
e
Galveston
La Porte225
Gulf
Pasadena
Mai
nTe
leph
one
S Sam Houston
E
Decker
Bat
tlegr
ound
Bayport
Reveille
Bro
adw
ay
Winkler
3
Main
225
146
45
State
La PorteLa Porte 146
Clover Field
Ellington Field
William P. Hobby
UHCL Kemah
Seabrook
Shoreacres
Jacinto City
Morgans Point
Clear Lake Shores
0 6 123 Miles
Legend
Bay Area Population 2005PF_G8_Features.POP_C
0 - 1,323
1,324 - 2,751
2,752 - 5,580
5,581 - 10,151
Airports
UHCL
Parks in Bay Area
Zip code Area
Water bodies (Lakes, Bays, ...)
County Line
P. Johnson / December 2005
Map 2: Bay Area Houston, TX - 2005 Population by Census TractLand Area = approximately 216 square miles.
Includes: Harris County: Houston, La Porte, Nassau Bay, Pasadena, Seabrook, and Webster areas. Galveston County: Friendswood, Kemah, and League City areas. Service area of Bay Area Houston Economic Partnership
The census tract visible above Deer Parkis also part of 77571 and is included
for census tract analysis only.

i
University of Houston - Clear Lake Center for Economic Development and Research
Claritas 2005 Demographics Trends for: 1970, 1980, 1990, 2000, 2005 estimates, and 2010 projections
Introduction and Data Methodology
Introduction and Data Methodology:
The figures derived in this report are based on information gathered
by the U.S. Bureau of the Census in its decennial censuses. The
database used for this report is referred to as a Neighborhood
Change Data Base (NCDB) and was made available by The Urban
Institute in collaboration with GeoLytics (www.geolytics.com). After
Bay Area Houston, TX was spatially defined by zip code, in
cooperation with the Bay Area Houston Economic Partnership,
census tracts that fell within the zip boundaries were summarized by
several social, demographic, economic and housing trends for 1970,
1980 and 1990. Claritas block group areas were used for 2000, 2005
and 2010 projections. Census tracts are locally determined
geographic units, usually encompassing between 2,500 and 8,000
persons. Tracts are meant to represent "neighborhoods" by capturing
a group of residents with similar social characteristics. The old adage
that "birds of a feather stick together" is usually representative of the
demography of a neighborhood. Because census tracts are re-
defined every ten years, the NCDB made it possible to analyze the
same geographic area by normalizing previous census tract data
(1970 – 1990) to apply to the 2000 census tract boundaries. This
technique then allowed for an electronic analysis of trend data to link
such tracts and their associated variables to standard geographic
boundaries. Moreover, the same physical space can be analyzed
over time. Data for 2000, 2005 and 2010 used block group areas for
the spatial selection, which is an even smaller geographical area than
census tracts resulting in more precise demographic analysis for the
Bay Area Houston Economic Partnership service area for current year
estimates. Therefore, use caution when comparing Claritas data to
other published demographic data that may not have used similar
methodologies.
The figures outlined in this report contain selected data elements that
can be made comparable from one census to the next and are of
importance for communities to recognize the changing climate of their
area. The NCDB data contained in this report does not provide
information on individuals directly in that all data have been
aggregated to the census tracts or block group area contained by the
Bay Area Houston service area region. Aggregated data preserves
the confidentiality of individual respondents. Although data covers the
four census points in time, it does not cover all of the time in-between
the census periods when other important events may have occurred.
Use local knowledge of Bay Area Houston to further assess changes

ii
that have occurred over time. For example, the Bay Area Houston
population upsurge between 1970 and 1990 may be attributed to
other events not recorded in census years. It is also important to note
that this report focuses on the Bay Area Houston service area that
covers only a portion of Harris and Galveston counties. It is more
complex to analyze a smaller portion of an area than it is to analyze
larger geographic areas. The variable summaries in this report have
been validated with similar spatial areas for accuracy.
There has been much debate over census undercounts over the last
several decades. For example, homeless individuals and other
individuals may be missing from overall census counts. However, it is
calculated that the number of missed individuals in the U.S. Census
has fallen from around 5 percent in 1950 to under 2 percent in 1990.
The 2000 census is thought to be one of the most accurate counts to
date, although an actual measure is not yet available. Census 2000 is
also considered to be the largest peacetime effort in the history of the
United States.
In order to tabulate population by race for Census 2000, the Census
Bureau provided counts for all 63 combinations of the six racial
groups (White, Black/African American, Native American/Alaskan
Native, Asian, Native Hawaiian/Other Pacific Islander, and some other
race) that respondents could have chosen. In order to have
comparable data, "race bridging" variables take all of the multiracial
categories for Census 2000 and assign them into single racial groups.
In addition to the race question, a separate "ethnicity" question asks
each respondent whether he or she considers himself or herself to be
Hispanic or Latino. The ethnicity trend figure provided in this report
aggregates the race variables by Non-Hispanic single race compared
to actual Hispanic race. Other figures in the report may not provide
for aggregation using this methodology so use caution when doing
comparisons. In 1970, aggregation by Hispanic and non-Hispanic
were not determined so easily. The 1970 census determined
"Spanish-American" population depending on the mother tongue
spoken by the wife or head of the family and reported figures also
based on the region of the nation in which they lived.
Use caution when making comparisons of any variables used in this
report to any other published figures that may not have used the same
methodology or the same spatial extractions. It is also important to
note that block group centroid coordinates may change over time.
Data are also calibrated each year in order to provide the most
accurate estimates for the current year. For this reason, comparisons
should only be made to actual census years with current year
estimates and ten year projections. Estimates should never be
compared to past estimates, and projections should only be analyzed
based on the current year estimates. Thank you for your interest.
For questions, please contact:
Ken Black, Ph.D. at (281) 283-3239 or Peggy Johnson at (281) 998-6177
For a comprehensive Claritas data definition glossary and methodology, please access the following site: http://www.claritas.com
Please access the SJC Office of Research & Institutional Effectiveness website for an electronic copy of this report and for other published reports:
http://www2.sjcd.edu/research/index.htm Please provide the appropriate credits to the Publishers of this report & other
mentioned data providers (Geolytics and Claritas) if you plan on external use of any part of this report. Thank you.

iii
University of Houston – Clear Lake Center for Economic Development and Research
Profile of Bay Area Houston, TX Claritas 2005 Demographics
- Executive Summary with comparison to Texas and the United States -
Population
x The population in Bay Area Houston, TX is estimated to change from 386,248 to 418,516, resulting in a growth of 8.4% between the year 2000 and the current year. Over the next five years, the population is projected to grow by 8.1%. The Population in Texas is estimated to change from 20,851,820 to 22,701,767, resulting in a growth of 8.9% between 2000 and the current year. Over the next five years, the population is expected to grow by 8.6%. The Population in the United States is estimated to change from 281,421,906 to 295,140,073, resulting in a growth of 4.9% between 2000 and the current year. Over the next five years, the population is expected to grow by 4.9%.
x The current year median age for this population is 33.6, and the average age is 33.9. Five years from now, the median age is projected to be 35.2. The current year median age for Texas is 32.9, while the average age is 34.5. Five years from now, the median age is projected to be 34.1. The current year median age for the United States is 36.2, while the average age is 37.0. Five years from now, the median age is projected to be 37.4.
x Of Bay Area Houston, TX's current year population: 57.8% are White alone, 4.4% are African American, 0.3% are American Indian or Alaska Native alone, 4.8% are Asian, 1.6% are Some Other Race. For the entire United States: 73.6% are White alone, 12.4% are Black or African American alone, 0.9% are American Indian or Alaska Native alone, 4.1% are Asian alone, 0.2% are Native Hawaiian or other Pacific Islander alone, 6.1% are Some Other Race, and 2.7% are Two or More Races.
x Bay Area Houston, TX's current estimated Hispanic or Latino population is 31.1%, Texas current estimated Hispanic or Latino population is 35.0%, and the United States current estimated Hispanic or Latino population is 14.2%.

iv
Households
x The number of households in Bay Area Houston, TX is estimated to change from 137,376 to 148,627, resulting in an increase of 8.2% between 2000 and the current year. Over the next five years, the number is expected to increase by 8.2%. The number of households in Texas is estimated to change from 7,393,354 to 8,041,574, resulting in an increase of 8.8% between 2000 and the current year. Over the next five years, the number is projected to increase by 8.5%. The number of households in the United States is estimated to change from 105,480,101 to 111,006,738, resulting in an increase of 5.2% between 2000 and the current year. Over the next five years, the number is projected to increase by 5.1%.
Household Income
x The average Bay Area household income is estimated to be $75,279 for the current year, the average household income in Texas is estimated to be $62,838 for the current year, while the average household income for the USA is estimated to be $64,816 for the same time frame. The average household income in Bay Area Houston, TX is projected to increase 13.3% over the next five years, from $75,279 to $85,256. Texas is projected to have a 15.5% increase in average household income, and the United States is projected to have a 13.0% increase in average household income.
x The current year estimated per capita income for Bay Area Houston, TX is $26,850, compared to an estimate of $22, 532 for Texas, and $24,704 for the United States as a whole.
# % # % # %Income above poverty level 100,678 92.9% 5,008,739 88.1% 68,202,048 90.7%
Income below poverty level 7,706 7.1% 675,260 12.1% 7,009,664 9 .3%Total 108,384 100.0% 5,683,999 100.0% 75,211,712 100.0%
Bay Area Houston, TX Texas USA2005 Estimated Families by Poverty Status
v
Employment
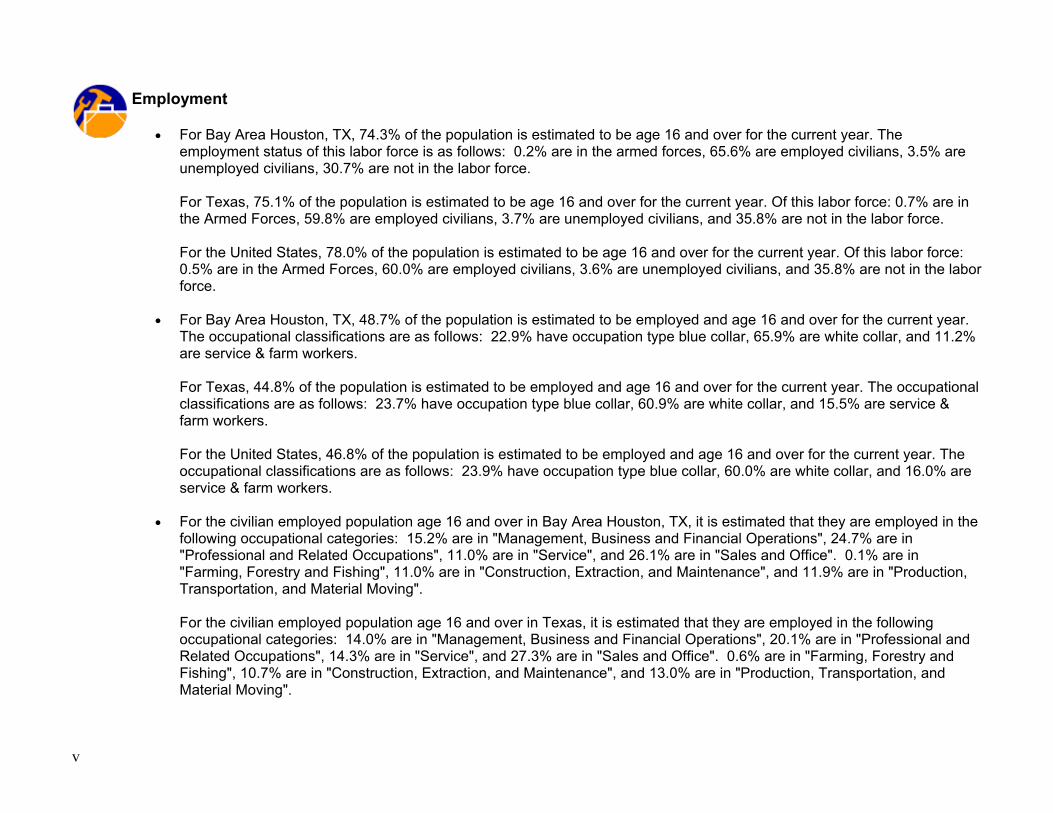
x For Bay Area Houston, TX, 74.3% of the population is estimated to be age 16 and over for the current year. The employment status of this labor force is as follows: 0.2% are in the armed forces, 65.6% are employed civilians, 3.5% are unemployed civilians, 30.7% are not in the labor force. For Texas, 75.1% of the population is estimated to be age 16 and over for the current year. Of this labor force: 0.7% are in the Armed Forces, 59.8% are employed civilians, 3.7% are unemployed civilians, and 35.8% are not in the labor force. For the United States, 78.0% of the population is estimated to be age 16 and over for the current year. Of this labor force: 0.5% are in the Armed Forces, 60.0% are employed civilians, 3.6% are unemployed civilians, and 35.8% are not in the labor force.
x For Bay Area Houston, TX, 48.7% of the population is estimated to be employed and age 16 and over for the current year. The occupational classifications are as follows: 22.9% have occupation type blue collar, 65.9% are white collar, and 11.2% are service & farm workers. For Texas, 44.8% of the population is estimated to be employed and age 16 and over for the current year. The occupational classifications are as follows: 23.7% have occupation type blue collar, 60.9% are white collar, and 15.5% are service & farm workers. For the United States, 46.8% of the population is estimated to be employed and age 16 and over for the current year. The occupational classifications are as follows: 23.9% have occupation type blue collar, 60.0% are white collar, and 16.0% are service & farm workers.
x For the civilian employed population age 16 and over in Bay Area Houston, TX, it is estimated that they are employed in the following occupational categories: 15.2% are in "Management, Business and Financial Operations", 24.7% are in "Professional and Related Occupations", 11.0% are in "Service", and 26.1% are in "Sales and Office". 0.1% are in "Farming, Forestry and Fishing", 11.0% are in "Construction, Extraction, and Maintenance", and 11.9% are in "Production, Transportation, and Material Moving". For the civilian employed population age 16 and over in Texas, it is estimated that they are employed in the following occupational categories: 14.0% are in "Management, Business and Financial Operations", 20.1% are in "Professional and Related Occupations", 14.3% are in "Service", and 27.3% are in "Sales and Office". 0.6% are in "Farming, Forestry and Fishing", 10.7% are in "Construction, Extraction, and Maintenance", and 13.0% are in "Production, Transportation, and Material Moving".

vi
For the civilian employed population age 16 and over in the United States, it is estimated that they are employed in the following occupational categories: 13.6% are in "Management, Business and Financial Operations", 20.3% are in "Professional and Related Occupations", 14.7% are in "Service", and 26.7% are in "Sales and Office". 0.7% are in "Farming, Forestry and Fishing", 9.5% are in "Construction, Extraction, and Maintenance", and 14.5% are in "Production, Transportation, and Material Moving".
Educational Attainment
x Currently, it is estimated that 9.8% of the population over 25 in Bay Area Houston, TX had earned a Masters. Professional, or Doctorate Degree and 19.5% had earned a Bachelor's Degree. For Texas, it is estimated that 7.8% of the population over 25 in had earned a Masters, Professional, or Doctorate Degree and 16.1% had earned a Bachelor's Degree. In comparison, for the United States, it is estimated that 8.9% of the population over 25 in Bay Area Houston, TX had earned a Masters. Professional, or Doctorate Degree and 15.7% had earned a Bachelor's Degree.
Dwellings
x Most of the dwellings (65.5%) in Bay Area Houston, TX are estimated to be Owner Occupied for the current year.
x Most of the dwellings (64.6%) in Texas are estimated to be Owner Occupied for the current year. For the entire country, the majority of housing units are Owner Occupied (66.7).
x The majority of dwellings in Bay Area Houston, TX (64.7%) are estimated to be "detached single units" for the current year. For Texas the majority of dwellings are estimated to be "detached single units" (63.7%). In the United States the majority of dwellings are estimated to be "detached single units" (60.6%).
x The majority of housing units in Bay Area Houston, TX (25.1%) are estimated to have been built between 1970 and 1979 for the current year. Most of the housing units in the Texas (20.4%) are estimated to have been built between 1980 and 1989 for the current year. The majority of housing units for the United States (17.1%) are estimated to have been built between 1970 and 1979 for the current year.

Other 2005 Demographic Estimates
# % # % # % # % # % # %
Total, Never Married 72,749 22.9% 4,365,657 25.1% 62,532,234 26.7% Speak Only English 278,847 72.7% 14,440,704 69.2% 225,841,462 82.1%Married, Spouse present 185,378 58.4% 9,286,135 53.4% 121,581,504 51.9% Speak Asian Language 11,838 3.1% 419,590 2.0% 7,348,892 2.7%Married, Spouse absent 14,359 4.5% 1,116,761 6.4% 12,499,765 5.3% Speak IndoEuropean 10,285 2.7% 397,753 1.9% 10,455,789 3.8%Widowed 13,235 4.2% 947,989 5.5% 15,190,160 6.5% Speak Spanish 80,850 21.1% 5,510,850 26.4% 29,639,145 10.8%Divorced 31,818 10.0% 1,672,769 9.6% 22,624,763 9.7% Speak Other Language 1,975 0.5% 93,196 0.5% 1,956,658 0.7%Males, Never Married 40,893 12.9% 2,410,325 13.9% 34,001,032 14.5% Total 383,795 100.0% 20,862,093 100.0% 275,241,946 100.0%Previously Married 18,918 6.0% 1,060,759 6.1% 14,692,932 6.3%Females, Never Married 31,856 10.0% 1,955,332 11.2% 28,531,202 12.2%Previously Married 32,148 10.1% 1,975,426 11.4% 28,103,574 12.0%Total 317,539 100.0% 17,389,311 100.0% 234,428,426 100.0%
# % # % # % # % # % # %Arab 2,048 0.5% 62,089 0.3% 1,069,423 0.4% Mexican 97,435 75.0% 6,030,504 75.9% 24,582,490 58.7%Czech 2,769 0.7% 149,590 0.7% 1,120,864 0.4% Puerto Rican 2,384 1.8% 90,937 1.2% 4,019,411 9.6%Danish 758 0.2% 31,072 0.1% 909,028 0.3% Cuban 1,210 0.9% 33,647 0.4% 1,457,426 3.5%Dutch 2,964 0.7% 124,692 0.6% 2,699,895 0.9% Other Hispanic or Latino 28,965 22.3% 1,786,605 22.5% 11,802,086 28.2%English 27,481 6.6% 1,178,733 5.2% 17,608,031 6.0% Total 129,994 100.0% 7,941,693 100.0% 41,861,413 100.0%French (ex. Basque) 9,909 2.4% 316,342 1.4% 5,136,009 1.7%French Canadian 2,817 0.7% 80,872 0.4% 2,029,855 0.7%German 38,500 9.2% 1,688,502 7.4% 31,774,849 10.8%Greek 847 0.2% 28,714 0.1% 987,801 0.3% # % # % # %Hungarian 967 0.2% 22,381 0.1% 949,778 0.3% Chinese, ex. Taiwanese 3,289 16.1% 126,574 18.4% 2,736,328 22.6%Irish 23,985 5.7% 1,060,770 4.7% 20,310,100 6.9% Filipino 1,424 7.0% 70,183 10.2% 2,134,750 17.6%Italian 10,148 2.4% 321,232 1.4% 13,533,270 4.6% Japanese 556 2.7% 20,408 3.0% 909,688 7.5%Lithuanian 191 0.1% 9,371 0.0% 444,082 0.2% Asian Indian 5,526 27.1% 166,121 24.1% 2,082,667 17.2%Norwegian 2,596 0.6% 99,012 0.4% 3,413,100 1.2% Korean 753 3.7% 55,067 8.0% 1,298,036 10.7%Polish 4,478 1.1% 180,932 0.8% 6,561,006 2.2% Vietnamese 6,213 30.5% 156,772 22.7% 1,319,059 10.9%Portuguese 292 0.1% 13,162 0.1% 966,924 0.3% Cambodian 190 0.9% 7,864 1.1% 194,946 1.6%Russian 969 0.2% 42,910 0.2% 2,010,731 0.7% Hmong 1 0.0% 382 0.1% 192,351 1.6%Scottish 5,031 1.2% 221,675 1.0% 3,330,941 1.1% Laotian 13 0.1% 10,951 1.6% 196,691 1.6%Scotch-Irish 6,016 1.4% 292,808 1.3% 3,465,147 1.2% Thai 150 0.7% 8,722 1.3% 132,858 1.1%Slovak 358 0.1% 7,728 0.0% 528,106 0.2% Other Asian 1,889 9.3% 54,547 7.9% 672,008 5.5%Subsaharan African 1,439 0.3% 140,244 0.6% 1,767,855 0.6% Two or more Asian cat. 397 2.0% 11,892 1.7% 259,909 2.1%Swedish 2,322 0.6% 92,421 0.4% 2,575,529 0.9% Total 20,401 100.0% 689,483 100.0% 12,129,291 100.0%Swiss 409 0.1% 19,501 0.1% 567,044 0.2%Ukrainian 338 0.1% 12,436 0.1% 693,834 0.2%United States 33,084 7.9% 1,699,657 7.5% 21,710,841 7.4%Welsh 1,246 0.3% 51,274 0.2% 936,753 0.3%West Indian (exc Hisp) 709 0.2% 36,222 0.2% 1,793,655 0.6%Other 157,722 37.7% 10,093,129 44.5% 87,525,869 29.7%Unclassified 78,123 18.7% 4,624,296 20.4% 58,719,753 19.9%Total 418,516 100.0% 22,701,767 100.0% 295,140,073 100.0%
Bay Area Houston Texas USA2005 Estimated Population Age 15 and Over by Marital Status
2005 Estimated Population by Ancestry
Bay Area Houston Texas USA 2005 Hispanic or Latino by Origin
Bay Area Houston Texas USA
Bay Area Houston Texas USA2005 Estimated Population, Asian Alone Race by Category
2005 Estimated Population by Language Spoken At
Home (Age 5+)
Bay Area Houston Texas USA
ANCESTRYThe data on ancestry were derived from answers to long-form questionnaire Item 10, which was asked of a
sample of the population. The data represent self-classification by people according to the ancestry group or groups with which they most closely identify. Ancestry refers to a person’s ethnic origin or descent, ‘‘roots,’’
heritage, or the place of birth of the person, the person’s parents, or their ancestors before their arrival in the United States.
Note that figures in these tables are not broken out by Non-Hispanic origin - use caution when comparing to other tables in the report.
vii

University of Houston - Clear LakeCenter for Economic Development and Research
Profile of Bay Area Houston, TXClaritas 2005 Demographics
Figure 1: Bay Area Houston, TX - Population
Comparing 1970 to 2005:
1970 1980 1990 2000 2005 Estimate
2010 Projected Change Percent
Change157,237 246,901 313,924 386,248 418,516 452,529 261,279 166.2
Estimated figures use currently available data sources, whereas Projected figures use a projection calculation. Avg. annual growth = % chg. / 35 (# of yrs.) The annual average growth rate for Bay Area Houston is estimated at about 4.7% comparing 1970 to 2005.
The figures in this report were derived from a 2005 Claritas ixpress demographic software using block group analysis for Bay Area Houston, TX, which includes the Friendswood, Houston, Kemah, La Porte, League City, Nassau Bay, Pasadena, Seabrook, and Webster area, which encompasses parts of Harris and Galveston counties. Historical figures were derived using a GeoLytics
database that normalized previous year census tract data to match 2000 boundaries for trend analysis reporting. All 2000 and current estimates and projections use Claritas. 1970, 1980 and 1990 used Geolyctics. Variances for comparative analysis appear insignificant.
Population:
Total Population
Comparing population changes from 1970 to 2005, Bay Area Houston, TX experienced a 166.2 percent increase.
050,000
100,000150,000200,000250,000300,000350,000400,000450,000500,000
Num
ber
Total Population Trend for Bay Area Houston, TX
Total Population 157,237 246,901 313,924 386,248 418,516 452,529
1970 1980 1990 2000 2005 Estimate
2010 Projected
page 1 bay area demo - 2005
University of Houston - Clear LakeCenter for Economic Development and Research
Profile of Bay Area Houston, TXClaritas 2005 Demographics
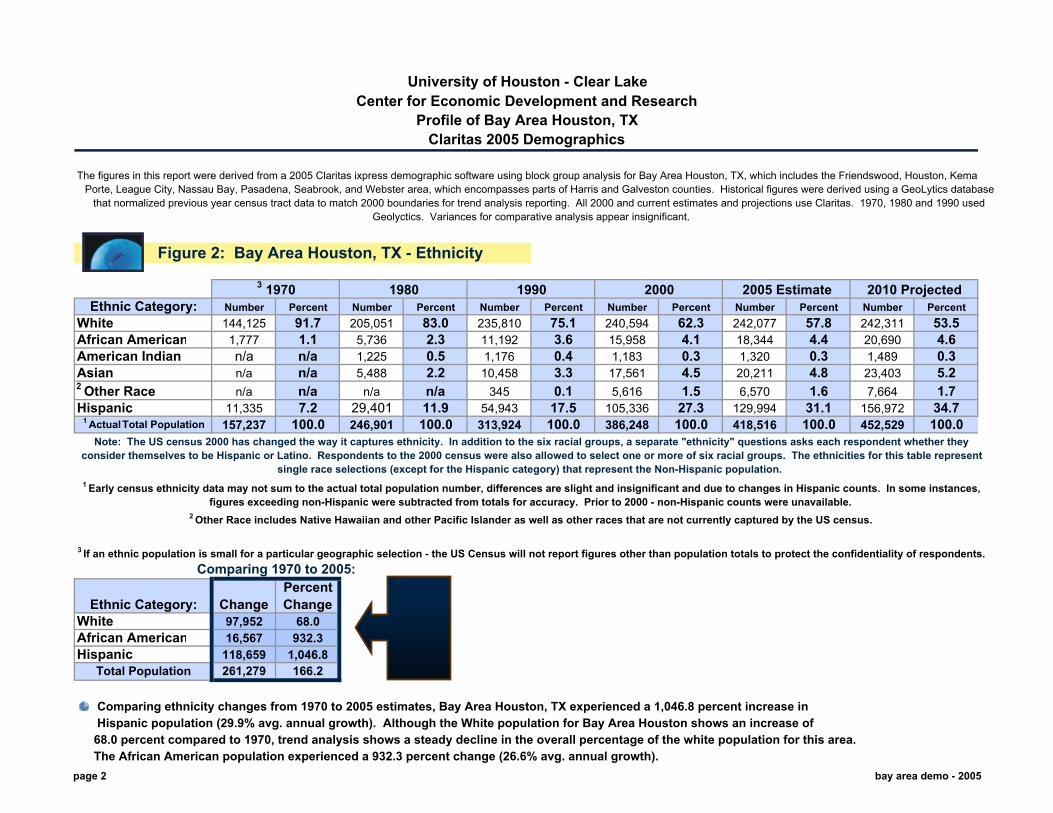
Figure 2: Bay Area Houston, TX - Ethnicity
3 1970 1980 1990 2000 2005 Estimate 2010 ProjectedEthnic Category: Number Percent Number Percent Number Percent Number Percent Number Percent Number Percent
White 144,125 91.7 205,051 83.0 235,810 75.1 240,594 62.3 242,077 57.8 242,311 53.5African American 1,777 1.1 5,736 2.3 11,192 3.6 15,958 4.1 18,344 4.4 20,690 4.6American Indian n/a n/a 1,225 0.5 1,176 0.4 1,183 0.3 1,320 0.3 1,489 0.3Asian n/a n/a 5,488 2.2 10,458 3.3 17,561 4.5 20,211 4.8 23,403 5.22 Other Race n/a n/a n/a n/a 345 0.1 5,616 1.5 6,570 1.6 7,664 1.7Hispanic 11,335 7.2 29,401 11.9 54,943 17.5 105,336 27.3 129,994 31.1 156,972 34.7
1 Actual Total Population 157,237 100.0 246,901 100.0 313,924 100.0 386,248 100.0 418,516 100.0 452,529 100.0
Comparing 1970 to 2005:
Ethnic Category: ChangePercent Change
White 97,952 68.0African American 16,567 932.3Hispanic 118,659 1,046.8
Total Population 261,279 166.2
Comparing ethnicity changes from 1970 to 2005 estimates, Bay Area Houston, TX experienced a 1,046.8 percent increase in Hispanic population (29.9% avg. annual growth). Although the White population for Bay Area Houston shows an increase of 68.0 percent compared to 1970, trend analysis shows a steady decline in the overall percentage of the white population for this area. The African American population experienced a 932.3 percent change (26.6% avg. annual growth).
3 If an ethnic population is small for a particular geographic selection - the US Census will not report figures other than population totals to protect the confidentiality of respondents.
The figures in this report were derived from a 2005 Claritas ixpress demographic software using block group analysis for Bay Area Houston, TX, which includes the Friendswood, Houston, KemaPorte, League City, Nassau Bay, Pasadena, Seabrook, and Webster area, which encompasses parts of Harris and Galveston counties. Historical figures were derived using a GeoLytics database
that normalized previous year census tract data to match 2000 boundaries for trend analysis reporting. All 2000 and current estimates and projections use Claritas. 1970, 1980 and 1990 used Geolyctics. Variances for comparative analysis appear insignificant.
Note: The US census 2000 has changed the way it captures ethnicity. In addition to the six racial groups, a separate "ethnicity" questions asks each respondent whether they consider themselves to be Hispanic or Latino. Respondents to the 2000 census were also allowed to select one or more of six racial groups. The ethnicities for this table represent
single race selections (except for the Hispanic category) that represent the Non-Hispanic population.1 Early census ethnicity data may not sum to the actual total population number, differences are slight and insignificant and due to changes in Hispanic counts. In some instances,
figures exceeding non-Hispanic were subtracted from totals for accuracy. Prior to 2000 - non-Hispanic counts were unavailable.2 Other Race includes Native Hawaiian and other Pacific Islander as well as other races that are not currently captured by the US census.
page 2 bay area demo - 2005
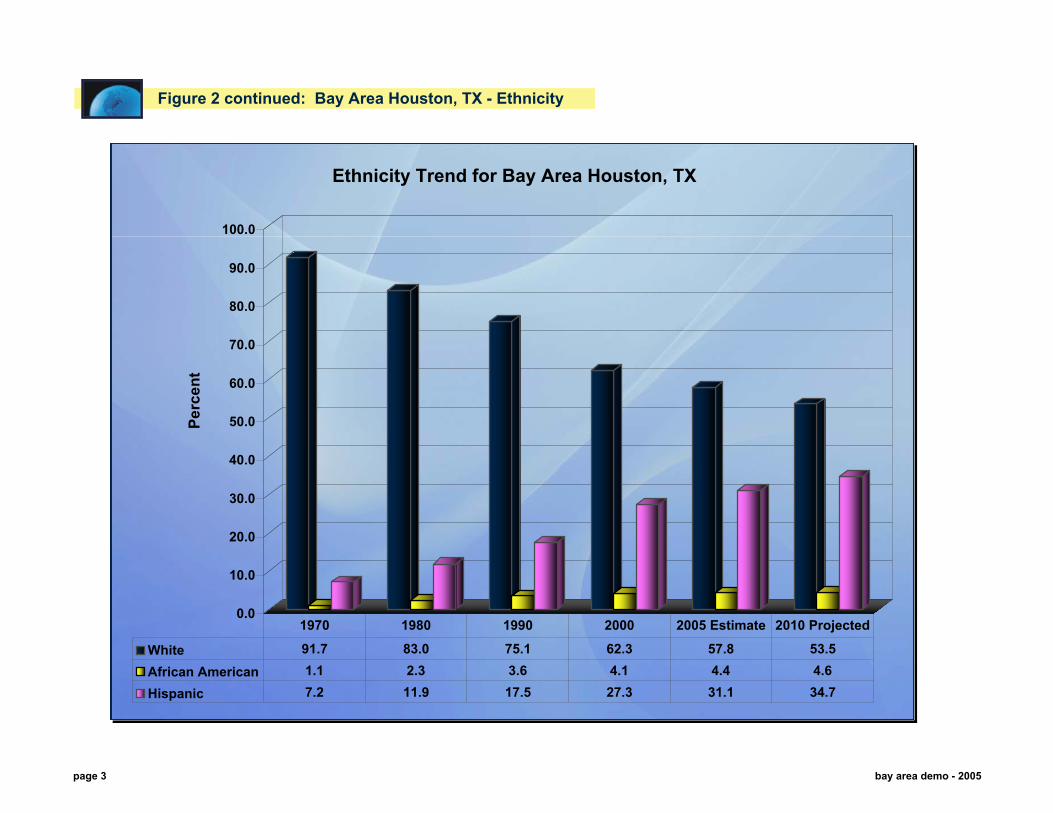
Figure 2 continued: Bay Area Houston, TX - Ethnicity
0.0
10.0
20.0
30.0
40.0
50.0
60.0
70.0
80.0
90.0
100.0
Ethnicity Trend for Bay Area Houston, TX
White 91.7 83.0 75.1 62.3 57.8 53.5African American 1.1 2.3 3.6 4.1 4.4 4.6Hispanic 7.2 11.9 17.5 27.3 31.1 34.7
1970 1980 1990 2000 2005 Estimate 2010 Projected
Perc
ent
page 3 bay area demo - 2005

University of Houston - Clear LakeCenter for Economic Development and Research
Profile of Bay Area Houston, TXClaritas 2005 Demographics
Figure 3: Bay Area Houston, TX - Age Categories - Totals may differ slightly from actual total population for early census yearscategory 1970 0 1980 0 1990 0 2000 0 2002 0 2007 0
1 1970 1980 1990 2000 2005 Estimate 2010 Projected
Total Population (All Races) Number Percent Number Percent Number Percent Number Percent Number Percent Number Percent
0-4 Years Old 15,766 10.0 21,582 8.7 26,080 8.3 31,294 8.1 34,721 8.3 35,907 7.9
5-9 Years Old 18,870 12.0 21,674 8.8 26,236 8.4 31,981 8.3 32,948 7.9 34,661 7.7
10-14 Years Old 18,207 11.6 22,381 9.1 24,192 7.7 31,615 8.2 33,308 8.0 33,941 7.5
15-24 Years Old 26,069 16.6 47,332 19.2 45,241 14.4 54,403 14.1 59,802 14.3 64,674 14.3
25-34 Years Old 26,483 16.8 49,215 19.9 65,040 20.7 59,228 15.3 57,115 13.6 56,003 12.4
35-44 Years Old 22,139 14.1 34,364 13.9 53,298 17.0 68,198 17.7 67,376 16.1 66,017 14.6
45-54 Years Old 16,404 10.4 24,460 9.9 34,460 11.0 52,575 13.6 61,854 14.8 68,493 15.1
55-64 Years Old 8,208 5.2 15,215 6.2 21,356 6.8 29,215 7.6 38,624 9.2 50,776 11.2
65-74 Years Old 3,316 2.1 6,660 2.7 11,745 3.7 16,481 4.3 19,374 4.6 25,642 5.7
75 Years Old Plus 1,802 1.1 3,086 1.2 6,273 2.0 11,258 2.9 13,394 3.2 16,415 3.6
Total 157,237 100.0 246,901 100.0 313,924 100.0 386,248 100.0 418,516 100.0 452,529 100.0
Population 25 Years Old Plus 78,352 49.8 133,000 53.9 192,172 61.2 236,955 61.3 257,737 61.6 283,346 62.6
The figures in this report were derived from a 2005 Claritas ixpress demographic software using block group analysis for Bay Area Houston, TX, which includes the Friendswood, Houston, Kemah, La Porte, League City, Nassau Bay, Pasadena, Seabrook, and Webster area, which encompasses parts of Harris and Galveston counties. Historical figures were derived using a GeoLytics database
that normalized previous year census tract data to match 2000 boundaries for trend analysis reporting. All 2000 and current estimates and projections use Claritas. 1970, 1980 and 1990 used Geolyctics. Variances for comparative analysis appear insignificant.
1 Early census ethnicity data may not sum to the actual total population number, differences are slight and insignificant and due to census methodology. (actual sum of age grps. - 1970 = 157,264; 1980 = 245,969; 1990 = 313,921)
page 4 bay area demo - 2005

Figure 3: Bay Area Houston, TX - Age Categories continued:
The most prominent age group pyramid for Bay Area Houston, TX for 2005 exists among the 35 to 44 age categories and the 45 to 54 age categories which suggests that the current population majority is middle-aged. This age group projects a spike in the 55 to 64 age group range for 2010.
Total Bay Area Houston, TX Population: Age Categories Trend - Percents
0.0
2.0
4.0
6.0
8.0
10.0
12.0
14.0
16.0
18.0
20.0
22.0
Perc
ent
1970 10.0 12.0 11.6 16.6 16.8 14.1 10.4 5.2 2.1 1.11980 8.7 8.8 9.1 19.2 19.9 13.9 9.9 6.2 2.7 1.21990 8.3 8.4 7.7 14.4 20.7 17.0 11.0 6.8 3.7 2.02000 8.1 8.3 8.2 14.1 15.3 17.7 13.6 7.6 4.3 2.92005 Estimate 8.3 7.9 8.0 14.3 13.6 16.1 14.8 9.2 4.6 3.22010 Projected 7.9 7.7 7.5 14.3 12.4 14.6 15.1 11.2 5.7 3.6
0-4 Years Old
5-9 Years Old
10-14 Years Old
15-24 Years Old
25-34 Years Old
35-44 Years Old
45-54 Years Old
55-64 Years Old
65-74 Years Old
75 Years Old Plus
page 5 bay area demo - 2005

University of Houston - Clear LakeCenter for Economic Development and Research
Profile of Bay Area Houston, TXClaritas 2005 Demographics
Figure 4a: Bay Area Houston, TX - Educational Levels - DetailedFor Population 25 Years and Older: 2010 projections not available. 1970 & 1980 do not include "Associate degree."
1970 1980 1990 2000 2005 EstimateEducation Category: Number Percent Number Percent Number Percent Number Percent Number Percent
Completed 0-8 Years of School 11,258 14.4 12,376 9.3 12,833 6.7 17,352 7.3 18,548 7.2
Completed 9-11 Years of School 17,645 22.5 18,441 13.9 20,862 10.9 24,953 10.5 26,489 10.3
Completed High School (or GED) 24,127 30.8 44,753 33.6 48,363 25.2 52,912 22.3 56,780 22.0Completed 1-3 Years of College (some college - no degree) 11,556 14.7 27,907 21.0 46,524 24.2 58,455 24.7 63,844 24.8
Have an Associate Degree n/a n/a n/a n/a 12,104 6.3 15,325 6.5 16,745 6.5Have a Bachelors and or Graduate Professional Degree 13,751 17.6 29,524 22.2 51,484 26.8 68,646 29.0 75,331 29.2
1 Actual Population 25 Years and Older
78,352 100.0 133,000 100.0 192,172 100.0 236,955 100.0 257,737 100.0
The figures in this report were derived from a 2005 Claritas ixpress demographic software using block group analysis for Bay Area Houston, TX, which includes the Friendswood, Houston, Kemah, La Porte, League City, Nassau Bay, Pasadena, Seabrook, and Webster area, which encompasses parts of Harris and Galveston counties. Historical figures were derived using a GeoLytics database that normalized previous year census tract data to match 2000 boundaries for trend analysis reporting. All 2000 and current estimates and projections use Claritas. 1970, 1980 and 1990 used Geolyctics.
Variances for comparative analysis appear insignificant.
1 Actual Population 25 Years and Older differs slightly from the actual summed count prior to 2005 for this figure due to US Census methodology - (25 plus totals only: summed total 1970 = 78,337; summed total 1980 = 133,001; summed total 1990 = 192,170; summed total 2000 = 237,643). The differences appear insignificant.
2005 Estimated Education Levels for Bay Area Houston, TX
7.2 10.3
22.0 24.8
6.5
29.2
0.05.0
10.015.020.025.030.035.0
Completed 0-8 Years ofSchool
Completed 9-11 Years ofSchool
Completed High School(or GED)
Completed 1-3 Years ofCollege (some college -
no degree)
Have an AssociateDegree
Have a Bachelors and orGraduate Professional
Degree
Perc
ent
page 6 bay area demo - 2005
University of Houston - Clear LakeCenter for Economic Development and Research
Profile of Bay Area Houston, TXClaritas 2005 Demographics
1970 data was not captured by the US census. 1980 does not include "other" or "Associate degree."
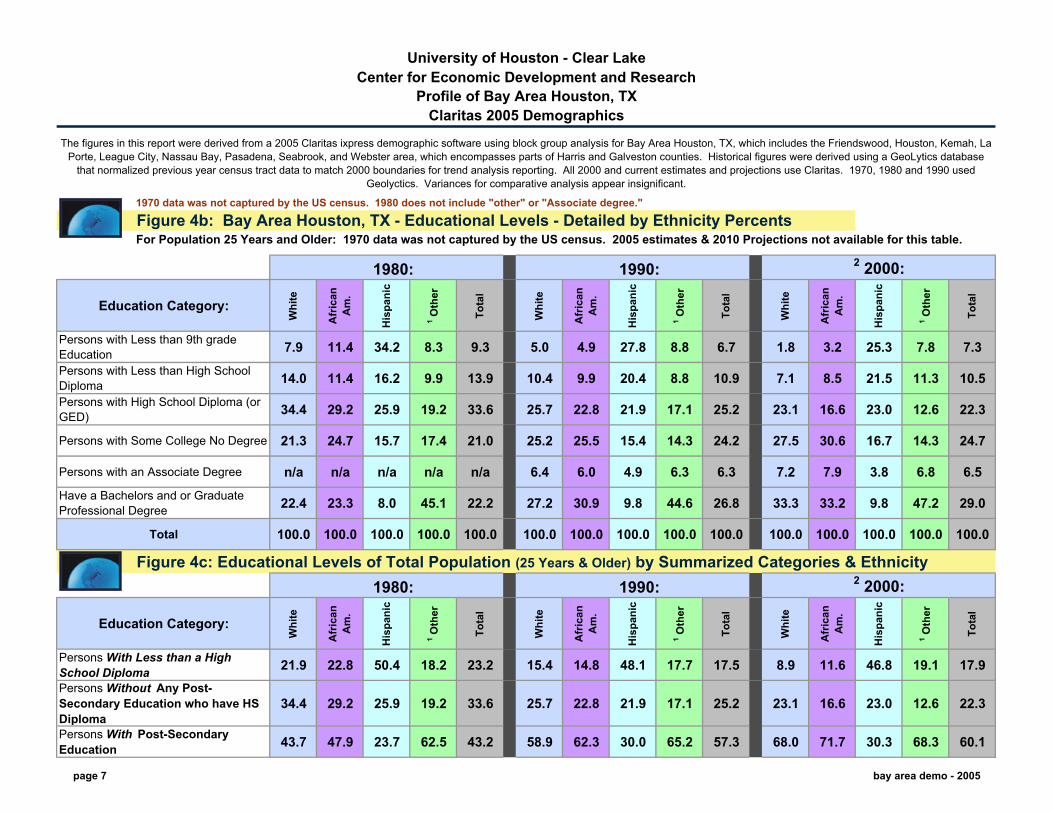
Figure 4b: Bay Area Houston, TX - Educational Levels - Detailed by Ethnicity PercentsFor Population 25 Years and Older: 1970 data was not captured by the US census. 2005 estimates & 2010 Projections not available for this table.
1980: 1990: 2 2000:
Education Category:W
hite
Afr
ican
A
m.
His
pani
c
1 Oth
er
Tota
l
Whi
te
Afr
ican
A
m.
His
pani
c
1 Oth
er
Tota
l
Whi
te
Afr
ican
A
m.
His
pani
c
1 Oth
er
Tota
l
Persons with Less than 9th grade Education 7.9 11.4 34.2 8.3 9.3 5.0 4.9 27.8 8.8 6.7 1.8 3.2 25.3 7.8 7.3Persons with Less than High School Diploma 14.0 11.4 16.2 9.9 13.9 10.4 9.9 20.4 8.8 10.9 7.1 8.5 21.5 11.3 10.5Persons with High School Diploma (or GED) 34.4 29.2 25.9 19.2 33.6 25.7 22.8 21.9 17.1 25.2 23.1 16.6 23.0 12.6 22.3
Persons with Some College No Degree 21.3 24.7 15.7 17.4 21.0 25.2 25.5 15.4 14.3 24.2 27.5 30.6 16.7 14.3 24.7
Persons with an Associate Degree n/a n/a n/a n/a n/a 6.4 6.0 4.9 6.3 6.3 7.2 7.9 3.8 6.8 6.5Have a Bachelors and or Graduate Professional Degree 22.4 23.3 8.0 45.1 22.2 27.2 30.9 9.8 44.6 26.8 33.3 33.2 9.8 47.2 29.0
Total 100.0 100.0 100.0 100.0 100.0 100.0 100.0 100.0 100.0 100.0 100.0 100.0 100.0 100.0 100.0
Figure 4c: Educational Levels of Total Population (25 Years & Older) by Summarized Categories & Ethnicity1980: 1990: 2 2000:
Education Category:
Whi
te
Afr
ican
A
m.
His
pani
c
1 Oth
er
Tota
l
Whi
te
Afr
ican
A
m.
His
pani
c
1 Oth
er
Tota
l
Whi
te
Afr
ican
A
m.
His
pani
c
1 Oth
er
Tota
l
Persons With Less than a High School Diploma 21.9 22.8 50.4 18.2 23.2 15.4 14.8 48.1 17.7 17.5 8.9 11.6 46.8 19.1 17.9Persons Without Any Post-Secondary Education who have HS Diploma
34.4 29.2 25.9 19.2 33.6 25.7 22.8 21.9 17.1 25.2 23.1 16.6 23.0 12.6 22.3
Persons With Post-Secondary Education 43.7 47.9 23.7 62.5 43.2 58.9 62.3 30.0 65.2 57.3 68.0 71.7 30.3 68.3 60.1
The figures in this report were derived from a 2005 Claritas ixpress demographic software using block group analysis for Bay Area Houston, TX, which includes the Friendswood, Houston, Kemah, La Porte, League City, Nassau Bay, Pasadena, Seabrook, and Webster area, which encompasses parts of Harris and Galveston counties. Historical figures were derived using a GeoLytics database
that normalized previous year census tract data to match 2000 boundaries for trend analysis reporting. All 2000 and current estimates and projections use Claritas. 1970, 1980 and 1990 used Geolyctics. Variances for comparative analysis appear insignificant.
page 7 bay area demo - 2005

See footnotes for more definitions.
Figure 4c continued: Bay Area Houston, TX - Educational Levels of Total Population (25 Years & Older)by Summarized Categories
The educational levels for Bay Area Houston, TX indicate that the population 25 years and older are obtaining Post-Secondary education at a higher percentage comparing 2000 to 1980. Figure 4a estimates that for 2005, 60.5 percent of the Bay Area Houston, TX population who are 25 and olde are obtaining Post-Secondary education. However, comparing 2000 to 1990, the percent of persons with Post-Secondary education has not experienced a significant change. 2005 estimates (60.5 percent) do not show that persons 25 plus are obtaining Post-Secondary education at a significantly higher rate compared to 2000 (60.1 percent).
2 For this figure, Claritas ixpress 2000 figures by ethnicity are unavailable, GeoLytic published figures are used except for totals. Differences are slight.
Note: The US Census 2000 has changed the way it captures ethnicity; In addition to the six racial groups, a separate "ethnicity" question asks each respondent whether they consider themselves to be Hispanic or Latino. Respondents to the 2000 census were also allowed to select one or more of six racial groups. The majority of data for this table does not provide a count for Hispanic vs. Non-Hispanic, therefore ethnicity counts may be duplicated in some categories as Hispanics may have chosen more than one race. The 2000 census gives a Non-Hispanic white count, but does not provide a count for other racial
groups who may have chosen more than one race.
1 Other Race includes Asian, Native Hawaiian and other Pacific Islander as well as other races that are not currently captured by the US census.
Educational Levels of Total Bay Area Houston, TX Population (25 Years & Older)by Summarized Categories
0.0
10.0
20.0
30.0
40.0
50.0
60.0
70.0
Perc
ent
Persons With Less than a High SchoolDiploma
23.2 17.5 17.9
Persons Without Any Post-SecondaryEducation
33.6 25.2 22.3
Persons With Post-Secondary Education 43.2 57.3 60.1
1980 1990 2000
page 8 bay area demo - 2005

University of Houston - Clear LakeCenter for Economic Development and Research
Profile of Bay Area Houston, TXClaritas 2005 Demographics
Figure 5: Bay Area Houston, TX - Business Facts - 2005 Business Sites by 2-digit Standard Industrial Classification (SIC) Code (data will differ slightly with NAICS data and other Biz Fact data)
Total Establishments Total Employees Sales ($ in Millions)
Establishments with 20 or more Employees
$18,131# % # % $ (Millions) # %
Agriculture & Natural Resources 205 1.49% 1,287 0.74% $53 12 0.74%01 Agricultural products: crops 5 0.04% 10 0.01% $1 0 0.00%02 Agricultural products: stock 4 0.03% 7 0.00% $0 0 0.00%07 Agricultural services 196 1.42% 1,270 0.73% $51 12 0.74%08 Forestry 0 0.00% 0 0.00% $0 0 0.00%09 Fishing, hunting, trapping 0 0.00% 0 0.00% $0 0 0.00%
Natural Resources extraction 37 0.27% 556 0.32% $53 5 0.31%10 Metal mining 0 0.00% 0 0.00% $0 0 0.00%12 Anthracite & bituminous 0 0.00% 0 0.00% $0 0 0.00%13 Oil & gas extraction 33 0.24% 540 0.31% $51 5 0.31%14 Nonmetallic mining 4 0.03% 16 0.01% $1 0 0.00%
Construction 976 7.08% 9,270 5.30% $1,610 99 6.10%15 General building contractors 337 2.44% 2,462 1.41% $682 26 1.60%16 Heavy constr. contractors 65 0.47% 1,312 0.75% $143 22 1.35%17 Special trade contractors 574 4.16% 5,496 3.14% $785 51 3.14%
Manufacturing 654 4.74% 20,196 11.54% $1,738 198 12.19%20 Food & kindred products 16 0.12% 354 0.20% $34 4 0.25%21 Tobacco manufacturers 0 0.00% 0 0.00% $0 0 0.00%22 Textile mill products 2 0.01% 3 0.00% $0 0 0.00%23 Apparel & textiles 24 0.17% 107 0.06% $7 0 0.00%24 Lumber & wood products 9 0.07% 177 0.10% $16 3 0.18%25 Furniture & fixtures 3 0.02% 45 0.03% $3 1 0.06%26 Paper & allied products 6 0.04% 1,115 0.64% $69 1 0.06%27 Printing & publishing 109 0.79% 1,019 0.58% $72 13 0.80%
2005 Total Business Sites by 2 digit SIC Code:
SIC Code / SIC Code Label 13,795 175,023 1,624
page 9Note: For sales figures in millions: Multiply figure * 1,000,000 for sales dollars.
$2 would compute to $2,000,000. Tot. estimated sales for area = 18,131,000,000 (18.1 billion dollars). bay area demo - 2005

Total Establishments Total Employees Sales ($ in Millions)
Establishments with 20 or more Employees
$18,131# % # % $ (Millions) # %
2005 Total Business Sites by 2 digit SIC Code:
SIC Code / SIC Code Label 13,795 175,023 1,624
28 Chemical products 82 0.59% 7,375 4.21% $699 60 3.69%29 Petroleum & coal products 6 0.04% 640 0.37% $69 4 0.25%30 Rubber & plastic products 17 0.12% 719 0.41% $51 8 0.49%31 Leather products 1 0.01% 1 0.00% $0 0 0.00%32 Stone, clay & glass products 24 0.17% 289 0.17% $28 5 0.31%33 Primary metal industries 13 0.09% 315 0.18% $27 6 0.37%34 Fabricated metal products 61 0.44% 756 0.43% $77 16 0.99%35 Machinery, not electrical 106 0.77% 2,076 1.19% $206 25 1.54%36 Electric & electronic mach. 28 0.20% 553 0.32% $57 10 0.62%37 Transportation equipment 13 0.09% 193 0.11% $15 4 0.25%38 Instruments & related 53 0.38% 3,961 2.26% $263 28 1.72%39 Miscellaneous manufacturing 81 0.59% 498 0.28% $47 10 0.62%
Transportation, Utilities 608 4.41% 8,333 4.76% $858 112 6.90%40 Railroad transportation 5 0.04% 289 0.17% $30 3 0.18%41 Local & inter-urban 47 0.34% 881 0.50% $38 13 0.80%42 Trucking and warehousing 193 1.40% 2,724 1.56% $273 32 1.97%43 U.S. postal service 20 0.14% 598 0.34% $4 8 0.49%44 Water transportation 95 0.69% 813 0.46% $107 11 0.68%45 Transportation by air 15 0.11% 136 0.08% $15 2 0.12%46 Pipelines, except gas 12 0.09% 311 0.18% $60 2 0.12%47 Transportation services 91 0.66% 598 0.34% $122 6 0.37%48 Communications 77 0.56% 781 0.45% $78 19 1.17%49 Electric, gas, sanitation 53 0.38% 1,202 0.69% $130 16 0.99%
Wholesale Trade 644 4.67% 8,597 4.91% $1,547 62 3.82%50 Wholesale: durable goods 510 3.70% 4,911 2.81% $879 45 2.77%51 Wholesale: nondur. goods 134 0.97% 3,686 2.11% $668 17 1.05%
Retail Trade 3,223 23.36% 39,545 22.59% $4,735 457 28.14%52 Building, garden supplies 154 1.12% 2,622 1.50% $368 30 1.85%53 General merchandise stores 97 0.70% 4,841 2.77% $548 43 2.65%54 Food stores 297 2.15% 4,129 2.36% $681 30 1.85%55 Auto dealers, gas stations 417 3.02% 4,441 2.54% $1,320 39 2.40%
page 10Note: For sales figures in millions: Multiply figure * 1,000,000 for sales dollars.
$2 would compute to $2,000,000. Tot. estimated sales for area = 18,131,000,000 (18.1 billion dollars). bay area demo - 2005

Total Establishments Total Employees Sales ($ in Millions)
Establishments with 20 or more Employees
$18,131# % # % $ (Millions) # %
2005 Total Business Sites by 2 digit SIC Code:
SIC Code / SIC Code Label 13,795 175,023 1,624
56 Apparel, accessory stores 233 1.69% 1,743 1.00% $122 16 0.99%57 Furniture, home furnishings 333 2.41% 2,075 1.19% $425 19 1.17%58 Eating & drinking places 765 5.55% 14,260 8.15% $683 215 13.24%59 Miscellaneous 927 6.72% 5,434 3.10% $589 65 4.00%
Finance, Insurance, Real Estate 1,375 9.97% 9,497 5.43% $1,908 63 3.88%60 Banking 154 1.12% 1,806 1.03% $473 15 0.92%61 Credit agencies, not banks 129 0.94% 834 0.48% $253 3 0.18%62 Security, commodity brokers 130 0.94% 694 0.40% $113 3 0.18%63 Insurance carriers 26 0.19% 102 0.06% $21 0 0.00%64 Insurance Agents, Brokers and Service 293 2.12% 1,536 0.88% $359 10 0.62%65 Real estate 631 4.57% 4,397 2.51% $665 30 1.85%67 Holding & other companies 12 0.09% 128 0.07% $25 2 0.12%
Services 5,647 40.94% 63,214 36.12% $5,629 545 33.56%70 Hotels & other lodging 69 0.50% 1,278 0.73% $47 12 0.74%72 Personal services 874 6.34% 3,592 2.05% $140 16 0.99%73 Business services 793 5.75% 6,806 3.89% $851 76 4.68%75 Auto repairs & garages 451 3.27% 2,126 1.21% $185 11 0.68%76 Misc. repair services 196 1.42% 1,418 0.81% $176 15 0.92%78 Motion pictures 62 0.45% 701 0.40% $97 6 0.37%79 Amusement & recreation 309 2.24% 3,099 1.77% $227 38 2.34%80 Health services 1,094 7.93% 16,080 9.19% $1,217 107 6.59%81 Legal services 246 1.78% 865 0.49% $159 5 0.31%82 Educational services 250 1.81% 14,623 8.35% $1,426 149 9.17%83 Social services 265 1.92% 3,748 2.14% $202 45 2.77%84 Museums, botanical, zoos 5 0.04% 52 0.03% $2 2 0.12%86 Membership organizations 412 2.99% 2,567 1.47% $174 18 1.11%87 Engineering & management 587 4.26% 6,150 3.51% $722 44 2.71%89 Misc. services 34 0.25% 109 0.06% $7 1 0.06%
90 Government 252 1.83% 12,501 7.14% $0 67 4.13%99 Non-classifiable 174 1.26% 2,027 1.16% $0 4 0.25%
page 11Note: For sales figures in millions: Multiply figure * 1,000,000 for sales dollars.
$2 would compute to $2,000,000. Tot. estimated sales for area = 18,131,000,000 (18.1 billion dollars). bay area demo - 2005

University of Houston - Clear LakeCenter for Economic Development and Research
Profile of Bay Area Houston, TXClaritas 2005 Demographics
Figure 6: Bay Area Houston, TX - Household Types
1970 1980 1990 2000 2005 2010Household Types Number % Number % Number % Number % Number % Number %
Total Family Households 40,903 88.9 66,494 79.2 83,909 73.6 100,780 73.4 108,384 72.9 116,488 72.5Total Non-Family Households 5,107 11.1 17,496 20.8 30,134 26.4 36,596 26.6 40,243 27.1 44,291 27.5Total Households 46,010 100.0 83,990 100.0 114,043 100.0 137,376 100.0 148,627 100.0 160,779 100.0
Household Types Change Percent Change
Total Family Households 67,481 165.0Total Non-Family Households 35,136 688.0
Total Households 102,617 223.0
Comparing 1970 to 2005:
Comparing the total number of Households from 1970 to 2005, Bay Area Houston, TX experienced a 223.0 percent increase or about 6.4 percent average annual growth. Non-Family or Non-traditional Households experienced a 688.0 percent change comparing 1970 to 2005 or an average annual growth of about 19.7 percent suggesting that households with Non-Family persons experienced an impressive growing trend for Bay Area Houston, TX.
A family is defined as a household with 2 or more blood-related or marriage-related individuals and is typically representative of more traditional household arrangements. Non-Family households can represent singles or individuals living together who are not blood or marriage related.
The figures in this report were derived from a 2005 Claritas ixpress demographic software using block group analysis for Bay Area Houston, TX, which includes the Friendswood, Houston, Kemah, La Porte, League City, Nassau Bay, Pasadena, Seabrook, and Webster area, which encompasses parts of Harris and Galveston counties. Historical figures were derived using a GeoLytics
database that normalized previous year census tract data to match 2000 boundaries for trend analysis reporting. All 2000 and current estimates and projections use Claritas. 1970, 1980 and 1990 used Geolyctics. Variances for comparative analysis appear insignificant.
Household Type Trend for Bay Area Houston, TX
0.0
50.0
100.0
Perc
ent
Total Family Households 88.9 79.2 73.6 73.4 72.9 72.5Total Non-Family Households 11.1 20.8 26.4 26.6 27.1 27.5
1970 1980 1990 2000 2005 2010
2005 Household Type
Family HHlds72.9%
Total Non-Family HHlds27.1%
page 12 bay area demo - 2005

Figure 7: Bay Area Houston, TX - Income Trends
1970 1980 1990 2000 2005 2010Income Information: Number % Number % Number % Number % Number % Number %
Families With Income Less than $15,000 28,523 69.7 11,645 17.5 8,879 10.6 6,562 6.5 6,209 5.7 5,904 5.1Families With $15,000-$24,999 in Income 10,392 25.4 17,551 26.4 10,085 12.0 7,416 7.3 6,521 6.0 5,938 5.1Families With $25,000-$49,999 in Income 1,766 4.3 31,557 47.5 29,812 35.5 24,764 24.4 22,306 20.6 20,603 17.7Families With Income GT or equal to $50,000 213 0.5 5,744 8.6 35,128 41.9 62,842 61.9 73,348 67.7 84,043 72.11 Total Number of Family Incomes calculated 40,894 100.0 66,497 100.0 83,904 100.0 101,584 100.0 108,384 100.0 116,488 100.0
Total Population 157,237 100.0 246,901 100.0 313,924 100.0 386,248 100.0 418,516 100.0 452,529 100.0Median Family Income n/a n/a $34,034.42 $62,475.00 $71,220.00 $80,672.00Average Family Income $12,729.06 $28,710.50 $48,060.38 $73,114.00 $85,402.00 $97,740.002 Income Equivalence $60,370.84 $64,143.64 $67,667.03 $78,132.18 $85,402.00 n/a
Change Percent Change
25,031 41.5 The Average Family Income experienced a 570.9 Percent Change comparing 2005 to 1970. However, when reviewing income equivalence (purchasing power), the change represents about 41.5 percent or about a 1.2 percent average annual growth.
Income Equivalence
Comparing 1970 to 2005:2 Income
Equivalence
1 Total Number of Family Incomes - Due to US Census methodology for calculating family incomes, some census family incomes exceed the actual number of family households presented in figure 6 for earlier years. Some family households consist of more than one family and were included in the calculation for earlier years. This is especially true for census 2000, where the number of families
calculated exceeds the actual number of families. See Figure 6 for actual number of family households.2 How much money would be equivalent today (using 2003 stats) to have the same purchasing power as the average family income for year represented? These relative values werproduced using an online calculator created by John J. McCusker (Ewing Halsell Professor of American History and Professor of Economics), Trinity University, San Antonio, Texas
"Comparing the Purchasing Power of Money in the United States (or Colonies) from 1665 to Any Other Year Including the Present" Economic History Services, 2004, URL : http://www.eh.net/hmit/ppowerusd/
Average Family Income Trend for Bay Area Houston, TX
$12,729.06$28,710.50
$48,060.38
$73,114.00$85,402.00
$97,740.00
$0.00
$25,000.00
$50,000.00
$75,000.00
$100,000.00
$125,000.00
1970 1980 1990 2000 2005 2010
Avg
. Inc
ome
($)
# %Income above poverty level 100,678 92.9%
Income below poverty level 7,706 7.1%Total 108,384 100.0%
Bay Area Houston, TX2005 Estimated Families by Poverty Status
page 13 bay area demo - 2005

University of Houston - Clear LakeCenter for Economic Development and Research
Profile of Bay Area Houston, TXClaritas 2005 Demographics
Figure 8a: Bay Area Houston, TX - ISD's - Ethnicity Percent TrendsPre-Kindergarten through 12th GradeData extracted from PIEMS website.
Year African American Hispanic White Economically
DisadvantagedNote: Other Ethnicities are not available 1994 5.6% 29.5% 59.9% 30.9%historically for this figure and therefore 1995 5.6% 30.5% 58.7% 32.8%are not included: See figure 8b for more 1996 5.8% 31.9% 57.3% 32.3%detail. 1997 5.8% 33.2% 55.8% 31.9%ISD = Independent School District Totals 1998 5.8% 34.4% 54.6% 33.2%
1999 5.9% 35.9% 52.9% 33.5%2000 5.9% 37.6% 51.3% 33.6%2001 5.9% 39.1% 49.6% 34.6%2002 6.1% 40.7% 47.7% 35.7%2003 6.3% 42.3% 45.8% 38.6%2004 6.7% 43.8% 44.0% 39.8%
Bay Area Houston ISD's show a steady increase in Hispanic percents, a steady decline in white percents, and small increases in African American percents. The percent of economically disadvantaged students continues to rise. Similar trends are present in the following tables, which display each ISD.
All Bay Area Houston ISD's Combined - Ethnicity Percent Trends
All Bay Area Houston ISD's Combined - Ethnicity Percent Trends
0.0%
20.0%
40.0%
60.0%
80.0%
Perc
ent
African American 5.6% 5.6% 5.8% 5.8% 5.8% 5.9% 5.9% 5.9% 6.1% 6.3% 6.7%
Hispanic 29.5% 30.5% 31.9% 33.2% 34.4% 35.9% 37.6% 39.1% 40.7% 42.3% 43.8%
White 59.9% 58.7% 57.3% 55.8% 54.6% 52.9% 51.3% 49.6% 47.7% 45.8% 44.0%
1994 1995 1996 1997 1998 1999 2000 2001 2002 2003 2004
ISD's included in the analysis:Clear Creek ISDFriendswood ISDLa Porte Area ISDPasadena ISD
page 14 bay area demo - 2005

Figure 8a continued: Bay Area Houston, TX - ISD's - Ethnicity Percent TrendsPre-Kindergarten through 12th GradeData extracted from PIEMS website.
Year African American Hispanic White Economically
DisadvantagedNote: Other Ethnicities are not available 1994 6.2% 9.7% 76.0% 10.1%historically for this figure and therefore 1995 6.2% 10.2% 75.5% 11.0%are not included: See figure 8b for more 1996 6.6% 10.6% 74.6% 10.9%detail. 1997 6.6% 10.8% 74.0% 8.1%
1998 6.7% 11.3% 73.5% 10.8%ISD = Independent School District Totals 1999 6.8% 11.9% 72.5% 11.4%
2000 6.5% 12.6% 71.9% 9.7%2001 6.5% 13.1% 71.1% 12.4%2002 6.8% 14.0% 69.6% 12.6%2003 7.1% 14.8% 68.4% 13.9%2004 7.4% 15.7% 67.2% 15.1%
Year African American Hispanic White Economically
Disadvantaged1994 1.6% 3.7% 92.3% 3.5%1995 1.3% 3.9% 92.4% 3.3%1996 1.1% 4.5% 91.8% 3.9%1997 1.0% 4.9% 91.1% 3.5%1998 1.2% 4.7% 90.9% 4.0%1999 1.3% 5.1% 90.5% 3.7%2000 1.5% 5.6% 89.7% 3.4%2001 1.7% 6.4% 88.7% 3.0%2002 1.7% 6.7% 88.1% 2.5%2003 2.0% 6.9% 87.6% 2.6%2004 2.1% 7.9% 86.3% 3.0%
Clear Creek ISD - Ethnicity Percent Trends
Friendswood ISD - Ethnicity Percent Trends
page 15 bay area demo - 2005

Figure 8a continued: Bay Area Houston, TX - ISD's - Ethnicity Percent TrendsPre-Kindergarten through 12th GradeData extracted from PIEMS website.
Year African American Hispanic White Economically
DisadvantagedNote: Other Ethnicities are not available 1994 8.6% 17.8% 72.1% 19.1%historically for this figure and therefore 1995 8.6% 17.5% 72.2% 21.4%are not included: See figure 8b for more 1996 8.3% 18.8% 71.3% 20.8%detail. 1997 8.1% 19.3% 71.1% 22.9%
1998 8.2% 20.2% 70.2% 23.9%ISD = Independent School District Totals 1999 7.8% 21.2% 69.6% 23.7%
2000 8.2% 21.7% 68.6% 25.3%2001 8.4% 23.5% 66.8% 24.5%2002 8.6% 24.5% 65.4% 30.0%2003 8.8% 26.6% 63.3% 29.4%2004 8.9% 28.1% 61.7% 31.6%
Year African American Hispanic White Economically
Disadvantaged1994 5.0% 46.6% 44.3% 48.8%1995 5.1% 49.0% 41.8% 52.1%1996 5.4% 51.3% 39.4% 51.6%1997 5.3% 54.1% 36.7% 53.0%1998 5.3% 56.3% 34.6% 53.7%1999 5.6% 58.7% 32.1% 53.9%2000 5.6% 61.4% 29.4% 55.2%2001 5.6% 64.1% 26.8% 55.7%2002 5.6% 66.8% 24.1% 57.3%2003 5.9% 68.9% 21.7% 62.2%2004 6.4% 70.7% 19.4% 63.2%
Pasadena ISD - Ethnicity Percent Trends
La Porte ISD - Ethnicity Percent Trends
page 16 bay area demo - 2005

University of Houston - Clear LakeCenter for Economic Development and Research
Profile of Bay Area Houston, TXClaritas 2005 Demographics
Figure 8b: Bay Area Houston, TX - Detail by ISD (Pre-K through 12th) Ethnicity Trends 1993-94 vs. 2003-04
1993-94 to 2003-04 Change
Clear Creek ISD African American 1,507 6.2 2,424 7.4 917 60.8Clear Creek ISD Hispanic 2,385 9.7 5,119 15.7 2,734 114.6Clear Creek ISD White 18,620 76.0 21,977 67.2 3,357 18.0Clear Creek ISD Asian/Pacific Islander n/a n/a 3,086 9.4 n/a n/aClear Creek ISD Native American n/a n/a 100 0.3 n/a n/aClear Creek ISD 1 Other 1,984 8.1 0 0.0 n/a n/aClear Creek ISD Total 24,496 100.0 32,706 100.0 8,210 33.5
1993-94 to 2003-04 Change
Friendswood ISD African American 64 1.6 115 2.1 51 79.7Friendswood ISD Hispanic 145 3.7 433 7.9 288 198.6Friendswood ISD White 3,648 92.3 4,754 86.3 1,106 30.3Friendswood ISD Asian/Pacific Islander n/a n/a 197 3.6 n/a n/aFriendswood ISD Native American n/a n/a 8 0.1 n/a n/aFriendswood ISD 1 Other 94 2.4 0 0.0 n/a n/aFriendswood ISD Total 3,951 100.0 5,507 100.0 1,556 39.4
1993-94 to 2003-04 Change
La Porte Area ISD African American 638 8.6 682 8.9 44 6.9La Porte Area ISD Hispanic 1,317 17.8 2,164 28.1 847 64.3La Porte Area ISD White 5,327 72.1 4,744 61.7 -583 -10.9La Porte Area ISD Asian/Pacific Islander n/a n/a 80 1.0 n/a n/aLa Porte Area ISD Native American n/a n/a 21 0.3 n/a n/aLa Porte Area ISD 1 Other 102 1.4 0 0.0 n/a n/aLa Porte Area ISD Total 7,384 100.0 7,691 100.0 307 4.2
1993-94 2003-04
Friendswood ISD - All Schools Combined - Pre-K through 12th Grade
Clear Creek ISD - All Schools Combined - Pre-K through 12th Grade
1993-94 2003-04
La Porte ISD - All Schools Combined - Pre-K through 12th Grade 1993-94 2003-04
page 17 bay area demo - 2005

1993-94 to 2003-04 Change
Pasadena ISD African American 1,976 5.0 2,959 6.4 983 49.7Pasadena ISD Hispanic 18,287 46.6 32,534 70.7 14,247 77.9Pasadena ISD White 17,392 44.3 8,918 19.4 -8,474 -48.7Pasadena ISD Asian/Pacific Islander n/a n/a 1,492 3.2 n/a n/aPasadena ISD Native American n/a n/a 99 0.2 n/a n/aPasadena ISD 1 Other 1,610 4.1 0 0.0 n/a n/aPasadena ISD Total 39,265 100.0 46,002 100.0 6,737 17.2
1993-94 to 2003-04 Change
All Bay Area ISD's Combined African American 4,185 5.6 6,180 6.7 1,995 47.7All Bay Area ISD's Combined Hispanic 22,134 29.5 40,250 43.8 18,116 81.8All Bay Area ISD's Combined White 44,987 59.9 40,393 44.0 -4,594 -10.2All Bay Area ISD's Combined Asian/Pacific Islander n/a n/a 4,855 5.3 n/a n/aAll Bay Area ISD's Combined Native American n/a n/a 228 0.2 n/a n/aAll Bay Area ISD's Combined 1 Other 3,790 5.0 0 0.0 n/a n/aAll Bay Area Houston ISD's Combined Total 75,096 100.0 91,906 100.0 16,810 22.4
Comparing academic year 1993-94 to 2003-04, Bay Area ISD's experienced a 47.7 percent increase in African American students, a 81.8 percent increase in Hispanic students and a 10.2 percent decrease in white students. Overall, enrollment experienced a 22.4 percent increase comparing 1993-94 to 2003-04.
Some ethnicities were not captured in 1993-94 and are labeled as n/a.
1 Other Race includes Native Hawaiian and other Pacific Islander as well as other races that are not currently captured.Data extracted using the PIEMS website - School Demographic Reports: http://www.tea.state.tx.us/perfreport/aeis/2004/index.html
All Bay Area Houston ISD's (Listed Above) Combined - Pre-K through 12th Grade 1993-94 2003-04
Pasadena ISD - All Schools Combined - Pre-K through 12th Grade 1993-94 2003-04
All Bay Area Houston ISD's - 1993-94
White, 59.9African
American, 5.6
Hispanic, 29.5
Other, 5.0
All Bay Area Houston ISD's - 2003-04
Asian, 5.3
African American,
6.7
White, 44.0
Hispanic, 43.8
page 18 bay area demo - 2005

University of Houston - Clear LakeCenter for Economic Development and Research
Profile of Bay Area Houston, TXClaritas 2005 Demographics
Figure 9a: Bay Area Houston, TX - 2005 PRIZM NE Household Segments - Segment Snapshots Defined
PRIZM®Lifestyle Segmentation System
PRIZM is the original and most widely used neighborhood target marketing system in the United States. In fact, Claritas founded the U.S. geodemographic industry when it launched the first PRIZM segmentation system in 1974. PRIZM is unique in the field of geodemography because it capitalizes on three decades of segmentation experience. Claritas has assisted thousands of clients with target-marketing projects to identify whom their customers and best prospects are, describe what they are like, locate the areas where they live, and determine how to reach them most cost-effectively.
PRIZM's catchy cluster nicknames and memorable icons work. They help users grasp the demographic and lifestyle constructs of each segment very quickly. Most importantly, they help marketers communicate their targeting plans to senior management, advertising agencies, media buyers, primary research providers, and others in a straightforward manner - much more effectively than dry statistical terminology, or long drawn-out demographic monologues.
Methodology
The starting point in the creation of PRIZM is the U.S. Census. The PRIZM model is recreated upon completion of the census every ten years. The assignment of PRIZM clusters to neighborhood geography is performed annually using the latest geographic rosters, updated demographics, and behavioral data. The primary geographic unit for demographic-factor analysis and system development is the census block group, the smallest neighborhood geography consistent with statistical reliability and data availability (block groups average 250-550 households). Factor analysis of census data reveals several dozen demographic and lifestyle variables in six categories that explain most of the statistical variance between neighborhood types: social rank, household composition, mobility, ethnicity, urbanization and housing. Cluster analysis (of these factors) produces the basic neighborhood types. These basic clusters aretested, refined, and calibrated with actual consumer-purchase data. Behavioral tests and enhancements to PRIZM taps millions of consumer-purchase records from multiple sources covering auto buyers, magazine subscribers, real estate transactions, consumer credit, direct marketing response, and consumer-expenditure data. The resulting system provides a flexible framework for decision making that is consistent from one level of geography to another. For instance, the PRIZM assignments for the 5-digit ZIP Code can be instantly and accurately translated into assignments for block groups, tracts, or ZIP+4s. Marketers use systems like PRIZM to identify, locate, and reach their best marketing opportunities.
Page 19 bay area demo - 2005

Figure 9b: Bay Area Houston, TX - 2004 PRIZM NE Household Segments - Segment Snapshots
N = Total Number of Households Sorted by
% = Percent of Total Households Rank
Households by PRIZM NE Segment N % N % N %
Bay Area
Houston
Rank
12 Brite Lites, Li'l City 9,746 6.56% 182,330 2.27% 1,658,799 1.49% 1
Not all of the America's chic sophisticates live in major metros. Brite Lights, Li'l City is a group of well-off, middle-aged couples settled in the nation's satellite cities. Residents of these typical DINK (double income, no kids) households have college educations, well-paying business and professional careers and swank homes filled with the latest technology.13 Upward Bound 9,312 6.27% 220,058 2.74% 1,689,622 1.52% 2
More than any other segment, Upward Bound appears to be the home of those legendary Soccer Moms and Dads. In these small satellite cities, upper-class families boast dual incomes, college degrees and new split-levels and colonials. Residents of Upward Bound tend to be kid-obsessed, with heavy purchases of computers, action figures, dolls, board games, bicycles and camping equipment.
18 Kids & Cul-de-Sacs 7,751 5.22% 182,657 2.27% 1,687,777 1.52% 3
Upscale, suburban, married couples with children-that's the skinny on Kids & Cul-de-Sacs, an enviable lifestyle of large families in recently built subdivisions. With a high rate of Hispanic and Asian Americans, this segment is a refuge for college-educated, white-collar professionals with administrative jobs and upper-middle-class incomes. Their nexus of education, affluence and children translates into large outlays for child-centered products and services.19 Home Sweet Home 6,995 4.71% 162,278 2.02% 1,980,255 1.78% 4
Widely scattered across the nation's suburbs, the residents of Home Sweet Home tend to be upper-middle-class married couples living in mid-sized homes with few children. The adults in the segment, mostly between the ages of 25 and 54, have gone to college and hold professional and white-collar jobs. With their upscale incomes and small families, these folks have fashioned comfortable lifestyles, filling their homes with toys, TV sets and pets.
Bay Area Houston Texas All of US
148,627 8,041,574 111,006,738
Page 20 bay area demo - 2005
N = Total Number of Households Sorted by
% = Percent of Total Households Rank
Households by PRIZM NE Segment N % N % N %
Bay Area
Houston
Rank
Bay Area Houston Texas All of US
148,627 8,041,574 111,006,738
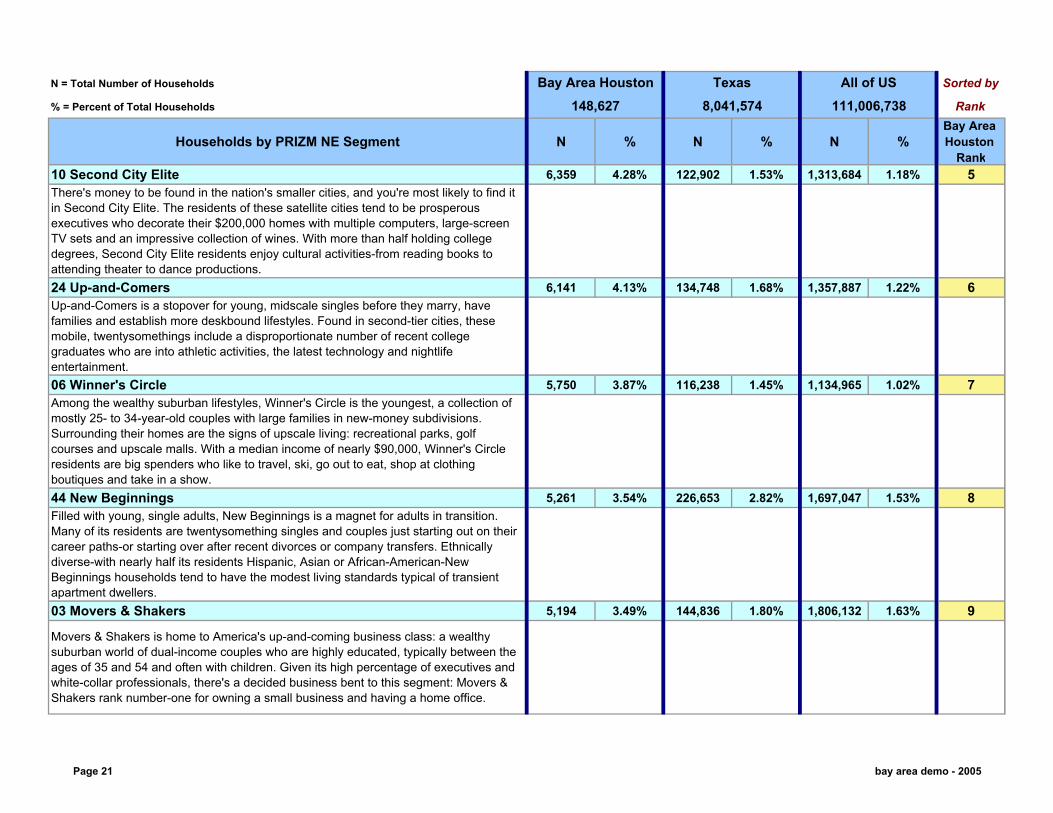
10 Second City Elite 6,359 4.28% 122,902 1.53% 1,313,684 1.18% 5
There's money to be found in the nation's smaller cities, and you're most likely to find it in Second City Elite. The residents of these satellite cities tend to be prosperous executives who decorate their $200,000 homes with multiple computers, large-screen TV sets and an impressive collection of wines. With more than half holding college degrees, Second City Elite residents enjoy cultural activities-from reading books to attending theater to dance productions.24 Up-and-Comers 6,141 4.13% 134,748 1.68% 1,357,887 1.22% 6
Up-and-Comers is a stopover for young, midscale singles before they marry, have families and establish more deskbound lifestyles. Found in second-tier cities, these mobile, twentysomethings include a disproportionate number of recent college graduates who are into athletic activities, the latest technology and nightlife entertainment.06 Winner's Circle 5,750 3.87% 116,238 1.45% 1,134,965 1.02% 7
Among the wealthy suburban lifestyles, Winner's Circle is the youngest, a collection of mostly 25- to 34-year-old couples with large families in new-money subdivisions. Surrounding their homes are the signs of upscale living: recreational parks, golf courses and upscale malls. With a median income of nearly $90,000, Winner's Circle residents are big spenders who like to travel, ski, go out to eat, shop at clothing boutiques and take in a show.44 New Beginnings 5,261 3.54% 226,653 2.82% 1,697,047 1.53% 8
Filled with young, single adults, New Beginnings is a magnet for adults in transition. Many of its residents are twentysomething singles and couples just starting out on their career paths-or starting over after recent divorces or company transfers. Ethnically diverse-with nearly half its residents Hispanic, Asian or African-American-New Beginnings households tend to have the modest living standards typical of transient apartment dwellers.03 Movers & Shakers 5,194 3.49% 144,836 1.80% 1,806,132 1.63% 9
Movers & Shakers is home to America's up-and-coming business class: a wealthy suburban world of dual-income couples who are highly educated, typically between the ages of 35 and 54 and often with children. Given its high percentage of executives and white-collar professionals, there's a decided business bent to this segment: Movers & Shakers rank number-one for owning a small business and having a home office.
Page 21 bay area demo - 2005

N = Total Number of Households Sorted by
% = Percent of Total Households Rank
Households by PRIZM NE Segment N % N % N %
Bay Area
Houston
Rank
Bay Area Houston Texas All of US
148,627 8,041,574 111,006,738
54 Multi-Culti Mosaic 5,084 3.42% 128,940 1.60% 1,907,241 1.72% 10
An immigrant gateway community, Multi-Culti Mosaic is the urban home for a mixed populace of younger Hispanic, Asian and African-American singles and families. With nearly a quarter of the residents foreign born, this segment is a mecca for first-generation Americans who are striving to improve their lower-middle-class status.
66 Low-Rise Living 5,051 3.40% 95,567 1.19% 1,430,578 1.29% 11
The most economically challenged urban segment, Low-Rise Living is known as a transient world for young, ethnically diverse singles and single parents. Home values are low-about half the national average-and even then less than a quarter of residents can afford to own real estate. Typically, the commercial base of Mom-and-Pop stores is struggling and in need of a renaissance.29 American Dreams 4,486 3.02% 115,152 1.43% 2,434,986 2.19% 12
American Dreams is a living example of how ethnically diverse the nation has become: more than half the residents are Hispanic, Asian or African-American. In these multilingual neighborhoods-one in ten speaks a language other than English-middle-aged immigrants and their children live in middle-class comfort.27 Middleburg Managers 4,315 2.90% 152,432 1.90% 2,069,213 1.86% 13
Middleburg Managers arose when empty-nesters settled in satellite communities which offered a lower cost of living and more relaxed pace. Today, segment residents tend to be middle-class and over 55 years old, with solid managerial jobs and comfortable retirements. In their older homes, they enjoy reading, playing musical instruments, indoor gardening and refinishing furniture.
22 Young Influentials 4,022 2.71% 160,983 2.00% 1,632,610 1.47% 14
Once known as the home of the nation's yuppies, Young Influentials reflects the fading glow of acquisitive yuppiedom. Today, the segment is a common address for young, middle-class singles and couples who are more preoccupied with balancing work and leisure pursuits. Having recently left college dorms, they now live in apartment complexes surrounded by ball fields, health clubs and casual-dining restaurants.
35 Boomtown Singles 3,598 2.42% 132,347 1.65% 1,347,018 1.21% 15
Affordable housing, abundant entry-level jobs and a thriving singles scene-all have given rise to the Boomtown Singles segment in fast-growing satellite cities. Young, single and working-class, these residents pursue active lifestyles amid sprawling apartment complexes, bars, convenience stores and laundromats.
Page 22 bay area demo - 2005

N = Total Number of Households Sorted by
% = Percent of Total Households Rank
Households by PRIZM NE Segment N % N % N %
Bay Area
Houston
Rank
Bay Area Houston Texas All of US
148,627 8,041,574 111,006,738
34 White Picket Fences 3,589 2.41% 155,970 1.94% 1,367,601 1.23% 16
Midpoint on the socioeconomic ladder, residents in White Picket Fences look a lot like the stereotypical American household of a generation ago: young, middle-class, married with children. But the current version is characterized by modest homes and ethnic diversity-including a disproportionate number of Hispanics and African-Americans.05 Country Squires 3,404 2.29% 131,723 1.64% 2,050,786 1.85% 17
The wealthiest residents in exurban America live in Country Squires, an oasis for affluent Baby Boomers who've fled the city for the charms of small-town living. In their bucolic communities noted for their recently built homes on sprawling properties, the families of executives live in six-figure comfort. Country Squires enjoy country club sports like golf, tennis and swimming as well as skiing, boating and biking.
36 Blue-Chip Blues 3,318 2.23% 150,924 1.88% 1,354,490 1.22% 18
Blue-Chip Blues is known as a comfortable lifestyle for young, sprawling families with well-paying blue-collar jobs. Ethnically diverse-with a significant presence of Hispanics and African-Americans-the segment's aging neighborhoods feature compact, modestly priced homes surrounded by commercial centers that cater to child-filled households.
02 Blue Blood Estates 2,969 2.00% 65,121 0.81% 1,059,462 0.95% 19
Blue Blood Estates is a family portrait of suburban wealth, a place of million-dollar homes and manicured lawns, high-end cars and exclusive private clubs. The nation's second-wealthiest lifestyle, it is characterized by married couples with children, college degrees, a significant percentage of Asian Americans and six-figure incomes earned by business executives, managers and professionals.
01 Upper Crust 2,743 1.85% 92,929 1.16% 1,690,937 1.52% 20
The nation's most exclusive address, Upper Crust is the wealthiest lifestyle in America-a haven for empty-nesting couples over 55 years old. No segment has a higher concentration of residents earning over $200,000 a year or possessing a postgraduate degree. And none has a more opulent standard of living.
Page 23 bay area demo - 2005

N = Total Number of Households Sorted by
% = Percent of Total Households Rank
Households by PRIZM NE Segment N % N % N %
Bay Area
Houston
Rank
Bay Area Houston Texas All of US
148,627 8,041,574 111,006,738
15 Pools & Patios 2,605 1.75% 68,968 0.86% 1,372,404 1.24% 21
Formed during the postwar Baby Boom, Pools & Patios has evolved from a segment of young suburban families to one for mature, empty-nesting couples. In these stable neighborhoods graced with backyard pools and patios-the highest proportion of homes were built in the 1960s-residents work as white-collar managers and professionals, and are now at the top of their careers.17 Beltway Boomers 2,528 1.70% 66,528 0.83% 1,031,647 0.93% 22
The members of the postwar Baby Boom are all grown up. Today, these Americans are in their forties and fifties, and one segment of this huge cohort-college-educated, upper-middle-class and home-owning-is found in Beltway Boomers. Like many of their peers who married late, these Boomers are still raising children in comfortable suburban subdivisions, and they're pursuing kid-centered lifestyles.
11 God's Country 2,359 1.59% 106,019 1.32% 1,813,435 1.63% 23
When city dwellers and suburbanites began moving to the country in the 1970s, God's Country emerged as the most affluent of the nation's exurban lifestyles. Today, wealthier communities exist in the hinterlands, but God's Country remains a haven for upper-income couples in spacious homes. Typically college-educated Baby Boomers, these Americans try to maintain a balanced lifestyle between high-power jobs and laid-back leisure.47 City Startups 2,287 1.54% 166,000 2.06% 1,605,824 1.45% 24
In City Startups, young, multi-ethnic singles have settled in neighborhoods filled with cheap apartments and a commercial base of cafes, bars, laundromats and clubs that cater to twentysomethings. One of the youngest segments in America-with ten times as many college students as the national average-these neighborhoods feature low incomes and high concentrations of Hispanics and African-Americans.
52 Suburban Pioneers 2,236 1.50% 140,188 1.74% 1,161,514 1.05% 25
Suburban Pioneers represents one of the nation's eclectic lifestyles, a mix of young singles, recently divorced and single parents who have moved into older, inner-ring suburbs. They live in aging homes and garden-style apartment buildings, where the jobs are blue-collar and the money is tight. But what unites these residents-a diverse mix of whites, Hispanics and African-Americans-is a working-class sensibility and an appreciation for their off-the-beaten-track neighborhoods.
Page 24 bay area demo - 2005
N = Total Number of Households Sorted by
% = Percent of Total Households Rank
Households by PRIZM NE Segment N % N % N %
Bay Area
Houston
Rank
Bay Area Houston Texas All of US
148,627 8,041,574 111,006,738
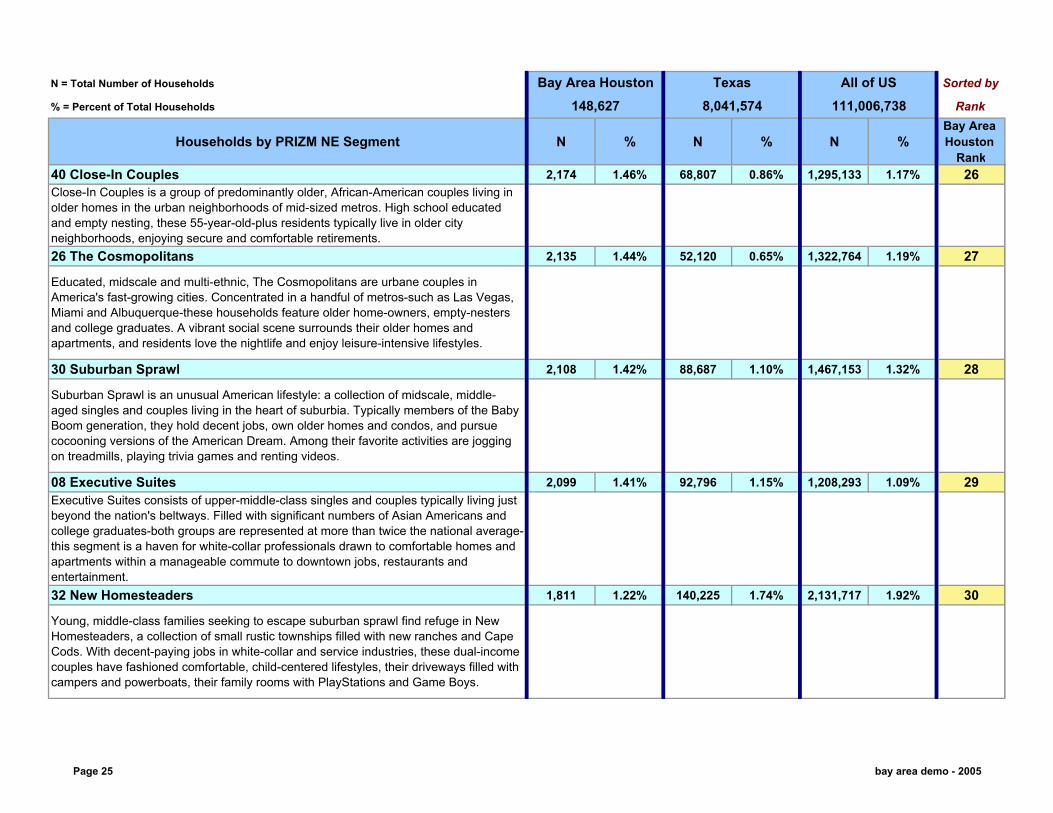
40 Close-In Couples 2,174 1.46% 68,807 0.86% 1,295,133 1.17% 26
Close-In Couples is a group of predominantly older, African-American couples living in older homes in the urban neighborhoods of mid-sized metros. High school educated and empty nesting, these 55-year-old-plus residents typically live in older city neighborhoods, enjoying secure and comfortable retirements.26 The Cosmopolitans 2,135 1.44% 52,120 0.65% 1,322,764 1.19% 27
Educated, midscale and multi-ethnic, The Cosmopolitans are urbane couples in America's fast-growing cities. Concentrated in a handful of metros-such as Las Vegas, Miami and Albuquerque-these households feature older home-owners, empty-nesters and college graduates. A vibrant social scene surrounds their older homes and apartments, and residents love the nightlife and enjoy leisure-intensive lifestyles.
30 Suburban Sprawl 2,108 1.42% 88,687 1.10% 1,467,153 1.32% 28
Suburban Sprawl is an unusual American lifestyle: a collection of midscale, middle-aged singles and couples living in the heart of suburbia. Typically members of the Baby Boom generation, they hold decent jobs, own older homes and condos, and pursue cocooning versions of the American Dream. Among their favorite activities are jogging on treadmills, playing trivia games and renting videos.
08 Executive Suites 2,099 1.41% 92,796 1.15% 1,208,293 1.09% 29
Executive Suites consists of upper-middle-class singles and couples typically living just beyond the nation's beltways. Filled with significant numbers of Asian Americans and college graduates-both groups are represented at more than twice the national average-this segment is a haven for white-collar professionals drawn to comfortable homes and apartments within a manageable commute to downtown jobs, restaurants and entertainment.32 New Homesteaders 1,811 1.22% 140,225 1.74% 2,131,717 1.92% 30
Young, middle-class families seeking to escape suburban sprawl find refuge in New Homesteaders, a collection of small rustic townships filled with new ranches and Cape Cods. With decent-paying jobs in white-collar and service industries, these dual-income couples have fashioned comfortable, child-centered lifestyles, their driveways filled with campers and powerboats, their family rooms with PlayStations and Game Boys.
Page 25 bay area demo - 2005

N = Total Number of Households Sorted by
% = Percent of Total Households Rank
Households by PRIZM NE Segment N % N % N %
Bay Area
Houston
Rank
Bay Area Houston Texas All of US
148,627 8,041,574 111,006,738
39 Domestic Duos 1,607 1.08% 89,990 1.12% 1,188,359 1.07% 31
Domestic Duos represents a middle-class mix of mainly over 55 singles and married couples living in older suburban homes. With their high-school educations and fixed incomes, segment residents maintain an easy-going lifestyle. Residents like to socialize by going bowling, seeing a play, meeting at the local fraternal order or going out to eat.
65 Big City Blues 1,504 1.01% 88,169 1.10% 1,318,897 1.19% 32
With a population that's 50 percent Latino, Big City Blues has the highest concentration of Hispanic Americans in the nation. But it's also the multi-ethnic address for downscale Asian and African-American households occupying older inner-city apartments. Concentrated in a handful of major metros, these young singles and single-parent families face enormous challenges: low incomes, uncertain jobs and modest educations. More than 40 percent haven't finished high school.
63 Family Thrifts 1,432 0.96% 207,482 2.58% 1,868,599 1.68% 33
The small-city cousins of inner-city districts, Family Thrifts contain young, ethnically diverse parents who have lots of children and work entry-level service jobs. In these apartment-filled neighborhoods, visitors find the streets jam-packed with babies and toddlers, tricycles and basketball hoops, Daewoos and Hyundais.
46 Old Glories 1,266 0.85% 95,961 1.19% 1,092,340 0.98% 34
Old Glories are the nation's downscale suburban retirees, Americans aging in place in older apartment complexes. These racially mixed households often contain widows and widowers living on fixed incomes, and they tend to lead home-centered lifestyles. They're among the nation's most ardent television fans, watching game shows, soaps, talk shows and newsmagazines at high rates.
14 New Empty Nests 1,123 0.76% 51,503 0.64% 1,171,877 1.06% 35
With their grown-up children recently out of the house, New Empty Nests is composed of upscale older Americans who pursue active-and activist-lifestyles. Nearly three-quarters of residents are over 65 years old, but they show no interest in a rest-home retirement. This is the top-ranked segment for all-inclusive travel packages; the favorite destination is Italy.
Page 26 bay area demo - 2005

N = Total Number of Households Sorted by
% = Percent of Total Households Rank
Households by PRIZM NE Segment N % N % N %
Bay Area
Houston
Rank
Bay Area Houston Texas All of US
148,627 8,041,574 111,006,738
61 City Roots 1,112 0.75% 95,607 1.19% 1,321,286 1.19% 36
Found in urban neighborhoods, City Roots is a segment of lower-income retirees, typically living in older homes and duplexes they've owned for years. In these ethnically diverse neighborhoods-more than a third are African-American and Hispanic-residents are often widows and widowers living on fixed incomes and maintaining low-key lifestyles.07 Money & Brains 1,093 0.74% 81,735 1.02% 2,265,564 2.04% 37
The residents of Money & Brains seem to have it all: high incomes, advanced degrees and sophisticated tastes to match their credentials. Many of these citydwellers, predominantly white with a high concentration of Asian Americans, are married couples with few children who live in fashionable homes on small, manicured lots.
23 Greenbelt Sports 1,073 0.72% 81,002 1.01% 1,885,142 1.70% 38
A segment of middle-class exurban couples, Greenbelt Sports is known for its active lifestyle. Most of these middle-aged residents are married, college-educated and own new homes; about a third have children. And few segments have higher rates for pursuing outdoor activities such as skiing, canoeing, backpacking, boating and mountain biking.09 Big Fish, Small Pond 975 0.66% 130,244 1.62% 2,451,435 2.21% 39
Older, upper-class, college-educated professionals, the members of Big Fish, Small Pond are often among the leading citizens of their small-town communities. These upscale, empty-nesting couples enjoy the trappings of success, belonging to country clubs, maintaining large investment portfolios and spending freely on computer technology.49 American Classics 900 0.61% 113,068 1.41% 1,137,884 1.03% 40
They may be older, lower-middle class and retired, but the residents of American Classics are still living the American Dream of home ownership. Few segments rank higher in their percentage of home owners, and that fact alone reflects a more comfortable lifestyle for these predominantly white singles and couples with deep ties to their neighborhoods.59 Urban Elders 799 0.54% 41,242 0.51% 1,495,328 1.35% 41
For Urban Elders-a segment located in the downtown neighborhoods of such metros as New York, Chicago, Las Vegas and Miami-life is often an economic struggle. These communities have high concentrations of Hispanics and African-Americans, and tend to be downscale, with singles living in older apartment rentals.
Page 27 bay area demo - 2005

N = Total Number of Households Sorted by
% = Percent of Total Households Rank
Households by PRIZM NE Segment N % N % N %
Bay Area
Houston
Rank
Bay Area Houston Texas All of US
148,627 8,041,574 111,006,738
37 Mayberry-ville 727 0.49% 153,296 1.91% 2,549,084 2.30% 42
Like the old Andy Griffith show set in a quaint picturesque berg, Mayberry-ville harks back to an old-fashioned way of life. In these small towns, middle-class couples and families like to fish and hunt during the day, and stay home and watch TV at night. With lucrative blue-collar jobs and moderately priced housing, residents use their discretionary cash to purchase boats, campers, motorcycles and pickup trucks.
04 Young Digerati 656 0.44% 56,782 0.71% 1,374,520 1.24% 43
Young Digerati are the nation's tech-savvy singles and couples living in fashionable neighborhoods on the urban fringe. Affluent, highly educated and ethnically mixed, Young Digerati communities are typically filled with trendy apartments and condos, fitness clubs and clothing boutiques, casual restaurants and all types of bars-from juice to coffee to microbrew.41 Sunset City Blues 638 0.43% 156,629 1.95% 1,892,142 1.70% 44
Scattered throughout the older neighborhoods of small cities, Sunset City Blues is a segment of lower-middle-class singles and couples who have retired or are getting closed to it. These empty-nesters tend to own their homes but have modest educations and incomes. They maintain a low-key lifestyle filled with newspapers and television by day, and family-style restaurants at night.
16 Bohemian Mix 587 0.39% 91,245 1.13% 2,018,548 1.82% 45
A collection of young, mobile urbanites, Bohemian Mix represents the nation's most liberal lifestyles. Its residents are a progressive mix of young singles and couples, students and professionals, Hispanics, Asians, African-Americans and whites. In their funky rowhouses and apartments, Bohemian Mixers are the early adopters who are quick to check out the latest movie, nightclub, laptop and microbrew.
21 Gray Power 563 0.38% 46,129 0.57% 1,174,575 1.06% 46
The steady rise of older, healthier Americans over the past decade has produced one important by-product: middle-class, home-owning suburbanites who are aging in place rather than moving to retirement communities. Gray Power reflects this trend, a segment of older, midscale singles and couples who live in quiet comfort.
Page 28 bay area demo - 2005

N = Total Number of Households Sorted by
% = Percent of Total Households Rank
Households by PRIZM NE Segment N % N % N %
Bay Area
Houston
Rank
Bay Area Houston Texas All of US
148,627 8,041,574 111,006,738
28 Traditional Times 564 0.38% 150,936 1.88% 3,015,905 2.72% 46
Traditional Times is the kind of lifestyle where small-town couples nearing retirement are beginning to enjoy their first empty-nest years. Typically in their fifties and sixties, these middle-class Americans pursue a kind of granola-and-grits lifestyle. On their coffee tables are magazines with titles ranging from Country Living and Country Home to Gourmet and Forbes. But they're big travelers, especially in recreational vehicles and campers.48 Young & Rustic 549 0.37% 279,644 3.48% 3,393,228 3.06% 48
Like the soap opera that inspired its nickname, Young & Rustic is composed of young, restless singles. Unlike the glitzy soap denizens, however, these folks tend to be lower income, high school-educated and living in tiny apartments in the nation's exurban towns. With their service industry jobs and modest incomes, these folks still try to fashion fast-paced lifestyles centered on sports, cars and dating.
25 Country Casuals 466 0.31% 91,440 1.14% 1,556,190 1.40% 49
There's a laid-back atmosphere in Country Casuals, a collection of middle-aged, upper-middle-class households that have started to empty-nest. Workers here-and most households boast two earners-have well-paying blue- or white collar jobs, or own small businesses. Today these Baby-Boom couples have the disposable income to enjoy traveling, owning timeshares and going out to eat.
20 Fast-Track Families 434 0.29% 115,137 1.43% 1,631,409 1.47% 50
With their upper-middle-class incomes, numerous children and spacious homes, Fast-Track Families are in their prime acquisition years. These middle-aged parents have the disposable income and educated sensibility to want the best for their children. They buy the latest technology with impunity: new computers, DVD players, home theater systems and video games. They take advantage of their rustic locales by camping, boating and fishing.50 Kid Country, USA 434 0.29% 106,398 1.32% 1,424,706 1.28% 50
Widely scattered throughout the nation's heartland, Kid Country, USA is a segment dominated by large families living in small towns. Predominantly white, with an above-average concentration of Hispanics, these young, these working-class households include homeowners, renters and military personnel living in base housing; about 20 percent of residents own mobile homes.
Page 29 bay area demo - 2005

N = Total Number of Households Sorted by
% = Percent of Total Households Rank
Households by PRIZM NE Segment N % N % N %
Bay Area
Houston
Rank
Bay Area Houston Texas All of US
148,627 8,041,574 111,006,738
60 Park Bench Seniors 436 0.29% 72,419 0.90% 1,215,994 1.10% 50
Park Bench Seniors typically are retired singles living in the racially mixed neighborhoods of the nation's satellite cities. With modest educations and incomes, these residents maintain low-key, sedentary lifestyles. Theirs is one of the top-ranked segments for TV viewing, especially daytime soaps and game shows.
42 Red, White & Blues 393 0.26% 59,411 0.74% 1,019,727 0.92% 53
The residents of Red, White & Blues typically live in exurban towns rapidly morphing into bedroom suburbs. Their streets feature new fast-food restaurants, and locals have recently celebrated the arrival of chains like Wal-Mart, Radio Shack and Payless Shoes. Middle-aged, high school educated and lower-middle class, these folks tend to have solid, blue-collar jobs in manufacturing, milling and construction.
53 Mobility Blues 301 0.20% 112,342 1.40% 1,169,434 1.05% 54
Young singles and single parents make their way to Mobility Blues, a segment of working-class neighborhoods in America's satellite cities. Racially mixed and under 25 years old, these transient Americans tend to have modest lifestyles due to their lower-income blue-collar jobs. Surveys show they excel in going to movies, playing basketball and shooting pool43 Heartlanders 255 0.17% 138,522 1.72% 2,208,891 1.99% 55
America was once a land of small middle-class towns, which can still be found today among Heartlanders. This widespread segment consists of middle-aged couples with working-class jobs living in sturdy, unpretentious homes. In these communities of small families and empty-nesting couples, Heartlanders pursue a rustic lifestyle where hunting and fishing remain prime leisure activities along with cooking, sewing, camping and boating.64 Bedrock America 243 0.16% 188,318 2.34% 2,111,567 1.90% 56
Bedrock America consists of young, economically challenged families in small, isolated towns located throughout the nation's heartland. With modest educations, sprawling families and blue-collar jobs, many of these residents struggle to make ends meet. One quarter live in mobile homes. One in three haven't finished high school. Rich in scenery, Bedrock America is a haven for fishing, hunting, hiking and camping.
Page 30 bay area demo - 2005
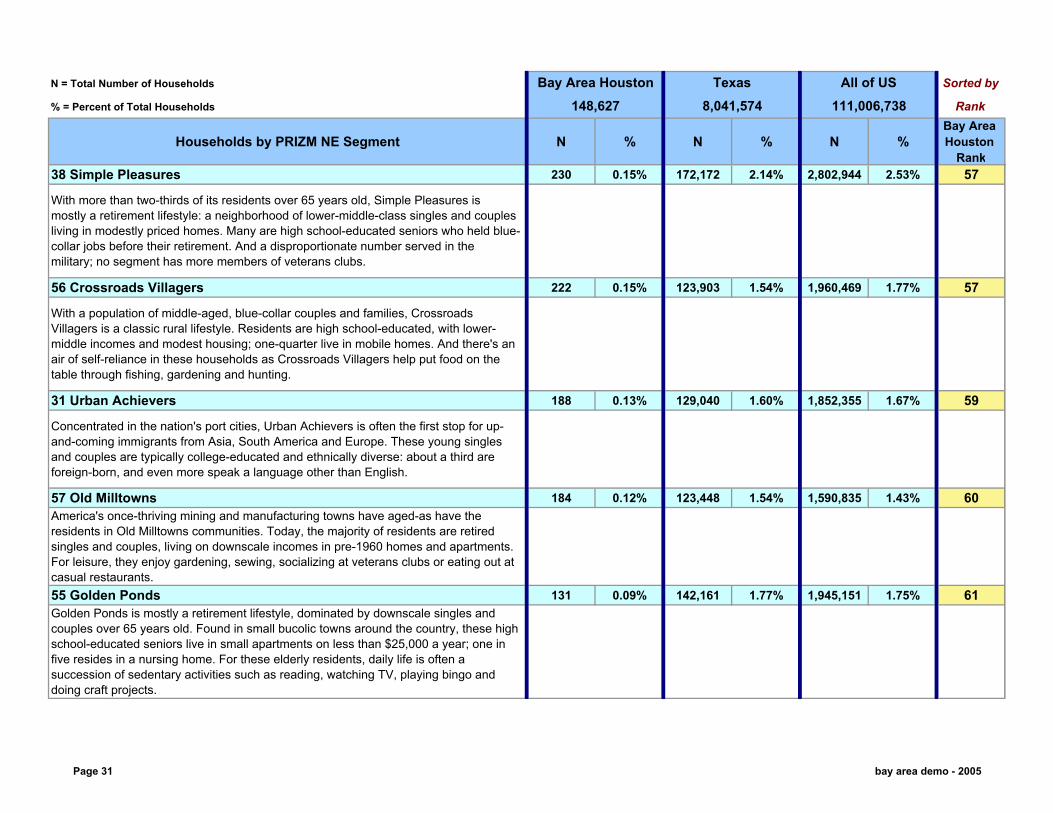
N = Total Number of Households Sorted by
% = Percent of Total Households Rank
Households by PRIZM NE Segment N % N % N %
Bay Area
Houston
Rank
Bay Area Houston Texas All of US
148,627 8,041,574 111,006,738
38 Simple Pleasures 230 0.15% 172,172 2.14% 2,802,944 2.53% 57
With more than two-thirds of its residents over 65 years old, Simple Pleasures is mostly a retirement lifestyle: a neighborhood of lower-middle-class singles and couples living in modestly priced homes. Many are high school-educated seniors who held blue-collar jobs before their retirement. And a disproportionate number served in the military; no segment has more members of veterans clubs.
56 Crossroads Villagers 222 0.15% 123,903 1.54% 1,960,469 1.77% 57
With a population of middle-aged, blue-collar couples and families, Crossroads Villagers is a classic rural lifestyle. Residents are high school-educated, with lower-middle incomes and modest housing; one-quarter live in mobile homes. And there's an air of self-reliance in these households as Crossroads Villagers help put food on the table through fishing, gardening and hunting.
31 Urban Achievers 188 0.13% 129,040 1.60% 1,852,355 1.67% 59
Concentrated in the nation's port cities, Urban Achievers is often the first stop for up-and-coming immigrants from Asia, South America and Europe. These young singles and couples are typically college-educated and ethnically diverse: about a third are foreign-born, and even more speak a language other than English.
57 Old Milltowns 184 0.12% 123,448 1.54% 1,590,835 1.43% 60
America's once-thriving mining and manufacturing towns have aged-as have the residents in Old Milltowns communities. Today, the majority of residents are retired singles and couples, living on downscale incomes in pre-1960 homes and apartments. For leisure, they enjoy gardening, sewing, socializing at veterans clubs or eating out at casual restaurants.55 Golden Ponds 131 0.09% 142,161 1.77% 1,945,151 1.75% 61
Golden Ponds is mostly a retirement lifestyle, dominated by downscale singles and couples over 65 years old. Found in small bucolic towns around the country, these high school-educated seniors live in small apartments on less than $25,000 a year; one in five resides in a nursing home. For these elderly residents, daily life is often a succession of sedentary activities such as reading, watching TV, playing bingo and doing craft projects.
Page 31 bay area demo - 2005

N = Total Number of Households Sorted by
% = Percent of Total Households Rank
Households by PRIZM NE Segment N % N % N %
Bay Area
Houston
Rank
Bay Area Houston Texas All of US
148,627 8,041,574 111,006,738
62 Hometown Retired 103 0.07% 126,801 1.58% 1,262,715 1.14% 62
With three-quarters of all residents over 65 years old, Hometown Retired is one of the oldest lifestyles. These racially mixed seniors tend to live in aging homes-half were built before 1958-and typically get by on social security and modest pensions. Because most never made it beyond high school and spent their working lives at blue-collar jobs, their retirements are extremely modest.33 Big Sky Families 5 0.00% 118,577 1.47% 1,853,806 1.67% 63
Scattered in placid towns across the American heartland, Big Sky Families is a segment of young rural families who have turned high school educations and blue-collar jobs into busy, middle-class lifestyles. Residents like to play baseball, basketball and volleyball, besides going fishing, hunting and horseback riding. To entertain their sprawling families, they buy virtually every piece of sporting equipment on the market.
45 Blue Highways 0 0.00% 69,853 0.87% 1,316,921 1.19% 63
On maps, blue highways are often two-lane roads that wind through remote stretches of the American landscape. Among lifestyles, Blue Highways is the standout for lower-middle-class couples and families who live in isolated towns and farmsteads. Here, Boomer men like to hunt and fish, the women enjoy sewing and crafts, and everyone looks forward to going out to a country music concert.
51 Shotguns & Pickups 3 0.00% 110,674 1.38% 1,761,715 1.59% 63
The segment known as Shotguns & Pickups came by its moniker honestly: it scores near the top of all lifestyles for owning hunting rifles and pickup trucks. These Americans tend to be young, working-class couples with large families-more than half have two or more kids-living in small homes and manufactured housing. Nearly a third of residents live in mobile homes, more than anywhere else in the nation.
58 Back Country Folks 1 0.00% 165,168 2.05% 2,626,222 2.37% 63
Strewn among remote farm communities across the nation, Back Country Folks are a long way away from economic paradise. The residents tend to be poor, over 55 years old and living in older, modest-sized homes and manufactured housing. Typically, life in this segment is a throwback to an earlier era when farming dominated the American landscape.
Page 32 bay area demo - 2005

Figure 9c: Bay Area Houston, TX - 2005 PRIZM NE Household Segments - Segment Summary
PRIZM Segment Percent PRIZM Segment Percent PRIZM Segment Percent 12 Brite Lites, Li'l City 6.56% 48 Young & Rustic 3.48% 48 Young & Rustic 3.06% 13 Upward Bound 6.27% 44 New Beginnings 2.82% 28 Traditional Times 2.72% 18 Kids & Cul-de-Sacs 5.22% 13 Upward Bound 2.74% 38 Simple Pleasures 2.53% 19 Home Sweet Home 4.71% 63 Family Thrifts 2.58% 58 Back Country Folks 2.37% 10 Second City Elite 4.28% 64 Bedrock America 2.34% 37 Mayberry-ville 2.30% 24 Up-and-Comers 4.13% 18 Kids & Cul-de-Sacs 2.27% 09 Big Fish, Small Pond 2.21% 06 Winner's Circle 3.87% 12 Brite Lites, Li'l City 2.27% 29 American Dreams 2.19% 44 New Beginnings 3.54% 38 Simple Pleasures 2.14% 07 Money & Brains 2.04% 03 Movers & Shakers 3.49% 47 City Startups 2.06% 43 Heartlanders 1.99% 54 Multi-Culti Mosaic 3.42% 58 Back Country Folks 2.05% 32 New Homesteaders 1.92%
The top 3 ranked PRIZM segments for Bay Area Houston, TX are Brite Lites, Li'l City, Upward Bound, and Kids & Cul-de-Sacs. The top ranked group, "Brite Lites Li'l City," falls under the "Y1" Lifestage group, representing "Midlife Success." They generally represent middle-aged, small city sophisticates, who are professionals with college educations. They are likely to purchase networking software, pay-per-view sports TV, and other electronic equipment.
The second ranked group, "Upward Bound," falls under the "F2 Young Accumulators" Lifestage group. They are considered college educated professionals between the ages of 25 to 54. They most likely enjoy going to the beach, they generally own GameBoy's, subscribe to Forbes Magazine, and Nickelodeon TV.
"Kids & Cul-de-Sacs" also falls under the "F2 Young Accumulators" Lifestage group and represents upper-middle-class suburban families. The median income in this segment is nearly $60,000, the median home value is about $200,000, and the mostly couples in this social group tend to have college degrees and white-collar jobs. As consumers, The Affluentials are big fans of health foods, computer equipment, consumer electronics, and the full range of big-box retailers.
P. Johnson - Produced using iXPRESS. © 2005, Claritas Inc. All Rights Reserved
Claritas Data Methodology and Data Definitions:http://www.clusterbigip1.claritas.com/claritas/Default.jsp?main=3&submenu=dem&subcat=gloss
Bay Area Houston Texas All of USA
Top 10 PRIZM NE Segments - Sorted by Percent by AreaSee detailed Chart for Actual Hhold Numbers & Descriptions
Page 33 bay area demo - 2005

University of Houston - Clear LakeCenter for Economic Development and Research
Claritas 2005 Demographics
POPULATION
RACE
HISPANIC OR LATINO
ANCESTRY
The number of persons counted at their place of usual residence. Usual residence is the place where the person lives and sleeps most of the time or considers to be his or her usual residence.
The data on race, which was asked of all people, were derived from answers to long-form questionnaire Item 6 and short-form questionnaire Item 8. The racial classifications used by the Census Bureau adhere to the October 30, 1997, Federal Register Notice entitled, ‘‘Revisions to the Standards for the Classification of Federal Data on Race and Ethnicity,’’ issued by the Office of Management and Budget (OMB). These standards govern the categories used to collect and present federal data on race and ethnicity. The OMB requires five minimum categories (White, Black or African American, American Indian or Alaska Native, Asian, and Native Hawaiian or Other Pacific Islander) for race. The race categories are described below with a sixth category, ‘‘Some other race,’’ added with OMB approval. In addition to the five race groups, the OMB also states that respondents should be offered the option of selecting one or more races. If an individual did not provide a race response, the race or races of the householder or other household members were assigned using specific rules of precedence of household relationship. Immigrants and outmigrants for states include only those people who did not live in the same.
The data on ancestry were derived from answers to long-form questionnaire Item 10, which was asked of a sample of the population. The data represent self-classification by people according to the ancestry group or groups with which they most closely identify. Ancestry refers to a person’s ethnic origin or descent, ‘‘roots,’’ heritage, or the place of birth of the person, the person’s parents, or their ancestors before their arrival in the United States.
The data on the Hispanic or Latino population, which was asked of all people, were derived from answers to long-form questionnaire Item 5, and short-form questionnaire Item 7. The terms ‘‘Spanish,’’ ‘‘Hispanic origin,’’ and ‘‘Latino’’ are used interchangeably. Some respondents identify with all three terms, while others may identify with only one of these three specific terms.Origin can be viewed as the heritage, nationality group, lineage, or country of birth of the person or the person’s parents or ancestors before their arrival in the United States. People who identify their origin as Spanish, Hispanic, or Latino may be of any race.
Claritas Data Definitions & Methodology
Page 34 bay area demo - 2005

AGE
Median age
MARITAL STATUS
EDUCATIONAL ATTAINMENT
EMPLOYMENT STATUS
The data on age, which was asked of all people, were derived from answers to the long-form questionnaire Item 4 and short-form questionnaire Item 6. The age classification is based on the age of the person in complete years as of April 1, 2000. The age of the person usually was derived from their date of birth information. Their reported age was used only when date of birth information was unavailable.
Median age divides the age distribution into two equal parts: one-half of the cases falling below the median age and one-half above the median. Median age is computed on the basis of a single year of age standard distribution Median age is rounded to the nearest tenth.
Census data on schooling completed reflects self-reported information on the highest level of school completed or the highest degree received. High school graduates include those who received their diplomas or the equivalent (GED for example), and did not attend college. Graduate/Professional degrees include those in medicine, dentistry, law, pharmacy, chiropractic and the like. Degrees from vocational, trade or business schools were not included unless they were college level degrees. Degrees from barber schools, cosmetology schools and the like were specifically excluded from the professional school category.
The data on employment status (referred to as labor force status in previous censuses), were derived from answers to long-form questionnaire Items 21and 25, which were asked of a sample of the population 15 years old and over. The series of questions on employment status was designed to identify, in this sequence: (1) people who worked at any time during the reference week; (2) people who did not work during the reference week, but who had jobs or businesses from which they were temporarily absent (excluding people on layoff); (3) people on temporary layoff who expected to be recalled to work within the next 6 months or who had been given a date to return to work, and who were available for work during the reference week; and (4) people who did not work during the reference week, who had looked for work during the reference week or the three previous weeks, and who were available for work during the reference week. The employment status data shown in Census 2000 tabulations relate to people 16 years old and over.
The data on marital status were derived from answers to long-form questionnaire Item 7, ‘‘What is this person’s marital status,’’ which was asked of a sample of the population. The marital status classification refers to the status at the time of enumeration. Data on marital status are tabulated only for the population 15 years old and over.
Page 35 bay area demo - 2005

HOUSEHOLD TYPE
INCOME
Median income
Aggregate income
Mean income
Per capita income
Households are divided into two general categories – family households and non-family households. A family household consists of a householder and one or more other persons living in the same household who are related to the householder by birth, marriage, or adoption. All persons in a household who are related to the householder are regarded as members of his or her family. A household can contain only one family for purposes of census tabulations. Families are classified by type as either a "married-couple family" or "other family" and by the sex of the householder and the presence of children. Households are broken down by the sex of the householder and the presence of children. Non-family households can consist of one person living alone or unrelated individuals living together.
The data on income were derived from answers to long-form questionnaire Items 31 and 32, which were asked of a sample of the population 15 years old and over. ‘‘Total income’’ is the sum of the amounts reported separately for wage or salary income; net self-employment income; interest, dividends, or net rental or royalty income or income from estates and trusts; social security or railroad retirement income; Supplemental Security Income (SSI); public assistance or welfare payments; retirement, survivor, or disability pensions; and all other income. Receipts from the following sources are not included as income: capital gains, money received from the sale of property (unless the recipient was engaged in the business of selling such property); the value of income ‘‘in kind’’ from food stamps, public housing subsidies, medical care, employer contributions for individuals, etc.; withdrawal of bank deposits; money borrowed; tax refunds; exchange of money between relatives living in the same household; and gifts and lump-sum inheritances, insurance payments, and other types of lump-sum receipts.
The median divides the income distribution into two equal parts: one-half of the cases falling below the median income and one-half above the median. For households and families, the median income is based on the distribution of the total number of households and families including those with no income. The median income for individuals is based on individuals 15 years old and over with income. Median income for households, families, and individuals is computed on the basis of a standard distribution.
Aggregate income is the sum of all incomes for a particular universe. Aggregate income is subject to rounding, which means that all cells in a matrix are rounded to the nearest hundred dollars.
Mean income is the amount obtained by dividing the aggregate income of a particular statistical universe by the number of units in that universe. Thus, mean household income is obtained by dividing total household income by the total number of households.
Per capita income is the mean income computed for every man, woman, and child in a particular group. It is derived by dividing the total income of a particular group by the total population in that group.
Page 36 bay area demo - 2005

BLOCK GROUP (BG)
CENSUS BLOCK
CENSUS DIVISION
A block group (BG) consists of all census blocks having the same first digit of their four-digit identifying numbers within a census tract. For example, block group 3 (BG 3) within a census tract includes all blocks numbered from 3000 to 3999. BGs generally contain between 600 and 3,000 people, with an optimum size of 1,500 people. BGs on American Indian reservations, off reservation trust lands, and special places must contain a minimum of 300 people. (Special places include correctional institutions, military installations, college campuses, worker’s dormitories, hospitals, nursing homes, and group homes.)
Most BGs were delineated by local participants as part of the U.S. Census Bureau’s Participant Statistical Areas Program. The U.S. Census Bureau delineated BGs only where a local, state, or tribal government declined to participate or where the U.S. Census Bureau could not identify a potential local or tribal participant.
BGs never cross the boundaries of states, counties, or statistically equivalent entities, except for a BG delineated by American Indian tribal authorities, and then only when tabulated within the American Indian hierarchy (see TRIBAL BLOCK GROUP). BGs never cross the boundaries of census tracts, but may cross the boundary of any other geographic entity required as a census block boundary (see CENSUS BLOCK). BGs are the lowest level of the geographic hierarchy for which the U.S. Census Bureau tabulates and presents sample data.
Census blocks are areas bounded on all sides by visible features, such as streets, roads, streams, and railroad tracks, and by invisible boundaries, such as city, town, township, and county limits, property lines, and short, imaginary extensions of streets and roads. Generally, census blocks are small in area; for example, a block bounded by city streets. However, census blocks in sparsely settled areas may contain many square miles of territory.
All territory in the United States, Puerto Rico, and the Island Areas has been assigned block numbers, as was the case for the 1990 census.
Census divisions are groupings of states and the District of Columbia that are subdivisions of the four census regions. There are nine census divisions, which the U.S. Census Bureau established in 1910 for the presentation of census data. Each census division is identified by a one-digit census code; the same number appears as the first digit in the two-digit census state code (see STATE). Puerto Rico and the Island Areas are not part of any census region or census division.
Page 37 bay area demo - 2005

CENSUS REGION
CENSUS TRACT
Census tracts are identified by a four-digit basic number and may have a two-digit numeric suffix; for example, 6059.02.
CENTROID
Population-weighted Centroid
The physical center of a piece of geography.
The physical center of a piece of geography drawn toward the area of highest population density.
Census regions are groupings of states and the District of Columbia that subdivide the United States for the presentation of census data. There are four census regions—Northeast, Midwest, South, and West. Each of the four census regions is divided into two or more census divisions. Before 1984, the Midwest region was named the North Central region. From 1910, when census regions were established, through the 1940s, there were three census regions—North, South, and West. Each census region is identified by a single-digit census code.
Puerto Rico and the Island Areas are not part of any census region or census division.
Census tracts are small, relatively permanent statistical subdivisions of a county or statistically equivalent entity delineated by local participants as part of the U.S. Census Bureau’s Participant Statistical Areas Program. The U.S. Census Bureau delineated census tracts where no local participant>existed or where a local or tribal government declined to participate. The primary purpose of census tracts is to provide a stable set of geographic units for the presentation of decennial census data. This is the first decennial census for which the entire United States is covered by census tracts.
Census tracts in the United States, Puerto Rico, and the Virgin Islands of the United States generally have between 1,500 and 8,000 people, with an optimum size of 4,000 people. For American Samoa, the Northern Mariana Islands, and Guam, the optimum size is 2,500 people. Counties and statistically equivalent entities with fewer than 1,500 people have a single census tract. Census tracts on American Indian reservations, off-reservation trust lands, and special places must contain a minimum of 1,000 people. (Special places include correctional institutions, military installations, college campuses, workers’ dormitories, hospitals, nursing homes, and group homes.) When first delineated, census tracts are designed to be relatively homogeneous with respect to population characteristics, economic status, and living conditions. The spatial size of census tracts varies widely depending on the density of settlement.
Page 38 bay area demo - 2005

POVERTY STATUS
Business-Facts DatabaseThe Nation's Most Comprehensive Database of U.S. Business and Employee Counts
MethodologyHow is the Business-Facts Database Built?
American Stock Exchange Facts BookAnnual reportsBig business directoriesBusiness and standard listings in the White PagesCity directoriesCounty courthouse records for new business formationsIndustry directoriesIPO ReporterMajor metropolitan newspapersNASDAQ Fact BookStandard & Poors Stock GuideState manufacturers directoriesThe Wall Street JournalYellow Pages
Households are classified below the poverty level when the total 1989 income of the family or of the nonfamily householder is below the appropriate poverty threshold. The poverty threshold is based on the number of children under 18 and the number of family members in the household. The poverty thresholds are revised annually to allow for changes in the cost of living as reflected in the Consumer Price Index. The average poverty threshold for a family of four persons was $12,674 in 1989. Poverty thresholds were applied on a national basis and not adjusted for regional, state or local variations in the cost of living
Business-Facts® gives marketers access to U.S. business and employee count information for all types of companies, both large and small. This data can be used for a broad range of sales and marketing applications, including market analysis, site location, targeting, planning, and territory evaluation. Business-Facts is a national database covering business establishments and professionals in the U.S. and contains more than 12 million records.
Beginning with Yellow Pages and White Pages phone directories, infoUSA collects data (number of employees, annual sales, SIC codes, and much more) on more than 12 million U.S. businesses. Beyond these two sources, infoUSA mines its base data from federal, state, and municipal government blue pages, annual reports for publicly-held companies, and industrial and regional business journals. Specific input data sources include:
Page 39 bay area demo - 2005

Telephone Verification/Enhancement
AddressName of owner or managerNumber of employeesPrimary business activityFax numberEnhancement of the Base File by Claritas
All data compilation, validation, and verification techniques outlined above result in a robust, thorough base file for use in creating the Business-Facts database. However, when the base file is delivered to Claritas, additional enhancements are made to improve matching capabilities and provide greater integration into a range of applications, like mapping. For instance, employment data, sales figures, and point/geo codes (latitude, longitude, census tract, etc.) remain incomplete when Claritas receives the data. The database development team at Claritas adds value to the business data by populating fields that are left empty by infoUSA, providing the most precise point coding and creating an improved SIC roster.
infoUSA calls existing and new businesses at least once each year to verify information, collect additional data, and correct suspected errors. At least four attempts are made to contact each business. Large businesses (i.e., those with 100 or more employees) are phoned twice a year to verify their information. This activity results in 17 million out-bound telephone calls each year by infoUSA. Telephone verification concentrates on the following data elements:
After compiling the base file, infoUSA runs the business information through several routines to ensure that the final product will be dependable for use by salespeople and marketers interested in using its contents for mailing campaigns. For instance, infoUSA processes the business file through Group 1 CASS Certified Software for address and ZIP Code verification. Furthermore, each month infoUSA runs the files against the National Change of Address (NCOA) and the Delivery Sequence files to ensure that business addresses are current and accurate.
Page 40 bay area demo - 2005