Embed Size (px)
Citation preview

Jay SaccaroChief Financial Officer
May 21, 2018
FINANCIAL OUTLOOK

2|
Safe Harbor StatementThis presentation includes forward-looking statements concerning Baxter’s financial results, R&D pipeline, including planned product launches (many of which are subject to regulatory approval) and results of clinical trials, business development activities, capital structure, cost savings initiatives, Baxter’s long range plan (which includes financial outlook for 2018, 2020 and 2023) and other growth strategies. The statements are based on assumptions about many important factors, including the following, which could cause actual results to differ materially from those in the forward-looking statements: demand for and market acceptance of risks for new and existing products; product development risks; product quality or patient safety concerns; continuity, availability and pricing of acceptable raw materials and component supply; inability to create additional production capacity in a timely manner or the occurrence of other manufacturing or supply difficulties (including as a result of a natural disaster or otherwise); breaches or failures of Baxter’s information technology systems, including by cyberattack; future actions of regulatory bodies and other governmental authorities, including FDA, the Department of Justice, the New York Attorney General and foreign regulatory agencies; failures with respect to compliance programs; future actions of third parties, including payers; U.S. healthcare reform and other global austerity measures; pricing, reimbursement, taxation and rebate policies of government agencies and private payers; the impact of competitive products and pricing, including generic competition, drug reimportation and disruptive technologies; global, trade and tax policies; accurate identification of and execution on business development and R&D opportunities and realization of anticipated benefits (including the recent acquisitions of Claris Injectables and two surgical products from Mallinckrodt plc); the ability to enforce owned or in-licensed patents or the patents of third parties preventing or restricting manufacture, sale or use of affected products or technology; the impact of global economic conditions; fluctuations in foreign exchange and interest rates; any change in law concerning the taxation of income (including current or future tax reform), including income earned outside the United States; actions taken by tax authorities in connection with ongoing tax audits; loss of key employees or inability to identify and recruit new employees; the outcome of pending or future litigation; the adequacy of Baxter’s cash flows from operations to meet its ongoing cash obligations and fund its investment program; and other risks identified in Baxter’s most recent filing on Form 10-K and other Securities and Exchange Commission filings, all of which are available on Baxter’s website. Baxter does not undertake to update its forward-looking statements.

3|1All references to “new products” in this presentation include new product launches, line extensions and geographic expansions, unless otherwise noted.
Delivering On Our Strategy
Building Momentum With Strong Operational Performance
Capitalizing On New Product Launches And Geographic Expansion1
Executing Disciplined Focus On Business Transformation Initiatives
Significantly Enhancing Balance Sheet Flexibility To Deliver Value

4|1See appendix on slides 22 – 26 for information regarding non-GAAP financial metrics used in this presentation. 2FY 2016 and FY 2017 Operational Growth.
3FY 2015 to FY 2017; free cash flow represents operating cash flow less capital expenditures. 412/31/15 through 05/18/18.
2015 – 2017 Progress On Key Financial Metrics1
~5%Annual Operational
Sales Growth2
+600bpsAdjusted OperatingMargin Expansion3
+80%Adjusted Diluted
EPS Growth3
>3.5XFree Cash
Flow Growth3
Tremendous Progress On Key Financial Metrics Fueled Top-Quartile Results
+90%Total Shareholder
Return4

5|1LRP time horizon is 2018 - 2023
Long Range Plan (LRP): Guidelines & Assumptions1
Outlook Assumes:• Stable macro-environment
• Current foreign exchange rates
• Risk-adjusted revenues from new products
• Modest price increases for select products
• Competition for U.S. Cyclo and Brevibloc
• Share repurchases to offset option dilution
• Adjusted financial results, excluding special items
Outlook Does Not Assume:• Any impact from currency fluctuations
• Prospective M&A initiatives
• Any incremental reduction in share count through stock buybacks
• Any material change in global regulatory or macro-environment
6|
The Evolution Of Baxter’s 2020 Outlook1
1All references in this presentation to future financial expectations assume commercial execution and regulatory approvals, as applicable, consistent with Baxter’s plans.
Adjusted Operating
Margin
~14%
17% - 18%
~20% 20% - 21%
May2015
May2016
July2017
May2018
Adjusted Diluted EPS
OutlookAs Of
N/A $2.75 - $3.00 $3.25 - $3.40 $3.60 - $3.75

7|
Long-Range Outlook: Summary
2018Guidance
2020Outlook
2023Outlook
Sales GrowthConstant Currency
~5% 4% - 5%’18 – ’20 CAGR
~5%’18–’23 CAGR
5% - 6%’20–’23 CAGR
Adjusted Operating Margin 17.1% - 17.3% 20% - 21% 23% - 24%
Adjusted Tax Rate ~19% ~21% ~21.5%
Adjusted Diluted EPS $2.85 - $2.93 $3.60 - $3.75 $4.90 - $5.05

8|12018 – 2023 sales CAGR.
2018 – 2023 Sales Growth
~300 bps
~5%~200 bps
2018Guidance
OperationalGrowth
New Products &Geo Expansion
2023Outlook1
Sustainable Growth CAGR Of ~5% Driven By Strong Operational Performance,New Product Launches And Geographic Expansion
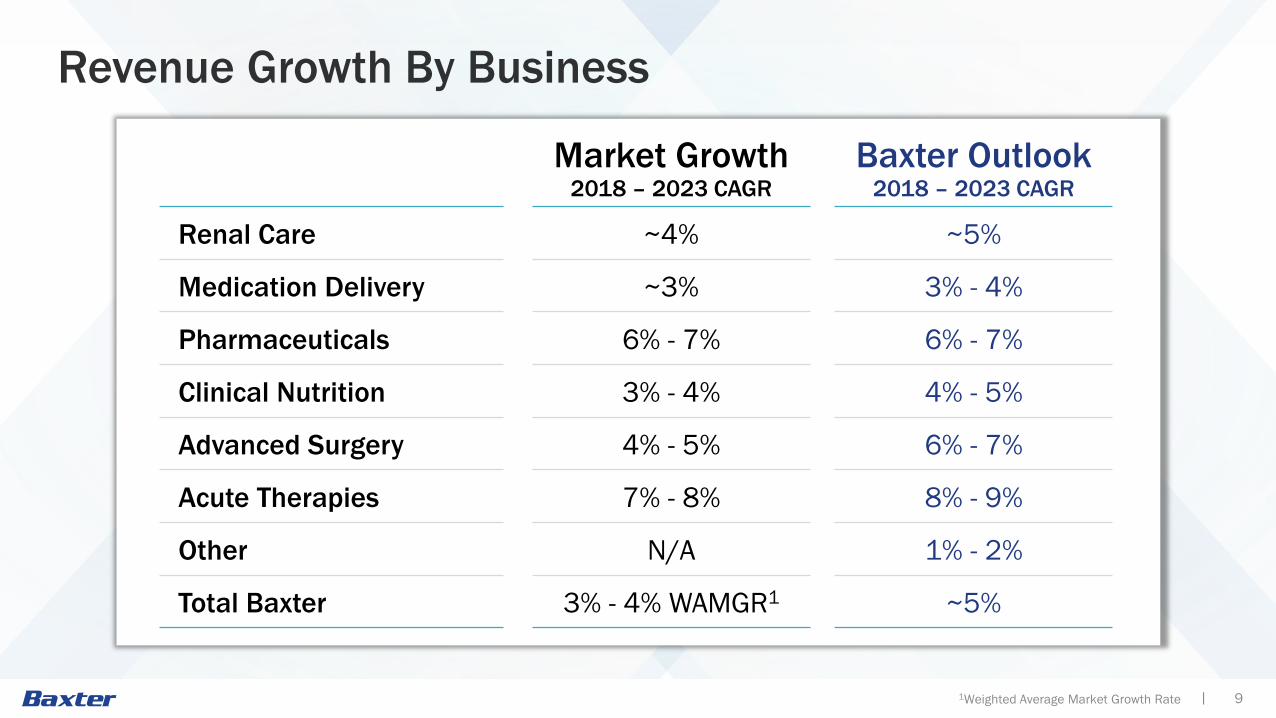
9|1Weighted Average Market Growth Rate
Revenue Growth By Business
Market Growth2018 – 2023 CAGR
Baxter Outlook2018 – 2023 CAGR
Renal Care ~4% ~5%
Medication Delivery ~3% 3% - 4%
Pharmaceuticals 6% - 7% 6% - 7%
Clinical Nutrition 3% - 4% 4% - 5%
Advanced Surgery 4% - 5% 6% - 7%
Acute Therapies 7% - 8% 8% - 9%
Other N/A 1% - 2%
Total Baxter 3% - 4% WAMGR1 ~5%
10|
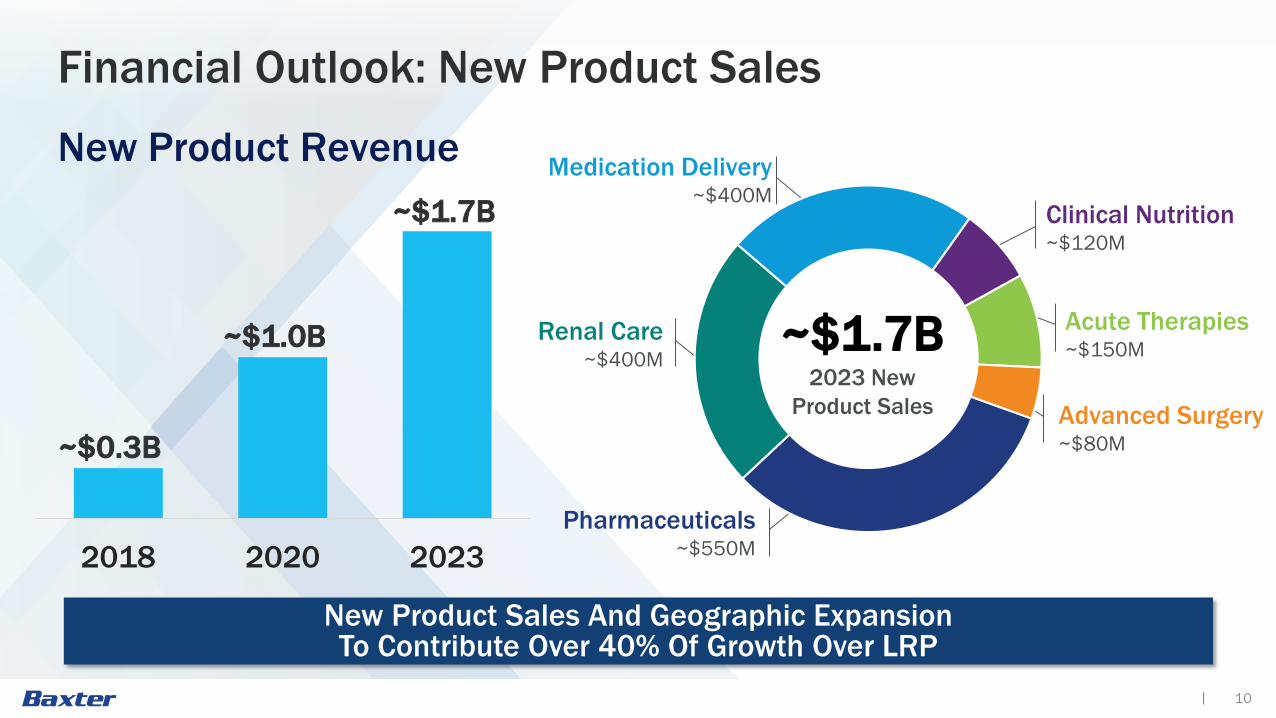
Medication Delivery~$400M
Renal Care~$400M
Pharmaceuticals~$550M
Acute Therapies~$150M
Clinical Nutrition~$120M
Advanced Surgery~$80M
Financial Outlook: New Product Sales
2018 2020 2023
~$0.3B
~$1.0B
~$1.7B
New Product Sales And Geographic ExpansionTo Contribute Over 40% Of Growth Over LRP
New Product Revenue
~$1.7B2023 New
Product Sales

11|
Cumulative Savings vs. 2015
Transforming Cost Structure And Enhancing Operational Efficiency
~$0.4B
~$0.9B
~$1.1B ~$1.2B
2016 2018 2020 2023
Zero-Based OrganizationRightsizing organization with reduced spans and layers
Zero-Based SpendingEmploying disciplined cost assessment to eliminate waste
Portfolio ManagementOptimizing manufacturing footprint, R&D operations and supply chain network
Global Business ServicesCentralizing and streamlining support functions

12|
Adjusted Operating Margin Improvement
10.3%
13.8%16.3% 17.1% - 17.3%
20% - 21%23% - 24%
2015Actual
2016Actual
2017Actual
2018Guidance
2020Outlook
2023Outlook
More Than Doubling Adjusted Operating Margin By 2023

13|
Adjusted Operating Margin Improvement
17.1% - 17.3%
350+ bps
23% - 24%
250+ bps
Enhanced Portfolio And Business Transformation InitiativesDrive 600+ bps Of Margin Expansion Over LRP
2018Guidance
GrossMargin
OperatingExpenses
2023Outlook
17.1% - 17.3%
350+ bps
250+ bps
600+ bps increase driven by:
Portfolio mix improvement
New product launches and geographic expansion
Manufacturing optimization programs
Modest price improvements
Continued execution of business transformation initiatives
14|
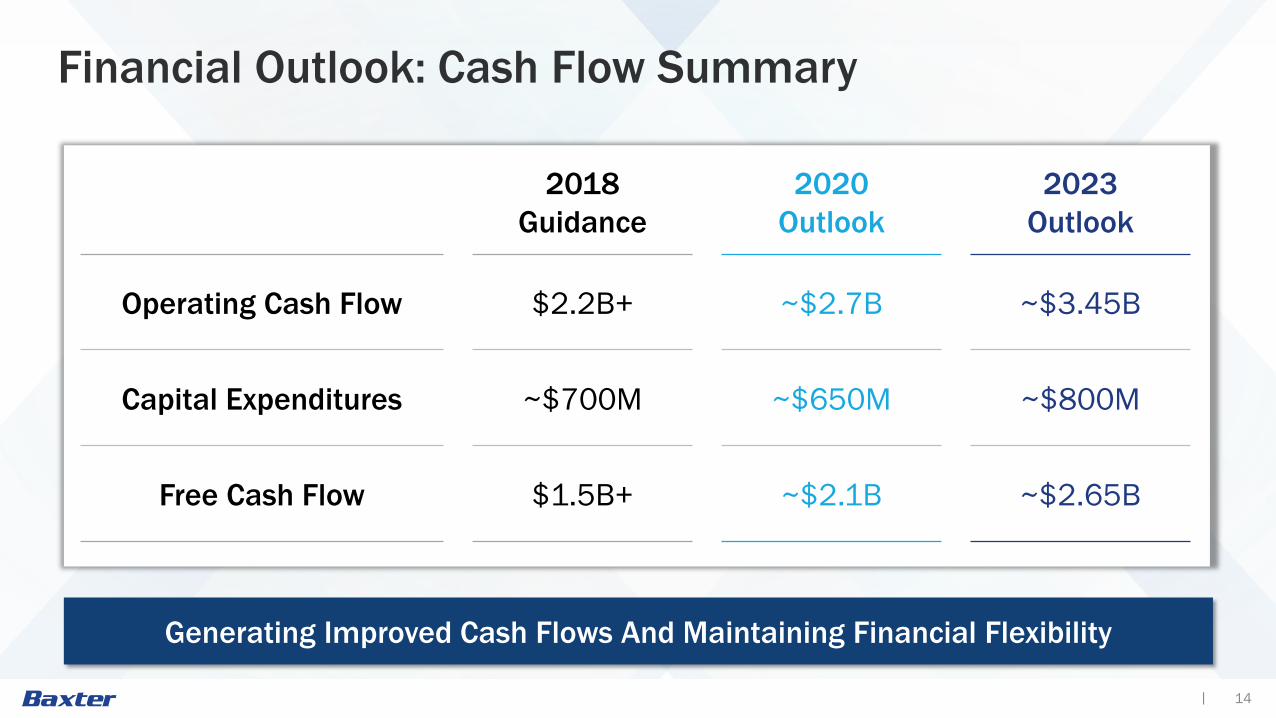
2018Guidance
2020Outlook
2023Outlook
Operating Cash Flow $2.2B+ ~$2.7B ~$3.45B
Capital Expenditures ~$700M ~$650M ~$800M
Free Cash Flow $1.5B+ ~$2.1B ~$2.65B
Financial Outlook: Cash Flow Summary
Generating Improved Cash Flows And Maintaining Financial Flexibility

15|
Cash Flow Improvement1
1Totals may not foot due to rounding.
Capital Expenditures
Free Cash Flow $0.3B$0.9B $1.2B $1.5B+
$2.1B$2.65B
$0.9B
$0.7B$0.6B
$0.7B
$0.65B
$0.8B
2015 2016 2017 2018 2020 2023
FCFConversion 45% 84% 89% >90%
$1.3B $1.6B $1.9B $2.2B+ ~$2.7B ~$3.45BOperating Cash Flow
16|
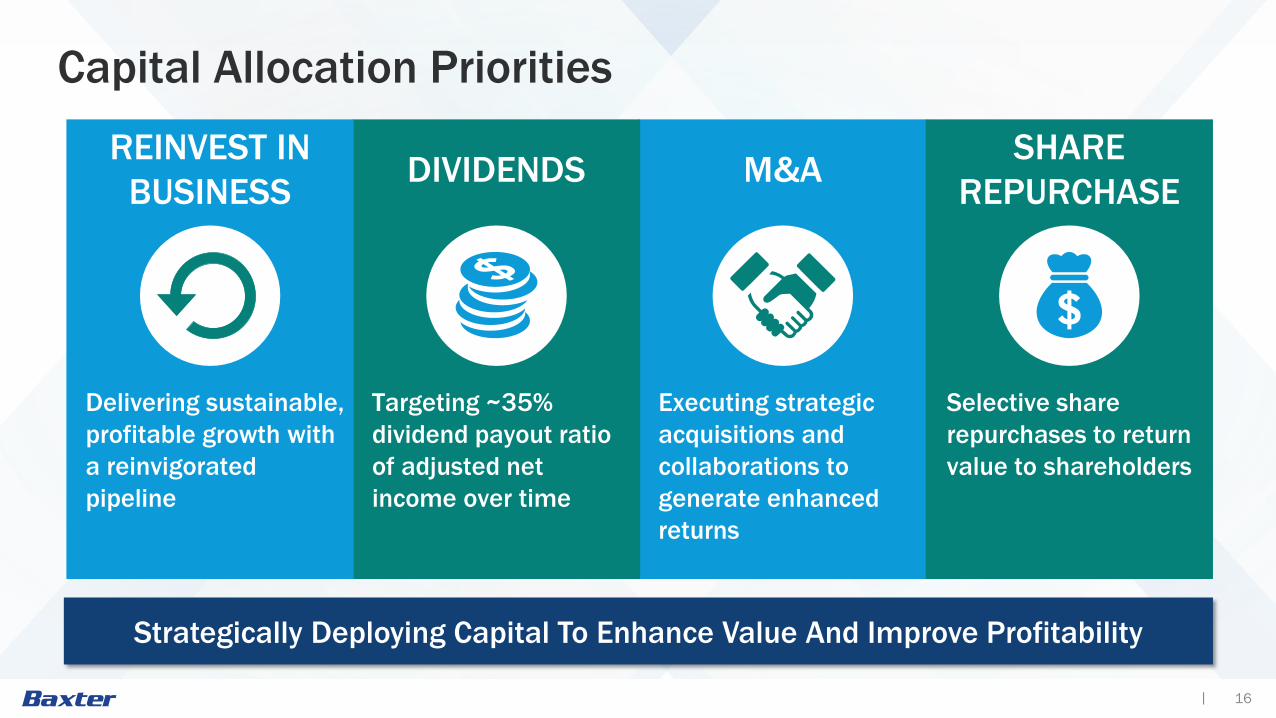
Capital Allocation Priorities
Delivering sustainable, profitable growth with a reinvigorated pipeline
Targeting ~35% dividend payout ratio of adjusted net income over time
Executing strategic acquisitions and collaborations to generate enhanced returns
Selective share repurchases to return value to shareholders
REINVEST IN BUSINESS DIVIDENDS M&A SHARE
REPURCHASE
Strategically Deploying Capital To Enhance Value And Improve Profitability
17|
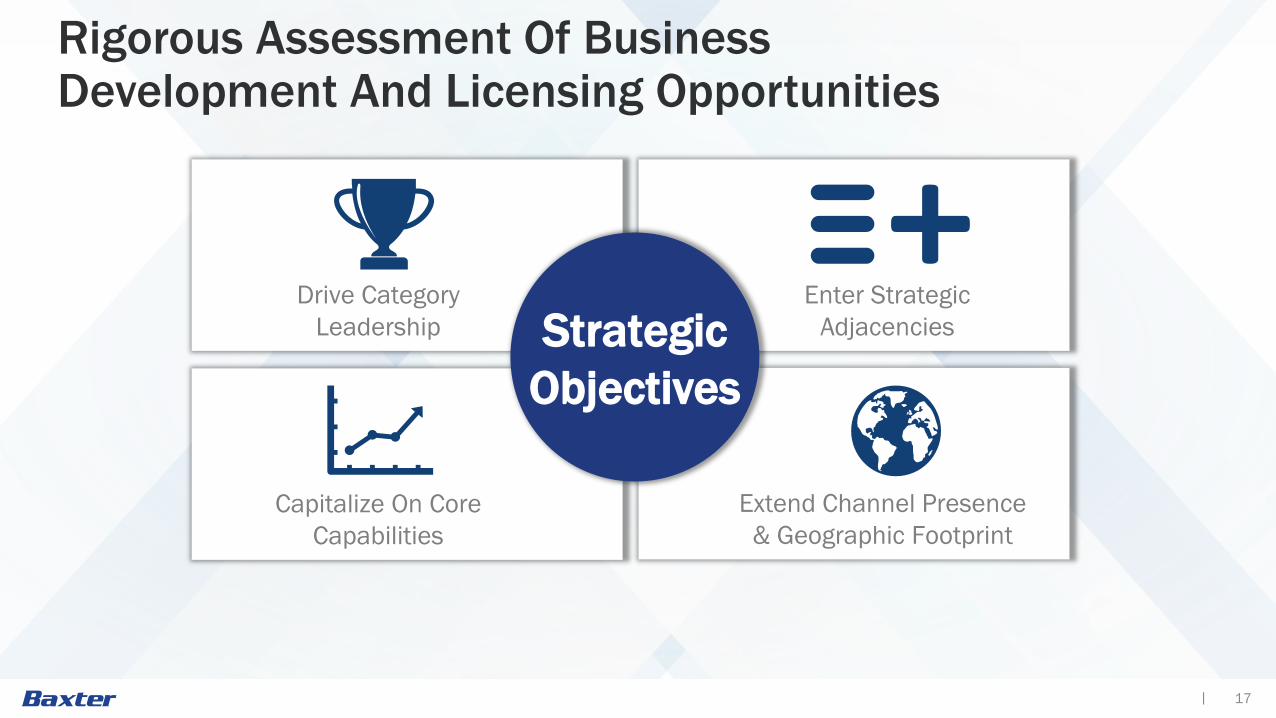
Rigorous Assessment Of BusinessDevelopment And Licensing Opportunities
Drive Category Leadership
Capitalize On Core Capabilities
Extend Channel Presence& Geographic Footprint
Enter StrategicAdjacenciesStrategic
Objectives

18|1IRR = Internal Rate of Return; ROIC = Return on Invested Capital
Rigorous Assessment Of BusinessDevelopment And Licensing Opportunities
Accelerate Top-LineAccretive to Margins
Accretive to CashEarnings In Near-Term
Preserve InvestmentGrade Credit Rating
Double-Digit IRR andAttractive ROIC1Financial
Guidelines

19|
Rigorous Assessment Of BusinessDevelopment And Licensing Opportunities
Evaluating Opportunities With Strategic And Financial Discipline
FinancialGuidelines
StrategicObjectives
ValueCreationOpportunities
Targeting future steady state of ~2.0X Net Debt / EBITDA Targeting investment grade rating
20|
Key Takeaways
Strong markets, innovation and geographic expansion position Baxter to deliver a ~5% sales CAGR over the LRP
Improving portfolio mix, new product launches and business transformation initiatives drive 600+ bps of operating margin improvement
Continuing significant improvement in cash flow generation to maintain financial flexibility
Focused on returning value to stakeholders with a strategic, disciplined approach to capital allocation

Non-GAAP Reconciliationsas of May 21, 2018

22|
Non-GAAP Reconciliation as of May 21, 2018On May 21, 2018, Baxter presented guidance for FY 2018, FY 2020 and FY 2023 using non-GAAP measures of sales growth (on a constant currency basis), adjusted operating margin, adjusted tax rate, adjusted diluted earnings per share, free cash flow and free cash flow conversion (free cash flow divided by adjusted net income). All such measures are presented solely with respect to Baxter’s continuing operations.
The reconciliations contained on these slides reconcile the non-GAAP measures set forth above to the most directly comparable GAAP measures based in each case on special items known to Baxter as of the date hereof. Actual results are subject to change, and may include or exclude additional special items, as applicable.
Forecasts:
Sales growth (on a constant currency basis) for FY 2018 of 5% excludes the impact of foreign currency of approximately 2% to 3%. GAAP sales growth is expected to be 7% to 8% for FY 2018. Sales growth forecasts for FY 2020 and FY 2023 assumes foreign currency rates remain unchanged compared to 2018.
For purposes of reconciling free cash flow, we have provided operating cash flow and a reconciliation of adjusted net income to GAAP net income for each subject period. See slide 15 for operating cash flow guidance over the LRP. Reconciling 2018 adjusted income from continuing operations of $1.6 billion for known intangible amortization of $0.1 billion, business optimization items of $0.1 billion and the February 2018 settlement with Claris Injectables (Claris) of $(0.1) billion results in GAAP income from continuing operations of $1.5 billion. Reconciling 2020 adjusted income from continuing operations of $2.0 to $2.1 billion for known intangible amortization of $0.1 billion results in GAAP income from continuing operations of $1.9 to $2.0 billion. Reconciling 2023 adjusted income from continuing operations of $2.7 to $2.8 billion for known intangible amortization of $0.1 billion results in GAAP income from continuing operations of $2.6 to $2.7 billion.

23|
Non-GAAP Reconciliation as of May 21, 2018Forecasts, continued:
Reconciling 2018 adjusted operating margin of 17.1% to 17.3% for the impact of known intangible asset amortization expense of 1.5%, 1.3% to 1.6% in estimated business optimization items and 0.2% of estimated acquisition and integration expenses (as partially offset by a benefit of (0.7%) for the February 2018 Claris settlement) results in GAAP operating income margin of approximately 14.5% to 15.0%. Reconciling 2020 and 2023 adjusted operating margin of 20% to 21% and 23% to 24%, respectively, for known intangible asset amortization expense of 1% to 2% and 1%, respectively, results in GAAP operating income margin of approximately 18% to 20% and 22% to 23%, respectively.
The adjusted tax rate for FY 2018 of approximately 19% exceeds the GAAP tax rate of approximately 16% by 3% due to the February 2018 Claris settlement of 1%, the tax impact of business optimization items of approximately 1% and the tax impact of intangible asset amortization of approximately 1%. The adjusted tax rate for FY 2020 and FY 2023 of approximately 21% and 21.5%, respectively, approximates the GAAP tax rate in each year.
Reconciling 2018 adjusted diluted earnings per share of $2.85 to $2.93 for known intangible asset amortization expense of $0.24, $0.18 to $0.23 of business optimization items, $0.01 of litigation costs and $0.03 of acquisition and integration expenses partially offset by ($0.14the February 2018 Claris settlement and ($0.01) from U.S. tax reform results in GAAP diluted earnings per share between $2.49 and $2.6) from 2. For FY 2020 and FY 2023, reconciling adjusted diluted earnings per share of $3.60 to $3.75 and $4.90 to $5.05, respectively, by known intangible asset amortization expense of $0.24 in FY 2020 and $0.21 in FY 2023 results in GAAP diluted earnings per share of $3.36 to $3.51 and $4.69 to $4.84, respectively.
Free cash flow of approximately $1.5 billion, $2.1 billion and $2.65 billion in FY 2018, FY 2020 and FY 2023, respectively, includes operating cash flow of approximately $2.2 billion, $2.7 billion and $3.45 billion, respectively, less capital expenditures of approximately $0.7 billion, $0.6 billion and $0.8 billion, respectively.
24|
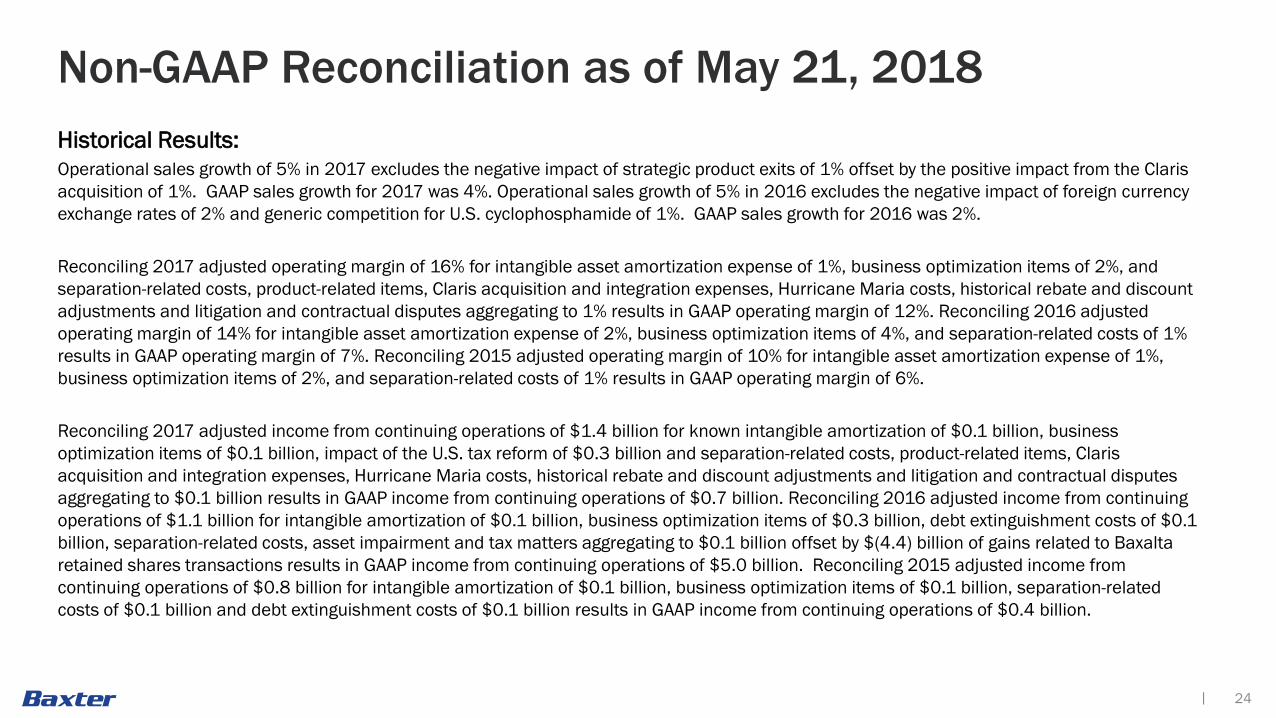
Non-GAAP Reconciliation as of May 21, 2018Historical Results:Operational sales growth of 5% in 2017 excludes the negative impact of strategic product exits of 1% offset by the positive impact from the Claris acquisition of 1%. GAAP sales growth for 2017 was 4%. Operational sales growth of 5% in 2016 excludes the negative impact of foreign currency exchange rates of 2% and generic competition for U.S. cyclophosphamide of 1%. GAAP sales growth for 2016 was 2%.
Reconciling 2017 adjusted operating margin of 16% for intangible asset amortization expense of 1%, business optimization items of 2%, and separation-related costs, product-related items, Claris acquisition and integration expenses, Hurricane Maria costs, historical rebate and discount adjustments and litigation and contractual disputes aggregating to 1% results in GAAP operating margin of 12%. Reconciling 2016 adjusted operating margin of 14% for intangible asset amortization expense of 2%, business optimization items of 4%, and separation-related costs of 1% results in GAAP operating margin of 7%. Reconciling 2015 adjusted operating margin of 10% for intangible asset amortization expense of 1%, business optimization items of 2%, and separation-related costs of 1% results in GAAP operating margin of 6%.
Reconciling 2017 adjusted income from continuing operations of $1.4 billion for known intangible amortization of $0.1 billion, business optimization items of $0.1 billion, impact of the U.S. tax reform of $0.3 billion and separation-related costs, product-related items, Claris acquisition and integration expenses, Hurricane Maria costs, historical rebate and discount adjustments and litigation and contractual disputes aggregating to $0.1 billion results in GAAP income from continuing operations of $0.7 billion. Reconciling 2016 adjusted income from continuing operations of $1.1 billion for intangible amortization of $0.1 billion, business optimization items of $0.3 billion, debt extinguishment costs of $0.1 billion, separation-related costs, asset impairment and tax matters aggregating to $0.1 billion offset by $(4.4) billion of gains related to Baxalta retained shares transactions results in GAAP income from continuing operations of $5.0 billion. Reconciling 2015 adjusted income from continuing operations of $0.8 billion for intangible amortization of $0.1 billion, business optimization items of $0.1 billion, separation-related costs of $0.1 billion and debt extinguishment costs of $0.1 billion results in GAAP income from continuing operations of $0.4 billion.

25|
Non-GAAP Reconciliation as of May 21, 2018Historical Results, continued:
Reconciling 2017 adjusted diluted earnings per share of $2.48 for known intangible asset amortization expense of $0.19, $0.21 of business optimization items, $0.02 of separation-related costs, $0.02 of product-related items, $0.04 of Claris acquisition and integration expenses, $0.06 of Hurricane Maria expenses, $0.03 related to litigation and contractual disputes, $0.04 for the deconsolidation of Baxter’s Venezuelan operations, $0.58 for the estimated impact of U.S. tax reform and $(0.02) related to an adjustment to Baxter’s historical rebate and discount reserves results in GAAP diluted earnings per share of $1.30.
Reconciling 2016 adjusted diluted earnings per share of $1.96 for intangible asset amortization expense of $0.21, $0.07 of intangible asset impairment, $(8.07) of net realized gains on Baxalta retained shares transactions, $0.18 of debt extinguishment costs, $0.53 of business optimization items, $0.07 of separation-related costs, $(0.02) for a net after-tax benefit related to the settlement of an income tax matter in Baxter’s joint venture in Turkey and $(0.02) of product-related items results in GAAP diluted earnings per share from continuing operations of $9.01.
Reconciling 2015 adjusted diluted earnings per share of $1.38 for known intangible asset amortization expense of $0.23, $0.15 of debt extinguishment costs, $0.26 of business optimization items and Gambro integration expenses, $0.15 of separation-related costs, $(0.06) of litigation settlements, $(0.03) for the reversal of contingent consideration milestone liabilities and $(0.05) of product-related items results in GAAP diluted earnings per share of $0.72.
Free cash flow of $1.2 billion in 2017 consists of $1.8 billion of operating cash flows less $0.6 billion of capital expenditures. Free cash flow of $0.9 billion in 2016 consists of $1.6 billion of operating cash flows less $0.7 billion of capital expenditures. Free cash flow of $0.3 billion in 2015 consists of $1.3 billion of operating cash flows less $0.9 billion of capital expenditures.
Totals presented in these reconciliations may not foot due to rounding.

26|
Non-GAAP Reconciliation as of May 21, 2018Sales growth at constant currency reflects the percentage increase in local currency sales as compared to the prior period, translated at the prior period’s foreign exchange rates. Operational sales growth is also presented and excludes the impact of foreign exchange, generic competition for U.S. cyclophosphamide, the acquisition and select strategic product exits Baxter is undertaking. Adjusted operating margin is calculated by dividing adjusted operating income by net sales. Adjusted tax rate is calculated by dividing adjusted tax expense by adjusted pre-tax income. Adjusted diluted earnings per share is calculated by dividing adjusted net income by diluted shares outstanding. Free cash flow represents operating cash flows minus capital expenditures. Free cash flow conversion represents free cash flow divided by adjusted net income from continuing operations.
Non-GAAP financial measures may provide a more complete understanding of Baxter’s operations and can facilitate a fuller analysis of Baxter’s results of operations, particularly in evaluating performance from one period to another. Sales growth at constant currency provides information on the change in net sales assuming the foreign currency exchange rates had not changed between the prior and current period. Operational sales growth provides information on the change in net sales assuming that foreign currency exchange rates remain constant and excluding the impact of U.S. cyclophosphamide competition, the Claris acquisition and strategic product exits. Adjusted operating margin, adjusted tax rate and adjusted diluted earnings per share all exclude special items. Free cash flow excludes capital expenditures from operating cash flows. Special items are excluded because they are highly variable, difficult to predict or unusual and of a size that may substantially impact Baxter’s reported operations for a period. Additionally, intangible asset amortization expense is excluded as a special item to facilitate an evaluation of current and past performance, particularly in terms of cash returns, and is similar to how management internally assesses performance.
These estimates are based on information reasonably available at the time of this presentation and future events or new information may result in different actual results.
Management believes that non-GAAP earnings measures, when used in conjunction with the results presented in accordance with GAAP and the reconciliations to corresponding GAAP financial measures, may enhance an investor’s overall understanding of Baxter’s past financial performance and prospects for the future. Accordingly, management uses these non-GAAP measures internally in financial planning, to monitor business unit performance, and in some cases for purposes of determining incentive compensation. This information should be considered in addition to, and not as a substitute for, information prepared in accordance with GAAP.

![FOR THE DISTRICT OF NEW JERSEY BAXTER … THE DISTRICT OF NEW JERSEY BAXTER HEALTHCARE CORPORATION, BAXTER INTERNATIONAL INC., and ... 1684.] 4 Although Baxter purports to seek construction](https://img.dokumen.tips/doc/110x75/5b0a073a7f8b9aba628b8749/for-the-district-of-new-jersey-baxter-the-district-of-new-jersey-baxter-healthcare.jpg)