Embed Size (px)
Citation preview
Battery Capacity Measurement And AnalysisUsing Lithium Coin Cell Battery
Sung Park, Andreas Savvides, Mani B. SrivastavaNetworked and Embedded Systems Laboratory
Electrical Engineering DepartmentsUniversity of California, Los Angelesspark, asavvide, [email protected]
ABSTRACTIn this paper, we look at different battery capacity models thathave been introduced in the literatures. These models describe thebattery capacity utilization based on how the battery is dischargedby the circuits that consume power. In an attempt to validate thesemodels, we characterize a commercially available lithium coin cellbattery through careful measurements of the current and thevoltage output of the battery under different load profile appliedby a micro sensor node. In the result, we show how the capacityof the battery is affected by the different load profile and provideanalysis on whether the conventional battery models areapplicable in the real world. One of the most significant findingof our work will show that DC/DC converter plays a significantrole in determining the battery capacity, and that the true capacityof the battery may only be found by careful measurements.
KeywordsEmbedded System, Battery, Power Estimation, EnergyEstimation, DC/DC Converter, Coin Cell, Data Acquisition
1. INTRODUCTIONProliferation of battery-powered mobile devices such ashandhelds, cell phones, and pagers has given motivation to lookfor ways to prolong the lifetime of the battery. Furthermore, theslow improvement of the battery technology relative to the growthof power demand from these mobile devices has been fuelingmany studies in characterization and optimization of power usageof mobile devices so that the battery can be efficiently utilized.One of the vital pieces necessary in characterizing the powerusage of the mobile system is the accurate battery model. Anaccurate battery model can reveal the efficiency of wirelessprotocols and power management schemes used in the mobiledevices while an inaccurate model may tell a story far differentfrom reality. However, this vital piece of the puzzle haveremained a stumbling block for many of the electrical engineersand computer scientists due to batteries’ complex technologieswhich involve many intricate highly non-linear electrochemicalphenomenon. Moreover, many factors such as battery dimension,makeup of anode or cathode, and transport or diffusion rate ofactive materials, that contribute to the characteristics of the battery
have kept the battery technology in the domain of electrochemists.
In spite of these difficulties, there have been recent efforts[1],[6],[7] to generalize these complexities of the battery bymodeling batteries’ inherent characteristics. These models rangefrom simple linear model to a complex model that attempts toincorporate the “relaxation” phenomenon. So far, these models,though novel in conceptual sense, lacked the validation in the realworld. Moreover, studying these models does not provide thebottom line for a mobile device designer who simply wants to findout what the maximum lifetime of his or her circuit will be. Muchof this is contributed by the difficulties mentioned in previousparagraph. In an attempt to overcome these difficulties, in thispaper we propose a technique that can be used in characterizingthe battery capacity. The technique is to carefully measure thebattery’s current and voltage output for the duration of the batterylifetime as the embedded board consumes power from the battery.This in turn will provide accurate measurement of the batterycapacity under different load profile generated by the embeddedboard. Not only the technique can help estimating the batterycapacity, but it can also be used to validate some of the batterymodels that have been proposed to see whether the outcomesforeseen by those models are accurate in reality. One primaryfocus of the paper is to look at the impact of the DC/DC converterby finding out whether the capacity delivered to the circuit isactually same as what was consumed from the battery. The paperis organized as follows. We provide an overview of some of thebattery models in interest in section 2, and discuss how themeasurement is done in section 3. We include the results and theanalysis of the measurement in section 4, and we conclude thepaper with section 5.
2. BATTERY MODELSRecent efforts in modeling the battery capacity are captured in thissection. These models can also be viewed as different generationsof battery models with later generations incorporating additionalcharacteristics of the battery technology. The metrics that areused to indicate the maximum capacity of the battery is in the unitof Ah (Ampere*Hour). The metric is a common method used bythe battery manufacturers to specify the theoretic total capacity ofthe battery. Knowing the current discharge of the battery and the
Permission to make digital or hard copies of all or part of this work forpersonal or classroom use is granted without fee provided that copies arenot made or distributed for profit or commercial advantage and thatcopies bear this notice and the full citation on the first page. To copyotherwise, or republish, to post on servers or to redistribute to lists,requires prior specific permission and/or a fee.ISLPED ’01, August 6-7, 2001, Huntington Beach, California, USA.Copyright 2001 ACM 1-58113-371-5/01/0008…$5.00.
†This paper is based in part on research performed under DARPA
Power Aware Computing and Communications program through
AFRL contract # F30602-00-C-0154. The views and conclusions
contained herein are those of the authors and should not be
interpreted as necessarily representing the official policies
or endorsements, either expressed or implied, of the DARPA,
Air Force Rome Laboratory or the U.S. Government.

total capacity in Ah, one can compute the theoretical lifetime of
the battery using the equation ,I
CT = , where T=battery
lifetime, C=rated maximum battery capacity in Ah, andI=discharge current. More on this metric can be found in [5],[7].
The following subsections are brief descriptions of three batterycapacity models that we consider.
2.1 Linear Model – 1st GenerationIn Linear Model, the battery is treated as linear storage of current.The maximum capacity of the battery is achieved regardless ofwhat the discharge rate is. The simple battery model allows userto see the efficiency of the user’s application by providing howmuch capacity is consumed by the user. The remaining capacityafter operation duration of timetd can be expressed by thefollowing equation.
Remaining capacity (in Ah) = ∫+
=
−=dtt
tt
dttICC0
0
)(' , Eq.(1)
where C’ is the previous capacity andI(t) is the instantaneouscurrent consumed by the circuit at timet. The Linear Modelassumes thatI(t) will stay the same for the durationtd, if theoperation mode of the circuit does not change ( i.e. radioswitching from receiving to transmit, CPU switching from activeto idle, etc.. ) for the durationtd. With these assumptionsequation 1 simply becomes as the following.
d
tt
t
tt
tt
tICtICdttICC d
d
⋅−=⋅−=−= ++
=∫ '')(' 0
0
0
0
, Eq(2)
The total remaining capacity is computed whenever the dischargerate of the circuit changes. Being the most simplistic model,Linear Model falls short of portraying the behavior of a real lifebattery with characteristics such as rate dependent capacity andrelaxation.
2.2 Discharge Rate Dependent Model – 2nd
GenerationWhile Linear Model assumes that the maximum capacity of thebattery is unaffected by the discharge rate, Discharge RateDependent Model considers the effect of battery discharge rate onthe maximum battery capacity. In [1] [5] [15], it is shown thatbattery’s capacity is reduced as the discharge rate increases. Inorder to consider the effect of discharge rate dependency, weintroduce factork which is the battery capacity efficiency factorthat is determined by the discharge rate. The definition ofk is,
maxC
Ck eff= , whereCeff is the effective battery capacity andCmax
is the maximum capacity of the battery with both terms expressedin unit of Ah. In Discharge Rate Dependent Model, the equation 1is then transformed to the following.
dtICkC ⋅−⋅= ' , Eq.(3)
The efficiency factork varies with the currentI and is close to onewhen discharge rate is low, but approaches 0 when the dischargerate becomes high. One way to find out what thek value is fordifferent current valueI is to use the table driven methodintroduced in [7]. With a table driven method, the factork can belooked up from a plot similar to figure 1 which can be obtainedfrom battery manufacturer’s data sheet [9]. The figure 1 plots thebattery capacity (Ceff) versus different discharge rateI. Using theplot, whenever the remaining capacity is computed (equation 3),the factork can be obtained from the plot by looking at the totalefficiency of the battery capacity for given currentI. One shortfallof Discharge Rate Dependent Model is the fact that it does notportray the behavior of real battery by neglecting the effect ofrelaxation.
2.3 Relaxation Model – 3rd GenerationReal-life batteries exhibit a general phenomenon called"relaxation" explained in [1],[5],[6]. When the battery isdischarged at high rate, the diffusion rate of the active ingredientsthrough the electrolyte and electrode falls behind. If the highdischarge rate is sustained, the battery reaches its end of life eventhough there are active materials still available. However, if thedischarge current from the battery is cutoff or reduced during thedischarge, the diffusion and transport rate of active materialscatches up with the depletion of the materials. This phenomenonis called relaxation effect, and it gives the battery chance torecover the capacity lost at high discharge rate. For a realisticbattery simulation, it’s important to look at the effects ofrelaxation as it has effect of lengthening the lifetime of the battery.[1] introduces an analytical model which takes discharge rate asinput and computes the battery voltage over the simulationduration. On the other hand, [6], [8] introduce a stochasticmodel, where the recovery is modeled as a change of state whichoccurs at a pre-set discharge rate. Obtained using the analyticalmodel from [4], the curve in figure 2 demonstrates the effect of
Figure 1. Capacity vs. Discharge Rate Curve for CR2354
0 100 200 300 400 500 600
time (sec)
2.56
2.58
2.6
2.62
2.64
2.66
2.68
2.7
2.72
Vo
ltag
e(V
)
8.5 mA
1.9 mA
Figure 2. Recovery Effect of Relaxation Model

relaxation. In figure 2 the battery voltage recovers when thebattery discharge rate is reduced to 1.9 mA after being dischargedat 8.5 mA. Although the relaxation model is the mostcomprehensive model that closely describes the behavior a realbattery, there exists considerable difficulty in implementing suchmodel since the relaxation effect involves many electrochemicaland physical properties of the battery. This is demonstrated by theanalytical model from [4] which contains over 50 electrochemicaland physical parameters of inputs that need to be measuredseparately for different types of battery.
This difficulty gives motivation for estimating the battery capacitybased on a measurement based approach.
3. MEASUREMENT SETUP
In this paper, we propose an entirely different approach ofestimating the battery capacity. The approach is to measure thecurrent and voltage output of the battery as an embedded boardconsumes current out from the battery. The measurement isperformed for different load profile until the battery’s cutoffvoltage is reached and the effective capacity of battery iscomputed.
Figure 3 shows the setup of the battery capacity measurementperformed on a lithium coin cell, CR2354. There are total of 4channels that monitor the current and voltage output of the battery(Chan1 and Chan2), and the current and the voltage output(Chan3 and Chan4) of DC/DC Converter. In order to measure thecurrent, we measure the minute voltage drop across two smallresistors, R1test and R2test, which are 2.2Ω high precisionresistors. While Chan1 and 2 monitor how much current andpower are consumed from the battery, Chan3 and 4 measures howmuch current and energy are actually delivered to the sensor boardbased on different load profiles. The values from the fourchannels are recorded to PC that encloses the PCI-6110E DAQboard. The measurement starts as a freshly charged (factorysealed) battery is placed on the circuit and micro sensor board isturned on. The measurement is stopped when the battery reachesthe minimum voltage of 2.0V at which point DC/DC converterno longer supplies required voltage to the micro sensor board. Thefollowings are the description of each components used in themeasurement.
3.1 Micro Sensor Board
Operation Mode AVR State RFM State Avg CurrentTx ON TX 12.2 mARx ON RX 9.0 mAIdle ON SLEEP 7.8 mA
Sleep SLEEP SLEEP 4.2 mAThe wireless sensor node we have built uses an RFM DR3000radio module [3] and an AVR 90LS8535 microcontroller [2] fromAtmel. The radio can transmit at 2 different data rates (2.4Kbpsand 19.2Kbps) and supports OOK and ASK modulation. Themicrocontroller has 8 Kbytes of flash memory, 512 bytes ofSRAM and 512 bytes of EEPROM. It is also equipped with an 8channel 10 ADC, a programmable UART and an SPI bus. Ourcurrent implementation has a prototyping area that can support awide variety of add on sensors such as magnetometers,thermometers, accelerometers and light sensors. Thisnode is avariant of the widely used Smart Dust [14] nodes from UCBerkeley. The board also includes an array of ultrasound sensorsthat can be used to infer node location. Our main focus is thedifferent power modes of the node that are shown in table 1.
3.2 Lithium Coin Cell Battery – CR2354 1
For the measurement, CR2354 lithium coin cell is used. With highenergy density and relatively flat discharge characteristics, lithiumbatteries are widely used in mobile devices such as cellularphones, digital cameras, and PDAs. Especially for micro sensornodes, small form factor is an essential necessity and the size oflithium coin cell batteries satisfies the stringent requirement ofmicro sensor nodes. Table 2 provides the manufacturer’sspecification of CR2354 which can be obtained from [9].
Table 2. CR2354 Specification
OutputVoltage
CutoffVoltage
Max.Capacity
DimensionDiam.xHt.
Wt
3.0 V 2.0V 560mAh 23.0mm x 5.4mm 5.9 g
3.3 DC/DC Converter (MAXIM 17712)As the battery is discharged, the voltage across the batteryconstantly decreases. When the battery is directly connected to aVLSI circuit without any form of voltage regulator, the circuits’performance will start to degrade as the voltage across the batterydecreases. Moreover, when the battery’s voltage reaches theminimum input voltage required by the circuit, the circuit willstop functioning even though there may be some capacity left inthe battery. It is the role of DC/DC converter to provide a constantvoltage to the circuit while utilizing complete capacity of thebattery. One type of DC/DC converter is called “switchingregulator”. A switching regulator is a circuit that uses an inductor,a transformer, or a capacitor as an energy-storage element totransfer energy from input to output in discrete packets [13].Switching regulators can be configured to be either step up(boost) or step down (buck) or inverting with respect to the inputvoltage [12]. Due to their efficiency and versatility, switchingregulators have been popular in battery powered mobile devices.When considering battery capacity measurement, it is important to
1 Manufactured by Panasonic2 Manufactured by Maxim Integrated Products, Inc.
Table 1. Node States And Current Consumption at 3.3V
PCI-6110E DAQ
++ ++ - - - -
Chan 2Chan 1 Chan 3 Chan 4
DR 3000Sensor
AS90LS8535
DC/DC ConverterMaxim 1771
R1test
BatteryCR2354
R2test
Micro Sensor Board
SCB-68 Connector Block
Figure 3. Battery Measurement Setup

look at the operation DC/DC converters since the convertersdischarge the battery based on its own voltage regulator function.By doing so, DC/DC converters completely change the loadprofile generated by the VLSI circuit. In our measurement, welook at the both input and the output of the DC/DC converter tosee how the operation DC/DC converter impacts the overallperformance of the battery.
The DC/DC converter used in the measurement is MAXIM 1771step up switching controller, which can provide a constant 3.3Vfrom the minimum input of 2V. Maxim 1771 uses the current-limited pulse-frequency-modulation (PFM) where the chargecycle is cut-off when a predetermined peak inductor current isreached and it remains at the cut-off stage for a pre-determinedfixed duration (called one-shot time constant)[13]. The effect ofDC/DC Converter on the battery current and voltage output willbe shown in section 4.
3.4 PCI-6110E1DAQ Board with SCB-68 3
Connection BlockPCI-6110E board is a real time data acquisition board that canscan up to 4 input channels simultaneously. The board isequipped with 12bit ADC per channel with sampling rate of up to5 Meg Samples/sec. The board uses SCB-68 connection block toconnect to the actual input channel. For the most of themeasurement the board was configured to scan at 5k samples/secfor each channel and some of the detailed measurements weredone at 25k samples/second. Also, in order to measure the minutevoltage drop across R1test and R2test, the precision of the boardwas configured to 97.66µV for Chan1 and Chan3. The precisionof Chan2 and 4 was set at 2.44 mV. More information on the
DAQ board can be found from [10], [11].
4. RESULTSThis section shows the performance of the battery by configuringthe sensor board into different operation modes displayed in table1. We look at how the battery capacity is affected by thedischarge rate, DC/DC converter’s voltage regulation function,and discharge profile of the sensor board. Figure 4 and 5 showsnapshots (20 msec) of the current and voltage output observedfrom all 4 channels. One noticeable effect shown in figure 4 isthat the current drawn by the sensor board (Chan3) is quitedifferent from the current from the battery (Chan1) as the currentdrawn by the sensor stays around constant 4 mA while the currentdrawn out of the battery ranges from 80 mA to 0 mA. The currentdischarge pulse seen at Chan1 is the direct result of the DC/DCconverters’ PFM switching function which completely changesthe load profile of the sensor board. This difference can also beseen from the voltage outputs shown in figure 5. The relaxationeffect plays a role in the battery as the voltage across the battery(Chan2) drops when the charge cycle starts then recovers whenthe discharge current is cutoff. Compared to the voltage seen atChan2, the voltage output of the DC/DC converter (Chan4)doesn’t vary much as it is kept above 3.3 V.
These differences between the output seen from the battery andthe output seen by the sensor board becomes clearer when thecurrent and voltage values are observed for the complete cycle ofthe battery life time. Figure 6 and 7 show how the battery isutilized as the sensor board stays at sleep mode. The curves infigure 6 and 7 are smoothed by averaging the samples collectedduring one second interval. In figure 6 the current output from
3 Product of National Instruments Corp.
Figure 5. Voltage Output from CR2354 (Chan2) and DC/DCConverter (Chan4) during Sleep Mode – Snap Shot
Figure 4. Current Output from CR2354 (Chan1) andDC/DC Converter (Chan3) during Sleep Mode – Snap Shot
Figure 6. Average Current Output from CR2354 (Chan1) andDC/DC Converter (Chan3) during Sleep Mode - Complete
Figure 7. Average Voltage Output from CR2354 (Chan2) andDC/DC Converter(Chan4) during Sleep Mode – Complete
0 0.004 0.008 0.012 0.016 0.02
Time(in sec)
2.2
2.6
3
3.4
Vol
tage
(V)
Chan2Chan4
0 0.004 0.008 0.012 0.016 0.02
Time(in sec)
-0.01
0.02
0.05
0.08
Cur
rent
(A)
Chan1Chan3
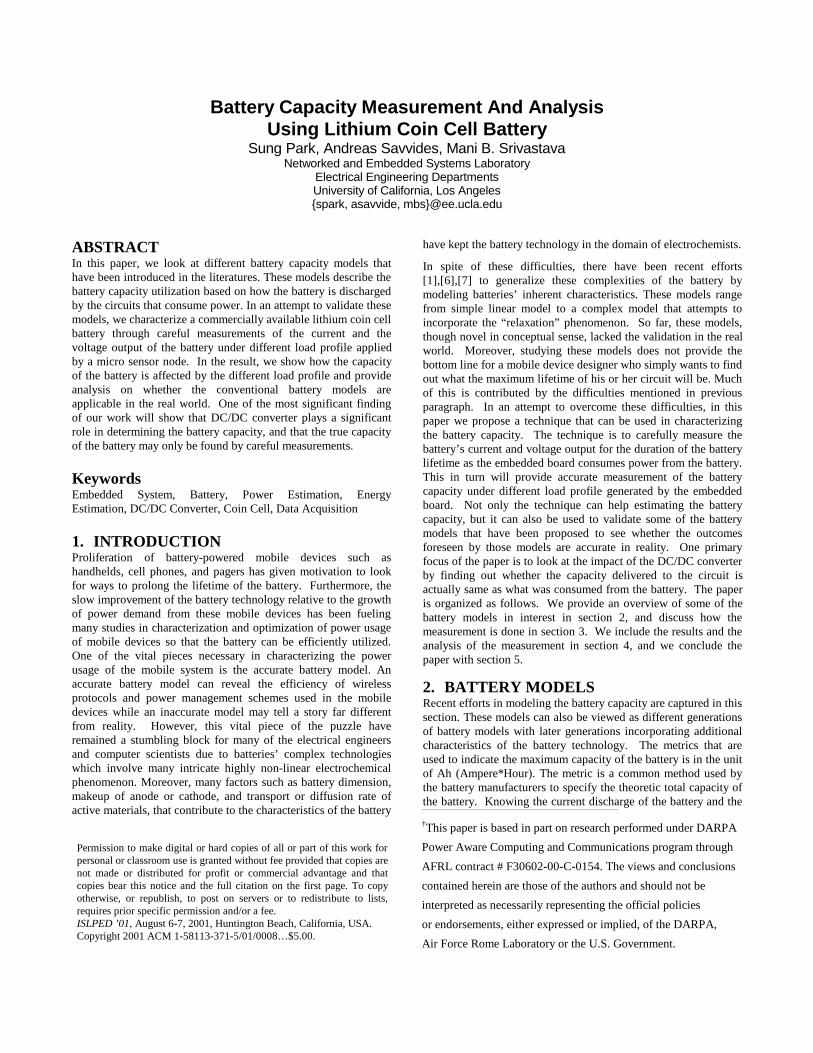
the battery increases as much as 32 mA when the DC/DCconverter pulls more and more current out from the battery whilethe voltage across the battery drops (figure 7). This increase incurrent discharge continues until it reaches the cutoff pointswhere DC/DC converter shuts down which occurs afterapproximately 7 hours. One interesting thing to notice in figure 6is that the total capacity of 28.8 mAh (area under the curve)delivered to the sensor board is much smaller than what theDC/DC converter consumed from the battery which is 59 mAh.This difference can be explained by studying the power curvesdisplayed in figure 8. Figure 8 plots the power consumed from thebattery and the power delivered to the sensor board which can becomputed by multiplying the current and the voltage plot. Thedecrease in the voltage across the battery (Chan2 in figure7) ismatched by the increase in the current drawn from the battery(Chan1 in figure6) to give relatively constant power consumptionover the course of the battery lifetime. Another factor thatcontributes to the difference in the current capacity is theefficiency factor of the DC/DC converter. This is demonstratedby the difference in energy (area under the curve) between the twocurves shown in figure 8.
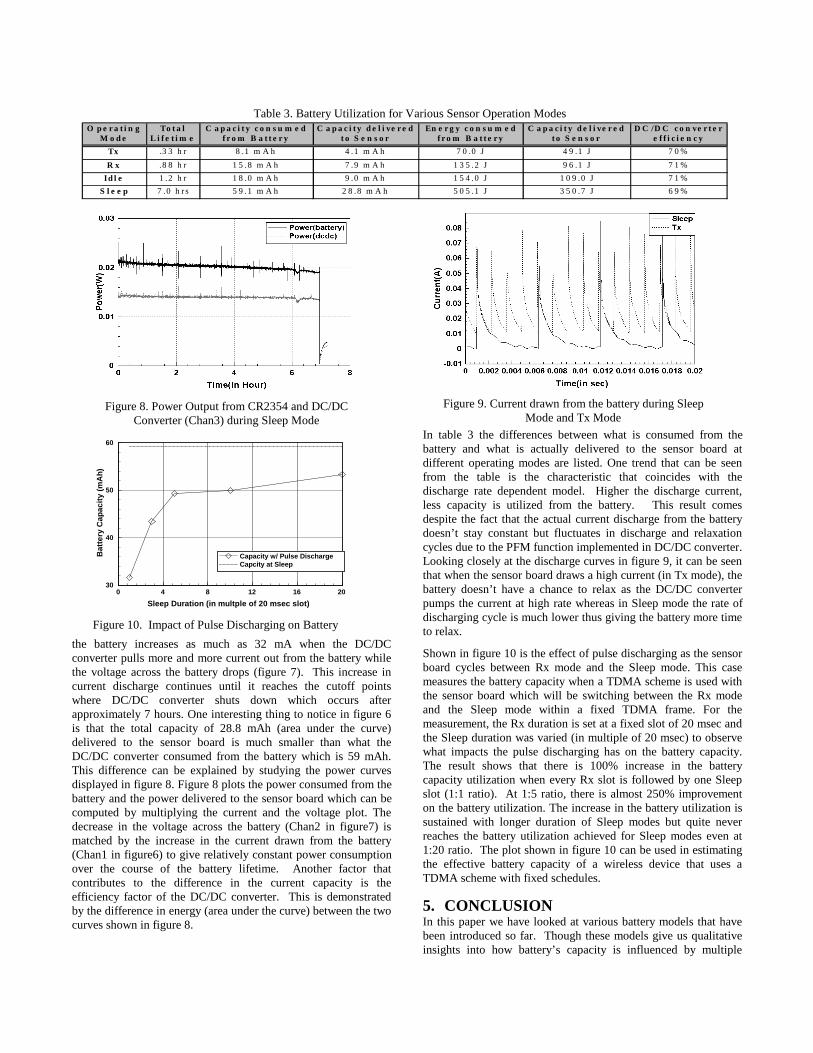
In table 3 the differences between what is consumed from thebattery and what is actually delivered to the sensor board atdifferent operating modes are listed. One trend that can be seenfrom the table is the characteristic that coincides with thedischarge rate dependent model. Higher the discharge current,less capacity is utilized from the battery. This result comesdespite the fact that the actual current discharge from the batterydoesn’t stay constant but fluctuates in discharge and relaxationcycles due to the PFM function implemented in DC/DC converter.Looking closely at the discharge curves in figure 9, it can be seenthat when the sensor board draws a high current (in Tx mode), thebattery doesn’t have a chance to relax as the DC/DC converterpumps the current at high rate whereas in Sleep mode the rate ofdischarging cycle is much lower thus giving the battery more timeto relax.
Shown in figure 10 is the effect of pulse discharging as the sensorboard cycles between Rx mode and the Sleep mode. This casemeasures the battery capacity when a TDMA scheme is used withthe sensor board which will be switching between the Rx modeand the Sleep mode within a fixed TDMA frame. For themeasurement, the Rx duration is set at a fixed slot of 20 msec andthe Sleep duration was varied (in multiple of 20 msec) to observewhat impacts the pulse discharging has on the battery capacity.The result shows that there is 100% increase in the batterycapacity utilization when every Rx slot is followed by one Sleepslot (1:1 ratio). At 1:5 ratio, there is almost 250% improvementon the battery utilization. The increase in the battery utilization issustained with longer duration of Sleep modes but quite neverreaches the battery utilization achieved for Sleep modes even at1:20 ratio. The plot shown in figure 10 can be used in estimatingthe effective battery capacity of a wireless device that uses aTDMA scheme with fixed schedules.
5. CONCLUSIONIn this paper we have looked at various battery models that havebeen introduced so far. Though these models give us qualitativeinsights into how battery’s capacity is influenced by multiple
Table 3. Battery Utilization for Various Sensor Operation Modes
Figure 8. Power Output from CR2354 and DC/DCConverter (Chan3) during Sleep Mode
Figure 9. Current drawn from the battery during SleepMode and Tx Mode
Figure 10. Impact of Pulse Discharging on Battery
O p e r a t i n gM o d e
To t a lL i f e t i m e
C a p a c i t y c o n s u m e df r o m B a t t e r y
C a p a c i t y d e l i ve r e dt o S e n s o r
En e r g y c o n s u m e df r o m B a t t e r y
C a p a c i t y d e l i ve r e dt o S e n s o r
D C /D C c o n ve r t e re f f i c i e n c y
Tx .3 3 h r 8 .1 m A h 4 .1 m A h 7 0 .0 J 4 9 .1 J 7 0 %
R x .8 8 h r 1 5 .8 m A h 7 .9 m A h 1 3 5 .2 J 9 6 .1 J 7 1 %
Id l e 1 .2 h r 1 8 .0 m A h 9 .0 m A h 1 5 4 .0 J 1 0 9 .0 J 7 1 %
S l e e p 7 .0 h r s 5 9 .1 m A h 2 8 .8 m A h 5 0 5 .1 J 3 5 0 .7 J 6 9 %
0 4 8 12 16 20
Sleep Duration (in multple of 20 msec slot)
30
40
50
60
Bat
tery
Cap
acity
(mA
h)
Capacity w/ Pulse DischargeCapcity at Sleep

factors, they do not provide a simple way of finding out what thetrue battery capacity running in different operation modes. Oneapproach that we have taken in this paper is based on ameasurement approach, where we measure the capacity of thebattery under different load profile to determine what the realizedcapacity of the battery is. The result shows that there are manyfactors such as the discharge rate, the discharge profile (constantvs. pulsing), and the DC/DC converter that govern the effectivebattery capacity. Especially, the role of the DC/DC converter indetermining the battery capacity is a key factor that theconventional battery models don’taccount for. Since DC/DCconverter changes the load profile generated by the sensor boardbased on its own voltage regulator function, we argue that therealistic battery model should consider the impact of DC/DCconverter on the battery capacity. The result also suggests that ameaningful estimation of battery capacity can be achieved bymeasurements and not by just looking up what the manufacturerspecifies. Moreover, when studying a low power design, justconsidering the energy number may not be sufficient as the batterylifetime has a profound dependency on how the battery isdischarged. Our technique introduced in this paper provides areasonable way of estimating the effective battery capacity and themeans of justifying the low power design.
6. REFERENCES[1] T. F. Fuller, M. Doyle, J. Newman, “Simulation and
Optimization of the Dual Lithium Ion Insertion Cell,”Journal of Electrochem. Soc., vol. 141, no. 4, Apr. 1994, pp.1-10.
[2] Atmel AS90LS8535 product website,http://www.atmel.com/atmel/products/prod200.htmlastaccessed on 2/8/2001
[3] RFM Software Designer’s Guide:http://www.rfm.com/corp/apnotes.htmlast access on2/8/2001
[4] John Newman’s Website:http://www.cchem.berkeley.edu/~jsngrp/last accessed on2/8/2001.
[5] H.D. Linden, Handbook of Batteries, 2nd ed., McGrawHill,New York 1995.
[6] C. F. Chiasserini and R. R. Rao, "Pulsed battery discharge incommunication devices," Proceedings of Mobicom 99,Seattle, August 1999
[7] T. Simunic, L. Benini, G. De Micheli, “Energy-EfficientDesign of Battery-Powered Embedded Systems,”Proceedings of International Symposium on Low PowerElectronics and Design, pp 212-217, Piscataway, August1999
[8] D. Panigrahi, C. Chiasserini, S. Dey, R. Rao, A.Raghunathan, and K. Lahiri, “Battery Life Estimation ofMobile Embedded System”, 14th International Conference onVLSI Design, 2001
[9] Panasonic Lithium Coin Data Sheet:http://www.panasonic.com/industrial_oem/battery/battery_oem/chem/lith/lith.htm last accessed on 2/8/2001.
[10] National Instruments Corp., PCI-6110E/6111E User’sManual, April 1998 ed., Austin TX 1998
[11] National Instruments Corp., NI-DAQ User Manual for PCCompatibles, January 2000 ed., Austin TX 2000
[12] M. D. Bruce, “Step-up/Step-down converters power smallportable systems”, EDN, February 3 1994
[13] Maxim Integrated Products, Inc., DC-DC Converter Tutorial,http://dbserv.maxim-ic.com/tarticle/view_article.cfm?article_id=93last access on2/12/2001
[14] M. Kahn, R.H. Katzand, K.S.J Pister, “Mobile Networkingfor Smart Dust”, ACM|IEEE Int. Conf. on MobileComputing and Networking, Seattle, WA, Aug 1999
[15] M. Pedram, Q. Wu, “Battery-Powered Digital CMOSDesign”, Proceedings ofDesign, Automation and Test inEurope Conference and Exhibition, Munich, Germany,March 1999