Embed Size (px)
Citation preview

U.S. Department of the InteriorU.S. Geological Survey
Scientific Investigations Report 2009–5110
In cooperation with the Pennsylvania Department of Environmental Protection
Bathymetry and Sediment-Storage Capacity Change in Three Reservoirs on the Lower Susquehanna River, 1996–2008

Cover.
Photograph showing Conowingo Dam and Reservoir, south of Conowingo, Md. View is looking north. Photograph printed with permission of the Excelon Corporation.

Bathymetry and Sediment-Storage Capacity Change in Three Reservoirs on the Lower Susquehanna River, 1996–2008
By Michael J. Langland
In cooperation with the Pennsylvania Department of Environmental Protection
Scientific Investigations Report 2009–5110
U.S. Department of the InteriorU.S. Geological Survey
U.S. Department of the InteriorKEN SALAZAR, Secretary
U.S. Geological SurveySuzette M. Kimball, Acting Director
U.S. Geological Survey, Reston, Virginia: 2009
For product and ordering information: World Wide Web: http://www.usgs.gov/pubprod Telephone: 1-888-ASK-USGS
For more information on the USGS--the Federal source for science about the Earth, its natural and living resources, natural hazards, and the environment: World Wide Web: http://www.usgs.gov Telephone: 1-888-ASK-USGS
Any use of trade, product, or firm names is for descriptive purposes only and does not imply endorsement by the U.S. Government.
Although this report is in the public domain, permission must be secured from the individual copyright owners to reproduce any copyrighted materials contained within this report.
Suggested citation:Langland, M.J., 2009, Bathymetry and sediment-storage capacity change in three reservoirs on the Lower Susque-hanna River, 1996–2008: U.S. Geological Survey Scientific Investigations Report 2009-5110, 21 p.

iii
Contents
Abstract ...........................................................................................................................................................1Introduction.....................................................................................................................................................1
Purpose and Scope ..............................................................................................................................1Study Area..............................................................................................................................................3Previous Investigations........................................................................................................................3
Methods and Approach ................................................................................................................................3Office Preparation.................................................................................................................................3Data Collection ......................................................................................................................................4
Equipment......................................................................................................................................4Field Methods ...............................................................................................................................4
Data Analysis .........................................................................................................................................4Quality Assurance.................................................................................................................................5
Bathymetry and Sediment-Storage Capacity Change from 1996 to 2008 .............................................5Safe Harbor Dam and Lake Clarke .....................................................................................................8Holtwood Dam and Lake Aldred .......................................................................................................11Conowingo Dam and Conowingo Reservoir ...................................................................................14
Sediment-Storage Capacity Change in Conowingo Reservoir 1929–2008 .........................................18Summary........................................................................................................................................................19Acknowledgments .......................................................................................................................................20References Cited..........................................................................................................................................20

iv
Figures 1. Map showing location of the three reservoirs in the lower Susquehanna River
Basin ...............................................................................................................................................2 2–4. Graphs showing: 2. An example of a raw graph of the relation between depth and distance
collected and displayed in HYPACK™ in Conowingo reservoir transect number 17 ..............................................................................................................................6
3. A generalized example of an edited graph of the relation between depth and distance displayed in HYPACK™ in Conowingo reservoir transect number 17 .......6
4. Daily mean hydrograph for U.S. Geological Survey streamflow-gaging station 01578310, Conowingo Dam, Maryland, 1996–2008 .........................................................7
5–10. Maps showing: 5. Bathymetric survey transects surveyed in Lake Clarke, lower Susquehanna
River .......................................................................................................................................9 6. Bathymetry showing 10-foot depth ranges in Lake Clarke, lower Susquehanna
River .....................................................................................................................................10 7. Bathymetric survey transects surveyed in Lake Aldred, lower Susquehanna
River .....................................................................................................................................12 8. Bathymetry showing 10-foot depth ranges in Lake Aldred, lower Susquehanna
River .....................................................................................................................................13 9. Bathymetric survey transects surveyed in Conowingo Reservoir, lower
Susquehanna River ...........................................................................................................15 10. Bathymetry showing 10-foot depth ranges in Conowingo Reservoir, lower
Susquehanna River ...........................................................................................................16 11. Graph showing change in depth to bottom surface by transect in Conowingo
Reservoir, lower Susquehanna River, 1993 to 2008 ..............................................................17 12. Graph showing changes in vertical cross-sectional area for selected years and
remaining sediment-storage capacity in Conowingo Reservoir, lower Susquehanna River ..............................................................................................................................................18
Tables 1. Estimated water volume, net sediment change, and total sediment deposition in
Lake Clarke since 1931, computed using bathymetry data collected in 1996 and 2008 ................................................................................................................................................8
2. Estimated water volume, net sediment change, and total sediment deposition in Conowingo Reservoir since 1929, computed using bathymetry data collected in 1996 and 2008 ...............................................................................................................................14
3. Estimated changes in remaining capacity and sediment deposition from the Conowingo Dam to 11.5 miles upstream in Conowingo Reservoir, lower Susquehanna River, 1929–2008 ................................................................................................19

v
Conversion Factors, and Datums
Multiply By To obtain
Length
foot (ft) 0.3048 meter (m)
Area
acre 4,047 square meter (m2)acre 0.4047 square hectometer (hm2) acre 0.004047 square kilometer (km2)
Volume
acre-foot (acre-ft) 1,233 cubic meter (m3)acre-foot (acre-ft) 0.001233 cubic hectometer (hm3)
Flow rate
cubic foot per second (ft3/s) 0.02832 cubic meter per second (m3/s)
Mass
ton, short (2,000 lb) 0.9072 megagram (Mg)
Density
pound per cubic foot (lb/ft3) 16.02 kilogram per cubic meter (kg/m3)pound per cubic foot (lb/ft3) 0.01602 gram per cubic centimeter (g/cm3)
Vertical coordinate information is referenced to the North American Vertical Datum of 1988 (NAVD 88).
Horizontal coordinate information is referenced to the North American Datum of 1983 (NAD 83).

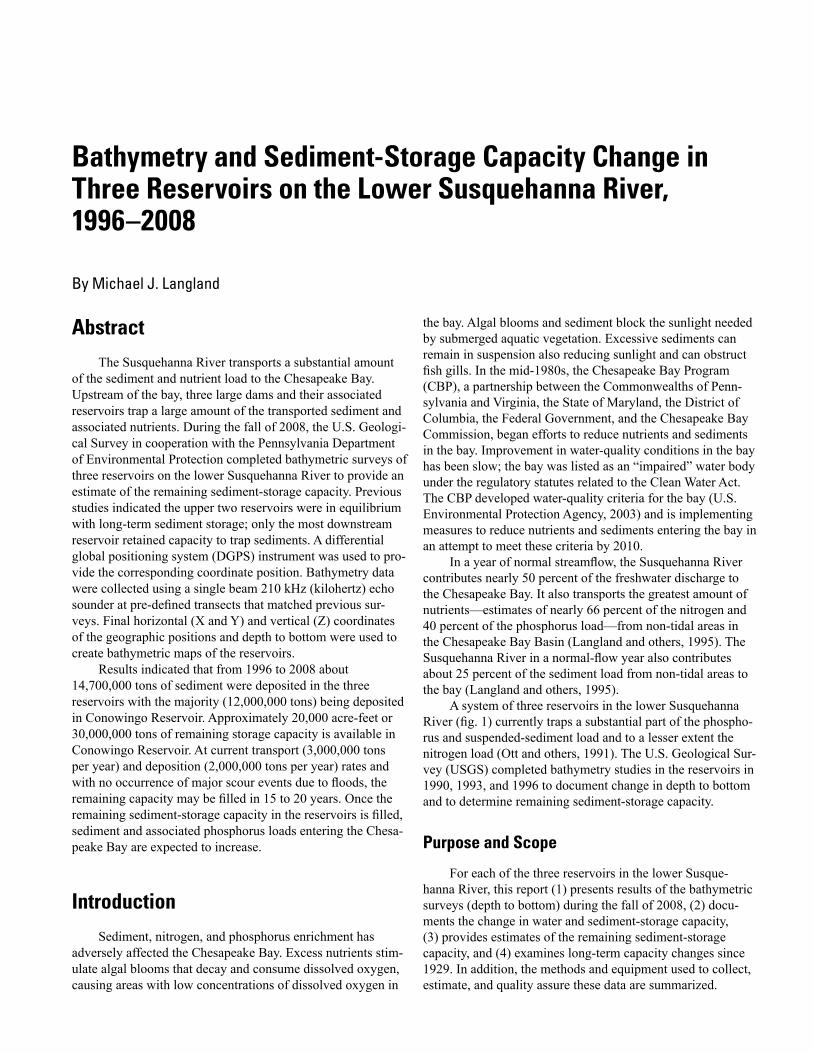
AbstractThe Susquehanna River transports a substantial amount
of the sediment and nutrient load to the Chesapeake Bay. Upstream of the bay, three large dams and their associated reservoirs trap a large amount of the transported sediment and associated nutrients. During the fall of 2008, the U.S. Geologi-cal Survey in cooperation with the Pennsylvania Department of Environmental Protection completed bathymetric surveys of three reservoirs on the lower Susquehanna River to provide an estimate of the remaining sediment-storage capacity. Previous studies indicated the upper two reservoirs were in equilibrium with long-term sediment storage; only the most downstream reservoir retained capacity to trap sediments. A differential global positioning system (DGPS) instrument was used to pro-vide the corresponding coordinate position. Bathymetry data were collected using a single beam 210 kHz (kilohertz) echo sounder at pre-defined transects that matched previous sur-veys. Final horizontal (X and Y) and vertical (Z) coordinates of the geographic positions and depth to bottom were used to create bathymetric maps of the reservoirs.
Results indicated that from 1996 to 2008 about 14,700,000 tons of sediment were deposited in the three reservoirs with the majority (12,000,000 tons) being deposited in Conowingo Reservoir. Approximately 20,000 acre-feet or 30,000,000 tons of remaining storage capacity is available in Conowingo Reservoir. At current transport (3,000,000 tons per year) and deposition (2,000,000 tons per year) rates and with no occurrence of major scour events due to floods, the remaining capacity may be filled in 15 to 20 years. Once the remaining sediment-storage capacity in the reservoirs is filled, sediment and associated phosphorus loads entering the Chesa-peake Bay are expected to increase.
IntroductionSediment, nitrogen, and phosphorus enrichment has
adversely affected the Chesapeake Bay. Excess nutrients stim-ulate algal blooms that decay and consume dissolved oxygen, causing areas with low concentrations of dissolved oxygen in
the bay. Algal blooms and sediment block the sunlight needed by submerged aquatic vegetation. Excessive sediments can remain in suspension also reducing sunlight and can obstruct fish gills. In the mid-1980s, the Chesapeake Bay Program (CBP), a partnership between the Commonwealths of Penn-sylvania and Virginia, the State of Maryland, the District of Columbia, the Federal Government, and the Chesapeake Bay Commission, began efforts to reduce nutrients and sediments in the bay. Improvement in water-quality conditions in the bay has been slow; the bay was listed as an “impaired” water body under the regulatory statutes related to the Clean Water Act. The CBP developed water-quality criteria for the bay (U.S. Environmental Protection Agency, 2003) and is implementing measures to reduce nutrients and sediments entering the bay in an attempt to meet these criteria by 2010.
In a year of normal streamflow, the Susquehanna River contributes nearly 50 percent of the freshwater discharge to the Chesapeake Bay. It also transports the greatest amount of nutrients—estimates of nearly 66 percent of the nitrogen and 40 percent of the phosphorus load—from non-tidal areas in the Chesapeake Bay Basin (Langland and others, 1995). The Susquehanna River in a normal-flow year also contributes about 25 percent of the sediment load from non-tidal areas to the bay (Langland and others, 1995).
A system of three reservoirs in the lower Susquehanna River (fig. 1) currently traps a substantial part of the phospho-rus and suspended-sediment load and to a lesser extent the nitrogen load (Ott and others, 1991). The U.S. Geological Sur-vey (USGS) completed bathymetry studies in the reservoirs in 1990, 1993, and 1996 to document change in depth to bottom and to determine remaining sediment-storage capacity.
Purpose and Scope
For each of the three reservoirs in the lower Susque-hanna River, this report (1) presents results of the bathymetric surveys (depth to bottom) during the fall of 2008, (2) docu-ments the change in water and sediment-storage capacity, (3) provides estimates of the remaining sediment-storage capacity, and (4) examines long-term capacity changes since 1929. In addition, the methods and equipment used to collect, estimate, and quality assure these data are summarized.
Bathymetry and Sediment-Storage Capacity Change in Three Reservoirs on the Lower Susquehanna River, 1996–2008
By Michael J. Langland

2 Bathymetry and Sediment-Storage Capacity Change in Three Reservoirs on the Lower Susquehanna River, 1996–2008
Figure 1. Location of the three reservoirs in the lower Susquehanna River Basin.
Marietta
Wrightsville
Columbia
Washington Boro
Turkey HillLong Level
Urey Duncan Island
Weise Island
Safe Harbor
Islands
Holtwood
Hennery Island
Mt. Johnson Island
Peach BottomPeach BottomGenerating Station
Wildcat Tunnel
Troublesome ConowingoHills
PENNSYLVANIAMARYLAND
ConestogaRiver
Pequea Creek
Safe HarborDam
HoltwoodDam
Muddy RunHydroelectric Dam
MichaelRun
BroadCreek
ConowingoCreek
ConowingoDam
CONOWINGO RESERVO
IR
LAKE C
LARKE
LAK
E ALDRE D
76°30' 76°15'
39°45'
40°08'
0 5 10 MILES
0 5 10 KILOMETERS
PENNSYLVANIA
MARYLAND
Studyarea
Susquehanna River Basin

Methods and Approach 3
Study Area
The Susquehanna River Basin extends from south-central New York State near Cooperstown, N.Y., through central and southern Pennsylvania and northeastern Maryland, draining 27, 510 mi2, and enters the Chesapeake Bay near Havre de Grace, Md. Forests cover about two-thirds of the basin and are concentrated in the northern and western parts of the basin. Agricultural land use makes up about one-quarter of the basin area. Most agricultural land is tilled and is predominantly located along the river valleys in southern New York/northern Pennsylvania and in southern Pennsylvania. Urban settings comprise about one-tenth of the basin, mostly in the southern part of the basin. Annual precipitation ranges from an average of about 34 in. in southern New York State to over 46 in. in areas of central Pennsylvania. The lower Susquehanna River Basin is defined as the area downstream from the confluence of the West Branch Susquehanna River near Sunbury, Pa., to the mouth of the river (Sprague and others, 2000).
Three hydroelectric dams are located in the lower part of the Susquehanna River Basin near its terminus with the Chesa-peake Bay. Two of the dams (Safe Harbor and Holtwood) are in south-central Pennsylvania, and the third dam, Conowingo, is in northern Maryland (fig. 1). The most upstream dam is Safe Harbor Dam. Constructed in 1931, it forms Lake Clarke and is located 32 mi upstream from Chesapeake Bay. Lake Clarke extends about 9.5 mi from Safe Harbor, Pa., to Colum-bia, Pa., and the reservoir width ranges from 800 to 6,600 ft. The design water-storage capacity of Lake Clarke was 150,000 acre-ft. The middle dam, Holtwood Dam, is about 25 mi upstream from Chesapeake Bay and forms Lake Aldred. Holtwood Dam was constructed in 1910 and is the oldest of the three dams. Lake Aldred extends upstream from the dam about 8 mi to just below Safe Harbor Dam. The impound-ment is relatively narrow along its entire reach (reservoir width ranges from 1,100 to 3,800 ft) and had an original water-storage capacity of 60,000 acre-ft. The largest and most-downstream impoundment, Conowingo Reservoir, was formed by the construction of Conowingo Dam in 1928. The dam is about 10 mi upstream from Chesapeake Bay and was originally designed to store 300,000 acre-ft of water. A more-detailed summary of dam and impoundment characteristics is provided by Hainly and others (1995).
Previous Investigations
Previous studies have documented changes in the bottom-surface profile in all three reservoirs since 1929. Surveys of Lake Clarke by Schuleen and Higgins (1953) reported an original water-storage capacity of 144,600 acre-ft in 1931, with the volume gradually decreasing to a remaining capacity of 78,800 acre-ft in 1950. Six subsequent surveys, completed in 1950, 1951, 1959, and 1964 for the Pennsylvania Power and Light Company (E.T. Schuleen, Pennsylvania Power and Light Company, written commun., 1965), 1990 (Hainly and others,
1995), and 1993 (Reed and Hoffman, 1997) indicated little change in water-storage capacity since 1950. This indicates that the reservoir had reached the sediment-storage capacity with incoming sediment loads. In 1996, a major ice jam in the upper section of Lake Clarke broke and released backed-up water. A subsequent survey concluded that this water com-bined with the already high river discharge to produce a major scour event that increased water-storage capacity in all three reservoirs (Langland and Hainly, 1997).
Siltation surveys in Lake Aldred in 1939, 1950, and 1961 were described by Ledvina (1962) and suggested the amount of sediment stored in the reservoir decreased over time. Subse-quent surveys by the USGS in 1990 (Hainly and others, 1995) and 1993 (Reed and Hoffman, 1997) indicated no appreciable changes since 1961. Reasons for the reduction in sediment storage prior to 1961 included coal dredging and construction of the upstream Safe Harbor Dam (Reed and Hoffman, 1997).
Whaley (1960) concluded that the water-storage capac-ity in Conowingo Reservoir was reduced from the original 300,000 acre-ft to about 235,000 acre-ft. Subsequent bottom-surface profiles in 1990 and 1993 indicated continuing reduc-tions in water-storage capacity to about 169,000 acre-ft in 1993 (Reed and Hoffman, 1997). As a result of a major scour event in January 1996, a survey completed in 1997 concluded that the remaining sediment-storage capacity in Conowingo Reservoir actually increased to 170,600 acre-ft (Langland and Hainly, 1997). For this current study, the value of 170,600 is rounded to 171,000 acre-ft.
Methods and ApproachTo accomplish this project, several primary tasks were
performed. These tasks included office preparation, data collection and analysis, and quality assurance. The follow-ing sections describe each of the tasks in more detail and the approach used in this study.
Office Preparation
Initially, the USGS contacted the hydroelectric dam util-ity owners to inform them of plans to resurvey the reservoirs. Geo-referenced aerial photographs of York and Lancaster Counties in south-central Pennsylvania showing the reservoirs and surrounding areas were acquired and geo-referenced for incorporation into navigation-support software HYPACK™. Aerial photographs were not acquired for northern Maryland; however, the reservoir boundaries were obtained from digi-tized maps. HYPACK™ is a navigation software package that integrates the reservoir-bottom depths with the Differential Geo-Positional Satellite (DGPS) positional data and displays the location of the boat on a geo-referenced aerial photo of the reservoir to aid in navigation. Using latitude and longitude coordinates from previous surveys, the pre-existing tran-sects were plotted within HYPACK™. These transects were

4 Bathymetry and Sediment-Storage Capacity Change in Three Reservoirs on the Lower Susquehanna River, 1996–2008
determined by complexities inherent in each reservoir such as geometry, alignment of the shore, and features such as islands and confluence points of tributaries. In general, the transect lines were perpendicular to the shore edge. Spacing between transects averaged 2,000 ft. The transect lines were used to guide the boat during the survey and improve overall boat nav-igation. Equipment used in the survey was assembled at the office and tested in the reservoirs to verify proper operation.
Data Collection
Various pieces of equipment were used to ensure accurate depth and geo-spatial locations of the surveys. A standard field method of data collection was established to maintain consis-tency in the bathymetric surveys among the three reservoirs.
Equipment
A brief list of the field equipment used in this study is presented below. Additional information can be found in Hittle and Ruby (2008).
• DGPS data-processing software.
• An 18-ft Boston Whaler accommodating a crew of two people with some protection from the elements.
• An echo sounder and transducer with an appropriate frequency for the depth of the reservoirs. This survey used a 210 kHz (kilohertz) ODOMTM transducer and a NavisoundTM 210 Reson echo sounder, a depth range from 0.6 to 600 m (Reson Inc., 2005), and thermal recording paper as backup.
• A TrimbleTM DGPS system and a differential correction service from Omni StarTM.
• A backup DGPS unit from RockwellTM.
• A laptop computer with the HYPACKTM software pack-age installed.
• A second monitor for the boat operator to view the pre-defined transects, boat location, and heading, allowing the boat operator to follow the transects and maintain safe operation of the boat.
• A laser range finder with a compass module enabling determination of azimuth and distance measurements from the boat to the shoreline.
Field Methods
The staff required to collect the bathymetry and geo-referenced position data consisted of two people: the boat operator and the equipment operator. The ODOM™ trans-ducer was mounted on the port (left) side of the boat with the
DGPS antenna mounted directly above the transducer. Each day before starting, an offset corresponding to the depth of the transducer in the water was measured and entered into the Navisound™. The laser range finder was used to make the shoreline measurements from as close to the transducer posi-tion as possible to correlate to the boat position.
Data collection in each reservoir followed the pre-defined transect lines created in HYPACK™ to ensure the data col-lected would closely correspond to the previously collected bathymetry data (Langland and Hainly, 1997). The procedure for each of the pre-defined transect lines included (1) the boat was held stationary at one end of the transect near the shore while the laser range finder measured the distance and azi-muth (bearing) reading to the shoreline, (2) the echo sounder (depth) and DGPS (position) were started and simultaneously recorded within HYPACK™, (3) the boat proceeded to the opposite end of the transect and was stopped near the shore where distance and bearing readings were again recorded, and (4) the recording was stopped and the boat proceeded to the next transect to repeat the process. If any gaps or problems in the data were identified after the transect was completed, the transect was rerun. The completed transects for each reservoir are presented on figures later in the report.
Data Analysis
The methods for the analysis of the bathymetry data and subsequent estimation of remaining sediment-storage capacity are documented in Langland and Hainly (1997). In summary, cross-sectional profile data were collected in the reservoirs on at least nine occasions from 1939 to 1996. The most recent surveys (1990, 1993, and 1996) and new profile data collected in 2008 were used to produce bathymetry (depth to bottom) contour maps, one for each reservoir, and provide a new esti-mate of remaining reservoir capacity to store sediment. The majority of the cross sections profiled in 1993 and 1996 were re-profiled in 2008 to document elevation change.
Water-level elevations fluctuate due to hydroelectric activity. One-half to one hour interval water-level elevations were obtained from each of the dam operators, adjusted to the normal lake level elevations, and prorated over the time of each transect. This insured that the bathymetry was referenced to the same pool elevation levels used in previous reports. Bottom-elevation contours in each reservoir were developed from the 2008 data by plotting the cross-sectional water-depth data and connecting lines of equal depth using Geographic Information System (GIS) software and manual interpreta-tion. The resultant bathymetry maps have a contour interval of 10 ft; therefore, sediment deposition and sediment scour less than 10 ft are not shown.
Changes in water and sediment-storage capacity and sediment mass were estimated in Lake Clarke, Lake Aldred, and Conowingo Reservoir by computing the change in water volume. Using the mid-point method, cross-sectional length multiplied by width between adjacent cross sections multiplied
Bathymetry and Sediment-Storage Capacity Change from 1996 to 2008 5
by the average depth equaled the volume. By using the same transects as in previous studies, the cross-sectional area was the same. Therefore, changes in average depth from the 1996 and 2008 surveys indicated the change in water volume. Using a normalized density of dry sediment of 67.8 lb/ft3, as sug-gested by Reed and Hoffman (1997), multiplied by the change in volume, a change in sediment mass for a cross section was estimated.
The estimated change in sediment mass based on bathymetry also was compared to the overall load entering and leaving the reservoirs to provide an overall estimate of “error” and some verification of the change in sediment mass in the reservoirs. The sediment loads entering and leaving the res-ervoirs were estimated from water-quality and discharge data from two streamflow-gaging stations, the Susquehanna River at Marietta (USGS 01577600) and the Conestoga River at Conestoga (USGS 01576757) using the USGS ESTIMATOR software program (Cohn and others, 1989) and comparing the estimated loads to the Susquehanna River at Conowingo Dam (USGS 01578310) for multiple time periods. This provided estimated changes in storage capacity, average riverine sedi-ment transport, reservoir trapping efficiency, and deposition rates.
Quality Assurance
Even though a complete analysis of the accuracy of the vertical (elevation) and horizontal (geographic position) data was beyond the scope of this study, every effort was made to minimize error. For example, the equipment and procedures used in the collection of the bathymetric data were based on methods used in other USGS bathymetric survey studies (Wilson and Richards, 2006; Hittle and Ruby, 2008). Sev-eral quality-assurance diagonal transects were created and surveyed so the depths collected at the same point from two different paths could be compared.
The Navisound™ 210 Reson echo sounder has an accuracy of 0.06 ft at 210 kHz (Reson Inc., 2005). A built-in bar-check utility allowed for depth verification using a correc-tion for the speed of sound. Following the advice of the U.S. Army Corps of Engineers (2002) to adequately calibrate a fathometer, a multi-depth bar check of the echo sounder was undertaken each day to ensure accurate depth soundings. The calibration involved lowering a 2 ft by 4 ft plate to a known depth of 6 ft below the transducer. If the calibration depth was sensed correctly, the speed-of-sound setting was verified. If the calibration depth was sensed incorrectly, the echo sounder was calibrated to the correct depth. In this study, the echo sounder always reported the correct depths for the bar check. The precision of the bar checks was affected by wave action on the reservoirs. The vertical accuracy of the echo sounder was conservatively estimated to be ± 0.5 ft. The echo sounder recorded the depth data in both analog and digital formats. A thermal paper recorder was used for backup to the digital data during office processing.
To ensure accurate coordinate-system data, two DGPS units were operated. One DGPS recorded and the other was used for quality-assurance purposes. Multiple daily field checks verified that the units were both within 5–10 ft horizon-tally. Because of hydroelectric power generation, the reservoir elevations could change substantially during the time when the data were collected. Using one-half hour or hourly interval water-level-elevation data collected from each hydroelectric facility, the bathymetry data were adjusted to the normal lake-level elevations unique for each reservoir. To help improve the accuracy of the distance and bearing measurements from the transducer location to the shoreline point, the equipment setup on the boat was configured so that the transducer was mounted on the port side with the DGPS antenna mounted directly above the transducer. The operator of the laser range finder would make the shoreline-edge measurements from this posi-tion and the boat operator on the starboard (right) side reduced the roll of the boat during surveys. In addition, the equipment operator took detailed notes (weather, current transect num-ber, starting and ending points, etc.) to aid in field and office processing of the data.
Raw bathymetry data were processed within HYPACK™ to filter (1) multiple-return acoustic signals in shallow water, (2) erroneous DGPS signals, and (3) redundant areas (back-tracking) caused by equipment limitations. Raw data were viewed (fig. 2) and edited (fig. 3). The edited X and Y (hori-zontal position coordinates) and Z (vertical depth coordinate) were exported into X, Y, Z data files. On the basis of the speed of the boat (4 mi per hour) and number of data points collected (10 per second), questionable data (spikes) were generally removed if the recorded depth of the spike was less than one-half of a second (approximately 5 ft of surface travel). The X, Y, Z data files were used for the analysis of remaining reservoir water and sediment-capacity change and various GIS applications.
Bathymetry and Sediment-Storage Capacity Change from 1996 to 2008
This section provides an estimate of change in sediment on the basis of the volume change from the 1996 and 2008 surveys, a discussion of long-term transport to reservoirs to help determine the rate of capacity loss (fill-in), and an estimate of time remaining until the reservoir system is at sediment-storage capacity.
The depth-to-bottom data collected from each reservoir were adjusted to the normal lake-level elevations established by the hydroelectric power utilities. GIS was used to filter data points and produce maps showing contoured 10-ft water depths. The water depths shown on the maps for the three reservoirs should not be used as a boating guide. The release of stored water can cause lake levels to change rapidly and sediment bars can form in unexpected locations because of changes in local currents from storm to storm. In addition, the

6 Bathymetry and Sediment-Storage Capacity Change in Three Reservoirs on the Lower Susquehanna River, 1996–2008
Figure 2. An example of a raw graph of the relation between depth (vertical axis) and distance (horizontal axis) collected and displayed in HYPACK™ in Conowingo Reservoir transect number 17.
Figure 3. A generalized example of an edited graph of the relation between depth (vertical axis) and distance (horizontal axis) displayed in HYPACK™ in Conowingo Reservoir transect number 17. Erroneous data shown as spikes in figure 2 were removed. Note that the depth scales differ between figures 2 and 3.
0
20
40
60
80
100
120Bathymetry Profile (raw depth)
DISTANCE FROM WESTERN BANK, IN FEET
DEPT
H, IN
FEE
T
1,0000 2,000 3,000 4,000 5,000 6,000 6,118
0
5
10
15
20
25
30
35
Bathymetry Profile (corrected depth)
DISTANCE FROM WESTERN BANK, IN FEET
DEPT
H, IN
FEE
T
1,0000 2,000 3,000 4,000 5,000 6,000 6,118

Bathymetry and Sediment-Storage Capacity Change from 1996 to 2008 7
reservoirs contain many partially or fully submerged obstacles such as bedrock ledges, rocks, trees, and stumps that were not within the transects, and were therefore not mapped.
A change in the depth to bottom elevation of a reservoir reflects a change in the volume of water and, therefore, the storage capacity of the reservoir. Changes in bottom surface indicate a change in the quantity of sediment caused by scour or deposition or represent movement in bottom sediments. Although major scour events increase the storage capac-ity in the short term, the mass of incoming sediments in the reservoirs fills that capacity relatively quickly, 2–4 years for most scour events (Langland and Hainly, 1997). The extreme case was Hurricane Agnes in 1972, when an estimated 20,000,000 tons of sediment was scoured from the reservoirs (Gross and others, 1978) and most likely took about a decade to fill back in (Reed and Hoffman, 1997). In this report, changes in bottom-surface elevations are discussed and com-pared in two ways: (1) cross-sectional data collected in 1996 and 2008 were used to estimate change in bottom elevation, water volume, storage capacity, and sediment mass within the
reservoirs, and (2) net sediment-mass change estimated from the cross-sectional data was compared to the sediment loads entering and leaving the reservoirs estimated from the moni-toring data.
A streamflow threshold of at least 390,000 ft3/s (Lang, 1982) is usually required to scour sediments in the reser-voirs. Color changes in the monitored sediments (from light brown to dark brown and black) provide an indication when streamflows begin to scour the darker anoxic bottom sedi-ments. Between the 1996 and 2008 surveys, three flood events occurred with streamflows capable of scouring sediments in the reservoirs (fig. 4). On September 19 and 20, 2004, the daily mean streamflows at Conowingo were 495,000 and 545,000 ft3/s, respectively. On April 4, 2005, the daily mean streamflow was 394,000 ft3/s, and on June 29, 2006, the daily mean streamflow was 403,000 ft3/s. The highest instantaneous streamflow (620,000 ft3/s) occurred on September 19, 2004. Using the nonlinear relation between streamflow and bed-sediment scour (Langland and Hainly, 1997), an estimated
Figure 4. Daily mean hydrograph for U.S. Geological Survey streamflow-gaging station 01578310, Conowingo Dam, Maryland, 1996–2008. The red line represents the estimated flow at which scour of bottom sediments occurs.
0
100,000
200,000
300,000
400,000
500,000
600,000
1997 1998 1999 2000 2001 2002 2003 2004 2005 2006 2007 2008
WATER YEAR
DAIL
Y M
EAN
FLO
W, I
N C
UBIC
FEE
T PE
R SE
CON
D
01573810 Conowingo Dam, Maryland
390,000 cubic feet per second

8 Bathymetry and Sediment-Storage Capacity Change in Three Reservoirs on the Lower Susquehanna River, 1996–2008
2,500,000 tons of sediment was scoured from the reservoirs between the 1996 and 2008 surveys.
Safe Harbor Dam and Lake Clarke
Depth to bottom data were collected from 19 cross sec-tions in Lake Clarke (fig. 5) and were adjusted to the normal lake elevation of 227.2 ft above sea level. The deepest areas of the lake are closest to the dam and range from 30 to 50 ft (fig. 6). The old Susquehanna and Tidewater Canal forms one of the deeper areas in the reservoir close to the west bank, run-ning from just upstream of the dam to Fishing Creek (transect number 16). The upper half of the lake is generally shallow; average lake depths are about 10–15 ft on the west side, with many islands and sand and coal bars on the east side near Washington Boro. When the lake level is low, much of the area around Washington Boro is too shallow for boating.
Schuleen and Higgins (1953) reported Lake Clarke has been in long-term equilibrium with sediment storage (they called it “sediment saturation”) except for an area from the dam to a distance upstream of approximately 7,000 ft by 1950. Subsequent surveys in 1951, 1959, and 1964 revealed this area was filled, and the total amount of deposited sediment
remained constant (E. Schuleen, Pennsylvania Power and Light Company, written commun., 1965). Short-term changes have occurred since 1965 because of scour events. The scoured sediment was quickly replaced, returning the reservoir to equilibrium. Because of the lack of high scour-producing streamflows, net changes in bottom-elevation data from the 1996 to 2008 survey were minimal (table 1). An estimated net change of 1,700,000 tons of sediment was deposited in Lake Clarke between 1996 and 2008. The 1996 study estimated 2,300,000 tons of sediment were scoured and removed from Lake Clarke, so a net deposition was expected. The area of greatest amount of scour from the 1996 survey (cross-sections 24–29) was largely filled. Total deposition of sediment in Lake Clarke was estimated at 92,400,000 tons in 2008, and the 1990 and 1993 studies estimated 90,700,000 tons. The difference (1,700,000 tons or 1.8 percent) was within the error introduced by rounding and averaging cross-sectional areas and depths, further indicating sediment transport in Lake Clarke has been in long-term equilibrium. The total amount of sediment upstream from cross-section 18 is estimated at 18,700,000 tons, and the total amount of sediment from cross-section 18 to the dam is estimated at 73,700,000 tons (table 1).
Table 1. Estimated water volume, net sediment change, and total sediment deposition in Lake Clarke since 1931, computed using bathymetry data collected in 1996 and 2008. Cross-section locations are shown in figure 5.
Lake Clarke
Cross-section number (2008)
Distance upstream from dam
(feet)
Water volume (acre feet) Sediment (tons)
1996 Volume
2008 Volume
Volume change
Deposition (+) or scour (-)
Total deposition since 1920
29 685 5,407 4,929 478 692,258 7,132,00028 2,330 3,989 3,830 160 230,912 5,542,00027 3,510 3,960 3,691 269 389,693 5,341,00026 5,360 4,062 4,044 18 25,778 5,852,00025 7,400 4,349 4,317 33 47,319 6,246,00024 10,000 5,067 5,026 41 59,128 7,273,00023 12,860 4,528 4,545 -17 -24,914 6,577,00022 15,000 4,435 4,456 -21 -29,849 6,447,00021 17,540 4,956 4,935 21 30,645 7,140,00020 19,780 4,372 4,392 -20 -28,372 6,355,00019 21,930 4,030 3,991 39 56,073 5,776,00018 24,000 2,740 2,713 28 40,054 3,925,000
4-17 to 47,520 12,801 12,660 141 203,547 18,723,000Total 64,698 63,529 1,170 1,692,300 92,400,000

Bathymetry and Sediment-Storage Capacity Change from 1996 to 2008 9
Figure 5. Bathymetric survey transects surveyed in Lake Clarke, lower Susquehanna River.
xc-13
xc-1
xc-14
xc-16xc-15
xc-9
xc-2
xc-4
xc-6
xc-7
xc-3
xc-17
xc-8
xc-10
xc-11
xc-12
xc-28 xc-29
xc-27
xc-18
xc-26
xc-19
xc-20xc-21
xc-22
xc-24
xc-25
xc-23
CROSS SECTION AND NUMBER
Surveyed in 1996xc-10Surveyed in 1996 and 2008xc-20
Lancaster County
SafeHarbor
Dam0 21 MILES
0 21 KILOMETERS
76°24'76°27'76°30'
40°
39°57'
39°54'
State and County Boundaries: USGS 1:100,000-scale data,Universal Transverse Mercator Projection, Zone 18, NAD 1983
Hydrography data: USGS, 1:24,000-scale National Hydrography Dataset
EXPLANATION
COUNTY BOUNDARY
York County

10 Bathymetry and Sediment-Storage Capacity Change in Three Reservoirs on the Lower Susquehanna River, 1996–2008
Figure 6. Bathymetry showing 10-foot depth ranges in Lake Clarke, lower Susquehanna River.
York County
Lancaster County
SafeHarbor
Dam0 21 MILES
0 21 KILOMETERS
76°24'76°27'76°30'
40°
39°57'
39°54'
State and County Boundaries: USGS 1:100,000-scale data,Universal Transverse Mercator Projection, Zone 18, NAD 1983
Hydrography data: USGS, 1:24,000-scale National Hydrography Dataset
EXPLANATIONDEPTH, IN FEET
0 to less than 10
10 to less than 20
20 to less than 30
30 to less than 40
40 to less than 50
50 or greater
COUNTY BOUNDARY

Bathymetry and Sediment-Storage Capacity Change from 1996 to 2008 11
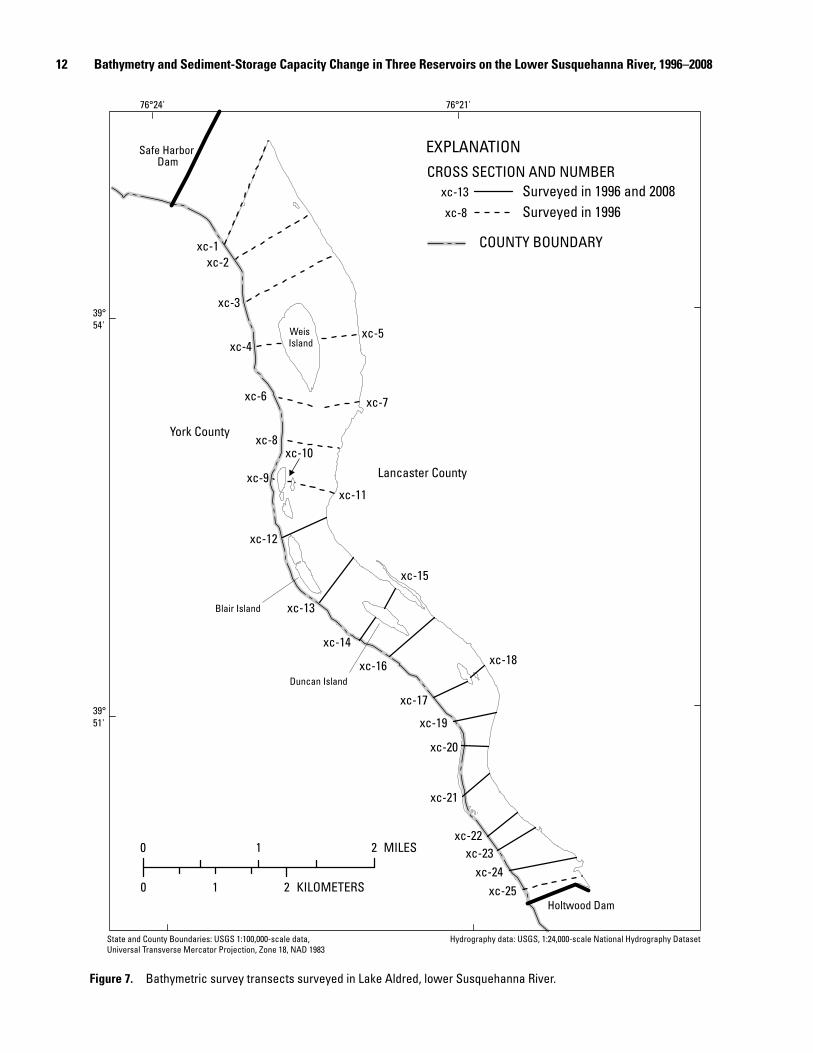
Holtwood Dam and Lake Aldred
Depth to bottom data were collected in 2008 from 13 cross sections in Lake Aldred (fig. 7) and adjusted to the normal lake elevation of 169.75 ft above sea level. In general, depths are shallowest in the upper part of the lake near Weis Island where depths range from 10 to 30 ft (fig. 8). Depths increased with distance downstream through the narrow gorge and decreased again near Holtwood Dam. Unlike Safe Harbor Dam, Holtwood Dam contains no flood gates, thus sediment can accumulate near the dam rather than exit from the bottom near the flood gates. The deepest areas are in spoon-shaped depressions, which are called “the deeps,” that are located in the middle and lower parts of the lake (fig. 8). When Holt-wood Dam was built in 1910, a coffer dam exposed six of these “deeps.” Five transects (12, 19, 20, 21, and 22) reveal three of these deeps. The depth to the bottom of these “deeps” ranges from 80 to 130 ft. Although it is unknown how these deeps actually formed, they are all in the narrowest section of the reservoir, leading to the common conjecture that the deeps formed during the last glacial retreat 10,000 years ago when they were “drilled” into the bedrock by whirlpool-type action.
Previously, Reed and Hoffman (1997) estimated 13,600,000 tons of sediment are stored in Lake Aldred, con-siderably less than in the other two reservoirs. The amount of deposited sediment has remained consistent since 1961 (Ledvina, 1962), and subsequent surveys in 1990 and 1993 confirmed the lake is in equilibrium in terms of deposited sedi-ment. The 1996 survey indicated areas of scour and deposition but the overall change in deposited sediment in Lake Aldred was minimal (Langland and Hainly, 1997). The current study estimated the change in stored sediment since 1996 as approx-imately 1,000,000 tons. As previously mentioned, scour-producing flood events between the 1996 and 2008 studies were minimal, thus changes in water and sediment capacities also were minimal. With minimal change since 1996, sediment thickness remains less than 10 ft throughout most of the lake.
12 Bathymetry and Sediment-Storage Capacity Change in Three Reservoirs on the Lower Susquehanna River, 1996–2008
Figure 7. Bathymetric survey transects surveyed in Lake Aldred, lower Susquehanna River.
xc-1
xc-3
xc-2
xc-8
xc-24xc-25
xc-16
xc-13
xc-5
xc-7xc-6
xc-12
xc-23
xc-19
xc-11
xc-17
xc-21
xc-4
xc-14
xc-20
xc-15
xc-18
xc-9
xc-22
xc-10
Weis Island
Blair Island
Duncan Island
Holtwood Dam
Safe Harbor Dam
York County
Lancaster County
0 21 MILES
0 21 KILOMETERS
76°21'76°24'
39°54'
39°51'
EXPLANATION
COUNTY BOUNDARY
CROSS SECTION AND NUMBER
xc-8 Surveyed in 1996xc-13 Surveyed in 1996 and 2008
State and County Boundaries: USGS 1:100,000-scale data,Universal Transverse Mercator Projection, Zone 18, NAD 1983
Hydrography data: USGS, 1:24,000-scale National Hydrography Dataset

Bathymetry and Sediment-Storage Capacity Change from 1996 to 2008 13
Figure 8. Bathymetry showing 10-foot depth ranges in Lake Aldred, lower Susquehanna River.
Holtwood Dam
Safe Harbor Dam
York County
Lancaster County
0 21 MILES
0 21 KILOMETERS
76°21'76°24'
39°54'
39°51'
COUNTY BOUNDARY
EXPLANATIONDEPTH, IN FEET
0 to less than 10
10 to less than 20
20 to less than 30
30 to less than 40
40 to less than 50
50 to less than 60
60 to less than 70
70 to less than 80
80 to less than 90
90 to less than 100
100 or greater
Weis Island
Blair Island
Duncan Island
State and County Boundaries: USGS 1:100,000-scale data,Universal Transverse Mercator Projection, Zone 18, NAD 1983
Hydrography data: USGS, 1:24,000-scale National Hydrography Dataset

14 Bathymetry and Sediment-Storage Capacity Change in Three Reservoirs on the Lower Susquehanna River, 1996–2008
Conowingo Dam and Conowingo Reservoir
Depth to bottom data were collected in 2008 from 26 cross sections in the Conowingo Reservoir (fig. 9) and adjusted to the normal lake elevation of 108.5 ft above sea level. This bathymetry study confirmed the deepest areas of the reservoir are still near the dam (fig. 10). Along the spillway gates, which are located along the dam from the east bank to about two-thirds of the way across the river, depths averaged about 50 ft. Reservoir depths averaged about 60 ft near the tur-bine gates, which are located along the remaining third of the dam. The spillway and turbine gates are well below the normal water surface. The average depths were considerably less than in 1996 and are discussed later in this section. Additional deeper areas were across from the Peach Bottom Power Plant, an area just south of the Pennsylvania-Maryland state line and below the confluence with Broad Creek. These deeper areas probably resulted from natural hydraulic scouring caused by the stream reservoir shape. The shallowest areas were in the
upper one-third of the reservoir where depths averaged about 15 ft (fig. 10).
The reservoir was divided into three subareas to estimate changes in cross-sectional volumes—the lower part (cross-sections 17 to 26), the middle part (cross-sections 6 to 16), and the upper part (cross-sections 1 to 5) (fig. 9, table 2). Cross-sections 1 to 5 are not presented in table 2 because they were not surveyed in 1996; however, they are discussed later in this section. Results from the survey indicated approximately 12,000,000 tons of sediment were deposited in Conowingo Reservoir between 1996 and 2008 (table 2). All the net deposi-tion occurred in the lower part of the reservoir. Total sedi-ment deposition in the lower part of the reservoir increased by 13,800,000 tons (table 2) to about 103,000,000 tons from 1996 to 2008. Sediment depths increased in every transect in the lower part of the reservoir (fig. 11); the majority increased by 8–10 ft. The largest change in water volume (1,983 acre-ft) was at cross-section 26, nearest the dam (table 2).
Table 2. Estimated water volume, net sediment change, and total sediment deposition in Conowingo Reservoir since 1929, computed using bathymetry data collected in 1996 and 2008.
Conowingo
Cross-section number (2008)
Distance upstream from dam
Water volume (acre-feet) Sediment (tons)
1996 Volume 2008 VolumeVolume change
Deposition (+) or scour (-)
Total deposition since 1929
26 1,700 15,205 13,222 1,983 2,680,30025 3,150 10,437 10,052 385 586,90024 5,530 11,278 9,807 1,471 2,130,12023 7,950 7,171 5,976 1,195 1,781,48022 9,880 6,761 5,201 1,560 2,186,23021 12,275 5,901 4,650 1,251 1,857,46020 14,050 5,863 5,183 679 776,43019 16,650 7,736 6,947 789 914,47018 19,300 6,724 6,086 638 839,35017 21,700 7,742 7,706 36 52,400
Subtotal 13,800,000 103,000,00016 24,400 6,723 6,254 469 452,78015 26,850 6,306 6,159 147 212,36014 29,450 6,710 6,812 -102 -147,59013 33,150 6,509 6,851 -343 -496,05012 35,800 7,616 8,178 -562 -740,10011 37,500 4,876 4,708 168 243,48010 39,990 3,195 3,375 -180 -260,4609 42,150 4,797 5,117 -320 -463,0608 44,250 4,927 5,389 -462 -557,8307 47,010 6,472 6,877 -405 -585,7606 49,800 6,422 6,097 325 470,860
Subtotal -1,800,000 59,500,000Total 149,371 140,417 8,954 112,000,000 2162,500,000
1 Numbers may not sum to total due to rounding2 Does not include the total sediment deposited in the upper section (numbers 1 to 5) estimated to be 11,000,000 tons.

Bathymetry and Sediment-Storage Capacity Change from 1996 to 2008 15
Figure 9. Bathymetric survey transects surveyed in Conowingo Reservoir, lower Susquehanna River.
xc-6xc-8
xc-2
xc-5
xc-9
xc-7xc-4
xc-3
xc-10xc-11
xc-17
xc-12
xc-1
xc-16
xc-18
xc-19
xc-15
xc-26
xc-14
xc-13
xc-25xc-24
xc-20
xc-23
xc-22
xc-21
39°39'
39°42'
39°45'
39°48'
76°18' 76°15' 76°12'
PENNSYLVANIAMARYLAND
York County
Lancaster County
Harford County
Cecil County
ConowingoDam
Mt. Johnson Island
Peach BottomPower Plant
0 21 MILES
0 21 KILOMETERS
Michael Run
Broad Creek
State and County Boundaries: USGS 1:100,000-scale data,Universal Transverse Mercator Projection: Zone 18, NAD 1983
Hydrography data: USGS, 1:24,000-scale National Hydrography Dataset
EXPLANATIONCROSS SECTION AND NUMBER
SUBAREA BOUNDARY
Surveyed in 1996 and 2008xc-1
COUNTY BOUNDARY
STATE BOUNDARY
U P P E R
MI D
DL
E
LO
WE
R
U P P E R
MI D
DL
E
LO
WE
R

16 Bathymetry and Sediment-Storage Capacity Change in Three Reservoirs on the Lower Susquehanna River, 1996–2008
Figure 10. Bathymetry showing 10-foot depth ranges in Conowingo Reservoir, lower Susquehanna River.
EXPLANATION
!
DEPTH, IN FEET
0 to less than 10
10 to less than 20
20 to less than 30
30 to less than 40
40 to less than 50
50 to less than 60
60 or greater
39°39'
39°42'
39°45'
39°48'
76°18' 76°15' 76°12'
PENNSYLVANIAMARYLAND
York County
Lancaster County
Harford County
Cecil County
Mt. Johnson Island
Peach BottomPower Plant
0 21 MILES
0 21 KILOMETERS
Michael Run
Broad Creek
State and County Boundaries: USGS 1:100,000-scale data,Universal Transverse Mercator Projection: Zone 18, NAD 1983
Hydrography data: USGS, 1:24,000-scale National Hydrography Dataset
COUNTY BOUNDARY
STATE BOUNDARY
ConowingoDam

Bathymetry and Sediment-Storage Capacity Change from 1996 to 2008 17
Previously, Hainly and others (1995) estimated the area affected by turbulence to be within 1.25 mi upstream of the dam (transect number 24). This turbulent area is due to bottom-release mechanisms that allow water to enter the turbines about 98 ft below the normal lake-surface elevation of 108.5 ft. Turbulence from these mechanisms caused sedi-ment deposition to be less near the turbine gates and greater with increased distance away from the gates. In addition, flood gates are positioned about 40 ft below the normal lake surface, resulting in turbulence from the flood gates affecting sediment deposition in the same manner as the turbine gates, although the effect on sediment deposition is less (fig. 9).
From 1996 to 2008, the middle part of the reservoir, cross-sections 6 to 16, indicated a net sediment decrease of about 1,800,000 tons (table 2) to about 59,500,000 tons. Reed and Hoffman (1997) reported the area between cross-sections 6 and 16 had been “near” sediment-storage capacity since about 1959 and some minor capacity changes (about 5 percent of total volume) may have occurred within cross-sections 6 and 16, probably as a result of small scour events. As previously mentioned, scouring events were minimal from 1996 to 2008, with several streamflows at or just exceeding the scour threshold. It is possible these “less than 1 day” scour threshold streamflows did not have enough energy to scour and keep sediment in suspension long enough for it to be removed from the reservoir, but only transported sediment downgradient in the reservoir.
Although not surveyed in 1996, the upper part of the reservoir was surveyed in 2008. Total sediment deposition in
the upper part of the reservoir was estimated in 1993 to be 11,000,000 tons. At that time, this area contained less than 15 percent of the total sediment in the reservoir. The sediment thickness was minimal, consisting of mostly sand. Since 1959, nearly all the sediment deposition has been below Michael Run (cross-section 14, fig. 9). In 2008, change in sediment deposition in the upper area of the reservoir (cross-sections 1 to 5) was less than 1 percent, confirming conclusions of previ-ous studies that this area was in equilibrium with respect to sediment-storage capacity.
The predicted change in sediment deposition in the reservoir system using bathymetry data was compared to the difference in monitored sediment load estimates entering and leaving the reservoirs. From 1997 to 2007, the USGS esti-mated 31,800,000 tons of sediment entered the reservoirs and 15,100,000 tons of sediment exited the system (Blomquist and others, written commun., 2008). This includes an estimated 2,500,000 tons of scoured sediments. Estimates were made of reservoir sediment transport on the basis of 2008 streamflow and long-term sediment-transport rates. For 2008, an addi-tional 2,100,000 tons was estimated to have entered the reser-voirs and 1,400,000 tons exited (Blomquist and others, U.S. Geological Survey, written commun., 2008). The difference of 16,900,000 tons from 1997 to 2008 was considered the total deposition in the reservoirs. This compares reasonably well to 14,700,000 tons estimated to have deposited in the reservoirs using bathymetry mapping and volume calculations.
Figure 11. Change in depth to bottom surface by transect in Conowingo Reservoir, lower Susquehanna River, 1993 to 2008. Transect location shown on figure 9.
26 24 22 20 18 16 14 12 10 8 6
0
10
20
30
40
50
60
TRANSECT NUMBER
DEPT
H, IN
FEE
T
200819961993
YEAR OF SURVEY

18 Bathymetry and Sediment-Storage Capacity Change in Three Reservoirs on the Lower Susquehanna River, 1996–2008
Sediment-Storage Capacity Change in Conowingo Reservoir 1929–2008
Conowingo Reservoir extends about 15.2 mi from the dam upstream to near the base of the Holtwood Dam. From Hennery Island (about 11.5 mi upstream from the Conowingo Dam and above transect 1), accumulation of sediment was minimal because of the high water velocities released from the Holtwood hydroelectric plant, the effects of a pump-storage generation station between Holtwood Dam and Hennery Island, and the natural narrow reservoir channel. Therefore, the change in capacity was computed from Hennery Island downstream to the Conowingo Dam. The storage capacity between Hennery Island and Holtwood Dam was estimated at 20,000 acre-ft.
Changes in cross-sectional area since 1929 and resultant changes in storage capacity are shown for the years 1959, 1990, 1993, 1996, and 2008 (fig. 12 and table 3). Each suc-cessive bathymetric survey indicated a decrease in reservoir capacity. The exception was 1996 when reservoir capacity increased due to scour from an ice-jam flood event. Reed and Hoffman (1997) computed a “sediment-storage capacity line”
using hydrologic conveyances. The difference between the lines for the dated surveys and the sediment-storage capac-ity represents the remaining storage capacity in the reservoir (fig. 12).
In 1929, the original storage capacity from Hennery Island to Conowingo Dam was approximately 280,000 acre-ft (table 3). By 1959, the capacity was reduced to 215,000 acre-ft (Whaley, 1960), an average decrease of about 2,170 acre-ft per year. By 1993, the remaining storage capacity was further reduced by 46,000 acre-ft to 169,000 acre-ft, an average decrease of about 1,800 acre-ft per year, which included the 20,000,000 and 2,400,000 tons of sediment scoured in 1972 and 1975, respectively (Gross and others, 1978). From 1996 to 2008, storage capacity in the Conowingo Reservoir was fur-ther reduced by approximately 9,000 acre-ft to 162,000 acre-ft, which equates to an additional 12,000,000 tons of sediment deposited based on volume change (table 3).
Current reservoir capacity from the dam to Hennery Island is 162,000 acre-ft–indicating a sediment deposition volume of about 118,000 acre-ft. This sediment volume is equivalent to approximately 174,000,000 tons of depos-ited sediment (table 3). About 20,000 acre-ft or 30,000,000 tons of sediment can be deposited before reaching the
Figure 12. Changes in vertical cross-sectional area for selected years and remaining sediment-storage capacity in Conowingo Reservoir, lower Susquehanna River.
0 5 10 15 20 25 30 35 40 45 50 55 60
DISTANCE UPSTREAM FROM DAM, IN FEET x 10,000
50
100
150
200
250
300
350
400
VERT
ICAL
CRO
SS-S
ECTI
ONAL
ARE
A, IN
CU
BIC
FEE
T x
100,
000
192919591990199319962008Sediment-storage capacity
YEAR OF SURVEY

Summary 19
sediment-storage capacity (table 3). This is a reduction of 9,000 acre-ft (12,000,000 tons of sediment) and about 30 percent of the remaining capacity since the 1996 survey. Once the sediment-storage capacity is reached, sediments will no longer be effectively trapped and loads transported out of the reservoir will approach the loads transported into the reser-voir. However, the reservoirs will not be constantly filled to capacity with sediments because of short-term changes from storms that cause scour and a subsequent reduction in exported sediments until the scoured amount is refilled. Therefore, the amount of sediment transported out of the reservoirs will not always be in equilibrium with the amount of sediment trans-ported into the reservoirs.
Estimating the time remaining until Conowingo Reser-voir reaches the sediment-storage capacity is difficult because of possible changes in sediment-deposition rates, changes in the amount of sediment transported into the reservoir, and the effects of large scour events. Annual deposition rates in the Conowingo Reservoir vary depending on the length of time and period examined (table 3). Data from 1929 to 1958 indi-cated the highest deposition rates at 3,100,000 tons per year and data from 1959 to 1993 indicated deposition decreased to about 2,500,000 tons annually. This decrease was most likely related to forest regrowth and more recent implementation of sediment-erosion and runoff-control practices and may also indicate a decreasing trend in reservoir trap efficiency. More recently, Ott and others (1991) reported an estimated 1,800,000 tons of sediment deposited per year from 1985 to 1989 in the Conowingo Reservoir. During this time, no scour events occurred and 2 of the 5 years had an annual mean streamflow well below normal. From 1996 to 2008, the current study estimated 1,500,000 tons of annual sediment deposi-tion. Similar to the Ott and others (1991) sediment-deposition estimate, minimal scouring events occurred during the interval studied, and streamflow was well below normal in 3 of 4 con-secutive years (1999–2002).
Studies from 1959 to 2008 give an average reservoir sediment-deposition rate of 2,000,000 tons per year. Using this rate, a reservoir trapping efficiency of 55 percent (Langland
and others, 1997), and assuming there will be no scour from large storms, the Conowingo Reservoir could reach the remaining sediment-storage capacity of 20,000 acre-ft (approximately 30,000,000 tons of sediment) in about 15–20 years. However, additional time could be added if the rate at which sediment is transported into the reservoir is reduced. For example, if sediment-transport rates are reduced 20 percent, an additional 5 to 10 years would be needed to reach sediment-storage capacity. Additional time also could be added if the sediment trap efficiency is reduced. As the reservoir fills, cross-sectional areas will decrease, velocities will increase, and sediment trapping efficiency could decrease. It is expected that a reduction in trapping efficiency or loss of sediment storage will result in increased sediment and nutrient loads to the upper part of the Chesapeake Bay.
SummaryBathymetric surveys of Lake Clarke, Lake Aldred,
and Conowingo Reservoir in the lower Susquehanna River Basin were completed in the fall of 2008 in cooperation with the Pennsylvania Department of Environmental Protection. Bathymetry data were collected to provide an updated analysis of reservoir capacities and sediment deposition. Bathymetric data were collected using HYPACK™ software integrating a 210 kHz echo sounder, single beam transducer, and DGPS unit. Within HYPACK™, transects of the depth data were acquired along pre-defined intervals for each reservoir and displayed on a geo-referenced aerial photo. Post-processing of the raw data sets eliminated erroneous spikes verified from analog data recorded on thermal paper. Diagonal transects were used to quality assure depth readings.
Bathymetry data were collected at many of the same tran-sects previously surveyed in 1990, 1993, and 1996. A change in the depth to bottom elevations of a reservoir reflects a change in the volume of water and storage capacity of the res-ervoir. Changes in bottom surface usually indicated a change
Table 3. Estimated changes in remaining capacity and sediment deposition from the Conowingo Dam to 11.5 miles upstream in Conowingo Reservoir, lower Susquehanna River, 1929–2008.
YearReservoir capacity
(acre-feet)
Sediment deposition (acre-feet)
Sediment deposition
(tons)
1929 280,000 0 01959 215,000 65,000 96,000,0001990 175,000 105,000 155,000,0001993 169,000 111,000 164,000,0001996 171,000 109,000 162,000,0002008 162,000 118,000 174,000,000
Water and sediment-storage capacity 142,000 138,000 204,000,000

20 Bathymetry and Sediment-Storage Capacity Change in Three Reservoirs on the Lower Susquehanna River, 1996–2008
in the quantity of sediment caused by scour or deposition, or represented movement in bottom sediments. The streamflow threshold to scour sediments is estimated at 390,000 ft3/s. Between the 1996 and 2008 surveys, three flood events exceeded that streamflow and scoured an estimated 2,500,000 tons of sediment out of the reservoirs.
Depth to bottom data were collected from 19 cross sections in Lake Clarke. The deepest areas of the lake were closest to the dam and ranged from 30 to 50 ft. The upper half of the lake was generally shallow; average lake depths were about 10–15 ft on the west side, with many islands and sand and coal bars on the east side. Previous studies indicated Lake Clarke was in long-term equilibrium with sediment storage. An increase of 1,700,000 tons of sediment deposition was esti-mated in Lake Clarke between 1996 and 2008; total deposition in Lake Clarke was 92,400,000 tons of sediment. The 1996 study estimated 2,300,000 tons of sediment was scoured and removed from Lake Clarke, so a net deposition was expected. The areas of greatest scour in the 1996 survey (cross-sections 24–29) were largely filled.
Depth to bottom data were collected in 2008 from 13 cross sections in Lake Aldred. Generally, depths were shallow-est in the upper part of the lake and increased with distance downstream through the narrow gorge and decreased again near Holtwood Dam. The deepest areas were in spoon-shaped depressions called “the deeps” located in the middle and lower parts of the lake. The location of six deeps were known and depths were greater than 80 ft with one deep reaching a depth of about 130 ft, which extends below sea level. A total of 13,600,000 tons of sediment was estimated to be contained in Lake Aldred, considerably less than is contained in the other two reservoirs. The amount of deposited sediment has remained consistent since 1961; subsequent surveys in 1990, 1993, and 1996 confirmed the lake was at equilibrium with minor changes in deposited sediment. The 2008 study esti-mated the change in sediment deposition as approximately 1,000,000 tons, thus changes in water and sediment capacities were minimal.
Depth to bottom data were collected from 26 cross sec-tions in the Conowingo Reservoir. The deepest areas of the reservoir were near the dam along the spillway gates (50 ft) and near the turbine gates (60 ft). The depths were substan-tially less than in 1996. The shallowest areas were in the upper one-third of the reservoir where reservoir depths averaged about 15 ft. Results indicated approximately 12,000,000 tons of sediment were deposited in Conowingo Reservoir between 1996 and 2008; all the deposition was in the lower part of the reservoir. From 1996 to 2008, total sediment deposition in the lower part of the reservoir increased by 13,900,000 tons to about 103,000,000 tons. Depths decreased in every transect in the lower part of the reservoir by 8–10 ft. The middle part of the reservoir, cross-sections 6 to 16, indicated a net sediment decrease of about 1,800,000 tons from 1996 to 2008 to about 59,500,000 tons. This suggested some minor capacity changes (about 5 percent of total volume) were occurring within cross-sections 6 and 16. The upper part of reservoir contained
11,000,000 tons of sediment and remained unchanged from 1996 to 2008.
The change in sediment deposition in the reservoir system using bathymetry data was compared to the differ-ence in monitored sediment load estimates entering and leaving the reservoirs. The difference in monitored loads was about 16,900,000 tons and considered the total deposition in the reservoir system. This compared reasonably well to 14,700,000 tons deposited in the reservoirs estimated using bathymetry data and volume calculations.
In 1929, the original capacity from Hennery Island to Conowingo Dam was approximately 280,000 acre-ft. This was reduced to 215,000 acre-ft by 1959, and further reduced to 169,000 acre-ft by 1993. Current reservoir capacity from the dam to Hennery Island is 162,000 acre-ft–indicat-ing a deposited sediment volume of about 118,000 acre-ft (174,000,000 tons). About 20,000 acre-ft or 30,000,000 tons of sediment remain to fill before reaching the sediment-storage capacity. At the current long-term rate of filling (2,000,000 tons per year) and with no occurrence of scour events, this capacity could be filled in 15–20 years.
Acknowledgments
The cooperation of Mr. Chris Porse and Mr. Ted Rainer (Holtwood and Safe Harbor Hydroelectric facilities, respectively), PPL Generation Co., and Donna Fabrizio at Conowingo Hydroelectric facility, Exelon Corporation is gratefully acknowledged. Additional thanks also to Brian Hat-tenbach, John Fulton, and Clinton Hittle of the USGS Pennsyl-vania Water Science Center for their assistance in the project.
References Cited
Cohn, T.A., DeLong, L.L., Gilroy, E.J., Hirsch, R.M., and Wells, R.M., 1989, Estimating constituent loads: Water Resources Research, v. 25, no. 5, p. 937–942.
Gross, M.G., Karweit, M., Cronin, W.B., and Shubuel, J.R., 1978, Suspended-sediment discharge of the Susquehanna River to northern Chesapeake Bay, 1966–1976: Estuaries, v. 1, p. 106–110.
Hainly, R.A., Reed, L.A., Flippo, H.N., and Barton, G.J., 1995, Deposition and simulation of sediment transport in the Lower Susquehanna River Reservoir System: U.S. Geological Survey Water-Resources Investigations Report 95-4122, 39 p.
Hittle, C.D., and Ruby, A.T., III, 2008, Bathymetric surveys of Lake Arthur and Raccoon Lake, Pennsylvania, June 2007: U.S. Geological Survey Data Series 357, 10 p.

References Cited 21
Lang, D.J., 1982, Water quality of the three major tributaries to the Chesapeake Bay, The Susquehanna, Potomac, and James Rivers, January 1979–April 1981: U.S. Geological Survey Water-Resources Investigations 82-32, 64 p.
Langland, M.J., and Hainly, R.A., 1997, Changes in bottom-surface elevations in three reservoirs in the lower Susque-hanna River, Pennsylvania and Maryland, following the January 1996 flood—Implications for nutrient and sediment loads to Chesapeake Bay: U.S. Geological Survey Water-Resources Investigations 97-4138, 34 p., 3 pls.
Langland, M.J., Lietman, P.L., and Hoffman, S.A., 1995, Syn-thesis of nutrient and sediment data for watersheds within the Chesapeake Bay drainage basin: U.S. Geological Sur-vey Water-Resources Investigations Report 95-4233, 121 p.
Ledvina, J.P., 1962, 1961 Holtwood river bed silt survey, Holtwood Dam to Shenk’s Ferry, September-November 1961: Holtwood, Pa., Holtwood Steam Electric Station and the Pennsylvania Power and Light Company, 80 p.
Schuleen, E.T., and Higgins, G.R., 1953, Analysis of sus-pended-sediment measurements for Lake Clarke, inflow and outflow, 1948–53: Pennsylvania Power and Light Co. Report no. 970, p. 1–40.
Ott, A.N., Takita, C.S., Edwards, R.E., and Bollinger, S.W., 1991, Loads and yields of nutrients and suspended sediment transported in the Susquehanna River Basin, 1985–89: Susquehanna River Basin Commission Report, Publication no. 136, 253 p.
Reed, L.A., and Hoffman, S.A., 1997, Sediment deposition in Lake Clarke, Lake Aldred, and Conowingo Reservoir, Pennsylvania and Maryland, 1910–93: U.S. Geological Survey Water-Resources Investigations Report 96-4048, 14 p., 3 pls.
Reson Inc., 2005, NaviSound 200/400 users guide: Navi-sound TM 100, 200 & 400 Series Operator’s Manual, Ver-sion 4.01, 177 p.
Schuleen, E.T., and Higgins, G.R., 1953, Analysis of sus-pended-sediment measurements for Lake Clarke, inflow and outflow, 1948–53: Pennsylvania Power and Light Co. Report no. 970, p. 1–40.
Sprague, L.A., Langland, M.J., Yochum, S.E., Edwards, R.E., Blomquist, J.D., Phillips, S.W., Shenk, G.W., and Preston, S.D., 2000, Factors affecting nutrient trends in major rivers of the Chesapeake Bay Watershed: U.S. Geological Sur-vey Water-Resources Investigations Report 00-4218, 98 p.
U.S. Army Corps of Engineers, 2002, Engineering and Design—Hydrographic Surveying Manual No. 1110-2-1003: Washington, D.C., 510 p.
U.S. Environmental Protection Agency, 2003, Ambient water quality criteria for dissolved oxygen, water clarity, and chlorophyll a for the Chesapeake Bay and its tidal tributar-ies: 903-R-03-002, 231 p.
Wilson, G.L., and Richards, J.M., 2006, Procedural documen-tation and accuracy assessment of bathymetric maps and area/capacity tables for small reservoirs: U.S. Geological Survey Scientific Investigations Report 2006-5208, 24 p.
Whaley, R.C., 1960, Physical and chemical limnology of Conowingo Reservoir: The Chesapeake Bay Institute, Johns Hopkins University, Technical Data Report 32, 140 p.


Langland—B
athymetry and Sedim
ent-Storage Capacity Change on the Lower Susquehanna River, 1996–2008—
Scientific Investigations Report 2009–5110